
Hijacking Sexual Immuno-Privilege in GBM—An Immuno-Evasion Strategy


1
Kenneth R. Peak Brain and Pituitary Tumor Treatment Center, Department of Neurosurgery, Houston Methodist Neurological Institute, Houston Methodist Hospital and Research Institute, Houston, TX 77030, USA
2
Department of Neurological Surgery, Weill Cornell Medical College, New York, NY 10065, USA
*
Author to whom correspondence should be addressed.
Int. J. Mol. Sci. 2021, 22(20), 10983; https://0-doi-org.brum.beds.ac.uk/10.3390/ijms222010983
Submission received: 20 August 2021
/
Revised: 28 September 2021
/
Accepted: 5 October 2021
/
Published: 12 October 2021
(This article belongs to the Special Issue Macrophages in the Glioblastoma Tumor Microenvironment)
Abstract
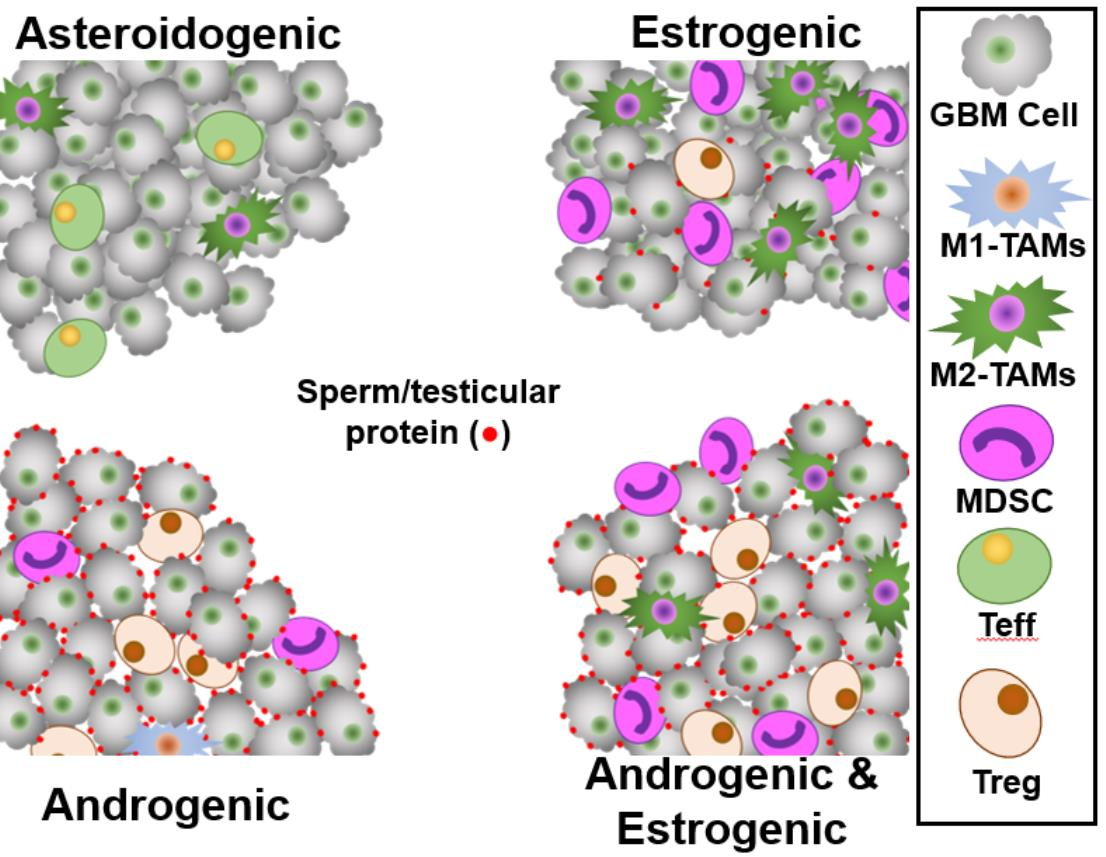
:Regulatory T-cells (Tregs) are immunosuppressive T-cells, which arrest immune responses to ‘Self’ tissues. Some immunosuppressive Tregs that recognize seminal epitopes suppress immune responses to the proteins in semen, in both men and women. We postulated that GBMs express reproductive-associated proteins to manipulate reproductive Tregs and to gain immune privilege. We analyzed four GBM transcriptome databases representing ≈900 tumors for hypoxia-responsive Tregs, steroidogenic pathways, and sperm/testicular and placenta-specific genes, stratifying tumors by expression. In silico analysis suggested that the presence of reproductive-associated Tregs in GBM tumors was associated with worse patient outcomes. These tumors have an androgenic signature, express male-specific antigens, and attract reproductive-associated Related Orphan Receptor C (RORC)-Treg immunosuppressive cells. GBM patient sera were interrogated for the presence of anti-sperm/testicular antibodies, along with age-matched controls, utilizing monkey testicle sections. GBM patient serum contained anti-sperm/testicular antibodies at levels > six-fold that of controls. Myeloid-derived suppressor cells (MDSCs) and tumor-associated macrophages (TAMs) are associated with estrogenic tumors which appear to mimic placental tissue. We demonstrate that RORC-Tregs drive poor patient outcome, and Treg infiltration correlates strongly with androgen levels. Androgens support GBM expression of sperm/testicular proteins allowing Tregs from the patient’s reproductive system to infiltrate the tumor. In contrast, estrogen appears responsible for MDSC/TAM immunosuppression.
Keywords:
GBM; HiF; Tregs; microglia; androgen; estrogen; sperm; testicular; myeloid-derived suppressor cells; tumor-associated macrophages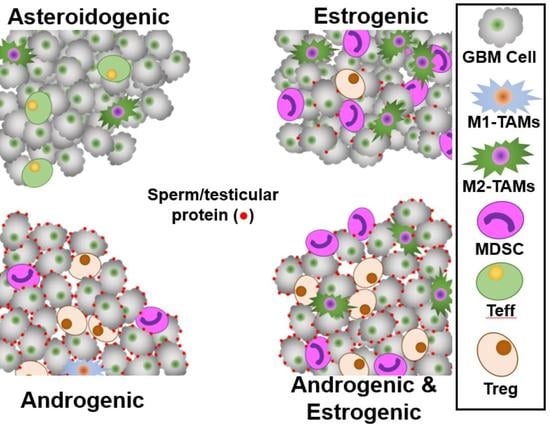
1. Introduction
Despite aggressive treatment, the median survival of GBM patients is only ≈15 months [1,2,3] and less than 5% survive ≥5 years postdiagnosis [1,4]. Swanson and colleagues’ computational tools estimate patient survival based on temporally distant T1-contrasted and T2-FLAIR images. They found long-term survivors of GBM (>36 months) tend to have slow-growing diffuse tumors with high T1-contrast and high FLAIR signal, whereas short-term survivors (<19 months) tend to have fast-growing focal tumors with little FLAIR signal [5,6]. Huang and colleagues recently demonstrated small hypoxic tumors display little FLAIR signal and correlate with poor outcome, confirming Swanson’s work [5,6,7]. The switch from aerobic to anaerobic respiration in cancers results from elevation of active hypoxia-inducible factor 1α (HiF) levels [8]. This activates transcription of hypoxia response genes, including Glut1 (SLC2A1) [9], Glut3 (SLC2A3) [10,11], VEGFA [12], VLDLR [13], and ADM [14]. Hypoxia, and the activation of HiF responsive genes in immune cells is well known to alter their function [15].
The response of the patient immune system to the GBM also affects patient outcome, with poor outcome being associated with tumor infiltration of myeloid-derived suppressor cells (MDSC) [16,17], tumor-associated macrophages (TAM) [18,19] and regulatory T-cells (Tregs) [20,21]. There may be a link between GBM tumor hypoxia and MDSCs and immunosuppressive macrophages. These are typically localized uterocervically, an area characterized by low glucose, low oxygen, low pH, and high lactate levels, much like a hypoxic tumor. Many of the components that induce uterocervical colonization by MDSCs/macrophages and their immunosuppressive phenotypes are also typically found in tumors, including GBM [22].
The levels of mRNA or protein markers of Treg infiltration into GBM tumors have been linked with poor outcome, including Forkhead Box P3 (FOXP3) [23], Cytotoxic T-Lymphocyte-Associated Protein 4 (CTLA4) [24,25], glucocorticoid-induced TNFR-related protein (GITR, (the TNFRSF18 gene product)) [20,26] and GATA-binding protein 3 (GATA3) [27].
Th17-derived Tregs express the Related Orphan Receptor C (RORC) [28], along with FOXP3, CTLA4, and GITR [29]. These RORC-Tregs generally colonize mucin-rich tissues including in the gastrointestinal tract (GI) and kidney [29,30,31,32]. Additionally, the adult male and female reproductive tracts are lined with membrane-bound mucins and coated with soluble mucins, with levels of MUC1, 4 and 5AC elevated by androgen and estrogen. In these reproductive tissues the mucosal layer is infiltrated with Tregs [33,34].
MUC16 is a membrane-bound protein which generates a soluble mucin following proteolytic action, with the solubilized fragment sometimes called carcinoma antigen-125 (CA-125). Uterocervical CA-125 is generated in situ from MUC16 expressed in the cervix/uterus/endometrium [35] and high levels are an indicator of endometrial receptivity and a predictor of pregnancy [36]. Uterocervical CA-125 levels can be directly augmented from a sexual partner as seminal plasma has high levels of CA-125 [37]. This mucin fragment drives epitope-specific Treg infiltration and activation in normal reproductive biology and cancer, with CA-125 also expressed by ovarian tumors, generating an immunosuppressive niche [38]. The physiological function of the uterocervical RORC-Treg population is to aid the granting of immuno-privilege to ‘non-Self’ male-specific, partner-specific and offspring-specific seminal and gestational antigens [39,40,41]. In males, mucin expression within the reproductive tract begins at puberty, corresponding with their period of RORC-Treg colonization [42,43,44].
Most environments frequented by RORC-Tregs are hypoxic, with hypoxia aiding Th17 T-cells class switching into RORC-Tregs [45]. In the GI tract, typical pO2 ranges from 15.5 mmHg (resting) to 5.5 mmHg (digesting) [46,47]. The testicular pO2 is generally near 10 mmHg [48], prostatic pO2 near 5 mmHg [49], and in the vaginocervical mucosa, the pO2 is typically 1 mmHg [50,51,52]. These tissues which host RORC-Tregs are classifiable as hypoxic, defined as <15 mmHg, and indeed more hypoxic than a typical GBM tumor, which generally have a pO2 near 13 mmHg [53,54].
GBM U87 cells synthesize several steroids from cholesterol, including progesterone, androstenedione and dihydrotestosterone (DHT) [55,56]. Some primary GBM cultures express high levels of CYP17A1, allowing for efficient cholesterol utilization in steroidogenesis [57,58]. In addition to the canonical pathway of steroidogenesis, GBM may also use the ‘backdoor’ route, utilizing aldoketo reductases AKR1C1&3 [59].
The generation of sex steroids by GBM and other cancers initiates expressional changes in both cancer and infiltrating immune cells. Estrogen drives the epithelial to mesenchymal transition in glioma cultures and could act in the same manner in vivo [60]. Androgen receptor is elevated in both men and women’s GBM tumors and blockage of androgen signaling with enzalutamide in vitro leads to a loss of ‘stemness’, causing a reduction in cancer stem cell markers CD133, Nanog and Oct4 [61].
MDSCs and Tregs are antipodally modulated by estrogen and androgen. The FOXP3 promoter region has an estrogen receptor α response element that controls expression [62,63], and estrogen suppresses Treg function and proliferation. In contrast, estrogen aids MDSC function, potentiated by progesterone [64]. Androgen elevates FOXP3 expression, acting through the androgen response element of the promoter [65,66]. Androgen also dampens the immunosuppressive functionality of MDSCs in vitro and in vivo [67].
We postulated that primary brain cancers, such as GBM, may initiate Treg infiltration by expressing sperm/testicular proteins, such as Glut14, which we have recently demonstrated in GBM primary cultures and in the GBM transcriptome database [68]. If a GBM were to present a sperm/testicular epitope to a reproductive RORC-Treg, then it would begin Treg infiltration and produce an immunosuppressive micro-environment.
Expression of sperm/testicular-specific proteins, some of which have been called cancer/testis antigens, has been observed in many cancer types, including GBM. Analysis of the immunopeptidome of GBM patient serum indicates tumor-derived testicular-, prostate-, placental- and fetal-specific antigens elicit an immune response in these patients regardless of gender [69]. Akiyama and co-workers identified several cancer/testicular antigens expressed by GBM tumors from cultured GBM cells [70], as did Freitas and colleagues [71]. Sreekanthreddy et al. identified pregnancy-specific glycoprotein 9 (PSG9) in GBM patient sera [72]. PSG9, like the other PSGs, activates TGFβ, which both lures and activates FOXP3+ Tregs [73], and also drives RORC-Th17+ cells from a proinflammatory to an immunotolerant form [74].
The sperm/testicular-specific gene ACRBP is expressed in GBM in different splice variants [75]. Li and co-workers examined both levels of ACRBP in glioma and the peripheral B-cell response to this protein in glioma patients. ACRBP mRNA transcripts were expressed in glioma and anti-ACRBP antibodies were found in patient sera [76].
The central question we are attempting to address is: what drives the accumulation and activation of immunosuppressive cells into GBM tumors?
We postulated GBMs evade immunosurveillance by two mechanisms. Firstly, they could engage in testicular mimicry, expressing sperm/testicular-specific and testicular-expressed proteins to both draw and activate reproductive Tregs pools keyed toward these sperm/testicular-specific epitopes. Men and women grant immuno-privilege to these epitopes via Tregs to counter immunological shock on the first encounter, and we briefly review this process in Appendix A. Secondly, the GBM tumors could emulate the environment of the placenta, expressing placental immunosuppressive-linked proteins, to provide a niche that attracts MDSCs and immunosuppressive macrophages. For instance, MUC1 is highly expressed in placenta [77], and expression is elevated by both estrogen [78] and progesterone [79]. Additionally, hypoxia elevates MUC1 expression [80], and MUC1 attracts and stimulates immunosuppressive MDSCs [81]. MUC1 is highly overexpressed in GBM and is negatively associated with overall survival [82].
Markers of hypoxia response, immune cell levels, immune responses, androgen and estrogen reporters. We have used a gene basket approach of tumor transcriptomes to examine the levels of cell types, status and for reporters of sex steroids. To stratify GBM into the proliferative, mesenchymal, and proneural subclasses, using the method of Teo et al. [83,84,85], we used the analysis performed by using the Gliovis platform [86].
Reportage of tumor HiF status was calculated from the averaged, normalized levels of hypoxia response genes: Glut1 (SLC2A1) [9], Glut3 (SLC2A3) [10,11], ADM [14], VLDLR [13], and VEGFA [12].
Reportage of tumor RORC-Treg infiltration was calculated from the averaged, normalized levels of FOXP3 [23], CTLA4 [24,87], GITR [20,26,88], RORC [29,45,89] and GATA3 [27,90,91].
Reportage of tumor infiltration by microglia [MG] was calculated from the averaged, normalized levels of ADORA3, IGSF6, TBXAS1, SASH3 and P2RY13. Inflammation status was calculated by dividing total MG by averaged, normalized levels of genes downregulated during inflammation, P2RY12, TMEM119 and GPR34. Polarization by NF-κB was calculated by dividing averaged, normalized levels of genes known to be upregulated: GCLC, NQO1, GCLM, NFKBIA and SLC39A8, with averaged, normalized levels of genes known to be downregulated: ZDHHC22, BCL7A and GNG4 [92].
Reportage of tumor infiltration by macrophages was calculated from the averaged, normalized levels of ITGAM and CD68. Polarization into M1 and M2 states was calculated by dividing total macrophage levels with ITGAX [M1] and with CD163 (M2) transcript levels.
2. Results
2.1. HiF and RORC-Treg Gene Cross Correlation, Tumor Microenvironment and Impacts GBM Patient Outcome
Validation of HiF and RORC-Treg Gene Markers
There is a high degree of cross correlation between each of the five genes chosen to report HiF status across the four GBM transcriptome databases utilized.
In Supplemental Figure S1A, we show the cross-correlation plots, correlation coefficients and p values (from t-tests) of the five genes used for HiF reportage, with data taken from the Agilent (left) and Gravendeel (right) databases, respectively.
In Supplemental Figure S1B, we show the cross-correlation plots, correlation coefficients and p values (from t-tests) of the five genes we selected for RORC-Treg reportage, with data taken from the Aglient (left) and Gravendeel (right) databases, respectively.
These data clearly indicate that in these two databases, the genes chosen for the HiF and for the RORC-Treg are clearly correlated. Similar statistically significant correlations are found in the CGGA and U133 databases.
As RORC-Tregs of reproductive origin are normally associated with sperm/testicular-specific proteins and found in mucin rich tissues, we examined the cross-correlation plots, correlation coefficients and p values (from t-tests) of representative RORC-Treg-markers CTLA4 and RORC with sperm/testicular-specific and mucin transcripts, Supplemental Figure S2.
In Supplemental Figure S2, we show that in GBM tumors, the expression of sperm/testicular-specific proteins, ACRBP, SPATA12, TSSK6, HSPB9, and CATSPER1 are highly cross-correlated with each other and with the representative RORC-Treg markers CTLA4 and RORC. A similar pattern emerges when examining the cross-correlations of CTLA4 and RORC with the mucin genes, MUC5B, MUC6, MUC13, MUC16 and MUC17, Supplemental Figure S2B.
Supplemental Figures S1 and S2, drawing on representative datasets Agilent and Gravendeel, show that RORC-Tregs can be present in GBM tumors, and that levels of RORC-Tregs are strongly and significantly correlated with sperm/testicular-specific proteins and mucins.
2.2. HiF and Tregs Impacts on Survival and Tumor Microenvironment
We examined the effect of RORC-Treg infiltration in hypoxic and normoxic tumors, by gating transcriptomes for previously described quintets of genes into high/low HiF and RORC-Treg. High/low cuts in each of the gene transcripts were made so as to obtain four roughly sized groups; Treg, Treg&HiF, HiF and neither. This was achieved by utilizing four databases: The Firehose Legacy Agilent microarray (201 patients), the CGGA database (180 patients) [99], the Gravendeel database (122 patients) [100] and the Firehose Legacy U133 platform (389 patients). This stratification methodology allows for assessment of both infiltrating Tregs (a property of the patient’s immune response) and tumor HiF status (derived from tumor metabolism and vascularization).
2.2.1. Survival and HiF/RORC-Treg Status
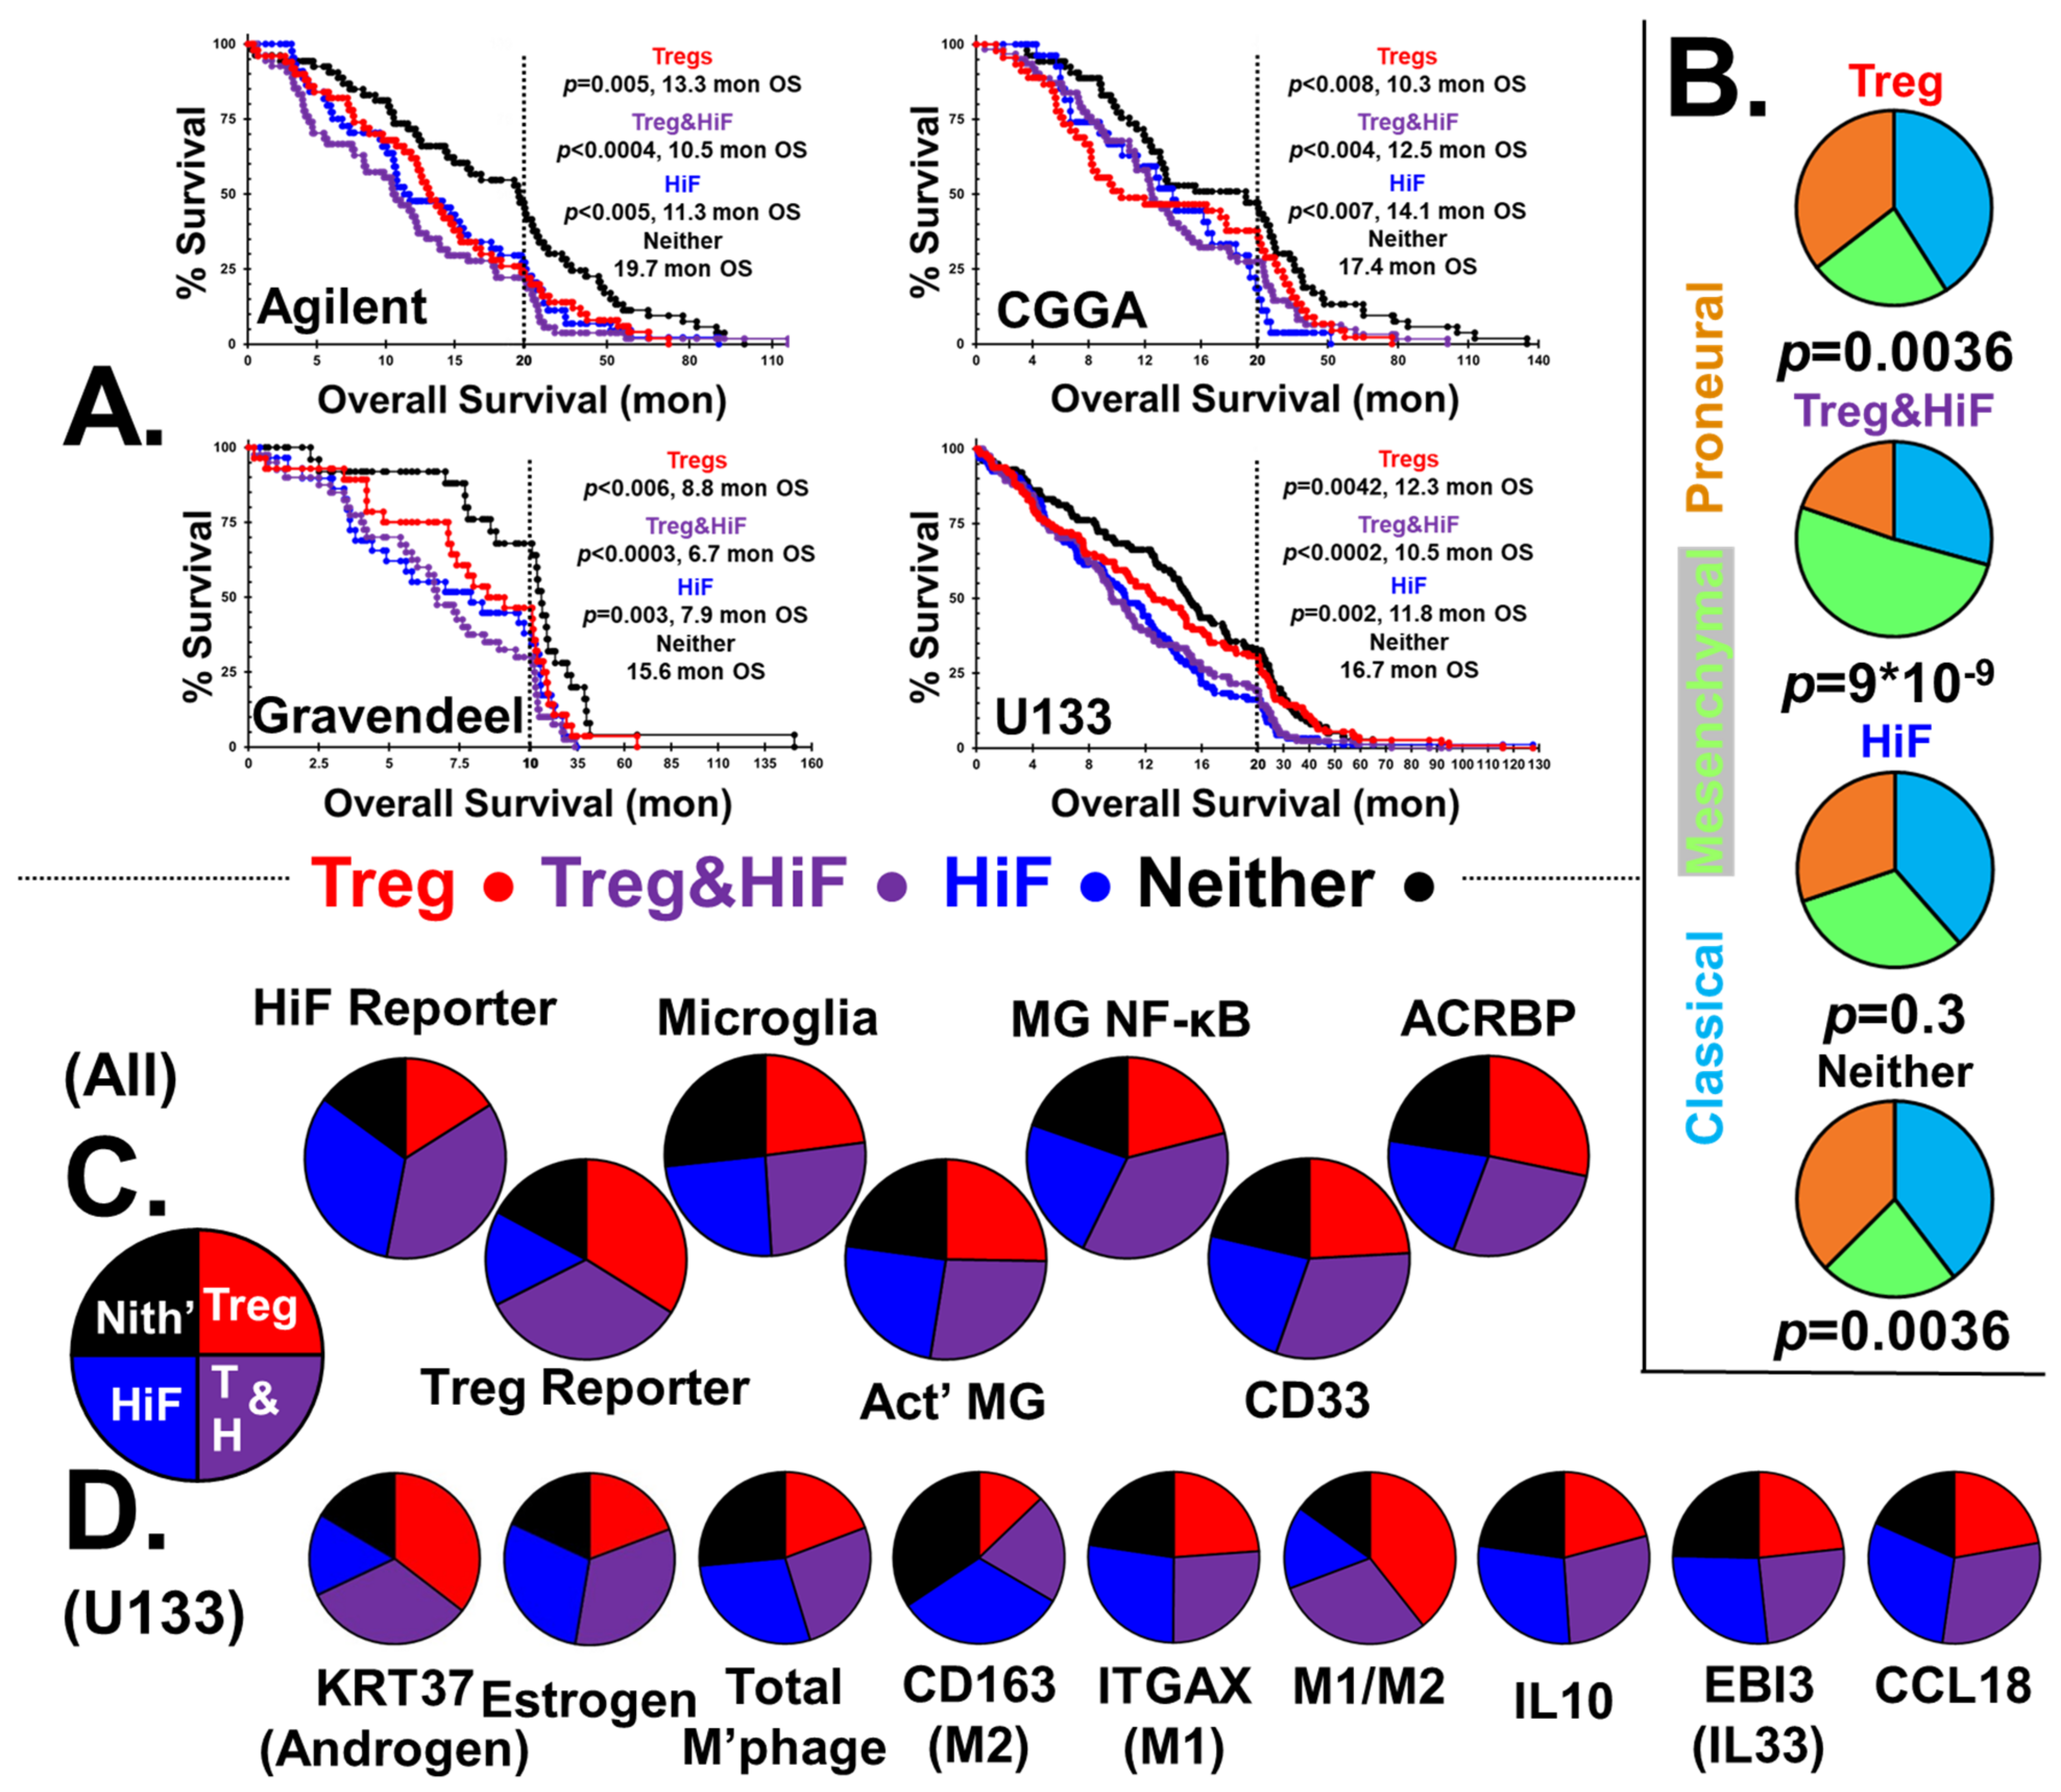
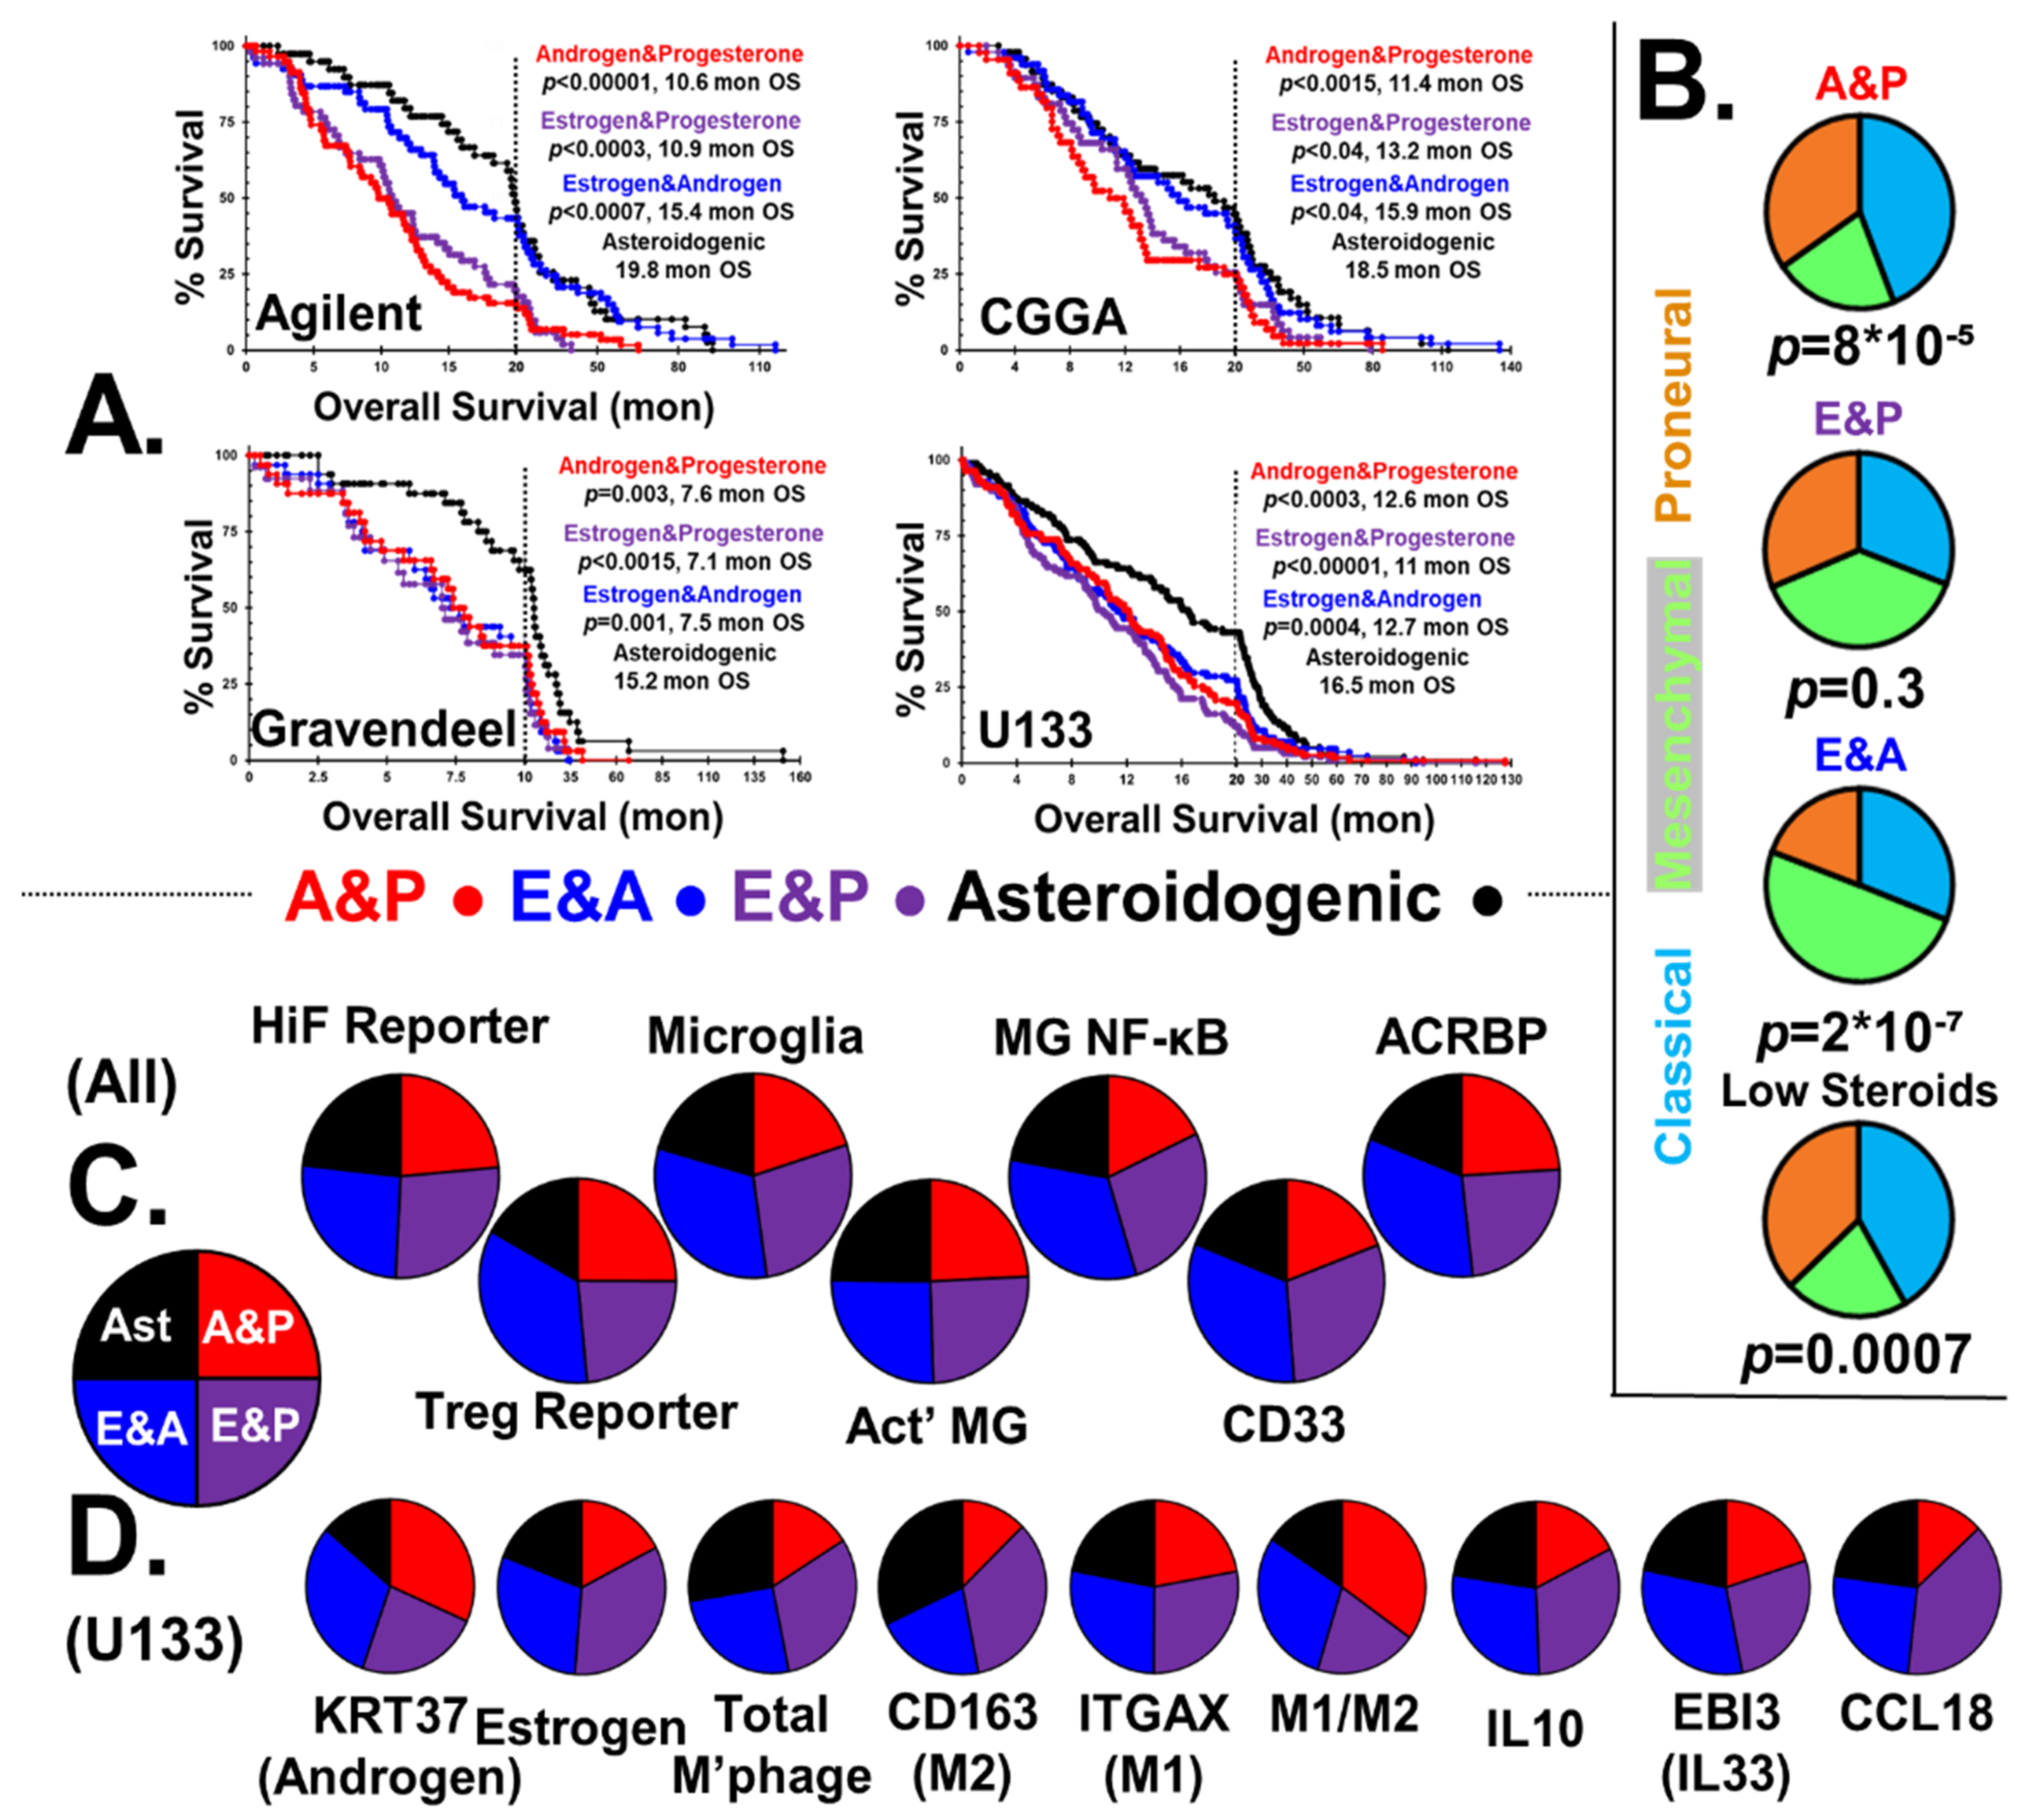
Figure 1A shows four Kaplan–Meier survival curves stratified into Treg, Treg&HiF, HiF and neither categories. With each survival curve, the calculated p values and median survival (months) are indicated, along with dataset ID. We have omitted markers to identify censored patient endpoints (alive at time of archiving), but these data were used in the statistical analysis.
Patients whose tumors have infiltrating RORC-Treg or the HiF phenotype have a significantly worse outcome than normoxic and non-Treg-infiltrated tumors. Patients with Warburg phenotype tumors highly infiltrated by Tregs generally tend to have the worst outcome, with median survival <50% of the neither group.
We analyzed the reportage levels of HiF and RORC-treg gene baskets from all patients in the four databases, n = 892. Stratification by HiF/Treg results in the median HiF gene-basket reportage at levels 2.4 ± 0.7 times greater in the selected HiF subgroups than normoxic subgroups. The median RORC-Treg gene basket is expressed at levels 2.3 ± 0.9 times greater in the selected Treg subgroups than the negative pair; calculated p-values are p < 10−10 between pairs in both cases.
2.2.2. CMP Subtypes
The distribution of CMP-subtypes in the stratified tumors are shown in Figure 1B, along with χ2 calculated p-values. In the hypoxic-Treg infiltrated tumors, the mesenchymal subtype dominates, in contrast to the normoxic-Treg infiltrated tumors with elevated classical and proneural sub-types.
2.2.3. Stratification Reportage and Microglial Phenotypes
Levels of HiF and RORC-Treg markers of the four stratified groups are displayed in Figure 1C, using pie charts derived from 892 patients (U133, Aglient, Gravendeel and CGGA datasets). Total microglia levels were elevated in the neither subgroup, the only immunological cell type correlated with improved patient outcome, p < 0.01, Figure 1C. Poor patient outcome is correlated with microglia activation state with both proinflammatory and elevated NF-κB signaling over-represented in the at-risk subgroups.
2.2.4. MDSCs
CD33 expression is a proxy for MDSC levels [101], and levels are overrepresented in hypoxic tumors, potentiated by RORC-Treg infiltration.
2.2.5. Sperm/Testicular Proteins
Li and coworkers found antibodies toward sperm-specific protein ACRBP in the serum of their glioma patients [76]. We chose to examine ACRBP as a representative of sperm-specific gene expression in GBM tumors (see Supplemental Figure S2A). Expression of ACRBP is concordant with degree of Treg infiltration, but independent of HiF status, as shown in Figure 1C.
2.2.6. Androgen and Estrogen Reporters and Macrophage Status
The expression of KRT37 is controlled by three androgen response elements, and transcript levels can serve as an androgen/androgen receptor signaling proxy [102,103,104,105]. GBM tumor levels of KRT37 are highly correlated with Treg infiltration. Supplemental Figure S3 shows the correlations between expression of KRT37 (i.e., androgen expression) and the RORC-Treg gene basket, using the U133 dataset. Individual RORC-Treg markers are highly correlated with KRT37, all correlations p < 0.001, suggesting androgen-driven expansion and activation of Treg populations in GBM tumors [66]. In Figure 1D, we show pie charts representing the sex-steroid reporter levels and macrophage status using the U133 dataset. Using KRT37 androgen reportage, it is clear that there is a strong correlation between androgen reportage and RORC-Tregs.
Our estrogen reporter is generated from a basket of normalized transcripts utilizing the quintet of estrogen-responsive genes: THBD [93,94], THEMIS2 [95], SERPINA1 [96], PIK3CG [97] and VAV1 [98]. These gene expression levels are highly correlated, Supplemental Figure S4, with all correlations p < 0.001. In Figure 1D, it is clear that estrogen reportage correlates with HiF status.
We calculated total macrophages levels using normalized levels of classical markers ITGAM and CD68. Hypoxia has been shown to aid macrophage recruitment and polarization toward the M2-phenotype [106], which is what we observe. The M2 > M1 hypoxic tumors are also noteworthy in their expression of anti-inflammatory, macrophage-associated, cytokine/chemokines IL10, EBI3 (co-protein in IL33) and CCL18.
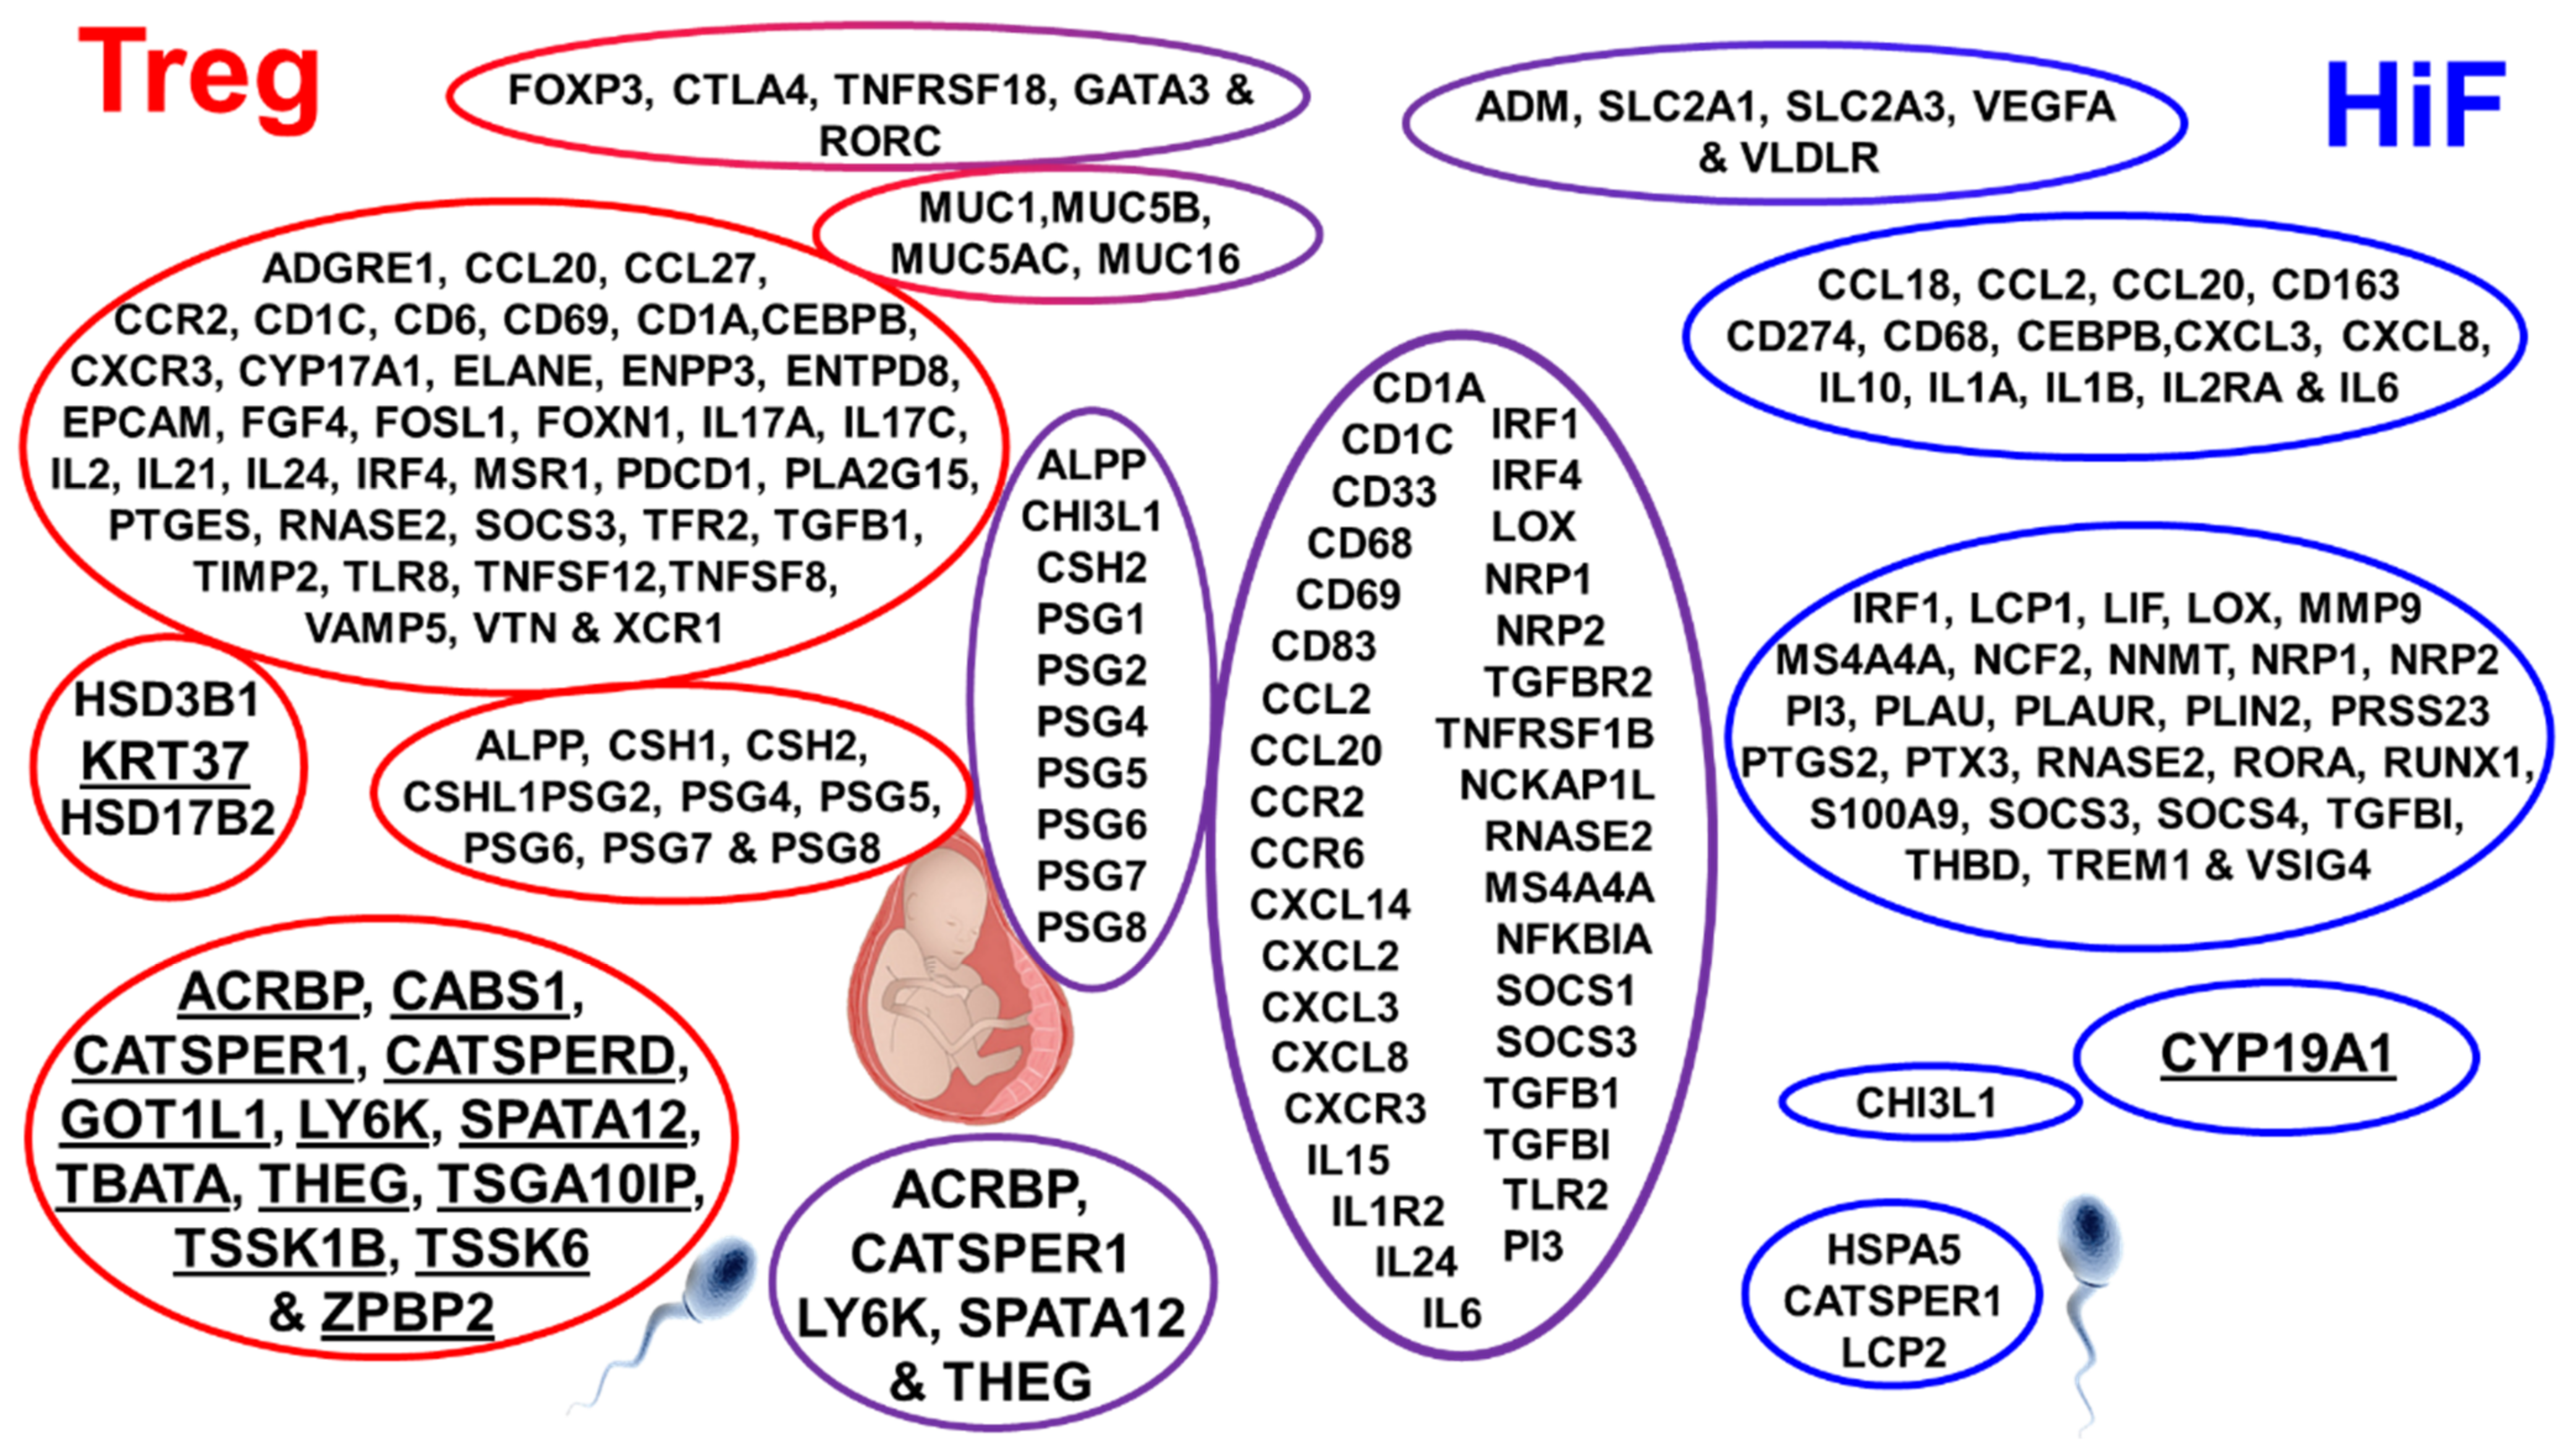
In pursuit of a mechanistic explanation for immune responses in the subgroups, we examined the correlation of stratified subtypes with > 2200 genes. Figure 2 shows selected genes found highly expressed in the Treg, Treg&HiF and HiF subtypes (using the U133 dataset), p < 0.05.
The genes are clustered into groups based on cell type and function. The Treg subtype is to the left, HiF is on the right and Treg&HiF is centered, Figure 2. Bolded for emphasis are:
- (a)
- Keratin 37, our androgen reporter, correlates with Tregs.
- (b)
- Aromatase (CYP19A1), which converts testosterone to estrogen is elevated with HiF.
- (c)
- Sperm/testicular-specific gene transcripts ACRBP, CATSPER1, LY6K, SPATA12 and THEG all correlate with Tregs.
2.3. Steroidogenic Status Impacts GBM Patient Outcome
2.3.1. Steroidogenesis in GMB
An examination of steroidogenic enzyme gene levels in the stratified GBM tumors, Figure 1 and Figure 2, indicated that there were two pathways for steroidogenesis in GBM tumors: the canonical and ‘backdoor’ pathways. Based on this emergent property, we stratified the tumors from the four databases based on the expression of enzymes required for steroidogenesis. GBMs were first stratified by ≈50% based on the high expression of canonical steroidogenic pathway genes. Those with the canonical pathway were then subdivided, based on aromatase expression, into androgen- (with progesterone) and estrogen (with progesterone)-generating tumors. The remaining GBMs with low levels of the enzymes of the canonical pathway were then stratified into two equally sized fractions of those expressing the non-canonical ‘backdoor’ pathway genes, which generated dihydrotestosterone and estrogen, and the tumors which appear to be asteroidogenic (See Methods).
2.3.2. Overall Survival and Status
Figure 3A shows the Kaplan–Meier survival curves of GBM patients stratified into steroidogenic phenotypes; androgen and progesterone, with low estrogen (A&P), estrogen and progesterone, with low androgen (E&P), estrogen and androgen, low progesterone (E&A), and asteroidogenic groups. Also shown is the median survival in months and the calculated p values with respect to the asteroidogenic group. Markers identifying censored patient endpoints were again omitted but used in statistical analysis. GBM steroidogenesis is highly detrimental to patient outcome, with median survival time of the E&A group only 75% that of the asteroidogenic group. Patients with A&P/E&P tumors fare worse, with only ≈60% of the longevity of the low steroid group.
2.3.3. CMP Subtypes
In Figure 3B, we show the distribution of CMP subgroups, stratified by steroidogenic output, capturing the role of sex steroids in GBM etiology. Levels of mesenchymal cells in the three steroidal groups are consistent with reported effects of sex steroids on epithelial–mesenchymal transition. Reports state progesterone fetters the epithelial–mesenchymal transition [107], whereas androgen’s effects are much weaker [108]. In contrast, estrogen was shown to drive the epithelial–mesenchymal transition in many tissues, including GBM cells [60]. We find estrogen causes over-representation of mesenchymal phenotype GBMs, whereas progesterone favors the classical CMP subgroup.
2.3.4. HiF and Tregs
The first two pie charts of Figure 3C show there is a small, statistically significant elevation in HiF reportage in tumors with the ability to generate androgen and estrogen, p < 0.05. Androgenic GBMs clearly show elevated levels of infiltrating RORC-Tregs, p < 0.001.
2.3.5. Microglial Phenotypes
The two estrogenic subtypes induce microglial proliferation and have elevated NF-κB activation markers, which matches studies performed in vitro and in vivo [109,110]. In contrast, both progesterone and androgen suppress NF-κB pathway activation with progesterone acting directly through its receptor, but with androgen indirectly acting via cytokine signaling [111,112].
Microglia infiltration is elevated in estrogenic GBM, with levels elevated >40%, p < 0.001, and we observe >30% NF-κB signaling in estrogenic GBM, p < 0.001, Figure 3C. Unlike combinatorial estrogen and progesterone, combined androgen and progesterone has a synergistic effect on microglia NF-κB signaling, with the difference between A&P and E&P groups being 3:1, p < 0.001.
2.3.6. MDSCs
GBM tumor infiltration by MDSCs is estrogen sensitive, with marker CD33 overrepresented, p < 0.001, Figure 3C [113,114]. Elevated expression of the estrogen signaling reporter basket of genes correlates with MDSC and TAM marker genes [115], Supplemental Figure S5, all correlations p < 0.001. This is consistent with our postulate that GBMs are steroidogenic, allowing the tumors to mimic reproductive tissues that attract either RORC-Tregs or MDSCs/TAMs.
2.3.7. Sperm/Testicular Proteins
Expression of ACRBP is concordant with the degree of steroidogenesis, Figure 3C. Expression of ACRBP is strong in all three sex-steroid groups, all statistically significantly different from the asteroidogenic group, p < 0.001, but the two androgenic types are indistinguishable from each other. This observation supports the postulate that sperm-specific proteins are expressed by GBM to lure testicular/uterocervical Treg pools. From an analysis of the relative levels of different steroidogenic enzyme transcript levels, we present the routes and relative fluxes of steroidogenesis for the A&P, E&P and E&A groups in Supplemental Figure S6. Additionally, the ability to block steroidogenesis with off-the-shelf clinical inhibitors is shown.
2.3.8. GBM Steroidogenesis Validation, Macrophage Infiltration and Polarization
Estrogen acts as a potent anti-inflammatory regulator in healing and causes macrophage polarization M2 > M1 [116]. Progesterone acts in a similar manner to estrogen, driving M2 > M1 polarization [117]. The E&P group has the highest fraction of both total macrophages and M2-polarized macrophages. Androgens can initially aid M2 > M1 polarization; however, prolonged androgen exposure has been shown to cause M1 > M2 macrophage polarization [118], consistent with our stratification of GBM by steroidogenesis. Macrophage levels and polarization in the four types of tumors is consistent with the reported estrogen anti-inflammatory M2-phenotype, driving also the production of Il10 and IL33, but androgen driving M2 > M1 polarization. CCL18 generation by M2 macrophages is elevated by estrogen [119], and our data suggest that it is inhibited by androgen.
2.4. Elevation of Sperm/Testicular Specific Antibodies in GBM Patients
Emboldened by this in silico data, we reasoned that GBMs shed sperm/testicular-specific proteins into the peripheral lymphatic system. In adults, the levels of anti-sperm/testicular antibodies in circulation are very low, as reactive B-cell lineages are either deleted or converted into Bregs, either in testicles or by the seminized cervix (Appendix A). Shed sperm/testicular-specific antigens from a GBM tumor should generate anti-sperm/testicular-specific antibodies in patient serum. It has been demonstrated that following vasectomy or vaccination, sperm introduced in the periphery induce an immune response, and so high titers of anti-sperm antibodies develop [120,121,122,123,124,125]. Men, following vasectomy, have elevated circulating anti-sperm antibodies, but do not suffer from autoimmune orchitis because testicular immune privilege is maintained by Tregs [120,121,122,126].
We devised a methodology to interrogate GBM patient serum for multiple anti-sperm/testicular antibodies, whereby we labeled human antibodies with specificity toward proteins present in primate testicle slices. We used primate testicle as sperm-specific proteins generally have very high rates of evolution due to sperm competition, especially in small mammals [127]. This testicular tissue was obtained from control animals from a different study that had come to an end, and we were able to obtain and fix the tissue within minutes of euthanasia.
We incubated monkey testicular slices with serum from GBM patients and age-matched controls. Then, we labeled the tissue for the presence of human IgG. As a privileged organ, anti-sperm/testicular antibody binding to the monkey testicle should be low in both women and in unvasectomized men.
Figure 4 shows that the levels of anti-testicular antibodies were elevated in GBM patients compared with gallbladder surgery patients. In Figure 4A, we show a plot comparing the intensity of DAB-staining intensity in anti-sperm/testicular antibodies binding to monkey testicular tissue. We find nearly sevenfold greater levels of anti-sperm/testicular antibodies in GBM patient serum compared to control serum, p < 10−10.
Figure 4B,C allows the comparison of DAB (brown) labeling of monkey testicle with anti-sperm/testicular antibodies from the serum from two male and two female gallbladder surgery patients (B) and that from the serum of four male and four female GBM patients (C). The nuclei counter-stained blue.
The images in Figure 4B,C clearly show a heterogenous pattern of patient-derived antibody testicular labeling, which can be seen in the high magnification images, suggesting that different testicular epitopes are targeted/labeled in each patient’s serum. These antibodies arise from differential sperm/testicular-specific proteins expressed by an individual patients’ GBM, recruiting a separate pool of reproductive Tregs. The labeling of testicular slices with serum samples taken from other GBM and control patients are shown in Supplemental Figure S7. We conclude two things: first, sperm/testicular-specific IgGs are present in GBM patient serum, and second, these antibodies arise due to sperm/testicular-specific proteins being expressed by the tumors.
3. Discussion
We have used a gene-basket approach to stratify GBM tumor transcriptomes, which has been used to examine the levels of specific cell types and signaling/synthetic path-ways in tumors. A drawback of this type of analysis is that although we can identify correlations between gene transcripts, we cannot be sure that the transcripts are present in the same cells. The tumor-infiltrating RORC-Tregs we have shown to be linked to poor patient outcomes and associated with tumor androgenesis were selected based on elevated levels of FOXP3, CTLA4, GITR, RORC and GATA3 transcripts in the whole tumor, not from individual T-cells. A reasonable criticism of the in silico analysis performed is that these transcripts could be expressed by different cells within the tumor, and the correlations between the transcripts are spurious, in the same manner that rates of forest fires and ice-cream sales are spuriously correlated. With respect to the identification of tumor-infiltrating RORC-Tregs, additional evidence for this supposition is that the relationship between levels of the identified infiltrating RORC-Tregs and patient outcome is consistent utilizing data drawn from four different GBM transcriptome databases. Additionally, these RORC-Tregs transcripts are not only highly cross-correlated with each other, but also highly correlated with transcripts known to be recruiters of this Treg subclass, ‘male-specific’ ACRBP, SPATA12, TSSK6, HSPB9 and CATSPER1, and with mucins MUC5B, MUC6, MUC13, MUC16 and MUC17.
Our in silico analysis identified tumor steroidogenesis as a means for GBM to acquire an immunosuppressive phenotype, with the generation of androgens appearing to drive RORC-Treg infiltration and the generation of estrogen driving infiltration/activation of MDSCs/TAMs. Steroidogenesis can either be supported by the GBM cells, from non-cancer cells within the tumor, or an interplay between both. It has recently been reported that tumors can cause the expression of CYP11A1 in T-cells, causing them to metabolize cholesterol to pregnenolone. This hormone is then released, resulting in immunosuppression [128]. The stratification of GBM tumors based on the synthesis of androgen and estrogen can be, and has been, validated by monitoring the transcripts of androgen-dependent (KRT37) and estrogen-dependent (THBD, THEMIS2, SERPINA1, PIK3CG and VAV1) reporter transcripts. We have presented a multiplicity of evidence for the generation of androgens by GBM tumors to be correlated with levels of RORC-Tregs, and for estrogen synthesis by these tumors to correlate with infiltration by immunosuppressive MDSCs and macrophages.
In GBM patients, we observe compartmentalization between an immune-privileged tumor microenvironment and a peripheral immune response, evident from the >6-fold increase in circulating anti-sperm/testicular antibodies. A similar discordant immune response is observed post-vasectomy. Vasectomy does not cause autoimmune orchitis, but the release of ‘male-specific’ proteins into the periphery causes elevated anti-sperm antibodies. Testicular Tregs maintain immune privilege following vasectomy, despite a peripheral immune response. This same immune compartmentalization appears to occur in GBM patients.
The heterogenous pattern of patient-derived antibody testicular labeling, which can be seen in the high magnification images, suggests different testicular epitopes are targeted/labeled in each patient’s serum. These antibodies arise from differential sperm/testicular-specific proteins expressed by an individual patients’ GBM tumors, recruiting a separate pool of reproductive Tregs. The reproductive Treg populations must be lured into the tumor microenvironment to become activated toward male-specific epitopes, and one of the most promising candidates is the mucins expressed by GBM. MUC16 has previously been shown to generate a Treg-attracting fragment after proteolysis, which has previously been shown to result in tumor aggressiveness in ovarian cancers [38].
4. Materials and Methods
The in silico transcriptome analysis we report is derived from four publicly available datasets using only IDH wild-type GBM tumors: the Firehose Legacy U133 (389 patients), the Firehose Legacy Agilent microarray (201 patients), the CGGA [99] database (180 patients) and the Gravendeel [100] database (122 patients). The classification of GBM sub-types refined by Wang et al. was taken from the analysis furnished by the Gliovis platform [86].
4.1. Stratification of GBM Phenotype by Warburg and Treg Infiltration Status
4.1.1. Stratification of GBM Tumors by HiF
We used a basket approach to stratify tumors into positive/negative HiF based on expression of the hypoxia-response genes: Glut1 (SLC2A1) [9], Glut3 (SLC2A3) [10,11], ADM [14], VLDLR [13] and VEGFA [12]. Normalized mRNA expression levels of the five genes were rescaled between 0 (min) and 1 (max) and then averaged. The 5–10% fraction of tumors expressing low levels of each marker were relegated into HiF negative status, and the ≈50% tumors displaying the highest average expression were deemed as HiF positive. GBM tumor expression of HIF signature gene cross-correlations is shown in Supplemental Figure S1 using data obtained from the Firehose Legacy Agilent microarray [129] and the Gravendeel databases [100] with plots generated utilizing Gliovis [86]. SLC2A1, SLC2A3, ADM, VLDLR and VEGFA expression levels in GBM populations are highly cross-correlated with the other HiF markers, with p < 0.001 in all cases. To identify HiF status, we normalized and rescaled the expression levels of the quintet; the 5–10% fraction of tumors expressing low levels of each marker were deemed HiF negative; the ≈50% tumors displaying the highest average expression were deemed as HiF positive.
4.1.2. Stratification of GBM Tumors by Tregs
After the transcriptiome data had been stratified into two similar groups representing hypoxic and normoxic, it was once more restratified. In the second round of stratification, the samples were divided on the basis of high/low levels of RORC-Treg markers. The GBM-infiltrating RORC-Tregs were selected on the basis of elevated expression of a 5-gene signature; FOXP3 [23], CTLA4 [24,87], GITR [20,26,88], RORC [29,45,89] and GATA3 [27,90,91]. The cross-correlations of GBM tumor expression of these Treg signature genes is shown in Supplemental Figure S2, with data obtained from the Firehose Legacy Agilent microarray and Gravendeel GBM tumor databases [100,129] and plots generated using the Gliovis platform [86]. The quintet of genes used to identify tumor infiltrating Tregs are highly cross-correlated with the other, with p < 0.001 in all cases.
To identify RORC-Treg high/low status, we normalized and rescaled the expression levels of the quintet; the 5–10% fraction of tumors expressing low levels of each marker were deemed RORC-Treg low, and the ≈50% tumors displaying the highest average expression were deemed as Treg high.
4.1.3. Selection of Treg&HiF and Neither Groups
After assignment of HiF and Treg status, the data fell into four distinct groups: high Treg, high HiF, high Treg&HiF, and ’neither’ (low Treg and low HiF). The mRNA levels of highlighted gene expression levels with respect to the neither group is found in Supplemental Table S1A (Excel Sheet, Treg&HiF Stratification), along with the fractional size of the four groups, for analysis from the four presented databases. The normalized average HiFs are 2.4 ± 0.7 times greater in the HiF-positive groups than in the HiF-negative groups and the Treg groups are 2.3 ± 0.9 times greater in the Treg high groups than in the Treg low groups across the four databases.
4.1.4. Assaying Microglia Levels and Status
Given that microglia exhibit sex-specific phenotypes (Yanguas-Casás [130]), these immune cells were a major target of investigation. Tumor-infiltrating microglia and their inflammatory status were interrogated using the gene expression of 4 separate baskets, averaging the products of normalized/rescaled mRNA expression levels of each gene in a basket, with baskets drawn from transcriptome changes induced by LPS treatment or stimulation of NF-κB signaling in human microglial cultures (total MG: ADORA3, IGSF6, TBXAS1, SASH3 and P2RY13; downregulated during inflammation, P2RY12, TMEM119 and GPR34; upregulated by NF-κB: GCLC, NQO1, GCLM, NFKBIA and SLC39A8; and downregulated by NF-κB: ZDHHC22, BCL7A and GNG4) [92].
4.2. Stratification of GBM Phenotype by Steroidogenesis
4.2.1. Choice of Genes for Stratification of Tumors by Steroidogenesis
We initially analyzed GBMs based on the genes of the canonical steroidogenesis pathway and planned to divide GBM tumors into androgenic, estrogenic and asteroidogenic groups. However, upon examining the outputs of androgen and estrogen reporter genes, it was evident that some GBMs had low transcript levels of critical canonical steroidogenic pathway genes, and yet appeared to be generating androgen and estrogen. This emergent property of the tumors led us to examine the non-canonic ‘backdoor’ steroidogenic pathway, which is utilized during gestation and in castration-resistant prostate cancers. We discovered that in some GBMs, this non-canonical pathway appears to be present, and so we used a stratification procedure that gave rise to four steroidogenic phenotypes: androgen (testosterone) with progesterone (A&P), estrogen with progesterone (E&P), estrogen with androgen (DHT) (E&A), and asteroidogenic.
4.2.2. Canonical Steroidogenesis Groups A&P and E&P
The A&P and E&P subgroups use the canonical steroidogenesis pathways, expressing high levels of canonical pathway genes CYP11A1, CYP17A1, HSD17B3 and HSD3B1 alongside low levels of the progesterone catabolic enzyme AKR1C1. We selected the ≈50% of tumors with high levels of the first four genes and low AKR1C1. These were then stratified based on expression of aromatase (CYP19A1), which converts testosterone into estrogen, delineating the A&P and the E&P subtypes.
4.2.3. Non-Canonical Steroidogenesis, the E&A Group
Approximately a quarter of the GBM tumors appear to employ non-canonic steroidogenesis, similar to estrogen-sensitive breast cancers [131,132] and castration-resistant prostate cancers [55,133,134,135,136]. Instead of beginning with cholesterol, steroid-sulfates are utilized, imported by fetal/placental transporters SLC22A11, SLC22A19, and SLCO4A1: the ‘side-entry’ synthetic route. These GBM then utilize AKR1C1 and AKR1C3 for ‘backdoor’ steroidogenesis [131,134,135,137,138,139,140]. Tumors lacking this non-canonical importation (asteroidogenic) were identified by low levels of all five gene transcripts.
4.2.4. Selection of Androgen/Estrogen in the Four Groups
An emergent property was apparent during an initial analysis of the steroidogenic enzyme/transporter gene levels, indicating that GBM can be stratified into 4 groups: A&P (testosterone and progesterone), E&P (estrogen and progesterone), E&A (Estrogen and dihydrotestosterone), and ’neither’ (asteroidogenic). The mRNA levels with respect to the neither group are found in Supplemental Table S1B (Excel Sheet, Sex-Steroid Stratification), along with the fractional size of the four groups for each of the four databases analyzed. Normalized average androgen reportage is 2.4 ± 0.7 times greater for two androgen-positive groups than in the asteroidogenic group, and estrogen reportage in the two estrogen groups is 2.0 ± 0.6 times greater than the asteroidogenic group.
4.2.5. Visualization of Anti-Sperm Antibodies from Patient Sera
Unless otherwise stated, reagents were obtained from Sigma (Sigma-Aldrich, Inc., St. Louis, MO, USA). We probed primate testicle with patient serum, then visualized human antibodies with DAB staining. At necropsy, Cynomolgus monkey testicle was removed and fixed in 4% paraformaldehyde buffer for 7 days at 4 °C. The tissue was then washed and dehydrated using graded alcohol and xylene and then wax embedded. The block was sliced into 5 μm sections that were affixed to slides and dried. Slides were dewaxed four times in xylene, then twice in isopropanol, and rehydrated using graded ethanol. The slides were washed and permeabilized using Phosphate Buffered Saline (PBS, Fisher Scientific, Waltham, MA, USA) containing 0.1% Triton X-100. The slides were placed in Na-citrate buffer (100 mM, pH 6.0) and heated to <100 °C in a steamer for 30 min, followed by cooling slowly to bench temperature for epitope retrieval. After washing in PBS, endogenous peroxidase activity was eliminated using mild conditions: 1.8% H2O2 for 5 min, then in 1% sodium periodate for 5 min, followed by 0.02% NaBH4 for 2 min. Serum-Free Protein Block (Dako North America, Inc., Carpinteria, CA, USA) was applied for 1 h, and after washing, 50 μL of GBM or gallbladder surgery patient serum was applied and incubated at 4 °C overnight. After washing in PBS, 1:500 mouse anti-human IgG antibody (HP-6017 was applied and incubated for four hours. After washing, the HiDefTM HRP-polymer system (Cell Marque, Rocklin, CA, USA) was used to functionalize with peroxidase, and a DAB chromogen kit (Dako North America, Inc., Carpinteria, CA, USA) was used for visualization. Slices were then counter-stained using hematoxylin and sealed. Images were taken with a Carl Zeiss microscope (Oberkochen, Germany), and DAB labeling levels were quantified using ImageJ, as previously described [141,142]. We used an age-matched control group, as anti-sperm antibody titers have a slight age dependency [120,121]. Gallbladder surgery patient serum was used for control studies as these are demographically akin to GBM patients, and these samples were obtained from the Houston Methodist Biorepository. Anti-testicular antibodies were assayed using serum from GBM patients (10♀, 12♂) and gallbladder surgery controls (5♀, 6♂). All samples were treated simultaneously, in parallel, at each step of the immunohistochemistry process, incubated for the same time and using the same solutions.
5. Conclusions
Tumor hypoxia and infiltration by Tregs and also by CD33+ MDSCs are independent risk factors in GBM. Steroidogenesis is central to tumor infiltration by immunosuppressive cells. Estrogenicity creates a niche filled by MDSCs/TAMs. Androgenicity is correlated with expression of male-specific antigens and RORC-Treg infiltration and activation. These processes can potentially be halted with steroid inhibitors, improving patient out-come. Sperm/testicular-specific protein shedding by GBM can be assessed by examining levels of anti-sperm/testicular antibodies in the patient serum. These discoveries unlock novel methods for detection and aiding the treatment of GBM. The data herein strongly support the view that the main Treg subtype supporting GBM ferocity is the RORC-Treg class, a class of Tregs normally associated with mucin-rich cancers such as colorectal and pancreatic.
Supplementary Materials
The following are available online at https://0-www-mdpi-com.brum.beds.ac.uk/article/10.3390/ijms222010983/s1.
Author Contributions
Conceptualization, M.A.S.; methodology, M.A.S.; investigation, M.A.S., A.M.B. and A.V.J.; formal analysis, M.A.S., A.M.B. and A.V.J.; data curation, M.A.S., A.M.B. and A.V.J.; writing—original draft preparation, M.A.S., A.M.B. and A.V.J.; writing—review and editing, M.A.S., A.M.B., A.V.J. and D.S.B.; project administration, D.S.B.; funding acquisition, D.S.B. All authors have read and agreed to the published version of the manuscript.
Funding
This work was supported by the Donna and Kenneth R. Peak Foundation, The Kenneth R. Peak Brain and Pituitary Center at Houston Methodist Hospital, The Taub Foundation, The Blanche Green Estate Fund of the Pauline Sterne Wolff Memorial Foundation, The John S. Dunn Foundation, Kelly Kicking Cancer, The Marilee A. and Gary M. Schwarz Foundation, The Houston Methodist Hospital Foundation, and the Verelan Foundation.
Institutional Review Board Statement
The study was conducted according to the guidelines of the Declaration of Helsinki and approved by the Institutional Review Board (or Ethics Committee) of Houston Methodist Hospital (IRB# Pro00014547 and approval 09/2016).
Informed Consent Statement
Informed consent was obtained from all subjects involved in the study.
Data Availability Statement
All transcriptome data used in the figures and in the Supplementary Data was obtained from the Firehose Legacy U133, the Firehose Legacy Agilent microarray, the CGGA and the Gravendeel databases, and references to these data are to be found within the text.The classification of GBM sub-types refined by utilizing the Gliovis platform, as were the graphics in some of the Supplementary Figures. (http://gliovis.bioinfo.cnio.es/). Derived data is available on request from the corresponding author.
Acknowledgments
We are grateful to the many patients and families who have helped us with our research. Special thanks to Jeanne Manalo and Aaron Thorne for editorial input.
Conflicts of Interest
The authors declare no conflict of interest. The funders had no role in the design of the study; in the collection, analyses, or interpretation of data, in the writing of the manuscript, or in the decision to publish the results.
Appendix A
Supplemental Text: Granting of sexual privilege.
Epitope-Specific Tregs by Gender in Health and Disease: Background Immunology: Epitopes are uniquely recognized by T-cell receptors (TCRs) and B-cell receptors (BCRs), which are generated in T- and B-cells via the recombination of somatic genes [143]. Vast numbers of different TCRs and BCRs expressed by T and B cells allow these immune cells to interrogate the whole body for presence of ‘non-Self’. When these receptors bind to an epitope, they either behave in a pro- or anti-inflammatory manner, dependent on the context. Naive CD4+ T cells can become anti-inflammatory regulatory T cells (Tregs) by following three steps known as signals 1, 2, and 3 [144]. Signal 1 involves presenting epitopes to the TCR on the major histocompatibility complex (MHC) class II molecule of an antigen presenting cell, typically a dendritic cell (DC) or B cell. Signal 2 must follow, for proper activation and proliferation, from costimulatory molecules on the antigen-presenting cell, for example, CD80/CD86 with CD28 expressed on the T-cell surface. Signal 3, the cytokine environment, determines classification as either pro- or anti-inflammatory. IL-10 and TGFβ drive activated CD4+ T-cells into Tregs, whereas IL-6 and IL-23 drive pro-inflammatory class-switching.
Determining ‘Self’ and ‘non-Self’: Estimates of potential numbers of TCRs produced by the recombination process range from >1020 to 1061 [145,146]. CD4+ T cells, generated in the bone marrow, travel to the thymus and mature, undergoing thymopoiesis. Here, medullary thymic epithelial cells (mTECs) screen candidate CD4+ T-cells for ‘Self’ recognition. The mTECs synthesize most ‘Self’ proteins produced in the body, chop them into epitopic peptides and present these epitopes on MHCII to candidate CD4+ T-cells as ‘Self’. Candidate CD4+ T-cells whose TCR recognizes a proffered ‘Self’ epitope are either subject to clonal deletion (apoptosis) or become a Treg (provided presence of IL-2/IL-15/NFκβ signaling). The interrogation of CD4+ T-cells by the mTECs with ‘Self’ epitopes is the major means of suppression of autoimmune T-cell activity [147]. Negative selection failure gives rise to autoreactive CD4+ T-cells and autoimmune diseases [65]. When a B cell binds an antigen on its BCR, the antigen is internalized, directed toward lysosomes, proteolyzed into peptidyl fragments, bound to MHCII, exposed to the extracellular environment, and presented to immune cells. The proffered MHCII bound epitopes can be interrogated by the TCRs of CD4+ T-cells. If the TCR of a T cell binds to an epitope presented on MHCII, then signal one is activated. Mutualistic signaling results in proliferation of these epitope-specific BCR/TCR interactions between the B cell and CD4+ T cell, and the two cell types drive the proliferation and pro-inflammatory activation of the other. Activated B cells drive activated CD4+ T-cell class switching into pro-inflammatory T-helper cells and B-cell proliferation, and differentiation is driven by the interaction with CD4+ T-helper cells. B cells that bind and present ‘Self’ epitopes can give rise to autoimmune diseases. B-cell linages that recognize ‘Self’ can be terminated or undergo class-switching into anti-inflammatory, regulatory B cells (Bregs). This lineage-editing or class-switching generally occurs when B cells present epitopes that are recognized by the TCR of a Treg. Normally, when a Treg recognizes a presented epitope via its TCR, it responds by sending a variety of death signals toward the B cell, causing apoptosis and the termination of the B-cell lineage [148]. However, sometimes the signaling directs the B cells to undergo a class-switch, and the B cell is directed to become an anti-inflammatory Breg.
Sexual privilege in males: Prepubescent boys have B cells whose BCRs recognize ‘non-Self’ sperm/testicular-specific epitopes. This results in circulating anti-sperm antibodies with CD4+ T-cells that can bind sperm/testicular-specific epitopes [124]. At puberty, immune responses to ‘non-Self’ sperm/testicular-specific epitopes must be arrested. This is partially achieved by compartmentalization, with a blood–testis barrier created by tight-junctions between Sertoli cells. Additionally, Sertoli cells present male-specific epitopes on their MHCII [149], and drive TCR-activated CD4+ T-cell class-switching into immunosuppressive Tregs. These Tregs maintain the anti-inflammatory environment of the testicle and edit the B-cell lineages which give rise to anti-sperm antibodies. This is achieved either by lineage deletion or by class-switching into Bregs, resulting in anti-sperm antibodies disappearing after puberty [124]. The immunological ‘self’ is established long before puberty. At puberty, the maturation of testicles and the onset of sperm production presents boy’s immune systems with a myriad of testicular and sperm specific autoantigens. If testicles are not afforded ‘immune privilege’, the immune system attacks the tissue, giving rise to autoimmune orchitis. This can occur spontaneously in patients with AIRE gene mutations, due to dysfunctional Tregs [150]. Tregs control tolerogenic versus autoimmune responses, with respect to sperm/testicular-specific antigens, as was demonstrated by Wheeler [122,151]. Vasectomy is a well-established form of birth control that does not lead to autoimmune orchitis, due to the presence of tolerogenic Tregs that are responsive to sperm/testicular-specific antigens [122,151,152]. Following vasectomy, the maintenance of tolerance toward sperm/testicular antigens leaking from the severed vas deferens requires a rapid response by Tregs [122,151,152]. The Tregs arrest the elevation of auto-antibodies and pathogenic CD4+ T cells. This Treg tolerance to sperm/testicular antigens can be overcome by vaccination with sperm/testicular antigens. When volunteers with androgen-sensitive prostate cancer were injected with human testicular homogenate prior to their scheduled orchidectomy, they quickly developed autoimmune orchitis [125]. Experimental autoimmune orchitis (EAO) in animal models are well explored and give insights into the role of Tregs in immunotolerance toward sperm/testicular-specific antigens. Immune system attacks on testicles are seen when male mice are vaccinated with testicular homogenate or with sperm/testicular-specific proteins such as Zonadhesin (ZAN). EAO is caused by the expansion of sperm/testicular-specific CD4+ T cells, sensitized toward sperm/testicular-specific epitopes, as was demonstrated by Feng and co-workers in elegant transplantation studies [153]. BALB/c donor mice were vaccinated with epididymal spermatozoa, giving rise to EAO. When sperm-specific CD4+ T cells were extracted from these animals and transferred into naïve recipient mice, these unvaccinated males then developed EAO. Vasectomy exposes sperm/testicular antigens to the general immune system, away from a site of immune privilege. This provokes a B-cell response which elevates the levels of anti-sperm/testicular-specific antibodies, but does not lead to autoimmune orchitis. In contrast, when men were vaccinated with testicular homogenate, the immune response to the large bolus of sperm/testicular antigens overwhelmed the normal Treg maintenance of testicular privilege, resulting in autoimmune orchitis.
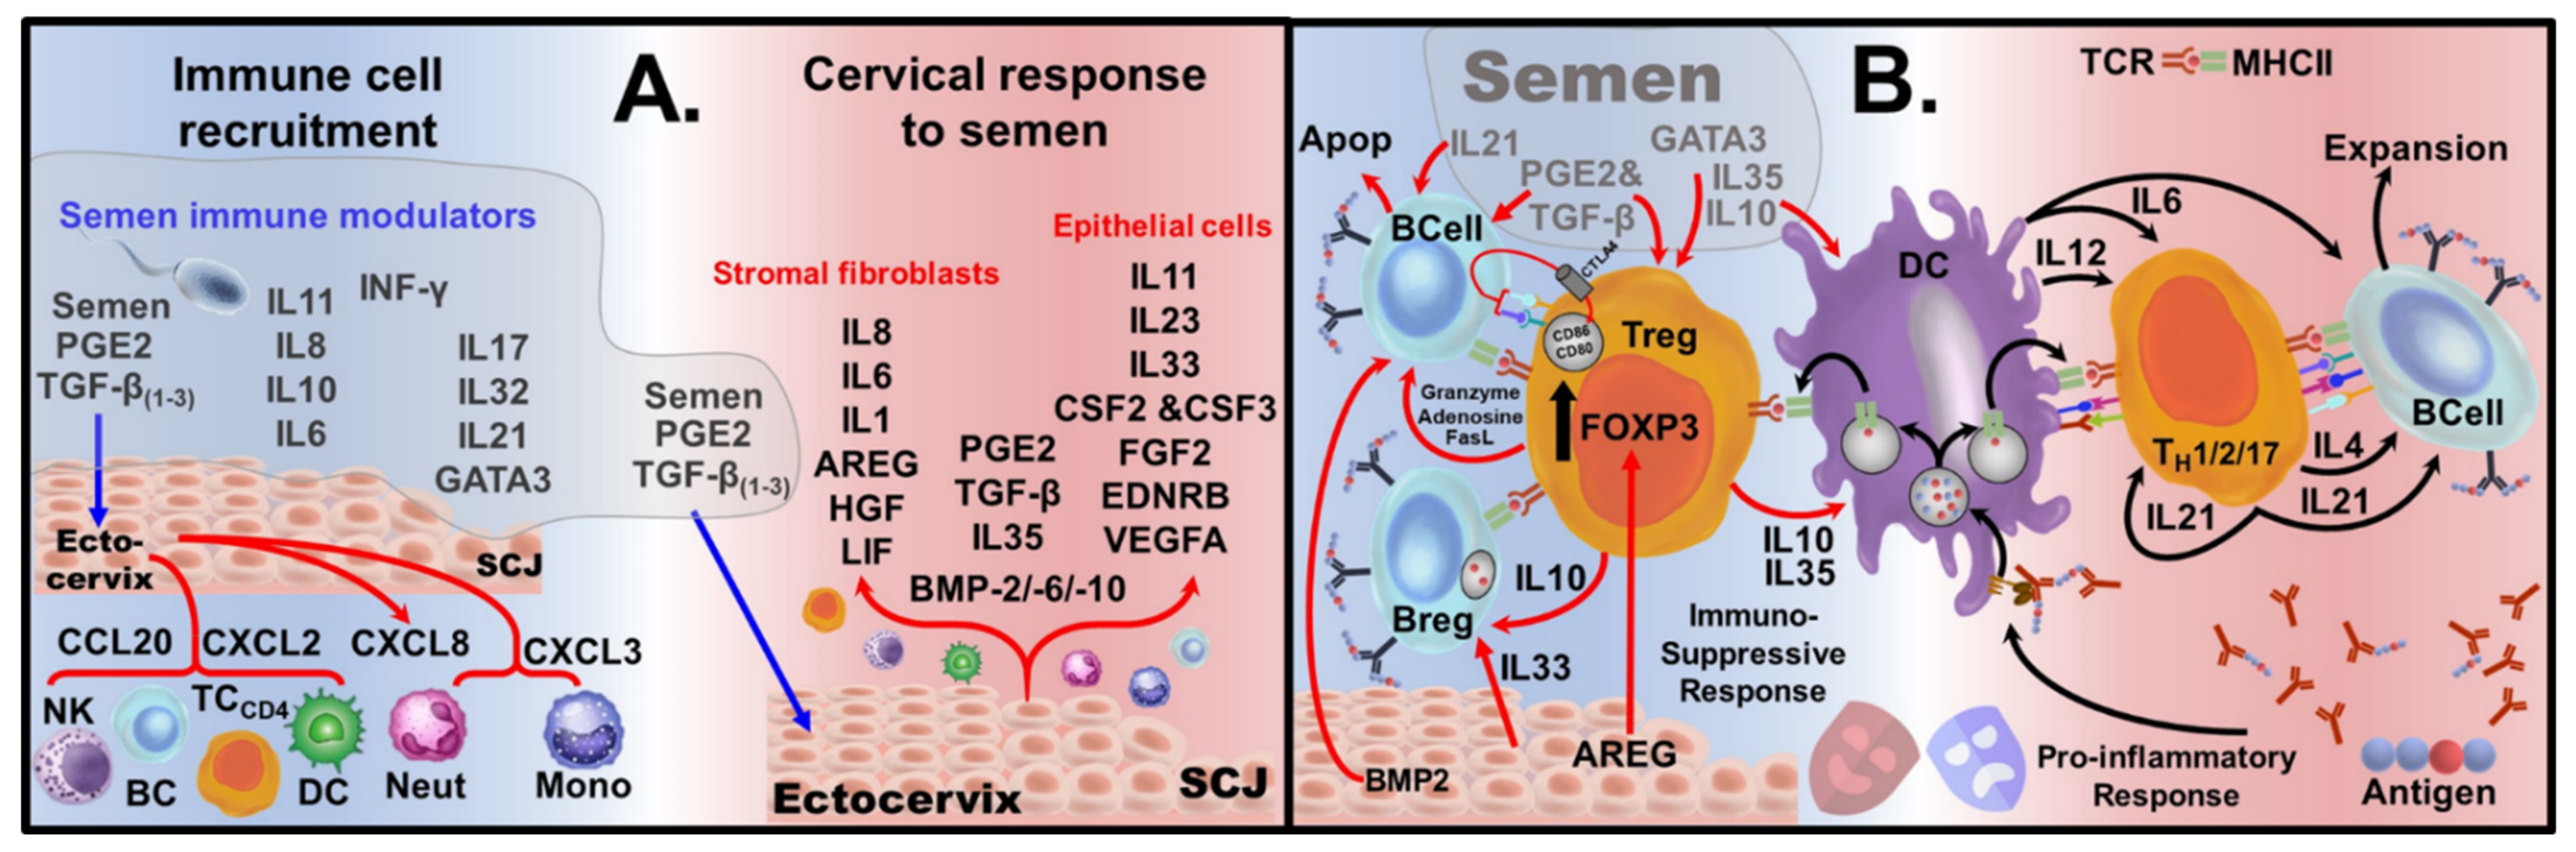
Sexual privilege in females. Following sexual activity, a woman’s reproductive tract hosts a variety of male-specific antigens present in semen. Mounting an immune response toward male-specific antigens, leading to anti-sperm antibody production, renders women infertile. The presence of sperm/testicular-specific antibodies in women is a leading cause of infertility, generally treatable with steroids [124,154,155]. Semen’s effect on the cervix allows women to host ‘non-Self’ male-specific antigens without mounting a pro-inflammatory response, through bestowing privilege. Upon encounter with healthy semen, it provides an exploitable immunological-niche geared toward the generation of epitope-specific Tregs and Bregs. Seminal fluid has high levels of prostaglandins and transforming growth factor-β (TGFβ1, TGFβ2 and TGFβ3) [156,157], Figure A1A. The cervix can also produce immunotolerant dendritic cells (tDCs) and myeloid-derived suppressor cells (MDSCs) [158,159,160,161]. The high levels of prostaglandin E2 (PGE2) in semen have been demonstrated to cause cervical DCs to take up a tolerogenic role [162]. PGE2 signaling alters cytokine production during antigen presentation, driving the production of IL-10 and TGFβ, promoting T-cell class-switching. Elevated levels of PGE2/TGFβ elicit the release of chemokines CXCL3 and CXCL8, which signal recruitment of monocytes from the periphery. These recruited monocytes are then presented with PGE2/TGFβ and undergo class-switching, becoming tDCs [158], which further release PGE2/TGFβ and IL-10 [159]. In the semenized cervix, large amounts of IL-11 are produced by the ectocervical cells. The combination of IL-11, via GP130 activation, with PGE2/TGFβ, has been shown to drive monocytes to become MDSCs [163]. Moreover, tDCs and MDSCs interact with each other and the ectocervix to generate positive feedback cytokine signaling, with tDC and MDSC generation of PGE2, TGFβ and IL-10, to further enhance epitope-specific Treg generation. Women’s dendritic cell response to sperm/testicular antigens in the presence of PGE2 gives rise to tolerogenic Treg linages, sensitized to sperm/testicular-specific epitopes [158,164]. PGE2/TGFβ in semen also cause the ectocervix’s endothelial and fibroblast cells to release immunomodulators and growth factors [165]. The apoptosis of activated B cells is driven by Tregs partially through CTLA4 and partially due to death signals granzyme, adenosine and FasL. CTLA4 can pluck CD80 and CD86 ligands out of the plasma membrane of B-cells by trans-endocytosis [166], triggering B-cell apoptosis, depicted in Supplemental Review Figure 1B. This CTLA4 mechanism drives the conversion of DCs from pro-inflammatory CD80Hi/CD86Hi into tolerogenic DCs CD80Low/CD86Low cells [167].
These Tregs allow women to tolerate sperm/testicular-specific antigens which are presented to them during coitus. In addition to mediating women’s tolerogenicity toward sperm/testicular-specific antigens, these Tregs also form the basis of maternal fetal tolerance [156,168]. Fetal maternal tolerance is essential for a successful pregnancy. Tregs play an essential role in pregnancy and a women’s tolerance to her unborn baby, primed by seminal fluid, as described above. Natural killer [NK] cells, which are CD16–CD56bright, CD4+ T cells, and CD8+ T cells, are all found to recognize trophoblasts that start to invade the endometrial tissue and uterine spiral artery after implantation, inducing a tolerogenic environment allowing for fetal development [169].
As is the case in men, the privilege women afford to sperm/testicular-specific antigens is conditional and women who are vaccinated with sperm/testicular-specific antigens exhibit an anti-immune response. Some 90 years ago, Baskin et al. injected women intramuscularly with their husbands’ semen to cause production of anti-sperm antibodies; he proposed that this technique could be a means to allow women to control their fertility [170]. Such vaccination strategies to control fertility are being pursued currently [171].
Figure A1.
Cervical Response to Semen: (A) Major cytokines present in semen with the chemokine response of the cells of the ectocervix toward seminal PGE2/TGFβ cause the recruitment of immune cells (left). PGE2/TGFβ in semen cause ectocervix endothelial and fibroblast cells to release immunomodulators and growth factors (right). A combination of both male-derived and female-derived immunomodulators and growth factors are required for an optimal immune response by women toward the male-specific antigens present in semen. (B) (Left) Cytokines/growth factors generated by the interaction of semen with ectocervical cells drives the formation of Tregs, which are presented with recognized antigens. Instead of epitope presentation-induced activation of CD4+ T cells and B cells, a seminized cervix has an array of cytokines/growth factors which generate epitope-specific Tregs. In addition, B cells which are activated by antigens bound to their BCRs can be driven to apoptosis, hence lineage deletion by death signals from Treg/cytokine/growth factors (IL21, PGE2, TNFβ, BMP2, granzyme, FasL and Adenosine). An alternative fate for antigen-activated B cells is class switching into Bregs, which can be induced by the presence of IL33 (cervical) and IL10. SCJ = squamous columnar junction; NK = Natural Killer Cells, TC = T cells, BC = B cells, DC = Dendritic Cells, Neut = Neutrophils, Mono = Monocytes AREG = Amphiregulin; Apop = apoptosis.

References
- Stupp, R.; Mason, W.P.; van den Bent, M.J.; Weller, M.; Fisher, B.; Taphoorn, M.J.; Belanger, K.; Brandes, A.A.; Marosi, C.; Bogdahn, U.; et al. Radiotherapy plus concomitant and adjuvant temozolomide for glioblastoma. N. Engl. J. Med. 2005, 352, 987–996. [Google Scholar] [CrossRef] [PubMed]
- Marenco-Hillembrand, L.; Wijesekera, O.; Suarez-Meade, P.; Mampre, D.; Jackson, C.; Peterson, J.; Trifiletti, D.; Hammack, J.; Ortiz, K.; Lesser, E.; et al. Trends in glioblastoma: Outcomes over time and type of intervention: A systematic evidence based analysis. J. Neurooncol. 2020, 147, 297–307. [Google Scholar] [CrossRef] [PubMed]
- Gilbert, M.R.; Dignam, J.J.; Armstrong, T.S.; Wefel, J.S.; Blumenthal, D.T.; Vogelbaum, M.A.; Colman, H.; Chakravarti, A.; Pugh, S.; Won, M.; et al. A randomized trial of bevacizumab for newly diagnosed glioblastoma. N. Engl. J. Med. 2014, 370, 699–708. [Google Scholar] [CrossRef] [PubMed] [Green Version]
- Louis, D.N.; Perry, A.; Reifenberger, G.; von Deimling, A.; Figarella-Branger, D.; Cavenee, W.K.; Ohgaki, H.; Wiestler, O.D.; Kleihues, P.; Ellison, D.W. The 2016 World Health Organization Classification of Tumors of the Central Nervous System: A summary. Acta Neuropathol. 2016, 131, 803–820. [Google Scholar] [CrossRef] [PubMed] [Green Version]
- Stringfield, O.; Arrington, J.A.; Johnston, S.K.; Rognin, N.G.; Peeri, N.C.; Balagurunathan, Y.; Jackson, P.R.; Clark-Swanson, K.R.; Swanson, K.R.; Egan, K.M.; et al. Multiparameter MRI Predictors of Long-Term Survival in Glioblastoma Multiforme. Tomography 2019, 5, 135–144. [Google Scholar] [CrossRef]
- Villanueva-Meyer, J.E.; Mabray, M.C.; Cha, S. Current Clinical Brain Tumor Imaging. Neurosurgery 2017, 81, 397–415. [Google Scholar] [CrossRef] [PubMed] [Green Version]
- Huang, S.; Michalek, J.E.; Reardon, D.A.; Wen, P.Y.; Floyd, J.R.; Fox, P.T.; Clarke, G.D.; Jerabek, P.A.; Schmainda, K.M.; Muzi, M.; et al. Assessment of tumor hypoxia and perfusion in recurrent glioblastoma following bevacizumab failure using MRI and 18F-FMISO PET. Sci. Rep. 2021, 11, 7632. [Google Scholar] [CrossRef] [PubMed]
- Sharpe, M.A.; Ismail, N.; Baskin, D.S. Metabolic sculpting of the mitochondria, cell signaling and the cancer phenotype. Transl. Cancer Res. 2017, 6, S182–S188. [Google Scholar] [CrossRef]
- Krzeslak, A.; Wojcik-Krowiranda, K.; Forma, E.; Jozwiak, P.; Romanowicz, H.; Bienkiewicz, A.; Brys, M. Expression of GLUT1 and GLUT3 glucose transporters in endometrial and breast cancers. Pathol. Oncol. Res. 2012, 18, 721–728. [Google Scholar] [CrossRef] [Green Version]
- Flavahan, W.A.; Wu, Q.; Hitomi, M.; Rahim, N.; Kim, Y.; Sloan, A.E.; Weil, R.J.; Nakano, I.; Sarkaria, J.N.; Stringer, B.W.; et al. Brain Tumor Initiating Cells Adapt to Restricted Nutrition through Preferential Glucose Uptake. Nat. Neurosci. 2013, 16, 1373–1382. [Google Scholar] [CrossRef]
- Masin, M.; Vazquez, J.; Rossi, S.; Groeneveld, S.; Samson, N.; Schwalie, P.C.; Deplancke, B.; Frawley, L.E.; Gouttenoire, J.; Moradpour, D.; et al. GLUT3 is induced during epithelial-mesenchymal transition and promotes tumor cell proliferation in non-small cell lung cancer. Cancer Metab. 2014, 2, 11. [Google Scholar] [CrossRef] [Green Version]
- Luo, X.; Xu, S.; Zhong, Y.; Tu, T.; Xu, Y.; Li, X.; Wang, B.; Yang, F. High gene expression levels of VEGFA and CXCL8 in the peritumoral brain zone are associated with the recurrence of glioblastoma: A bioinformatics analysis. Oncol. Lett. 2019, 18, 6171–6179. [Google Scholar] [CrossRef] [Green Version]
- Shen, G.M.; Zhao, Y.Z.; Chen, M.T.; Zhang, F.L.; Liu, X.L.; Wang, Y.; Liu, C.Z.; Yu, J.; Zhang, J.W. Hypoxia-inducible factor-1 (HIF-1) promotes LDL and VLDL uptake through inducing VLDLR under hypoxia. Biochem. J. 2012, 441, 675–683. [Google Scholar] [CrossRef] [PubMed]
- Masoud, G.N.; Li, W. HIF-1α pathway: Role, regulation and intervention for cancer therapy. Acta Pharm. Sin. B 2015, 5, 378–389. [Google Scholar] [CrossRef] [Green Version]
- Krzywinska, E.; Stockmann, C. Hypoxia, Metabolism and Immune Cell Function. Biomedicines 2018, 6, 56. [Google Scholar] [CrossRef] [PubMed] [Green Version]
- Mi, Y.; Guo, N.; Luan, J.; Cheng, J.; Hu, Z.; Jiang, P.; Jin, W.; Gao, X. The Emerging Role of Myeloid-Derived Suppressor Cells in the Glioma Immune Suppressive Microenvironment. Front. Immunol. 2020, 11, 737. [Google Scholar] [CrossRef] [PubMed]
- Bayik, D.; Zhou, Y.; Park, C.; Hong, C.; Vail, D.; Silver, D.J.; Lauko, A.; Roversi, G.; Watson, D.C.; Lo, A.; et al. Myeloid-Derived Suppressor Cell Subsets Drive Glioblastoma Growth in a Sex-Specific Manner. Cancer Discov. 2020, 10, 1210–1225. [Google Scholar] [CrossRef] [Green Version]
- Landry, A.P.; Balas, M.; Alli, S.; Spears, J.; Zador, Z. Distinct regional ontogeny and activation of tumor associated macrophages in human glioblastoma. Sci. Rep. 2020, 10, 19542. [Google Scholar] [CrossRef]
- Takenaka, M.C.; Gabriely, G.; Rothhammer, V.; Mascanfroni, I.D.; Wheeler, M.A.; Chao, C.-C.; Gutiérrez-Vázquez, C.; Kenison, J.; Tjon, E.C.; Barroso, A.; et al. Control of tumor-associated macrophages and T cells in glioblastoma via AHR and CD39. Nat. Neurosci. 2019, 22, 729–740. [Google Scholar] [CrossRef]
- Miska, J.; Rashidi, A.; Chang, A.L.; Muroski, M.E.; Han, Y.; Zhang, L.; Lesniak, M.S. Anti-GITR therapy promotes immunity against malignant glioma in a murine model. Cancer Immunol. Immunother. 2016, 65, 1555–1567. [Google Scholar] [CrossRef]
- Sayour, E.J.; McLendon, P.; McLendon, R.; De Leon, G.; Reynolds, R.; Kresak, J.; Sampson, J.H.; Mitchell, D.A. Increased proportion of FoxP3+ regulatory T cells in tumor infiltrating lymphocytes is associated with tumor recurrence and reduced survival in patients with glioblastoma. Cancer Immunol. Immunother. 2015, 64, 419–427. [Google Scholar] [CrossRef] [PubMed]
- Sieow, J.L.; Gun, S.Y.; Wong, S.C. The Sweet Surrender: How Myeloid Cell Metabolic Plasticity Shapes the Tumor Microenvironment. Front. Cell Dev. Biol. 2018, 6, 168. [Google Scholar] [CrossRef] [PubMed] [Green Version]
- Guo, X.Y.; Zhang, G.H.; Wang, Z.N.; Duan, H.; Xie, T.; Liang, L.; Cui, R.; Hu, H.R.; Wu, Y.; Dong, J.J.; et al. A novel Foxp3-related immune prognostic signature for glioblastoma multiforme based on immunogenomic profiling. Aging 2021, 13, 3501–3517. [Google Scholar] [CrossRef] [PubMed]
- Liu, F.; Huang, J.; Liu, X.; Cheng, Q.; Luo, C.; Liu, Z. CTLA-4 correlates with immune and clinical characteristics of glioma. Cancer Cell Int. 2020, 20, 7. [Google Scholar] [CrossRef]
- Aslan, K.; Turco, V.; Blobner, J.; Sonner, J.K.; Liuzzi, A.R.; Núñez, N.G.; De Feo, D.; Kickingereder, P.; Fischer, M.; Green, E.; et al. Heterogeneity of response to immune checkpoint blockade in hypermutated experimental gliomas. Nat. Commun. 2020, 11, 931. [Google Scholar] [CrossRef] [Green Version]
- Patel, M.A.; Kim, J.E.; Theodros, D.; Tam, A.; Velarde, E.; Kochel, C.M.; Francica, B.; Nirschl, T.R.; Ghasemzadeh, A.; Mathios, D.; et al. Agonist anti-GITR monoclonal antibody and stereotactic radiation induce immune-mediated survival advantage in murine intracranial glioma. J. Immunother. Cancer 2016, 4, 28. [Google Scholar] [CrossRef] [Green Version]
- Takashima, Y.; Kawaguchi, A.; Hayano, A.; Yamanaka, R. CD276 and the gene signature composed of GATA3 and LGALS3 enable prognosis prediction of glioblastoma multiforme. PLoS ONE 2019, 14, e0216825. [Google Scholar] [CrossRef]
- Ayyoub, M.; Deknuydt, F.; Raimbaud, I.; Dousset, C.; Leveque, L.; Bioley, G.; Valmori, D. Human memory FOXP3+ Tregs secrete IL-17 ex vivo and constitutively express the T(H)17 lineage-specific transcription factor RORgamma t. Proc. Natl. Acad. Sci. USA 2009, 106, 8635–8640. [Google Scholar] [CrossRef] [Green Version]
- Yang, B.H.; Hagemann, S.; Mamareli, P.; Lauer, U.; Hoffmann, U.; Beckstette, M.; Föhse, L.; Prinz, I.; Pezoldt, J.; Suerbaum, S.; et al. Foxp3+ T cells expressing RORγt represent a stable regulatory T-cell effector lineage with enhanced suppressive capacity during intestinal inflammation. Mucosal Immunol. 2016, 9, 444–457. [Google Scholar] [CrossRef]
- Weaver, C.T.; Hatton, R.D. Interplay between the TH17 and TReg cell lineages: A (co-)evolutionary perspective. Nat. Rev. Immunol. 2009, 9, 883–889. [Google Scholar] [CrossRef]
- Herrnstadt, G.R.; Steinmetz, O.M. The role of Treg subtypes in glomerulonephritis. Cell Tissue Res. 2020. [Google Scholar] [CrossRef]
- Kluger, M.A.; Meyer, M.C.; Nosko, A.; Goerke, B.; Luig, M.; Wegscheid, C.; Tiegs, G.; Stahl, R.A.; Panzer, U.; Steinmetz, O.M. RORγt(+)Foxp3(+) Cells are an Independent Bifunctional Regulatory T Cell Lineage and Mediate Crescentic GN. J. Am. Soc. Nephrol. 2016, 27, 454–465. [Google Scholar] [CrossRef] [Green Version]
- Le Tortorec, A.; Matusali, G.; Mahé, D.; Aubry, F.; Mazaud-Guittot, S.; Houzet, L.; Dejucq-Rainsford, N. From Ancient to Emerging Infections: The Odyssey of Viruses in the Male Genital Tract. Physiol. Rev. 2020, 100, 1349–1414. [Google Scholar] [CrossRef]
- Teles, A.; Schumacher, A.; Kühnle, M.; Linzke, N.; Thuere, C.; Reichardt, P.; Tadokoro, C.; Hämmerling, G.; Zenclussen, A. Control of Uterine Microenvironment by Foxp3+ Cells Facilitates Embryo Implantation. Front. Immunol. 2013, 4, 158. [Google Scholar] [CrossRef] [PubMed] [Green Version]
- He, S.M.; Xing, F.Q.; Sui, H.; Wang, Y.L.; Mai, X.F.; Luo, Z.Q.; Chen, X.Q.; Chen, G.H.; Kong, Z.J. [CA 125 expression in cervical and vaginal secretions in women in normal reproductive period]. Nan Fang Yi Ke Da Xue Xue Bao 2010, 30, 173–175. [Google Scholar] [PubMed]
- Tavmergen, E.; Sendag, F.; Goker, E.N.T.; Levi, R. Value of serum CA-125 concentrations as predictors of pregnancy in assisted reproduction cycles. Hum. Reprod. 2001, 16, 1129–1134. [Google Scholar] [CrossRef] [PubMed] [Green Version]
- Geva, E.; Arava, J.; Lerner-Geva, L.; Hareuveni, M.; Lessing, J.B.; Ballas, S.; Amit, A. The ratio between carcinoma antigen-125 levels in the seminal plasma and serum may be a marker for fertilization in intracytoplasmic sperm injection. Fertil. Steril. 1997, 68, 1120–1124. [Google Scholar] [CrossRef]
- Reinartz, S.R.; Pfisterer, J.; du Bois, A.; Jackisch, C.; Baumann, K.H.; Wagner, U. Suppressive activity rather than frequency of FoxP3(+) regulatory T cells is essential for CA-125-specific T-cell activation after abagovomab treatment. Hum. Immunol. 2010, 71, 36–44. [Google Scholar] [CrossRef]
- Pinget, G.V.; Corpuz, T.M.; Stolp, J.; Lousberg, E.L.; Diener, K.R.; Robertson, S.A.; Sprent, J.; Webster, K.E. The majority of murine γδ T cells at the maternal–fetal interface in pregnancy produce IL-17. Immunol. Cell Biol. 2016, 94, 623–630. [Google Scholar] [CrossRef] [PubMed] [Green Version]
- Gallino, L.; Hauk, V.; Fernández, L.; Soczewski, E.; Gori, S.; Grasso, E.; Calo, G.; Saraco, N.; Berensztein, E.; Waschek, J.A.; et al. VIP Promotes Recruitment of Tregs to the Uterine–Placental Interface During the Peri-Implantation Period to Sustain a Tolerogenic Microenvironment. Front. Immunol. 2020, 10, 2907. [Google Scholar] [CrossRef]
- Robertson, S.A.; Care, A.S.; Moldenhauer, L.M. Regulatory T cells in embryo implantation and the immune response to pregnancy. J. Clin. Investig. 2018, 128, 4224–4235. [Google Scholar] [CrossRef] [Green Version]
- Wilharm, A.; Brigas, H.C.; Sandrock, I.; Ribeiro, M.; Amado, T.; Reinhardt, A.; Demera, A.; Hoenicke, L.; Strowig, T.; Carvalho, T.; et al. Microbiota-dependent expansion of testicular IL-17-producing Vγ6+ γδ T cells upon puberty promotes local tissue immune surveillance. Mucosal Immunol. 2021, 14, 242–252. [Google Scholar] [CrossRef] [PubMed]
- Franke, F.; Kraus, S.; Pauls, K.; Lalani, E.-N.; Bergmann, M. MUC1 in normal and impaied spermatogenesis. Mol. Hum. Reprod. 2001, 7, 505–512. [Google Scholar] [CrossRef] [PubMed]
- Russo, C.L.; Spurr-Michaud, S.; Tisdale, A.; Pudney, J.; Anderson, D.; Gipson, I.K. Mucin gene expression in human male urogenital tract epithelia. Hum. Reprod. 2006, 21, 2783–2793. [Google Scholar] [CrossRef] [PubMed] [Green Version]
- Shin, B.; Benavides, G.A.; Geng, J.; Koralov, S.B.; Hu, H.; Darley-Usmar, V.M.; Harrington, L.E. Mitochondrial Oxidative Phosphorylation Regulates the Fate Decision between Pathogenic Th17 and Regulatory T Cells. Cell Rep. 2020, 30, 1898–1909.e4. [Google Scholar] [CrossRef] [PubMed] [Green Version]
- Zheng, L.; Kelly, C.J.; Colgan, S.P. Physiologic hypoxia and oxygen homeostasis in the healthy intestine. A Review in the Theme: Cellular Responses to Hypoxia. Am. J. Physiol. Cell Physiol. 2015, 309, C350–C360. [Google Scholar] [CrossRef] [PubMed] [Green Version]
- Bohlen, H.G. Intestinal mucosal oxygenation influences absorptive hyperemia. Am. J. Physiol. 1980, 239, H489–H493. [Google Scholar] [CrossRef]
- Dominguez, J.M.; Davis, R.T.; McCullough, D.J.; Stabley, J.N.; Behnke, B.J. Aging and exercise training reduce testes microvascular PO2 and alter vasoconstrictor responsiveness in testicular arterioles. Am. J. Physiol. Regul. Integr. Comp. Physiol. 2011, 301, R801–R810. [Google Scholar] [CrossRef] [Green Version]
- Movsas, B.; Chapman, J.D.; Hanlon, A.L.; Horwitz, E.M.; Greenberg, R.E.; Stobbe, C.; Hanks, G.E.; Pollack, A. Hypoxic prostate/muscle po2 ratio predicts for biochemical failure in patients with prostate cancer: Preliminary findings. Urology 2002, 60, 634–639. [Google Scholar] [CrossRef]
- Fukuda, M.; Fukuda, K.; Ranoux, C. Unexpected low oxygen tension of intravaginal culture. Hum. Reprod. 1996, 11, 1293–1295. [Google Scholar] [CrossRef] [Green Version]
- Rashad, A.L.; Toffler, W.L.; Wolf, N.; Thornburg, K.; Kirk, E.P.; Ellis, G.; Whitehead, W.E. Vaginal PO2 in healthy women and in women infected with Trichomonas vaginalis: Potential implications for metronidazole therapy. Am. J. Obs. Gynecol. 1992, 166, 620–624. [Google Scholar] [CrossRef]
- Hill, D.R.; Brunner, M.E.; Schmitz, D.C.; Davis, C.C.; Flood, J.A.; Schlievert, P.M.; Wang-Weigand, S.Z.; Osborn, T.W. In vivo assessment of human vaginal oxygen and carbon dioxide levels during and post menses. J. Appl. Physiol. 2005, 99, 1582–1591. [Google Scholar] [CrossRef] [PubMed]
- McKeown, S.R. Defining normoxia, physoxia and hypoxia in tumours-implications for treatment response. Br. J. Radiol. 2014, 87, 20130676. [Google Scholar] [CrossRef] [PubMed] [Green Version]
- Vaupel, P.; Höckel, M.; Mayer, A. Detection and characterization of tumor hypoxia using pO2 histography. Antioxid. Redox Signal. 2007, 9, 1221–1235. [Google Scholar] [CrossRef] [PubMed]
- Pinacho-Garcia, L.M.; Valdez, R.A.; Navarrete, A.; Cabeza, M.; Segovia, J.; Romano, M.C. The effect of finasteride and dutasteride on the synthesis of neurosteroids by glioblastoma cells. Steroids 2020, 155, 108556. [Google Scholar] [CrossRef] [PubMed]
- Orozco, M.; Valdez, R.A.; Ramos, L.; Cabeza, M.; Segovia, J.; Romano, M.C. Dutasteride combined with androgen receptor antagonists inhibit glioblastoma U87 cell metabolism, proliferation, and invasion capacity: Androgen regulation. Steroids 2020, 164, 108733. [Google Scholar] [CrossRef]
- Chuang, J.Y.; Lo, W.L.; Ko, C.Y.; Chou, S.Y.; Chen, R.M.; Chang, K.Y.; Hung, J.J.; Su, W.C.; Chang, W.C.; Hsu, T.I. Upregulation of CYP17A1 by Sp1-mediated DNA demethylation confers temozolomide resistance through DHEA-mediated protection in glioma. Oncogenesis 2017, 6, e339. [Google Scholar] [CrossRef] [Green Version]
- Lin, H.Y.; Ko, C.Y.; Kao, T.J.; Yang, W.B.; Tsai, Y.T.; Chuang, J.Y.; Hu, S.L.; Yang, P.Y.; Lo, W.L.; Hsu, T.I. CYP17A1 Maintains the Survival of Glioblastomas by Regulating SAR1-Mediated Endoplasmic Reticulum Health and Redox Homeostasis. Cancers 2019, 11, 1378. [Google Scholar] [CrossRef] [PubMed] [Green Version]
- Rižner, T.L.; Penning, T.M. Role of aldo-keto reductase family 1 (AKR1) enzymes in human steroid metabolism. Steroids 2014, 79, 49–63. [Google Scholar] [CrossRef] [Green Version]
- Hernández-Vega, A.M.; Del Moral-Morales, A.; Zamora-Sánchez, C.J.; Piña-Medina, A.G.; González-Arenas, A.; Camacho-Arroyo, I. Estradiol Induces Epithelial to Mesenchymal Transition of Human Glioblastoma Cells. Cells 2020, 9, 1930. [Google Scholar] [CrossRef]
- Zhao, N.; Wang, F.; Ahmed, S.; Liu, K.; Zhang, C.; Cathcart, S.J.; DiMaio, D.J.; Punsoni, M.; Guan, B.; Zhou, P.; et al. Androgen Receptor, Although Not a Specific Marker For, Is a Novel Target to Suppress Glioma Stem Cells as a Therapeutic Strategy for Glioblastoma. Front. Oncol. 2021, 11, 1696. [Google Scholar]
- Adurthi, S.; Kumar, M.M.; Vinodkumar, H.S.; Mukherjee, G.; Krishnamurthy, H.; Acharya, K.K.; Bafna, U.D.; Uma, D.K.; Abhishekh, B.; Krishna, S.; et al. Oestrogen Receptor-α binds the FOXP3 promoter and modulates regulatory T-cell function in human cervical cancer. Sci. Rep. 2017, 7, 17289. [Google Scholar] [CrossRef] [PubMed]
- Ishikawa, A.; Wada, T.; Nishimura, S.; Ito, T.; Okekawa, A.; Onogi, Y.; Watanabe, E.; Sameshima, A.; Tanaka, T.; Tsuneki, H.; et al. Estrogen regulates sex-specific localization of regulatory T cells in adipose tissue of obese female mice. PLoS ONE 2020, 15, e0230885. [Google Scholar] [CrossRef] [PubMed]
- Mjösberg, J.; Svensson, J.; Johansson, E.; Hellström, L.; Casas, R.; Jenmalm, M.C.; Boij, R.; Matthiesen, L.; Jönsson, J.I.; Berg, G.; et al. Systemic reduction of functionally suppressive CD4dimCD25highFoxp3+ Tregs in human second trimester pregnancy is induced by progesterone and 17beta-estradiol. J. Immunol. 2009, 183, 759–769. [Google Scholar] [CrossRef] [Green Version]
- Zhu, M.L.; Bakhru, P.; Conley, B.; Nelson, J.S.; Free, M.; Martin, A.; Starmer, J.; Wilson, E.M.; Su, M.A. Sex bias in CNS autoimmune disease mediated by androgen control of autoimmune regulator. Nat. Commun. 2016, 7, 11350. [Google Scholar] [CrossRef] [PubMed]
- Walecki, M.; Eisel, F.; Klug, J.; Baal, N.; Paradowska-Dogan, A.; Wahle, E.; Hackstein, H.; Meinhardt, A.; Fijak, M. Androgen receptor modulates Foxp3 expression in CD4+CD25+Foxp3+ regulatory T-cells. Mol. Biol. Cell 2015, 26, 2845–2857. [Google Scholar] [CrossRef]
- Consiglio, C.R.; Udartseva, O.; Ramsey, K.D.; Bush, C.; Gollnick, S.O. Enzalutamide, an Androgen Receptor Antagonist, Enhances Myeloid Cell-Mediated Immune Suppression and Tumor Progression. Cancer Immunol. Res. 2020, 8, 1215–1227. [Google Scholar] [CrossRef]
- Sharpe, M.A.; Ijare, O.B.; Baskin, D.S.; Baskin, A.M.; Baskin, B.N.; Pichumani, K. The Leloir Cycle in Glioblastoma: Galactose Scavenging and Metabolic Remodeling. Cancers 2021, 13, 1815. [Google Scholar] [CrossRef]
- Shraibman, B.; Barnea, E.; Kadosh, D.M.; Haimovich, Y.; Slobodin, G.; Rosner, I.; López-Larrea, C.; Hilf, N.; Kuttruff, S.; Song, C.; et al. Identification of Tumor Antigens Among the HLA Peptidomes of Glioblastoma Tumors and Plasma. Mol. Cell. Proteom. 2018, 17, 2132–2145. [Google Scholar] [CrossRef] [Green Version]
- Akiyama, Y.; Komiyama, M.; Miyata, H.; Yagoto, M.; Ashizawa, T.; Iizuka, A.; Oshita, C.; Kume, A.; Nogami, M.; Ito, I.; et al. Novel cancer-testis antigen expression on glioma cell lines derived from high-grade glioma patients. Oncol. Rep. 2014, 31, 1683–1690. [Google Scholar] [CrossRef]
- Freitas, M.; Malheiros, S.; Stávale, J.N.; Biassi, T.P.; Zamunér, F.T.; de Souza Begnami, M.; Soares, F.A.; Vettore, A.L. Expression of cancer/testis antigens is correlated with improved survival in glioblastoma. Oncotarget 2013, 4, 636–646. [Google Scholar] [CrossRef] [PubMed] [Green Version]
- Sreekanthreddy, P.; Srinivasan, H.; Kumar, D.M.; Nijaguna, M.B.; Sridevi, S.; Vrinda, M.; Arivazhagan, A.; Balasubramaniam, A.; Hegde, A.S.; Chandramouli, B.A.; et al. Identification of potential serum biomarkers of glioblastoma: Serum osteopontin levels correlate with poor prognosis. Cancer Epidemiol. Biomark. Prev. 2010, 19, 1409–1422. [Google Scholar] [CrossRef] [Green Version]
- Jones, K.; Ballesteros, A.; Mentink-Kane, M.; Warren, J.; Rattila, S.; Malech, H.; Kang, E.; Dveksler, G. PSG9 Stimulates Increase in FoxP3+ Regulatory T-Cells through the TGF-β1 Pathway. PLoS ONE 2016, 11, e0158050. [Google Scholar] [CrossRef] [PubMed]
- Timganova, V.P.; Zamorina, S.A.; Litvinova, L.S.; Todosenko, N.M.; Bochkova, M.S.; Khramtsov, P.V.; Rayev, M.B. The effects of human pregnancy-specific β1-glycoprotein preparation on Th17 polarization of CD4+ cells and their cytokine profile. BMC Immunol. 2020, 21, 56. [Google Scholar] [CrossRef]
- Zheng, B. Expression and clinical importance of a newly discovered alternative splice variant of the gene for acrosin binding protein found in human brain tumors. Asian Biomed. 2020, 14, 243–252. [Google Scholar] [CrossRef]
- Li, X.; Yan, J.; Fan, R.; Luo, B.; Zhang, Q.; Lin, Y.; Zhou, S.; Luo, G.; Xie, X.; Xiao, S. Serum immunoreactivity of cancer/testis antigen OY-TES-1 and its tissues expression in glioma. Oncol. Lett. 2017, 13, 3080–3086. [Google Scholar] [CrossRef] [Green Version]
- Redzovic, A.; Laskarin, G.; Dominovic, M.; Haller, H.; Rukavina, D. Mucins Help to Avoid Alloreactivity at the Maternal Fetal Interface. Clin. Dev. Immunol. 2013, 2013, 542152. [Google Scholar] [CrossRef] [PubMed]
- Wei, X.; Xu, H.; Kufe, D. MUC1 Oncoprotein Stabilizes and Activates Estrogen Receptor α. Mol. Cell 2006, 21, 295–305. [Google Scholar] [CrossRef]
- Meseguer, M.; Aplin, J.D.; Caballero-Campo, P.; O’Connor, J.E.; Martín, J.C.; Remohí, J.; Pellicer, A.; Simón, C. Human Endometrial Mucin MUC1 Is Up-Regulated by Progesterone and Down-Regulated In Vitro by the Human Blastocyst1. Biol. Reprod. 2001, 64, 590–601. [Google Scholar] [CrossRef] [Green Version]
- Aubert, S.; Fauquette, V.; Hémon, B.; Lepoivre, R.; Briez, N.; Bernard, D.; Van Seuningen, I.; Leroy, X.; Perrais, M. MUC1, a New Hypoxia Inducible Factor Target Gene, Is an Actor in Clear Renal Cell Carcinoma Tumor Progression. Cancer Res. 2009, 69, 5707. [Google Scholar] [CrossRef] [Green Version]
- Pyzer, A.R.; Stroopinsky, D.; Rajabi, H.; Washington, A.; Tagde, A.; Coll, M.; Fung, J.; Bryant, M.P.; Cole, L.; Palmer, K.; et al. MUC1-mediated induction of myeloid-derived suppressor cells in patients with acute myeloid leukemia. Blood 2017, 129, 1791–1801. [Google Scholar] [CrossRef] [PubMed] [Green Version]
- Kim, S.; Seo, Y.; Chowdhury, T.; Yu, H.J.; Lee, C.E.; Kim, K.-M.; Kang, H.; Kim, H.J.; Park, S.-J.; Kim, K.; et al. Inhibition of MUC1 exerts cell-cycle arrest and telomerase suppression in glioblastoma cells. Sci. Rep. 2020, 10, 18238. [Google Scholar] [CrossRef]
- Phillips, H.S.; Kharbanda, S.; Chen, R.; Forrest, W.F.; Soriano, R.H.; Wu, T.D.; Misra, A.; Nigro, J.M.; Colman, H.; Soroceanu, L.; et al. Molecular subclasses of high-grade glioma predict prognosis, delineate a pattern of disease progression, and resemble stages in neurogenesis. Cancer Cell 2006, 9, 157–173. [Google Scholar] [CrossRef] [Green Version]
- Verhaak, R.G.; Hoadley, K.A.; Purdom, E.; Wang, V.; Qi, Y.; Wilkerson, M.D.; Miller, C.R.; Ding, L.; Golub, T.; Mesirov, J.P.; et al. Integrated genomic analysis identifies clinically relevant subtypes of glioblastoma characterized by abnormalities in PDGFRA, IDH1, EGFR, and NF1. Cancer Cell 2010, 17, 98–110. [Google Scholar] [CrossRef] [PubMed] [Green Version]
- Teo, W.-Y.; Sekar, K.; Seshachalam, P.; Shen, J.; Chow, W.-Y.; Lau, C.C.; Yang, H.; Park, J.; Kang, S.-G.; Li, X.; et al. Relevance of a TCGA-derived Glioblastoma Subtype Gene-Classifier among Patient Populations. Sci. Rep. 2019, 9, 7442. [Google Scholar] [CrossRef]
- Bowman, R.L.; Wang, Q.; Carro, A.; Verhaak, R.G.W.; Squatrito, M. GlioVis data portal for visualization and analysis of brain tumor expression datasets. Neuro Oncol. 2017, 19, 139–141. [Google Scholar] [CrossRef] [PubMed] [Green Version]
- Ohue, Y.; Nishikawa, H. Regulatory T (Treg) cells in cancer: Can Treg cells be a new therapeutic target? Cancer Sci. 2019, 110, 2080–2089. [Google Scholar] [CrossRef] [PubMed]
- Knee, D.A.; Hewes, B.; Brogdon, J.L. Rationale for anti-GITR cancer immunotherapy. Eur. J. Cancer 2016, 67, 1–10. [Google Scholar] [CrossRef] [Green Version]
- Kim, B.-S.; Lu, H.; Ichiyama, K.; Chen, X.; Zhang, Y.-B.; Mistry, N.A.; Tanaka, K.; Lee, Y.-H.; Nurieva, R.; Zhang, L.; et al. Generation of RORγt(+) Antigen-Specific T Regulatory 17 Cells from Foxp3(+) Precursors in Autoimmunity. Cell Rep. 2017, 21, 195–207. [Google Scholar] [CrossRef] [Green Version]
- Wohlfert, E.A.; Grainger, J.R.; Bouladoux, N.; Konkel, J.E.; Oldenhove, G.; Ribeiro, C.H.; Hall, J.A.; Yagi, R.; Naik, S.; Bhairavabhotla, R.; et al. GATA3 controls Foxp3⁺ regulatory T cell fate during inflammation in mice. J. Clin. Investig. 2011, 121, 4503–4515. [Google Scholar] [CrossRef]
- Ho, I.C.; Tai, T.-S.; Pai, S.-Y. GATA3 and the T-cell lineage: Essential functions before and after T-helper-2-cell differentiation. Nat. Rev. Immunol. 2009, 9, 125–135. [Google Scholar] [CrossRef] [Green Version]
- Sousa, C.; Golebiewska, A.; Poovathingal, S.K.; Kaoma, T.; Pires-Afonso, Y.; Martina, S.; Coowar, D.; Azuaje, F.; Skupin, A.; Balling, R.; et al. Single-cell transcriptomics reveals distinct inflammation-induced microglia signatures. EMBO Rep. 2018, 19, e46171. [Google Scholar] [CrossRef]
- Kuo, L.-C.; Cheng, L.-C.; Lee, C.-H.; Lin, C.-J.; Chen, P.-Y.; Li, L.-A. Estrogen and cigarette sidestream smoke particulate matter exhibit ERα-dependent tumor-promoting effects in lung adenocarcinoma cells. Am. J. Physiol. Lung Cell. Mol. Physiol. 2017, 313, L477–L490. [Google Scholar] [CrossRef]
- Dassen, H.; Punyadeera, C.; Kamps, R.; Klomp, J.; Dunselman, G.; Dijcks, F.; de Goeij, A.; Ederveen, A.; Groothuis, P. Progesterone regulation of implantation-related genes: New insights into the role of oestrogen. Cell. Mol. Life Sci. 2007, 64, 1009–1032. [Google Scholar] [CrossRef] [PubMed] [Green Version]
- Droog, M.; Nevedomskaya, E.; Kim, Y.; Severson, T.; Flach, K.D.; Opdam, M.; Schuurman, K.; Gradowska, P.; Hauptmann, M.; Dackus, G.; et al. Comparative Cistromics Reveals Genomic Cross-talk between FOXA1 and ERα in Tamoxifen-Associated Endometrial Carcinomas. Cancer Res. 2016, 76, 3773–3784. [Google Scholar] [CrossRef] [PubMed] [Green Version]
- Chan, H.J.; Li, H.; Liu, Z.; Yuan, Y.C.; Mortimer, J.; Chen, S. SERPINA1 is a direct estrogen receptor target gene and a predictor of survival in breast cancer patients. Oncotarget 2015, 6, 25815–25827. [Google Scholar] [CrossRef] [PubMed] [Green Version]
- Li, Q.; He, H.; Zhang, Y.-L.; Li, X.-M.; Guo, X.; Huo, R.; Bi, Y.; Li, J.; Fan, H.-Y.; Sha, J. Phosphoinositide 3-kinase p110δ mediates estrogen- and FSH-stimulated ovarian follicle growth. Mol. Endocrinol. 2013, 27, 1468–1482. [Google Scholar] [CrossRef] [PubMed] [Green Version]
- Du, M.J.; Chen, X.D.; Zhou, X.L.; Wan, Y.J.; Lan, B.; Zhang, C.Z.; Cao, Y. Estrogen induces Vav1 expression in human breast cancer cells. PLoS ONE 2014, 9, e99052. [Google Scholar] [CrossRef]
- Zhao, Z.; Zhang, K.-N.; Wang, Q.; Li, G.; Zeng, F.; Zhang, Y.; Wu, F.; Chai, R.; Wang, Z.; Zhang, C.; et al. Chinese Glioma Genome Atlas (CGGA): A Comprehensive Resource with Functional Genomic Data from Chinese Gliomas. Genom. Proteom. Bioinform. 2021, 9, 1–12. [Google Scholar] [CrossRef]
- Gravendeel, L.A.M.; Kouwenhoven, M.C.M.; Gevaert, O.; de Rooi, J.J.; Stubbs, A.P.; Duijm, J.E.; Daemen, A.; Bleeker, F.E.; Bralten, L.B.C.; Kloosterhof, N.K.; et al. Intrinsic Gene Expression Profiles of Gliomas Are a Better Predictor of Survival than Histology. Cancer Res. 2009, 69, 9065. [Google Scholar] [CrossRef] [Green Version]
- Cassetta, L.; Baekkevold, E.S.; Brandau, S.; Bujko, A.; Cassatella, M.A.; Dorhoi, A.; Krieg, C.; Lin, A.; Loré, K.; Marini, O.; et al. Deciphering myeloid-derived suppressor cells: Isolation and markers in humans, mice and non-human primates. Cancer Immunol. Immunother. CII 2019, 68, 687–697. [Google Scholar] [CrossRef] [Green Version]
- Jave-Suarez, L.F.; Langbein, L.; Winter, H.; Praetzel, S.; Rogers, M.A.; Schweizer, J. Androgen regulation of the human hair follicle: The type I hair keratin hHa7 is a direct target gene in trichocytes. J. Investig. Derm. 2004, 122, 555–564. [Google Scholar] [CrossRef] [PubMed] [Green Version]
- Burkart, M.F.; Wren, J.D.; Herschkowitz, J.I.; Perou, C.M.; Garner, H.R. Clustering microarray-derived gene lists through implicit literature relationships. Bioinformatics 2007, 23, 1995–2003. [Google Scholar] [CrossRef] [Green Version]
- Chu, F.; Mason, K.E.; Anex, D.S.; Jones, A.D.; Hart, B.R. Hair Proteome Variation at Different Body Locations on Genetically Variant Peptide Detection for Protein-Based Human Identification. Sci. Rep. 2019, 9, 7641. [Google Scholar] [CrossRef] [PubMed]
- Yoshida, H.; Taguchi, H.; Kitahara, T.; Takema, Y.; Visscher, M.O.; Schweizer, J.; Langbein, L. Keratins of the human occipital hair medulla: Androgenic regulation of in vitro hair keratin K37 expression. Br. J. Derm. 2013, 169, 218–221. [Google Scholar] [CrossRef] [PubMed]
- Ke, X.; Chen, C.; Song, Y.; Cai, Q.; Li, J.; Tang, Y.; Han, X.; Qu, W.; Chen, A.; Wang, H.; et al. Hypoxia modifies the polarization of macrophages and their inflammatory microenvironment, and inhibits malignant behavior in cancer cells. Oncol. Lett. 2019, 18, 5871–5878. [Google Scholar] [CrossRef] [Green Version]
- Canciello, A.; Russo, V.; Berardinelli, P.; Bernabò, N.; Muttini, A.; Mattioli, M.; Barboni, B. Progesterone prevents epithelial-mesenchymal transition of ovine amniotic epithelial cells and enhances their immunomodulatory properties. Sci. Rep. 2017, 7, 3761. [Google Scholar] [CrossRef] [PubMed] [Green Version]
- Liu, Z.; Zhang, H.; Ding, S.; Qi, S.; Liu, S.; Sun, D.; Dong, W.; Yin, L.; Li, M.; Zhao, X.; et al. βKlotho inhibits androgen/androgen receptor-associated epithelial-mesenchymal transition in prostate cancer through inactivation of ERK1/2 signaling. Oncol. Rep. 2018, 40, 217–225. [Google Scholar] [CrossRef] [Green Version]
- Velez-Perez, A.; Holder, M.K.; Fountain, S.; Blaustein, J.D. Estradiol Increases Microglial Response to Lipopolysaccharide in the Ventromedial Hypothalamus during the Peripubertal Sensitive Period in Female Mice. Eneuro 2020, 7, 0505-19. [Google Scholar] [CrossRef]
- Contreras-Zárate, M.J.; Cittelly, D.M. Sex steroid hormone function in the brain niche: Implications for brain metastatic colonization and progression. Cancer Rep. 2020, e1241. [Google Scholar] [CrossRef]
- Aryanpour, R.; Pasbakhsh, P.; Zibara, K.; Namjoo, Z.; Beigi Boroujeni, F.; Shahbeigi, S.; Kashani, I.R.; Beyer, C.; Zendehdel, A. Progesterone therapy induces an M1 to M2 switch in microglia phenotype and suppresses NLRP3 inflammasome in a cuprizone-induced demyelination mouse model. Int. Immunopharmacol. 2017, 51, 131–139. [Google Scholar] [CrossRef]
- Yao, P.-L.; Zhuo, S.; Mei, H.; Chen, X.-F.; Li, N.; Zhu, T.-F.; Chen, S.-T.; Wang, J.-M.; Hou, R.-X.; Le, Y.-Y. Androgen alleviates neurotoxicity of β-amyloid peptide (Aβ) by promoting microglial clearance of Aβ and inhibiting microglial inflammatory response to Aβ. CNS Neurosci. Ther. 2017, 23, 855–865. [Google Scholar] [CrossRef] [PubMed]
- Su, E.J.; Ernst, L.; Abdallah, N.; Chatterton, R.; Xin, H.; Monsivais, D.; Coon, J.; Bulun, S.E. Estrogen receptor-β and fetoplacental endothelial prostanoid biosynthesis: A link to clinically demonstrated fetal growth restriction. J. Clin. Endocrinol. Metab. 2011, 96, E1558–E1567. [Google Scholar] [CrossRef] [PubMed] [Green Version]
- Tamura, M.; Deb, S.; Sebastian, S.; Okamura, K.; Bulun, S.E. Estrogen up-regulates cyclooxygenase-2 via estrogen receptor in human uterine microvascular endothelial cells. Fertil. Steril. 2004, 81, 1351–1356. [Google Scholar] [CrossRef] [PubMed]
- Cianciaruso, C.; Beltraminelli, T.; Duval, F.; Nassiri, S.; Hamelin, R.; Mozes, A.; Gallart-Ayala, H.; Ceada Torres, G.; Torchia, B.; Ries, C.H.; et al. Molecular Profiling and Functional Analysis of Macrophage-Derived Tumor Extracellular Vesicles. Cell Rep. 2019, 27, 3062–3080.e11. [Google Scholar] [CrossRef] [Green Version]
- Dou, C.; Ding, N.; Zhao, C.; Hou, T.; Kang, F.; Cao, Z.; Liu, C.; Bai, Y.; Dai, Q.; Ma, Q.; et al. Estrogen Deficiency-Mediated M2 Macrophage Osteoclastogenesis Contributes to M1/M2 Ratio Alteration in Ovariectomized Osteoporotic Mice. J. Bone Miner. Res. 2018, 33, 899–908. [Google Scholar] [CrossRef] [PubMed] [Green Version]
- Tsai, Y.C.; Tseng, J.T.; Wang, C.Y.; Su, M.T.; Huang, J.Y.; Kuo, P.L. Medroxyprogesterone acetate drives M2 macrophage differentiation toward a phenotype of decidual macrophage. Mol. Cell. Endocrinol. 2017, 452, 74–83. [Google Scholar] [CrossRef] [PubMed]
- Lang, Q.; Yidong, X.; Xueguang, Z.; Sixian, W.; Wenming, X.; Tao, Z. ETA-mediated anti-TNF-α therapy ameliorates the phenotype of PCOS model induced by letrozole. PLoS ONE 2019, 14, e0217495. [Google Scholar] [CrossRef]
- Korbecki, J.; Olbromski, M.; Dzięgiel, P. CCL18 in the Progression of Cancer. Int. J. Mol. Sci. 2020, 21, 7955. [Google Scholar] [CrossRef]
- Tung, K.S.K.; Harakal, J.; Qiao, H.; Rival, C.; Li, J.C.H.; Paul, A.G.A.; Wheeler, K.; Pramoonjago, P.; Grafer, C.M.; Sun, W.; et al. Egress of sperm autoantigen from seminiferous tubules maintains systemic tolerance. J. Clin. Investig. 2017, 127, 1046–1060. [Google Scholar] [CrossRef] [Green Version]
- Rival, C.; Wheeler, K.; Jeffrey, S.; Qiao, H.; Luu, B.; Tewalt, E.F.; Engelhard, V.H.; Tardif, S.; Hardy, D.; del Rio, R.; et al. Regulatory T cells and vasectomy. J. Reprod. Immunol. 2013, 100, 66–75. [Google Scholar] [CrossRef] [Green Version]
- Wheeler, K.; Tardif, S.; Rival, C.; Luu, B.; Bui, E.; Del Rio, R.; Teuscher, C.; Sparwasser, T.; Hardy, D.; Tung, K.S. Regulatory T cells control tolerogenic versus autoimmune response to sperm in vasectomy. Proc. Natl. Acad. Sci. USA 2011, 108, 7511. [Google Scholar] [CrossRef] [Green Version]
- Kessler, D.L.; Smith, W.D.; Hamilton, M.S.; Berger, R.E. Infertility in mice after unilateral vasectomy. Fertil. Steril. 1985, 43, 308–312. [Google Scholar] [CrossRef]
- Tung, K.S.; Cooke, W.D., Jr.; McCarty, T.A.; Robitaille, P. Human sperm antigens and antisperm antibodies. II. Age-related incidence of antisperm antibodies. Clin. Exp. Immunol. 1976, 25, 73–79. [Google Scholar]
- Mancini, R.E.; Andrada, J.A.; Saraceni, D.; Bachmann, A.E.; Lavieri, J.C.; Nemirovsky, M. Immunological and testicular response in man sensitized with human testicular homogenate. J. Clin. Endocrinol. Metab. 1965, 25, 859–875. [Google Scholar] [CrossRef]
- Taguchi, O.; Nishizuka, Y. Experimental autoimmune orchitis after neonatal thymectomy in the mouse. Clin. Exp. Immunol. 1981, 46, 425–434. [Google Scholar]
- Wong, A. The Molecular Evolution of Animal Reproductive Tract Proteins: What Have We Learned from Mating-System Comparisons? Int. J. Evol. Biol. 2011, 2011, 908735. [Google Scholar] [CrossRef] [Green Version]
- Mahata, B.; Pramanik, J.; van der Weyden, L.; Polanski, K.; Kar, G.; Riedel, A.; Chen, X.; Fonseca, N.A.; Kundu, K.; Campos, L.S.; et al. Tumors induce de novo steroid biosynthesis in T cells to evade immunity. Nat. Commun. 2020, 11, 3588. [Google Scholar] [CrossRef] [PubMed]
- The Cancer Genome Atlas Research Network. Comprehensive genomic characterization defines human glioblastoma genes and core pathways. Nature 2008, 455, 1061–1068. [Google Scholar] [CrossRef] [PubMed]
- Yanguas-Casás, N. Physiological sex differences in microglia and their relevance in neurological disorders. Neuroimmunol. Neuroinflamm. 2020, 7, 13–22. [Google Scholar] [CrossRef]
- Penning, T.M. Aldo-Keto Reductase (AKR) 1C3 inhibitors: A patent review. Expert Opin. Pat. 2017, 27, 1329–1340. [Google Scholar] [CrossRef]
- Shibuya, R.; Suzuki, T.; Miki, Y.; Yoshida, K.; Moriya, T.; Ono, K.; Akahira, J.; Ishida, T.; Hirakawa, H.; Evans, D.B.; et al. Intratumoral concentration of sex steroids and expression of sex steroid-producing enzymes in ductal carcinoma in situ of human breast. Endocr. Relat. Cancer 2008, 15, 113–124. [Google Scholar] [CrossRef] [Green Version]
- Zhou, J.; Wang, Y.; Wu, D.; Wang, S.; Chen, Z.; Xiang, S.; Chan, F.L. Orphan nuclear receptors as regulators of intratumoral androgen biosynthesis in castration-resistant prostate cancer. Oncogene 2021, 40, 2625–2634. [Google Scholar] [CrossRef] [PubMed]
- Kamrath, C.; Hochberg, Z.; Hartmann, M.F.; Remer, T.; Wudy, S.A. Increased activation of the alternative “backdoor” pathway in patients with 21-hydroxylase deficiency: Evidence from urinary steroid hormone analysis. J. Clin. Endocrinol. Metab. 2012, 97, E367–E375. [Google Scholar] [CrossRef] [Green Version]
- Chang, K.-H.; Li, R.; Papari-Zareei, M.; Watumull, L.; Zhao, Y.D.; Auchus, R.J.; Sharifi, N. Dihydrotestosterone synthesis bypasses testosterone to drive castration-resistant prostate cancer. Proc. Natl. Acad. Sci. USA 2011, 108, 13728–13733. [Google Scholar] [CrossRef] [Green Version]
- Cai, C.; Balk, S.P. Intratumoral androgen biosynthesis in prostate cancer pathogenesis and response to therapy. Endocr. Relat. Cancer 2011, 18, R175–R182. [Google Scholar] [CrossRef] [PubMed] [Green Version]
- Mohler, J.L.; Titus, M.A.; Wilson, E.M. Potential prostate cancer drug target: Bioactivation of androstanediol by conversion to dihydrotestosterone. Clin. Cancer Res. 2011, 17, 5844–5849. [Google Scholar] [CrossRef] [PubMed] [Green Version]
- Oksala, R.; Karimaa, M.; Simola, O.; Ramela, M.; Riikonen, R.; Vehmaan-Kreula, P.; Rummakko, P.; Wohlfahrt, G.; Kallio, P.; Mustonen, M.V.J. CYP11A1 inhibition as a therapeutic approach for the treatment of castration resistant prostate cancer. J. Clin. Oncol. 2018, 36, 340. [Google Scholar] [CrossRef]
- Dutt, S.S.; Gao, A.C. Molecular mechanisms of castration-resistant prostate cancer progression. Future Oncol. 2009, 5, 1403–1413. [Google Scholar] [CrossRef] [Green Version]
- O’Donnell, A.; Judson, I.; Dowsett, M.; Raynaud, F.; Dearnaley, D.; Mason, M.; Harland, S.; Robbins, A.; Halbert, G.; Nutley, B.; et al. Hormonal impact of the 17alpha-hydroxylase/C(17,20)-lyase inhibitor abiraterone acetate (CB7630) in patients with prostate cancer. Br. J. Cancer 2004, 90, 2317–2325. [Google Scholar] [CrossRef] [PubMed]
- Girish, V.; Vijayalakshmi, A. Affordable image analysis using NIH Image/ImageJ. Indian J. Cancer 2004, 41, 47. [Google Scholar]
- Sharpe, M.A.; Baskin, D.S. Monoamine oxidase B levels are highly expressed in human gliomas and are correlated with the expression of HiF-1α and with transcription factors Sp1 and Sp3. Oncotarget 2016, 7, 3379–3393. [Google Scholar] [CrossRef] [PubMed] [Green Version]
- Carmona, L.M.; Schatz, D.G. New insights into the evolutionary origins of the recombination-activating gene proteins and V(D)J recombination. FEBS J. 2017, 284, 1590–1605. [Google Scholar] [CrossRef] [PubMed]
- Gutcher, I.; Becher, B. APC-derived cytokines and T cell polarization in autoimmune inflammation. J. Clin. Investig. 2007, 117, 1119–1127. [Google Scholar] [CrossRef] [PubMed] [Green Version]
- Zarnitsyna, V.I.; Evavold, B.D.; Schoettle, L.N.; Blattman, J.N.; Antia, R. Estimating the diversity, completeness, and cross-reactivity of the T cell repertoire. Front. Immunol. 2013, 4, 485. [Google Scholar] [CrossRef] [Green Version]
- Mora, T.; Walczak, A.M. How many different clonotypes do immune repertoires contain? Curr. Opin. Syst. Biol. 2019, 18, 104–110. [Google Scholar] [CrossRef]
- Wang, W.; Thomas, R.; Sizova, O.; Su, D.M. Thymic Function Associated With Cancer Development, Relapse, and Antitumor Immunity—A Mini-Review. Front. Immunol. 2020, 11, 773. [Google Scholar] [CrossRef]
- Gotot, J.; Gottschalk, C.; Leopold, S.; Knolle, P.A.; Yagita, H.; Kurts, C.; Ludwig-Portugall, I. Regulatory T cells use programmed death 1 ligands to directly suppress autoreactive B cells in vivo. Proc. Natl. Acad. Sci. USA 2012, 109, 10468–10473. [Google Scholar] [CrossRef] [Green Version]
- Dal Secco, V.; Riccioli, A.; Padula, F.; Ziparo, E.; Filippini, A. Mouse Sertoli cells display phenotypical and functional traits of antigen-presenting cells in response to interferon gamma. Biol. Reprod. 2008, 78, 234–242. [Google Scholar] [CrossRef] [Green Version]
- Kisand, K.; Peterson, P. Autoimmune polyendocrinopathy candidiasis ectodermal dystrophy: Known and novel aspects of the syndrome. Ann. N. Y. Acad. Sci. 2011, 1246, 77–91. [Google Scholar] [CrossRef]
- O’Donnell, L.; Rebourcet, D.; Dagley, L.F.; Sgaier, R.; Infusini, G.; O’Shaughnessy, P.J.; Chalmel, F.; Fietz, D.; Weidner, W.; Legrand, J.M.D.; et al. Sperm proteins and cancer-testis antigens are released by the seminiferous tubules in mice and men. FASEB J. 2021, 35, e21397. [Google Scholar] [PubMed]
- Fijak, M.; Pilatz, A.; Hedger, M.P.; Nicolas, N.; Bhushan, S.; Michel, V.; Tung, K.S.K.; Schuppe, H.-C.; Meinhardt, A. Infectious, inflammatory and ‘autoimmune’ male factor infertility: How do rodent models inform clinical practice? Hum. Reprod. Update 2018, 24, 416–441. [Google Scholar] [CrossRef] [PubMed] [Green Version]
- Feng, Z.Y.; Ming, W.; Li, L.D.; Louis, J.; Fei, W.Y. Adoptive transfer of murine autoimmune orchitis with sperm-specific T lymphoblasts. Arch. Androl. 1990, 24, 51–59. [Google Scholar] [CrossRef] [Green Version]
- Al-Fahham, A.A. Etiology of Antisperm Antibodies in the Serum of Virgins. Open J. Obstet. Gynecol. 2018, 8, 236–245. [Google Scholar] [CrossRef] [Green Version]
- Mahdi, B.M.; Salih, W.H.; Caitano, A.E.; Kadhum, B.M.; Ibrahim, D.S. Frequency of antisperm antibodies in infertile women. J. Reprod. Infertil. 2011, 12, 261–265. [Google Scholar]
- Robertson, S.A.; Prins, J.R.; Sharkey, D.J.; Moldenhauer, L.M. Seminal Fluid and the Generation of Regulatory T Cells for Embryo Implantation. Am. J. Reprod. Immunol. 2013, 69, 315–330. [Google Scholar] [CrossRef]
- Robertson, S.A.; Guerin, L.R.; Moldenhauer, L.M.; Hayball, J.D. Activating T regulatory cells for tolerance in early pregnancy—The contribution of seminal fluid. J. Reprod. Immunol. 2009, 83, 109–116. [Google Scholar] [CrossRef]
- Remes Lenicov, F.; Rodriguez Rodrigues, C.; Sabatté, J.; Cabrini, M.; Jancic, C.; Ostrowski, M.; Merlotti, A.; Gonzalez, H.; Alonso, A.; Pasqualini, R.A.; et al. Semen Promotes the Differentiation of Tolerogenic Dendritic Cells. J. Immunol. 2012, 189, 4777–4786. [Google Scholar] [CrossRef] [Green Version]
- Remes Lenicov, F.; Paletta, A.L.; Gonzalez Prinz, M.; Varese, A.; Pavillet, C.E.; Lopez Malizia, Á.; Sabatté, J.; Geffner, J.R.; Ceballos, A. Prostaglandin E2 Antagonizes TGF-β Actions During the Differentiation of Monocytes Into Dendritic Cells. Front. Immunol. 2018, 9, 1441. [Google Scholar] [CrossRef] [PubMed] [Green Version]
- Bruno, A.; Mortara, L.; Baci, D.; Noonan, D.M.; Albini, A. Myeloid Derived Suppressor Cells Interactions With Natural Killer Cells and Pro-angiogenic Activities: Roles in Tumor Progression. Front. Immunol. 2019, 10, 771. [Google Scholar] [CrossRef]
- Obermajer, N.; Kalinski, P. Generation of myeloid-derived suppressor cells using prostaglandin E2. Transplant. Res. 2012, 1, 15. [Google Scholar] [CrossRef] [PubMed] [Green Version]
- Bendvold, E.; Gottlieb, C.; Svanborg, K.; Bygdeman, M.; Eneroth, P. Concentration of prostaglandins in seminal fluid of fertile men. Int. J. Androl. 1987, 10, 463–469. [Google Scholar] [CrossRef] [PubMed]
- Sumida, K.; Ohno, Y.; Ohtake, J.; Kaneumi, S.; Kishikawa, T.; Takahashi, N.; Taketomi, A.; Kitamura, H. IL-11 induces differentiation of myeloid-derived suppressor cells through activation of STAT3 signalling pathway. Sci. Rep. 2015, 5, 13650. [Google Scholar] [CrossRef] [PubMed]
- Liu, M.; Li, S.; Li, M.O. TGF-β Control of Adaptive Immune Tolerance: A Break from Treg Cells. BioEssays News Rev. Mol. Cell Dev. Biol. 2018, 40, e1800063. [Google Scholar] [CrossRef]
- Chen, J.C.; Johnson, B.A.; Erikson, D.W.; Piltonen, T.T.; Barragan, F.; Chu, S.; Kohgadai, N.; Irwin, J.C.; Greene, W.C.; Giudice, L.C.; et al. Seminal plasma induces global transcriptomic changes associated with cell migration, proliferation and viability in endometrial epithelial cells and stromal fibroblasts. Hum. Reprod. 2014, 29, 1255–1270. [Google Scholar] [CrossRef] [Green Version]
- Qureshi, O.S.; Zheng, Y.; Nakamura, K.; Attridge, K.; Manzotti, C.; Schmidt, E.M.; Baker, J.; Jeffery, L.E.; Kaur, S.; Briggs, Z.; et al. Trans-endocytosis of CD80 and CD86: A molecular basis for the cell-extrinsic function of CTLA-4. Science 2011, 332, 600–603. [Google Scholar] [CrossRef] [Green Version]
- Kowalczyk, A.; D’Souza, C.A.; Zhang, L. Cell-extrinsic CTLA4-mediated regulation of dendritic cell maturation depends on STAT3. Eur. J. Immunol. 2013, 44, 1143–1155. [Google Scholar] [CrossRef] [PubMed]
- Jørgensen, N.; Persson, G.; Hviid, T.V.F. The Tolerogenic Function of Regulatory T Cells in Pregnancy and Cancer. Front. Immunol. 2019, 10, 911. [Google Scholar] [CrossRef] [PubMed] [Green Version]
- Tsuda, S.; Nakashima, A.; Shima, T.; Saito, S. New Paradigm in the Role of Regulatory T Cells during Pregnancy. Front. Immunol. 2019, 10, 573. [Google Scholar] [CrossRef] [Green Version]
- Baskin, M.J. Temporary sterilization by the injection of human spermatozoa. A preliminary report. Am. J. Obstet. Gynecol. 1932, 24, 892–897. [Google Scholar] [CrossRef]
- Kaur, K.; Prabha, V. Immunocontraceptives: New approaches to fertility control. BioMed Res. Int. 2014, 2014, 868196. [Google Scholar] [CrossRef] [PubMed] [Green Version]
Figure 1.
GBM Patient infiltrating Tregs and HiF Status: Outcome and Characteristics. (A) Color-coded Kaplan–Meier survival curves of GBM patients stratified for high Treg (red), high HiF (blue), high Treg&HiF (violet), and low Treg&HiF, known as ‘neither’ (black), Agilent, CGGA and Gravendeel and U133 databases. All p values are statistically significant, p < 0.05, when compared to the ‘neither’ group, and median overall survival is indicated in months. (B) The distribution of GBM subtypes in the four stratified groups, compared with the global distribution (37% classical, 32% mesenchymal, and 31% proneural), n = 892, as pie charts. Pie charts are color-coded with classical (light blue), mesenchymal (light green) and proneural (burnt orange). p values calculated from utilizing the χ2-test are shown. (C) Pie charts indicating seven markers of interest, n = 892, from normalized transcripts reporting medians. From left to right; HiF and Treg gene baskets validate stratification methodology. Total microglia (MG) are highest in normoxic tumors without Tregs, whereas both inflammation and NF-kB activation markers are elevated in HiF tumors. Myeloid cell marker CD33 is elevated in hypoxic tumors. ACRBP, which cross-correlates with other sperm/testicular-specific proteins, correlates with RORC-Treg infiltration. p < 0.05 in all cases utilizing t-tests. (D) Data from U133 database, examining sex steroid and macrophage phenotypes in stratified groups in the form of pie charts. Androgen reportage (KRT37 transcript levels) associates with RORC-Tregs, whereas hypoxia correlates with estrogen reportage. Macrophage infiltration (ITGAM and CD68) tracks hypoxia, and M2/M1 polarization markers CD163 and ITGAX indicate RORC-Tregs appear to drive M1 > M2. IL10, EBI3 and CCL18 levels are biased toward hypoxic tumors. p < 0.02 in all cases utilizing t-tests. Individual t-test results in Supplemental Table S1.

Figure 2.
Genes correlated with Treg and HiF clusters: the breakdown of gene expression by high Treg expression subtype (left), high HiF expression subtype (right), and high Treg and HiF expression (middle). Genes clustered and highlighted are sperm/testicular proteins, including ACRBP and gestational genes such as PSGs. The androgen-responsive gene KRT37 is associated with Tregs, as are many reproduction-associated genes, including sperm-specific, placental-associated and mucins genes. In contrast, aromatase (CYP19A1), which converts testosterone to estrogen, is associated with hypoxia. Noteworthy too is the HiF association with immunosuppressive M2 macrophage markers, including CD68, CD69, CD163, MS4A4A, and MDSC inducer MUC1. We also observe M2 macrophage cytokines CCL2 and CCL13 and IL10 which can give rise to this polarization in hypoxic GBM.

Figure 3.
GBM Patient Sex Steroid synthesis: Outcome and Characteristics. (A) Kaplan–Meier survival curves of GBM patients with tumors stratified by high androgen/progesterone; low estrogen (red), high estrogen/progesterone; low androgen (violet), high estrogen/androgen production; low progesterone (blue), and overall low steroid production, asteroidogenic (black). All p-values are statistically significant compared to the low group. (B) CMP subtypes of GBMs correlate with androgen, estrogen and progesterone expression. (C) Data from all four databases in the form of pie charts indicating the amount of steroidal influence on seven markers of interest, all statistically significant at p < 0.05 except microglial activation. Estrogenic GBMs have elevated HiF and androgenic GBMs have infiltrating RORC-Treg reporter levels. Estrogenic GBMs are associated with microglial infiltration and NF-κB signaling. Myeloid cell infiltration reporter CD33 tracks estrogen, with a 2:1 ratio of CD33 levels in estrogenic tumors compared with tumors with low estrogen. Sperm-specific ACRBP clearly correlates with androgenic GBM subtypes. (D) U133 database pie charts indicating that androgen and estrogen reporter genes track the steroidogenic stratification. Total macrophage levels are low in androgen and progesterone. Sex steroids clearly affect the M2/M1 polarization, with androgen driving M1 > M2, but estrogen driving M2 > M1. Levels of immunosuppressive IL10 and CCL18 correlate with estrogen, but EIB3 generation is inhibited by androgen. p < 0.02 in all cases utilizing t-tests. Individual t-test results are in Supplemental Table S2.

Figure 4.
Monkey Testicle labeled with Patient Serum. (A) Staining intensity is significantly greater in the GBM than the control serum when brightness is quantified and scaled, nearly sevenfold that of the control, mean and SD boxed, p < 10−10. (B) Labeling of Cynomolgus monkey testicle using serum from control patients. Low levels of anti-sperm/testicular antibodies, and therefore light staining can be observed. (C) The significant staining on Cynomolgus monkey testicle when treated with patient sera indicates the presence of antibodies to testicular germ cells and to sperm at all stages of development. Patient age is atop the images.

Publisher’s Note: MDPI stays neutral with regard to jurisdictional claims in published maps and institutional affiliations. |
© 2021 by the authors. Licensee MDPI, Basel, Switzerland. This article is an open access article distributed under the terms and conditions of the Creative Commons Attribution (CC BY) license (https://creativecommons.org/licenses/by/4.0/).
Share and Cite
MDPI and ACS Style
Sharpe, M.A.; Baskin, D.S.; Jenson, A.V.; Baskin, A.M. Hijacking Sexual Immuno-Privilege in GBM—An Immuno-Evasion Strategy. Int. J. Mol. Sci. 2021, 22, 10983. https://0-doi-org.brum.beds.ac.uk/10.3390/ijms222010983
AMA Style
Sharpe MA, Baskin DS, Jenson AV, Baskin AM. Hijacking Sexual Immuno-Privilege in GBM—An Immuno-Evasion Strategy. International Journal of Molecular Sciences. 2021; 22(20):10983. https://0-doi-org.brum.beds.ac.uk/10.3390/ijms222010983
Chicago/Turabian StyleSharpe, Martyn A., David S. Baskin, Amanda V. Jenson, and Alexandra M. Baskin. 2021. "Hijacking Sexual Immuno-Privilege in GBM—An Immuno-Evasion Strategy" International Journal of Molecular Sciences 22, no. 20: 10983. https://0-doi-org.brum.beds.ac.uk/10.3390/ijms222010983
Note that from the first issue of 2016, this journal uses article numbers instead of page numbers. See further details here.