Article

The Hedgehog-GLI Pathway Regulates MEK5-ERK5 Expression and Activation in Melanoma Cells

1
Department of Experimental and Clinical Biomedical Sciences “Mario Serio”, University of Florence, 50134 Florence, Italy
2
Core Research Laboratory-Institute for Cancer Research and Prevention (ISPRO), 50134 Florence, Italy
*
Authors to whom correspondence should be addressed.
Co-last authors.
Int. J. Mol. Sci. 2021, 22(20), 11259; https://0-doi-org.brum.beds.ac.uk/10.3390/ijms222011259
Submission received: 10 September 2021 / Revised: 8 October 2021 / Accepted: 12 October 2021 / Published: 19 October 2021
(This article belongs to the Special Issue Targeting MAPK in Cancer 2.0)

Abstract

:
Malignant melanoma is the deadliest skin cancer, with a poor prognosis in advanced stages. We recently showed that the extracellular signal-regulated kinase 5 (ERK5), encoded by the MAPK7 gene, plays a pivotal role in melanoma by regulating cell functions necessary for tumour development, such as proliferation. Hedgehog-GLI signalling is constitutively active in melanoma and is required for proliferation. However, no data are available in literature about a possible interplay between Hedgehog-GLI and ERK5 pathways. Here, we show that hyperactivation of the Hedgehog-GLI pathway by genetic inhibition of the negative regulator Patched 1 increases the amount of ERK5 mRNA and protein. Chromatin immunoprecipitation showed that GLI1, the major downstream effector of Hedgehog-GLI signalling, binds to a functional non-canonical GLI consensus sequence at the MAPK7 promoter. Furthermore, we found that ERK5 is required for Hedgehog-GLI-dependent melanoma cell proliferation, and that the combination of GLI and ERK5 inhibitors is more effective than single treatments in reducing cell viability and colony formation ability in melanoma cells. Together, these findings led to the identification of a novel Hedgehog-GLI-ERK5 axis that regulates melanoma cell growth, and shed light on new functions of ERK5, paving the way for new therapeutic options in melanoma and other neoplasms with active Hedgehog-GLI and ERK5 pathways.

Graphical Abstract

1. Introduction

The extracellular signal-regulated kinase 5 (ERK5) is the most recently discovered conventional mitogen-activated protein kinase (MAPK), and is involved in cell survival, anti-apoptotic signalling, proliferation, and differentiation of several cell types [1]. Direct ERK5 activation is classically operated by the upstream MAP2K, MEK5, that has ERK5 as its only known substrate [2] and phosphorylates ERK5 at Thr218/Tyr220 in the conserved threonine–glutamic acid–tyrosine (TEY) motif of the catalytic domain [3]. MEK5-dependent phosphorylation stimulates ERK5 nuclear translocation, a key event for the regulation of cell proliferation [4,5,6]. In recent years, accumulating evidence points to a relevant role of ERK5 in the onset and progression of several types of cancer, including melanoma [7,8].
The Hedgehog-GLI (HH-GLI) signalling pathway plays a pivotal role in controlling growth and tissue patterning during embryogenesis, but it is mostly inactive in adult tissues [9]. Aberrant activation of the HH-GLI pathway is involved in several types of cancer, including melanoma [10,11]. Canonical activation of the HH-GLI pathway is triggered by the binding of HH ligands to the 12-pass transmembrane protein Patched 1 (PTCH1), which releases its inhibition on the 7-pass transmembrane G protein-coupled receptor Smoothened (SMO). As such, active SMO initiates an intracellular signalling cascade that promotes the formation of active GLI zinc-finger transcription factors by releasing GLI2 and GLI3 from the repression of Suppressor of Fused (SUFU), thus preventing the proteolytic processing of GLI2/3. Full length GLI proteins are able to activate the transcription of target genes, including GLI1, which is considered the best read-out of an active HH-GLI pathway. Full length GLI proteins, in particular GLI1 and GLI2, are strong activators of transcription, whereas GLI2 and GLI3 can be converted to C-terminal truncated forms that act as repressors (for reviews, see [12,13,14]). A wealth of studies have also reported non-canonical mechanisms of GLI activation in cancer, which are triggered independently of the upstream PTCH/SMO signalling [15]. The HH-GLI pathway explicates its functions in cancer through the regulation of a variety of target genes that support proliferation, survival, stemness, and metastasis as well as also through the activation of other signalling pathways including MAPK [16].
In this work, we explored whether HH-GLI signalling is involved in ERK5 activation in melanoma, since the connections between these two pathways have not been investigated previously.

2. Results

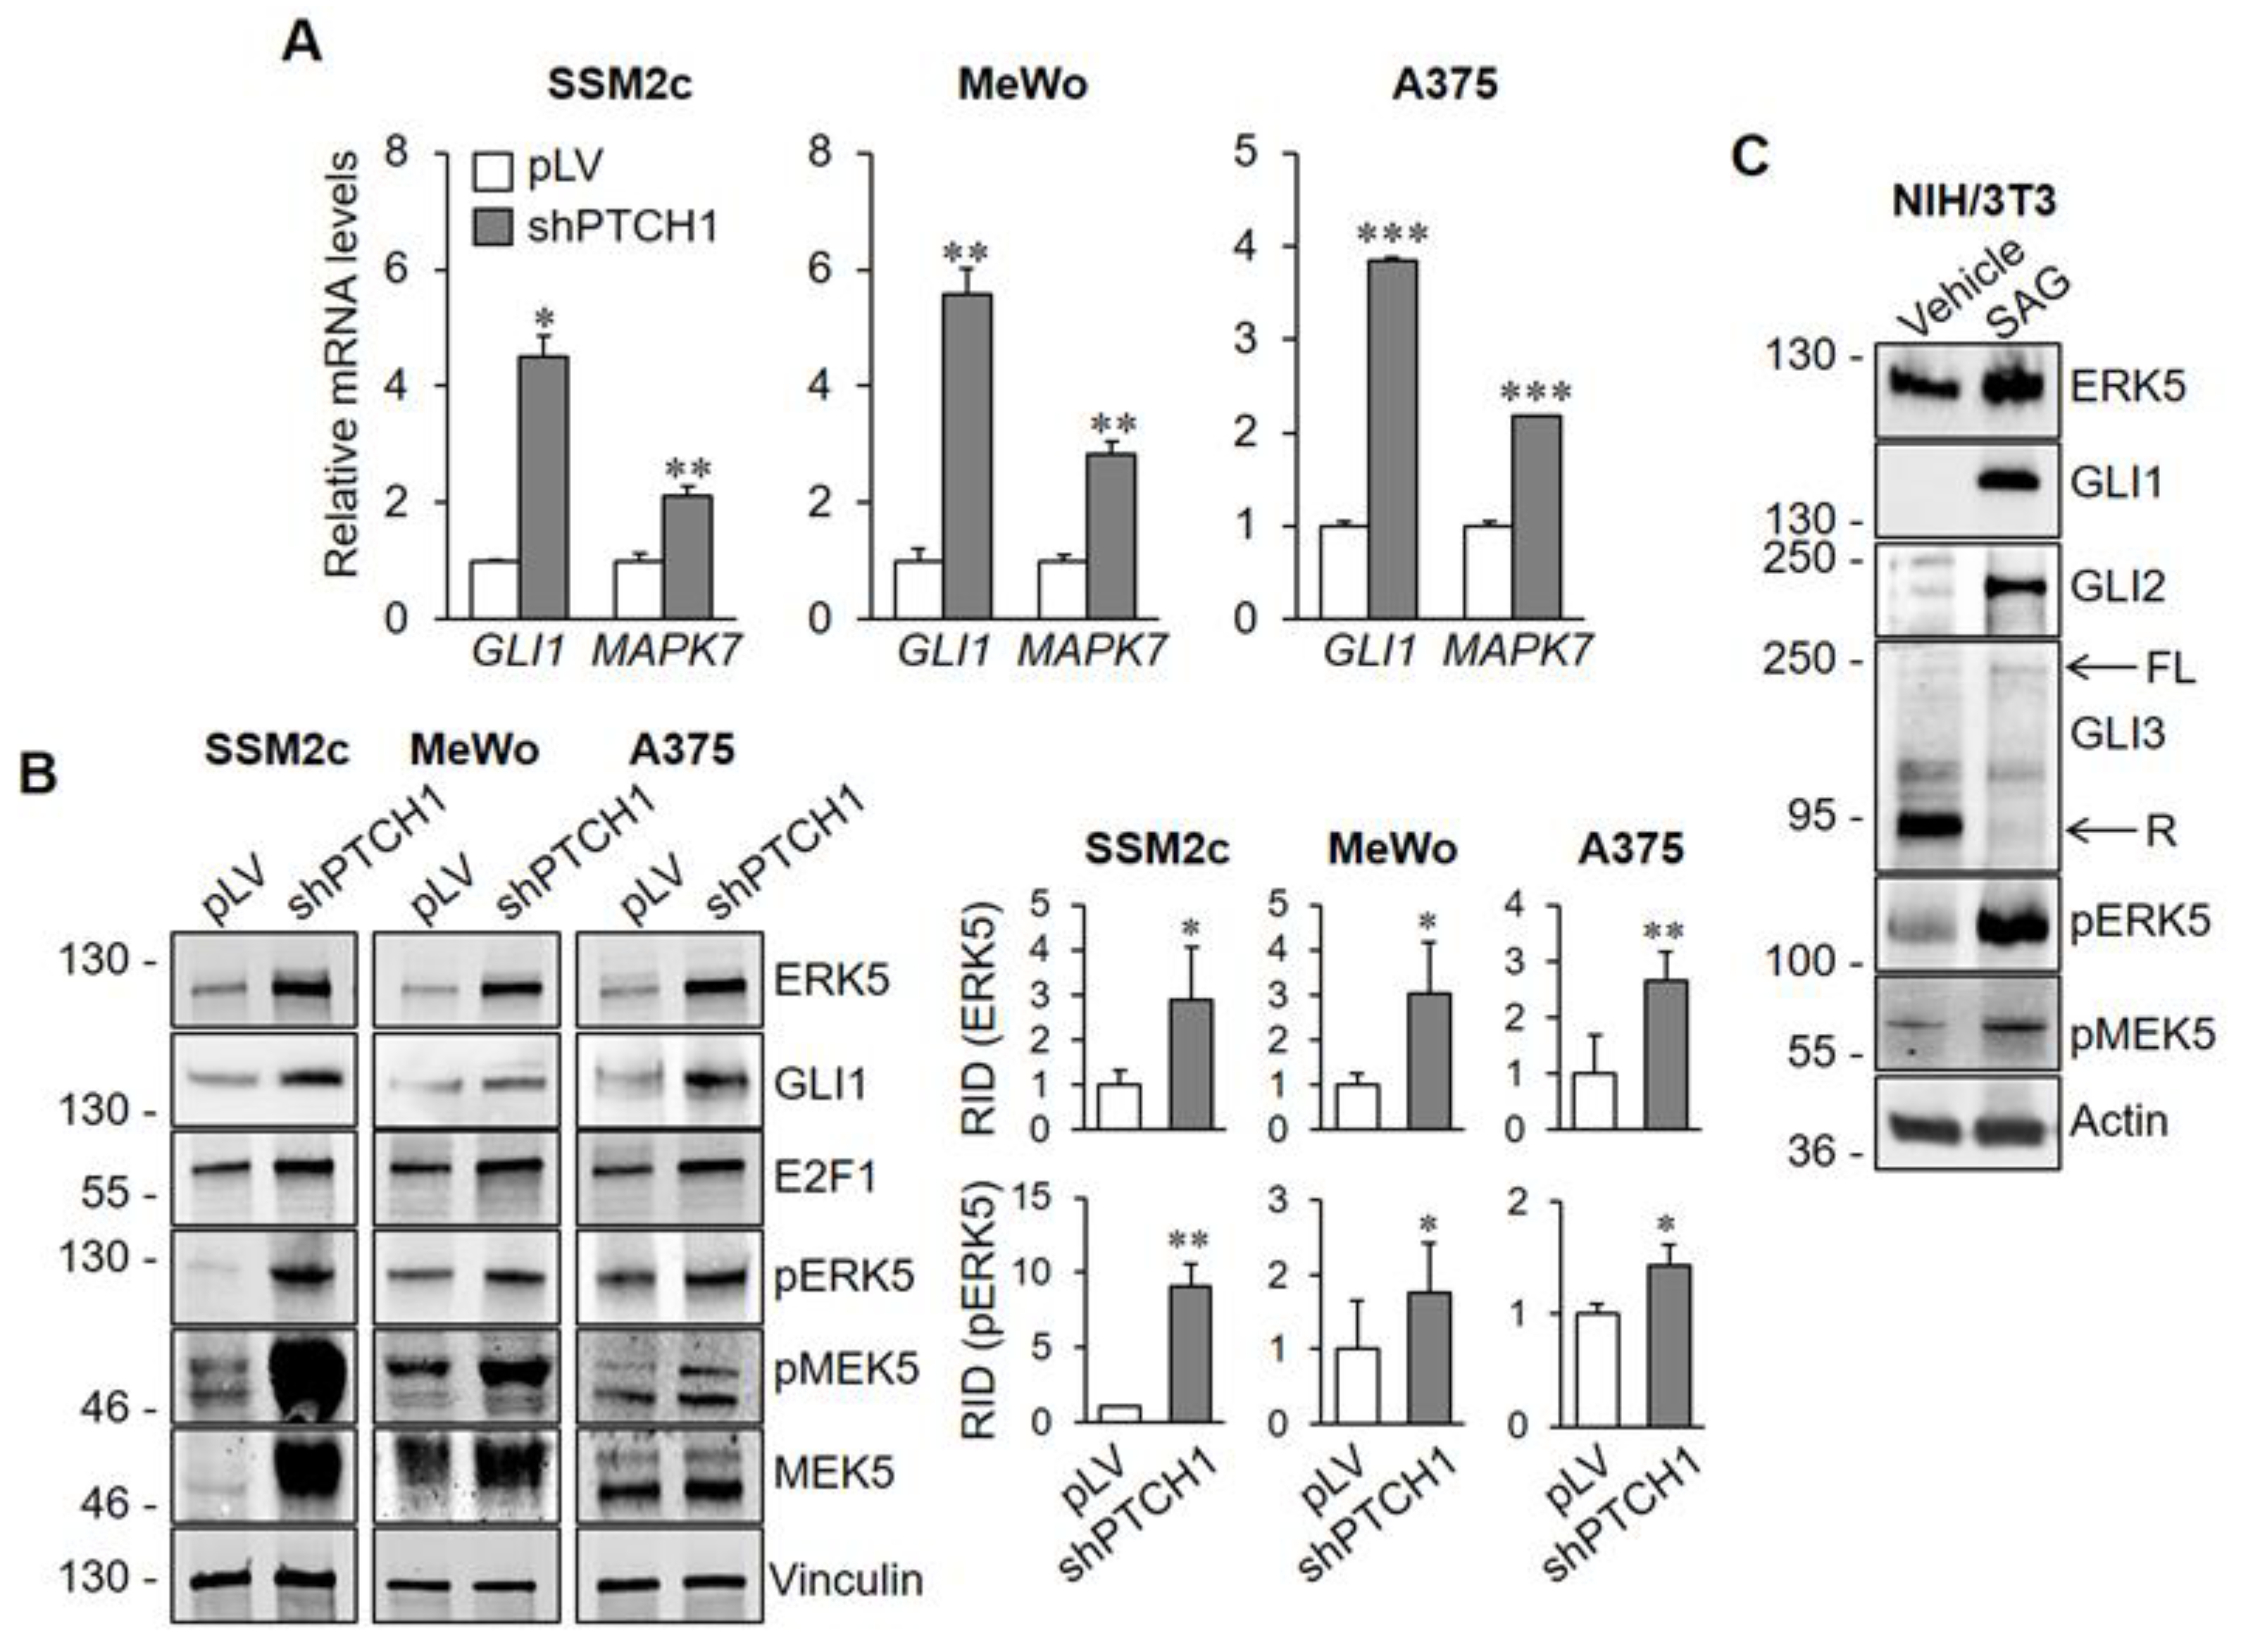
2.1. HH-GLI Signalling Regulates the Amount of ERK5 Protein and mRNA

To investigate whether the HH-GLI pathway modulates ERK5 expression, we activated the HH-GLI pathway in a number of melanoma cell lines by silencing its negative regulator PTCH1 using lentiviral vectors expressing a specific shRNA (shPTCH1). In the above experimental conditions, Q-PCR analysis showed a marked increase of GLI1 and GLI2 mRNA levels, confirming the activation of the HH-GLI pathway (Figure 1A and Supplementary Figure S1). GLI3 mRNA was significantly reduced or was not altered upon PTCH1 silencing (Supplementary Figure S1). Notably, PTCH1 silencing increased the amount of MAPK7 mRNA, the gene encoding for ERK5 protein, compared with cells transduced with control lentiviral vector (pLV) (Figure 1A). Furthermore, activation of the HH-GLI pathway determined a marked increase of ERK5 protein level and phosphorylation at MEK5 consensus residues (i.e., TEY). This phosphorylation was likely due to the increased expression and phosphorylation of MEK5 (Figure 1B).
To further characterize the effects of the HH-GLI pathway on ERK5, we used murine NIH/3T3 cells, an established model for the study of HH-GLI signalling. Activation of the HH-GLI pathway with the SMO agonist SAG [17] determined a robust increase of ERK5 amount (Figure 1C), a marked increase of GLI1 and GLI2 protein levels, as expected, as well as a slight increase in full length GLI3 and a reduction of GLI3 repressor form. These results indicated that the amounts of both ERK5 protein and mRNA are positively regulated by HH-GLI signalling. Furthermore, consistent with the data obtained in melanoma cells, a positive regulation of MEK5 phosphorylation by HH-GLI signalling was observed in NIH/3T3 cells upon SAG treatment (Figure 1C).

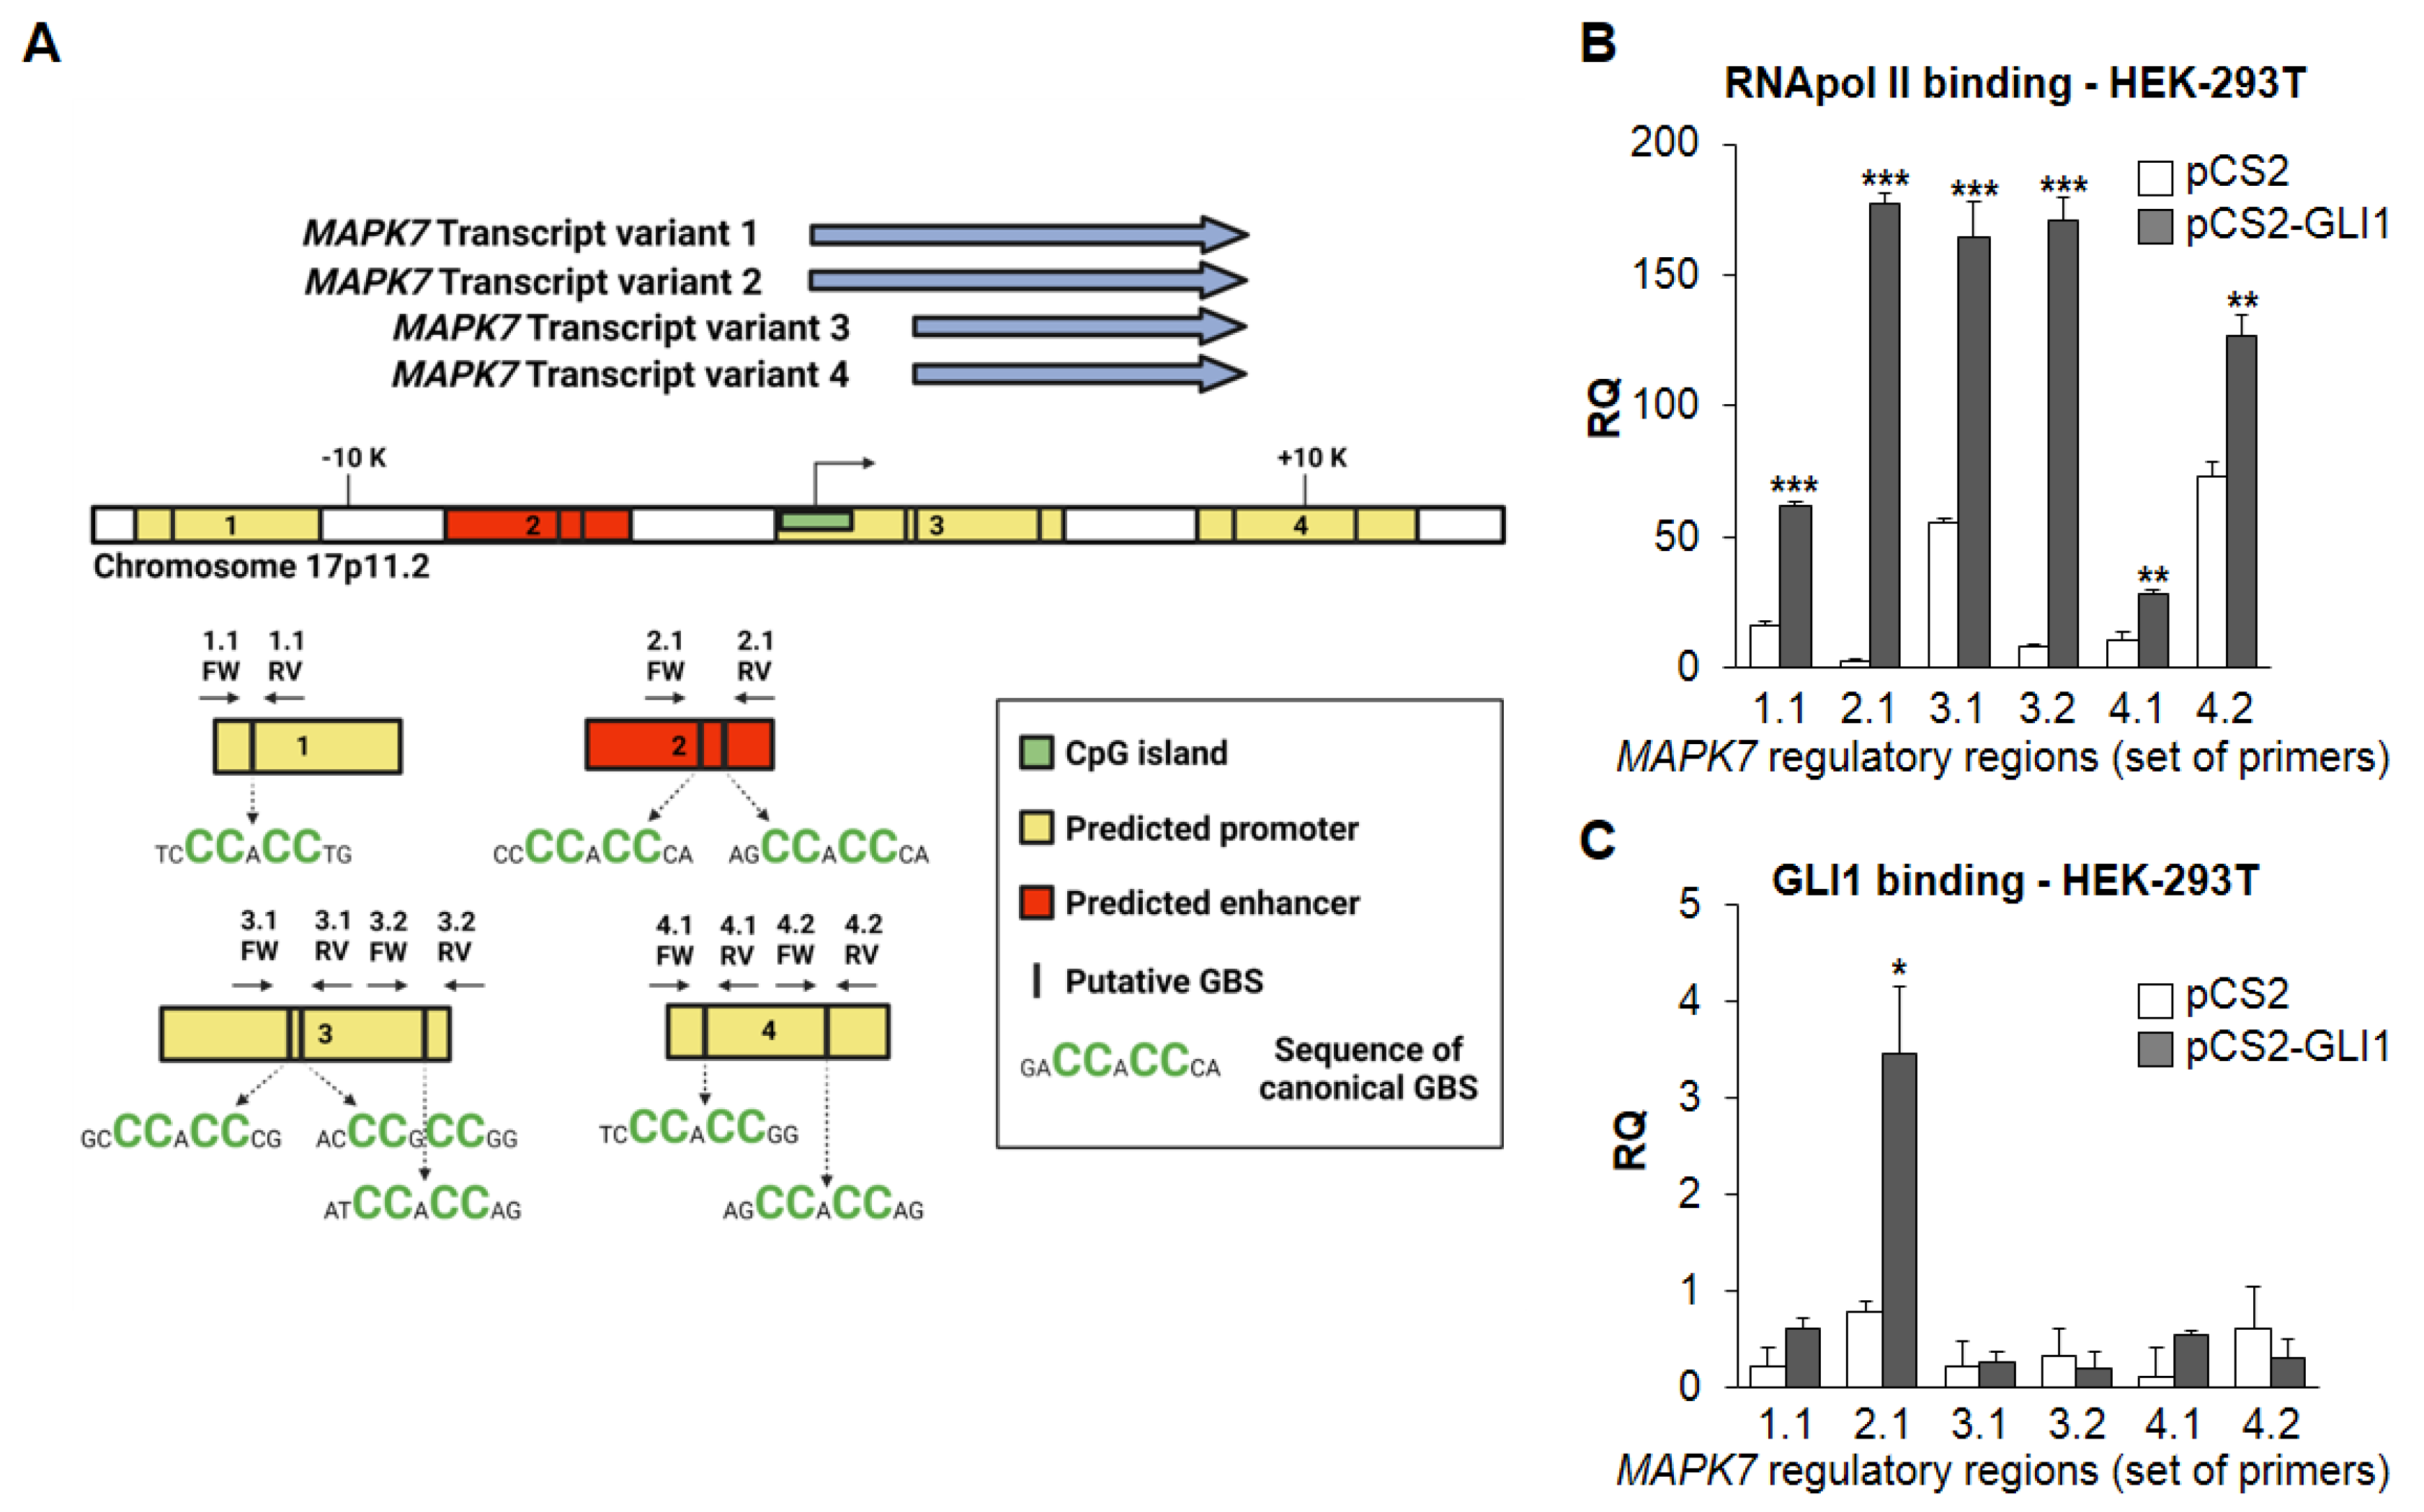
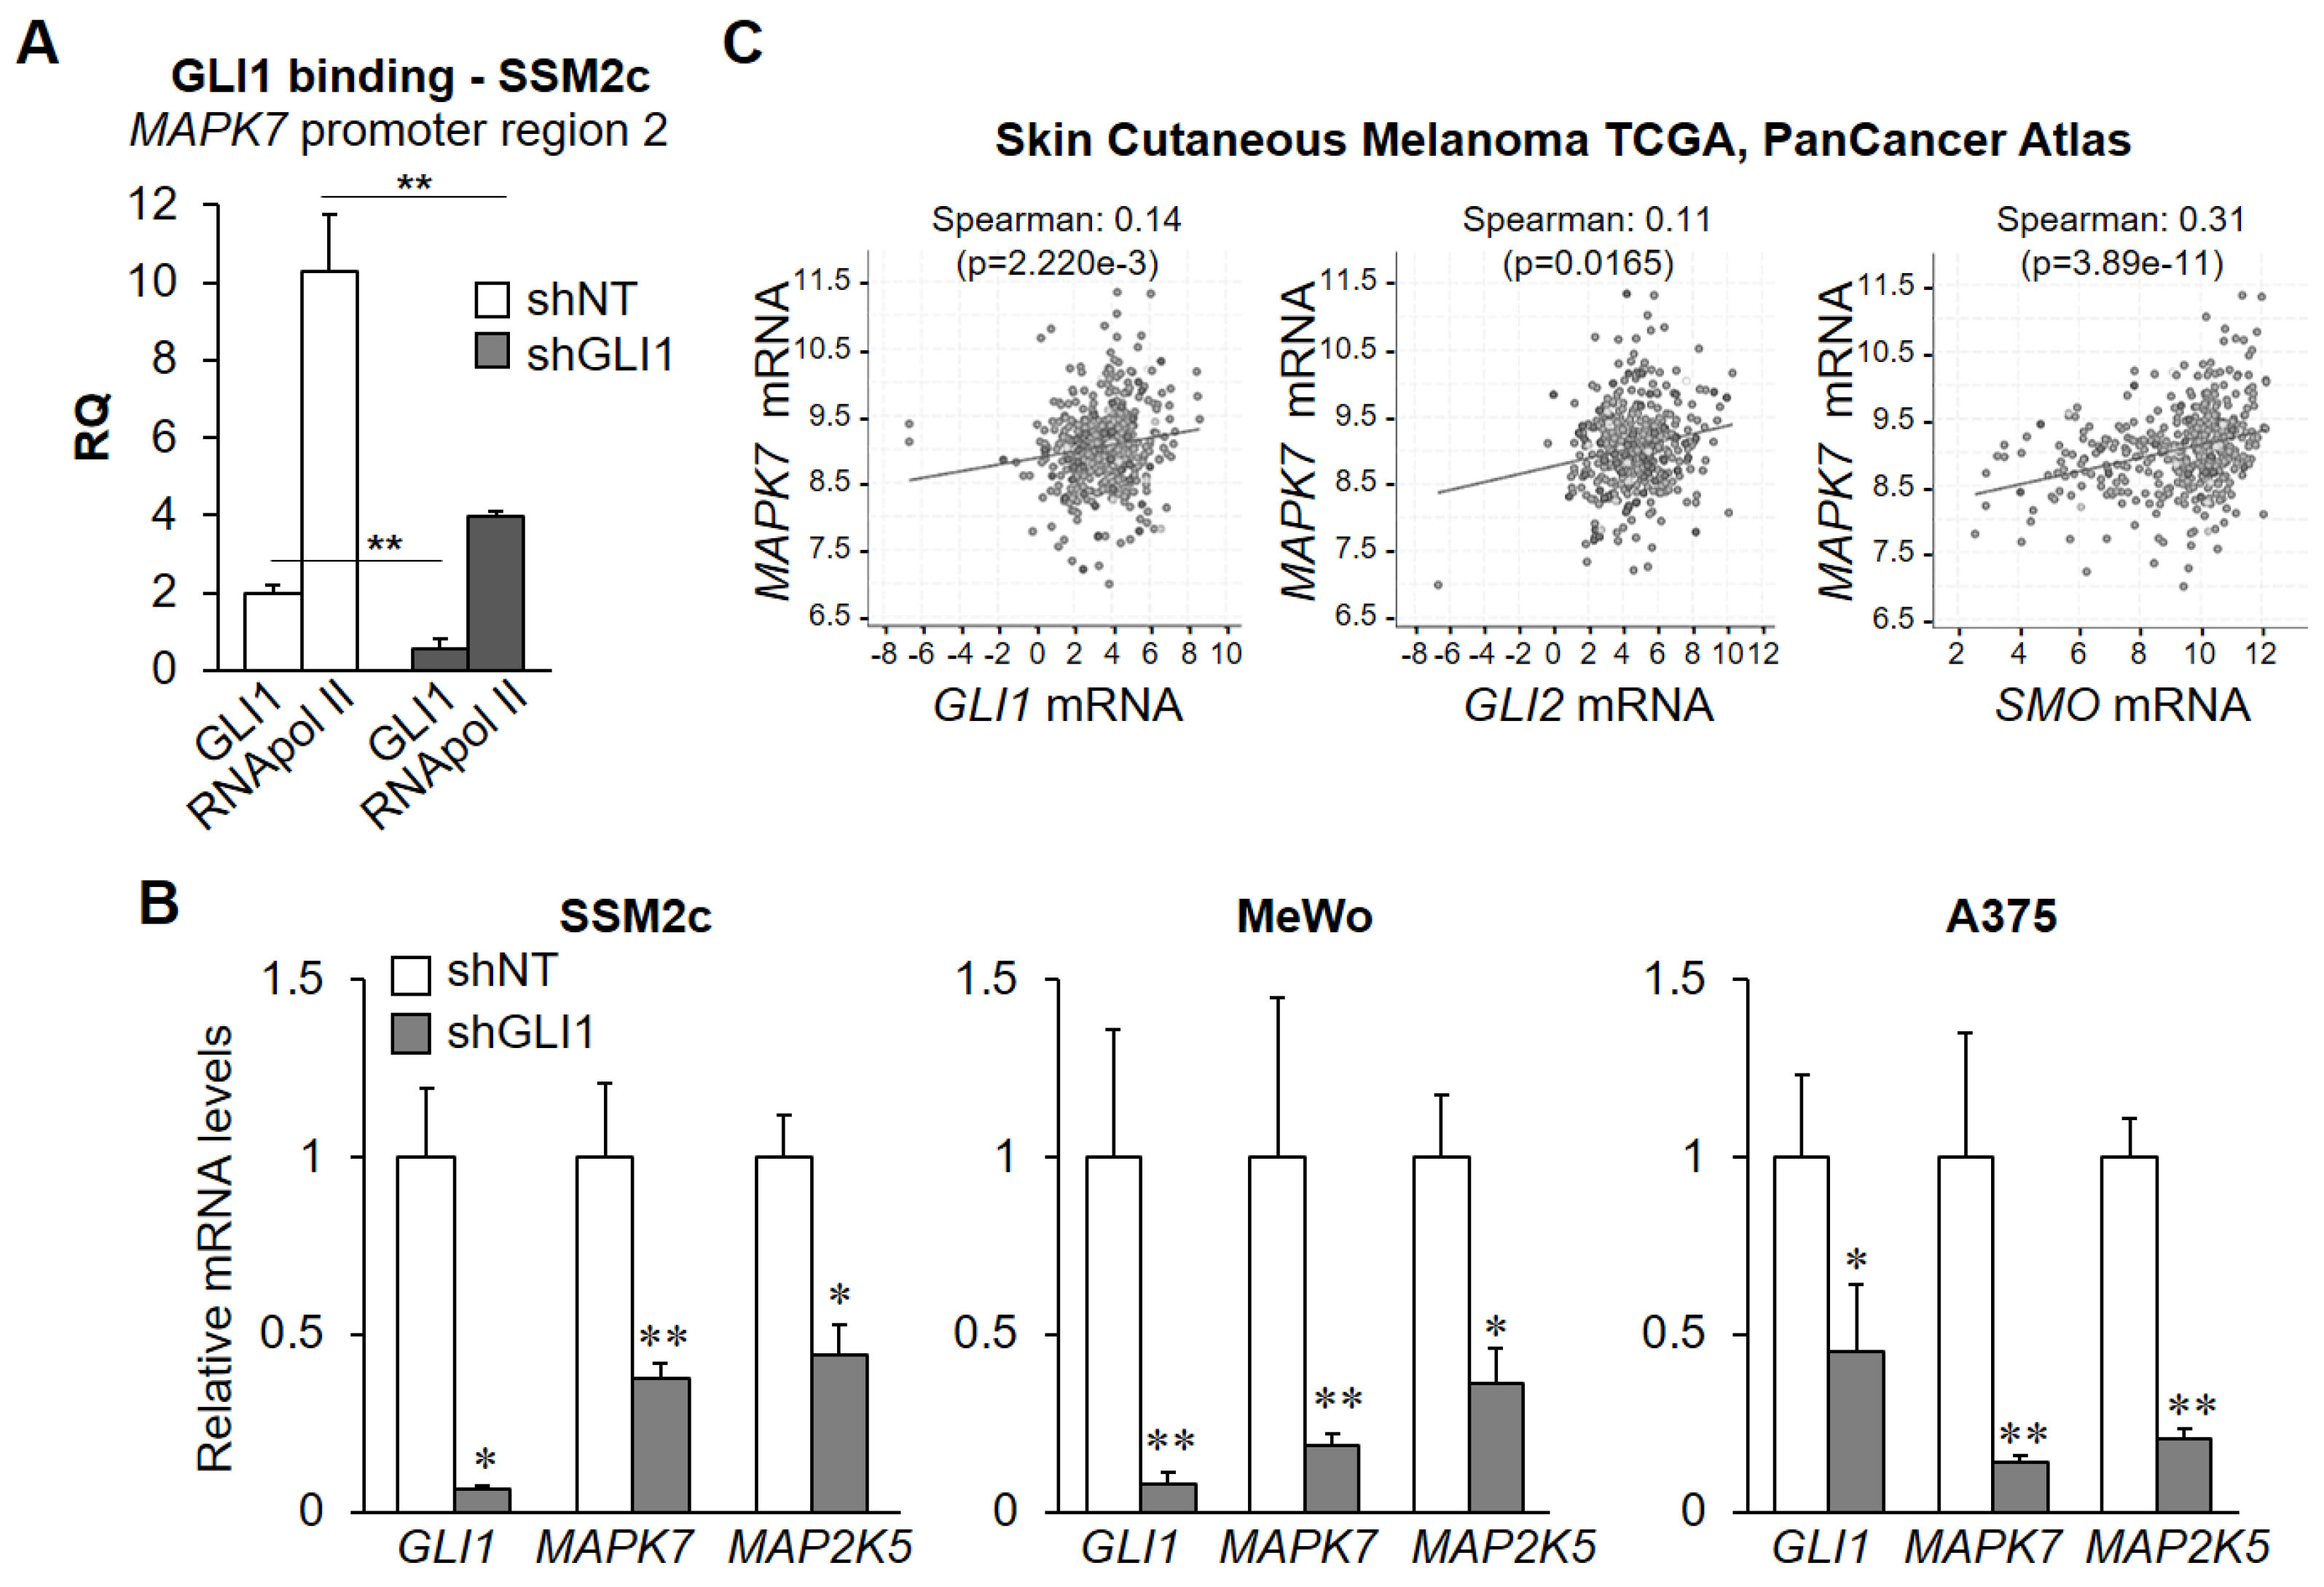
2.2. GLI1 Overexpression Increases RNA Polymerase Type II (RNApol II) Recruitment at MAPK7 Promoter and Results in Increased Binding of GLI1 to MAPK7-Regulatory Regions

In order to assess whether changes in the amount of MAPK7 mRNA upon HH-GLI activation were due to an increased expression of the MAPK7 gene, we characterized the MAPK7 regulatory region for subsequent chromatin immunoprecipitation (ChIP) experiments. Four alternatively spliced transcript variants of MAPK7 have been identified (NCBI Reference Sequence Database, July 2008) (Figure 2A). Using the GeneHancer database, we found one predicted enhancer and three predicted promoters associated with MAPK7 gene. Bioinformatic analysis using the Gene Runner software did not identify any canonical GLI consensus sequence (GACCACCCA) [18] in any of the identified regulatory regions. However, we were able to identify eight functional non-canonical GLI-binding sites (GLI-BSs) [19,20] (Figure 2A).
ChIP experiments showed that GLI1 overexpression in HEK-293T cells determined a striking enrichment of RNApol II at the MAPK7 promoter/enhancer regions containing the identified non-canonical GLI-BSs, suggesting that transcription at these sites is increased upon GLI1 overexpression (Figure 2B). More importantly, we found an increased amount of GLI1 bound to the MAPK7 promoter at region 2, which contains two non-canonical GLI-BSs (Figure 2C). It is of note that we were unable to detect any recruitment of GLI1 to the other regions investigated (Figure 2C). Interestingly, using the Open Regulatory Annotation database, we found binding sites for the E2F1 transcription factor on the MAPK7 promoter (not shown), suggesting that, besides GLI1, additional HH-GLI downstream targets [21] could positively contribute to MAPK7 transcription.
The existence of a positive regulation of ERK5 by the HH-GLI pathway was further investigated using melanoma cells that are characterized by a constitutive expression of GLI1 (Figure 1B) [21,22]. ChIP experiments showed that genetic inhibition of GLI1 using lentiviral vectors expressing GLI1-targeting shRNA (pLKO-shGLI1) in SSM2c cells determined a reduction of RNApol II recruitment at and of GLI1 binding to the MAPK7 promoter at region 2 (Figure 3A). In further support of a positive regulation of MAPK7 by GLI1 transcription factor, GLI1 silencing resulted in the reduction of MAPK7 mRNA in all three melanoma cell lines tested (Figure 3B). In addition, genetic inhibition of GLI1 determined a reduction of MAP2K5 mRNA, the gene encoding for MEK5 protein (Figure 3B). This effect is consistent with the increased expression of MEK5 protein upon HH-GLI pathway activation (Figure 1B).
In silico analysis of publicly available datasets from the cBioPortal for Cancer Genomics (Skin Cutaneous Melanoma TCGA, PanCancer Atlas) [23,24] showed that the expression level of MAPK7 mRNA positively correlates with that of GLI1, GLI2, and SMO (Figure 3C), in keeping with the positive regulation of ERK5 by the HH-GLI pathway.

2.3. ERK5 Supports HH-GLI-Dependent Proliferation of Melanoma Cells

Based on the fact that HH-GLI signalling controls the expression of ERK5, we investigated whether ERK5 is involved in HH-GLI-dependent proliferation. To this end, we evaluated the effect of MAPK7 silencing on HH-GLI-dependent proliferation induced by PTCH1 silencing in melanoma cells. In both SSM2c (Figure 4A) and A375 (Figure 4B) cells, pLV-shPTCH1 increased the number of viable cells after 7 days of incubation compared with pLV control, whereas MAPK7 silencing, obtained by transducing cells with pLKO-shERK5-1 and pLKO-shERK5-2 lentiviruses, reduced it. Interestingly, MAPK7 genetic inhibition abrogated the increase of cell numbers induced by activation of the HH-GLI pathway (Figure 4A,B). Consistent with the above results, cell cycle analysis showed that HH-GLI pathway activation determined an increase of the percentages of cells in the S phase (Figure 4C,D), and that this increase was abrogated by genetic inhibition of MAPK7. Additionally, MAPK7 knockdown resulted in a marked cell accumulation in G2/M phase, at the expense of those in G0/G1 and S phases in SSM2c cells, while it increased the fraction of cells in G0/G1 phase in A375 cells. These results are well in keeping with the effects obtained by ERK5 pharmacological inhibition, as previously reported [8]. Together, these data indicate that ERK5 is critical in sustaining the proliferation of melanoma cells induced by HH-GLI signalling.

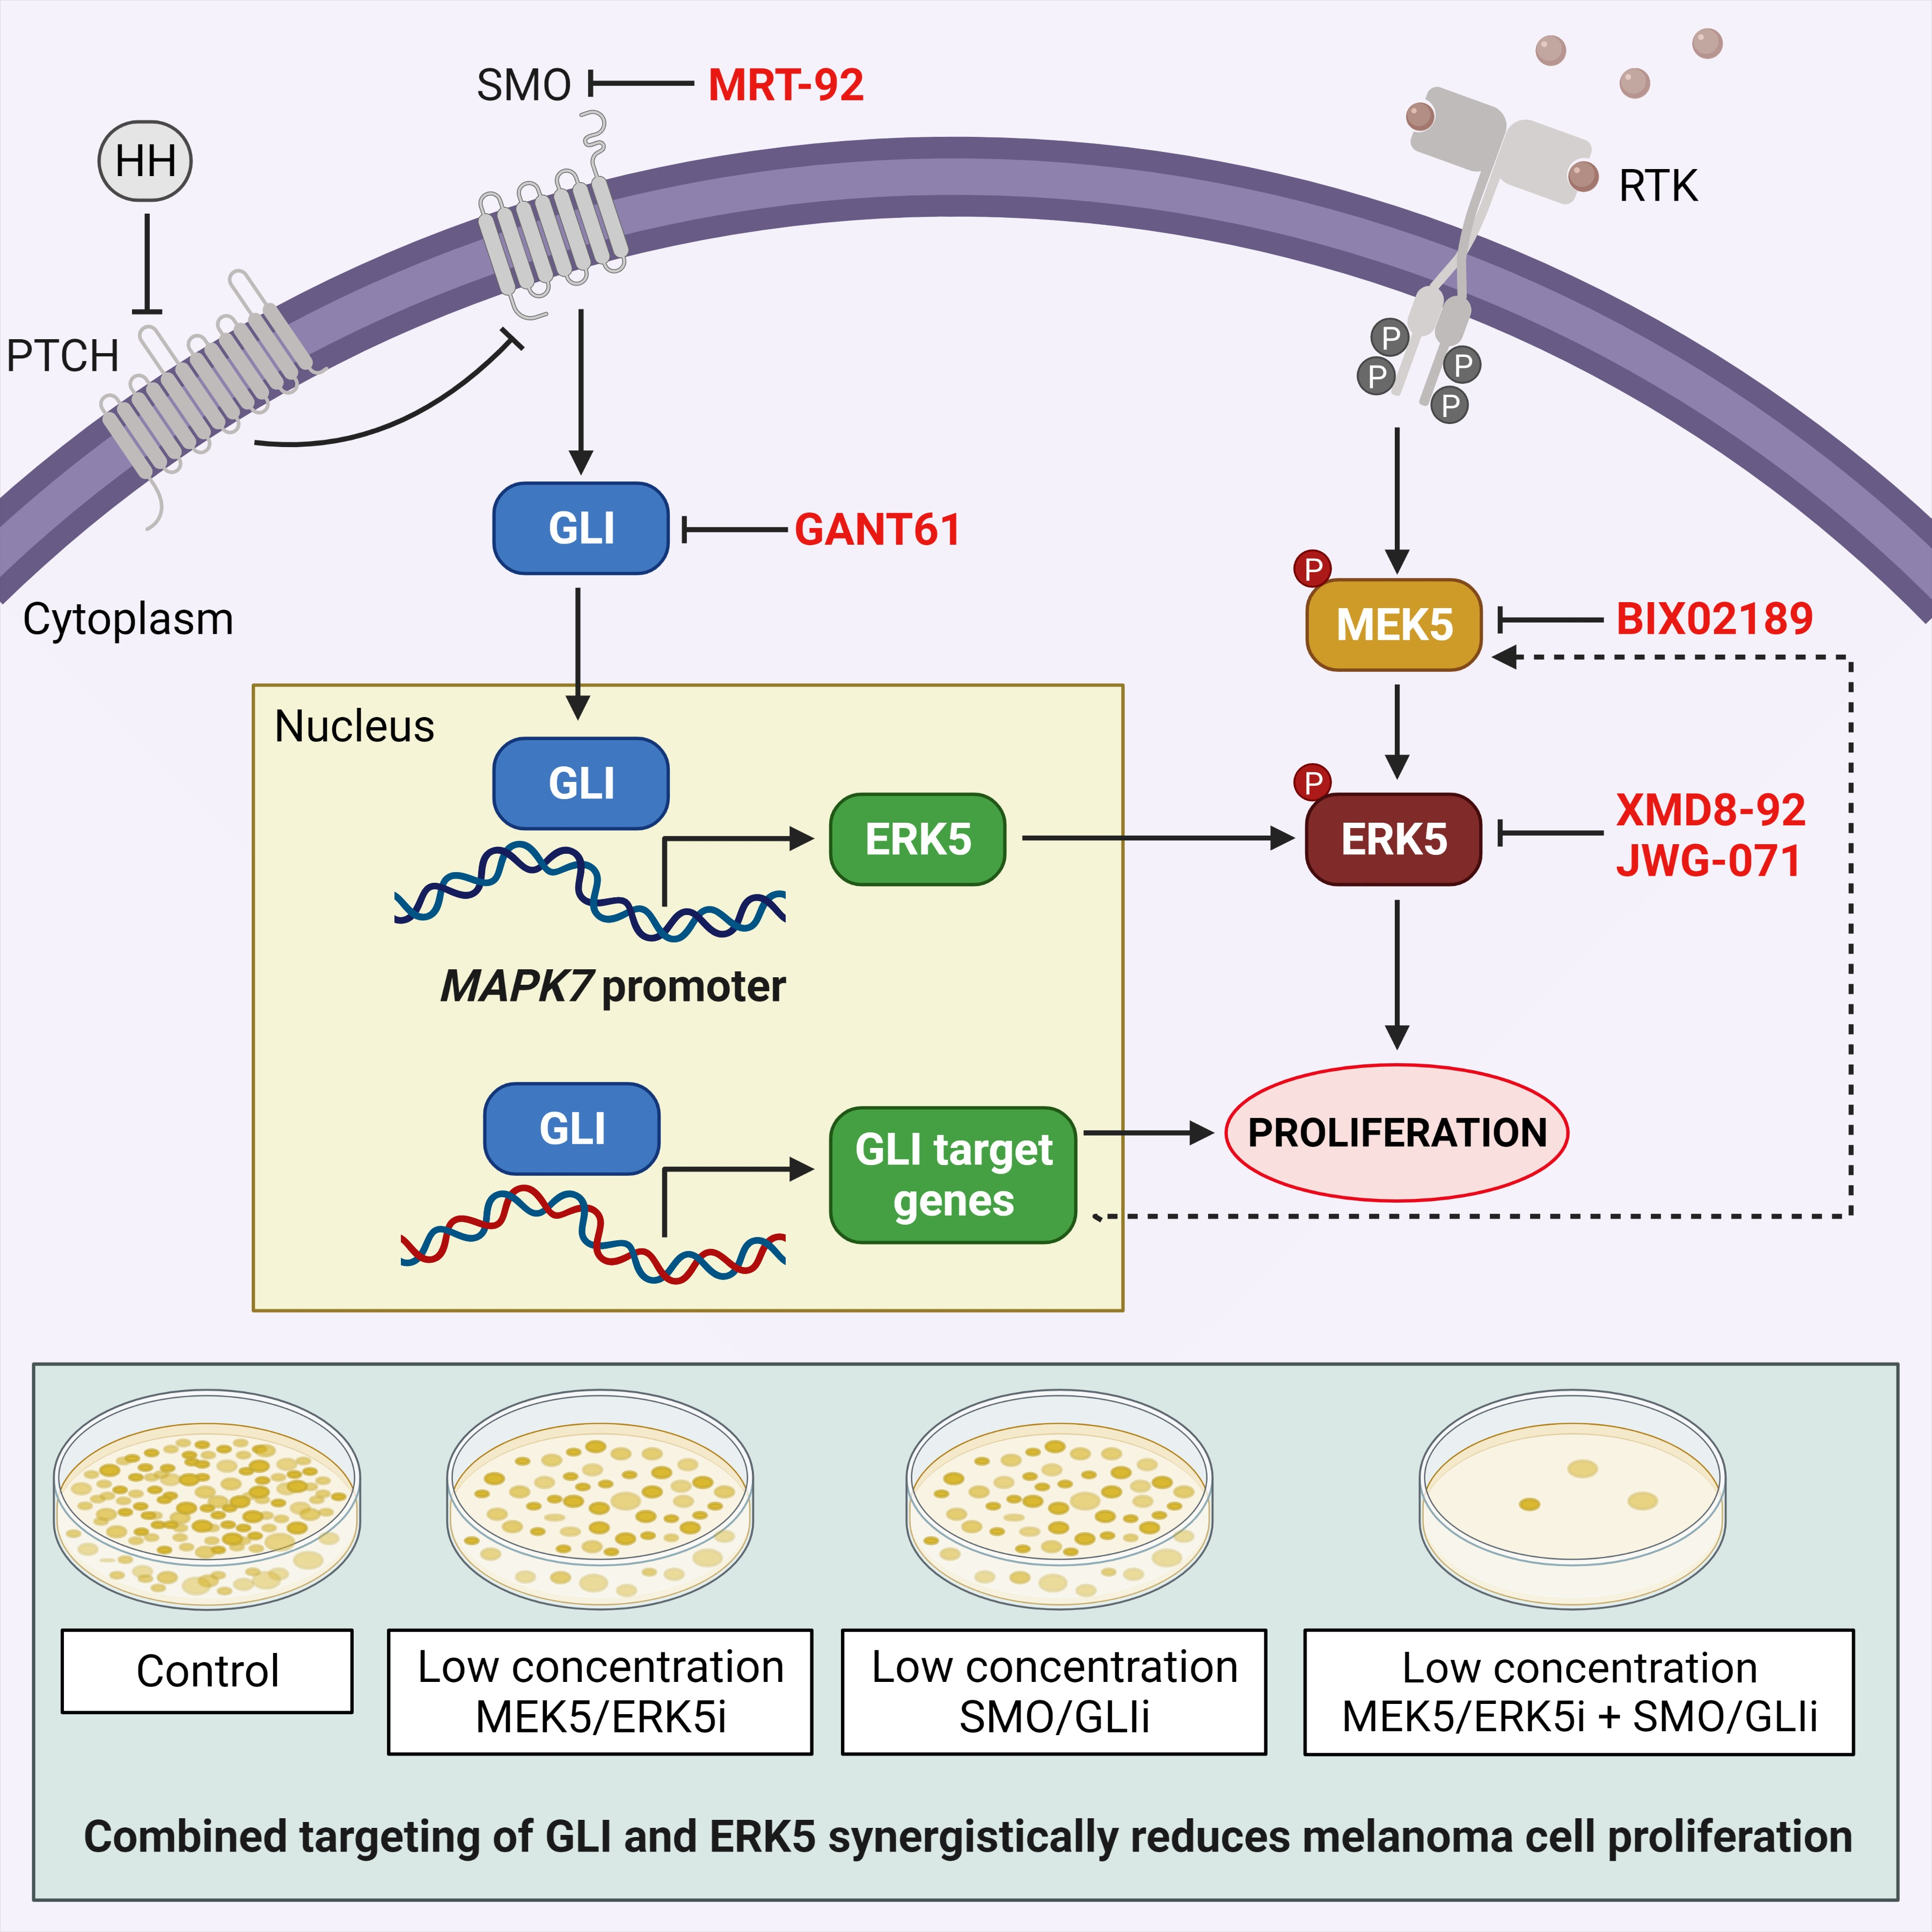
2.4. Combined Targeting of HH-GLI and ERK5 Pathways Synergistically Reduces Melanoma Cell Proliferation

To test whether targeting both the MEK5-ERK5 and the HH-GLI pathways leads to a better effect than single treatments, we performed colony formation assays using the GLI1/2 inhibitor GANT61 in combination with the ERK5 inhibitor JWG-071, both used at 1 µM concentration. The combination of the two drugs was more effective than single treatments in preventing colony formation in all melanoma cell lines used (Figure 5A–C and Supplementary Figure S2). Bliss analysis indicated the existence of a synergistic effect in all cell lines. We also tested the effects of the combination of ERK5 (XMD8-92) or MEK5 (BIX02189) inhibitors with GLI (GANT61) or SMO (MRT-92) inhibitors on the viability of melanoma cells, used at low (IC10) concentrations. All tested combinations determined synergistic or additive effects in reducing cell viability with respect to single treatments (Figure 5D).

3. Discussion

It has been previously established that both HH-GLI and ERK5 pathways are required for melanoma growth [8,10,25], but there was no evidence indicating a possible interplay between the two pathways. The study presented here describes a novel HH-GLI/ERK5 axis that regulates melanoma cell proliferation and identifies ERK5 as an important player in determining the outcome of HH-GLI signalling.
Additionally, our results show that GLI1 positively regulates the expression of ERK5 in melanoma cells. Although it was previously reported that the HH-GLI pathway may support ERK1/2 activation [16], the existence of a cross-talk with ERK5 is a novel finding. In particular, we found that the HH-GLI pathway determines an increase in the expression of both MEK5 and ERK5. With regard to the latter, we also demonstrated that GLI1 binds to the promoter of MAPK7, the gene encoding for ERK5 protein. Although no canonical GLI consensus sequence within MAPK7 regulatory regions could be found by bioinformatics, this analysis led to the identification of eight functional non-canonical GLI-BSs [19,20]. We were then able to demonstrate that GLI1 binds to the MAPK7 promoter at one of the above identified regulatory regions. This MAPK7 promoter region contains two putative GLI-BSs, one of which (AGCCACCCA) is as functional as the canonical GLI-BS, as demonstrated in a previous study by site-directed mutagenesis [19]. Furthermore, the marked enrichment of RNApol II at different regulatory regions of the MAPK7 promoter observed following GLI1 overexpression suggests that additional HH-GLI-dependent factors could positively contribute to MAPK7 transcription. In support of this hypothesis, we found binding sites for the E2F1 transcription factor, a known GLI1 gene target [21,26], on the MAPK7 promoter. Additionally, we cannot exclude that GLI2, whose mRNA is increased upon PTCH1 silencing, may participate in the regulation of MAPK7 expression. The biological relevance of the regulation of ERK5 by the HH-GLI pathway is supported by the existence of a positive correlation between components of the HH-GLI pathway and MAPK7 mRNA in human melanomas.
Parallel to the transcriptional regulation of ERK5 by GLI1, our data also indicate that activation of the HH-GLI pathway in either NIH/3T3 and melanoma cells induces a marked increase of ERK5 phosphorylation at MEK5 consensus residues (T218/Y220), likely through increasing the expression and phosphorylation of MEK5. This finding suggests the existence of an additional mechanism by which the HH-GLI pathway could contribute to the activation of ERK5. However, the identification of which is the prevailing mechanism (HH-GLI > ERK5 versus HH-GLI > MEK5 > ERK5) remains to be addressed.
Another interesting finding of this study is the identification of the requirement of ERK5 in HH-GLI-dependent melanoma cell proliferation. We previously showed that HH-GLI signalling regulates proliferation, survival, and stemness in melanoma [10,11]. On the other hand, we reported that ERK5 supports cell cycle progression and proliferation and that it is often upregulated or hyperactivated in a variety of tumours, including melanoma [8,27,28,29]. In the present work, we show that ERK5 is an important mediator of HH-GLI signalling, as MAPK7 genetic depletion abolishes the increase in cell number induced by the activation of the HH-GLI pathway in melanoma cells. This effect was, at least in part, due to the blockage of cell cycle progression.
Regarding a possible translational impact of this study, we provide evidence that co-targeting HH-GLI (GANT61, MRT-92) and MEK5-ERK5 (XMD8-92, JWG-071, BIX02189) pathways elicits significant antitumor activity in melanoma cells, including a drastic reduction of melanoma cell proliferation and colony formation. Notably, the efficacy of this combinatorial treatment in melanoma cells is not influenced by BRAF, NRAS, or NF1 mutational status, opening the possibility of using this combinatorial therapy to treat melanoma expressing high levels of GLI1 and ERK5, irrespective of their mutational status, and, possibly, other tumours with active ERK5 and HH-GLI pathways.

4. Materials and Methods

4.1. Cell Lines and Treatments

The human melanoma cell lines A375, MeWo, and SK-Mel-5, as well as the murine NIH/3T3 and human HEK-293T cells, were obtained from ATCC (Manassas, VA, USA). Patient-derived SSM2c melanoma cells have been previously described [22,30]. Cells were maintained in Dulbecco’s modified Eagle’s medium (DMEM) supplemented with 10% heat-inactivated foetal bovine serum (FBS), 2 mM glutamine, 50 U/mL penicillin, and 50 mg/mL streptomycin (Euroclone, Milan, Italy), and incubated at 37 °C in a water-saturated atmosphere containing 95% air (21% O2) and 5% CO2. Cell lines were authenticated by cell profiling (Promega PowerPlex Fusion System kit; BMR Genomics S.R.L., Padova, Italy) once a year. The mycoplasma contamination of cell cultures was periodically excluded by 4′,6-diamidino-2-phenylindole (DAPI) staining or PCR. Cultures were renewed every 2 months. The characteristics of melanoma cell lines used in this study are summarized in Supplementary Table S1.
The ERK5 inhibitor JWG-071 [31] (Sigma-Aldrich, St Louis, MO, USA), the MEK5 inhibitor BIX02189 [32] (MedChemExpress LLC, Princeton, NJ, USA), the GLI1/2 inhibitor GANT61 [33] (MedChemExpress LLC), the SMO inhibitor MRT-92 [34,35], and the SMO agonist SAG [17] (MedChemExpress LLC) were dissolved in DMSO.

4.2. Cell Lysis and Western Blotting

Total cell lysates were obtained using Laemmli or RIPA buffer, as previously described [30,36]. Proteins were separated by SDS-PAGE and transferred onto Hybond™ PVDF membranes (GE Healthcare, IL, USA) by electroblotting. Infrared imaging (Odyssey, Li-Cor Bioscience, Lincoln, NE, USA) was used to detect protein bands. Images were recorded as TIFF files for quantification with ImageJ software. Antibodies used are listed in Supplementary Table S2.

4.3. Measurement of Cell Viability and Cell Cycle Phase Distribution

Cell viability was evaluated by trypan blue exclusion or by 3-(4,5-dimethylthiazol-2-yl)-3,5-diphenyltetrazolium bromide (MTT) assay. For MTT assay, 20,000 (SSM2c), 7500 (MeWo), or 10,000 (A375) cells/well were seeded in a 96-well plate in DMEM/10% FBS. After 24 h, medium was discarded and cells were incubated for 72 h with drugs or their vehicle (DMSO) in DMEM/2.5% FBS. Media were then discarded and MTT (0.5 mg/mL dissolved in DMEM without phenol red) added for 4 h. After MTT solubilisation, plates were read at λ595 nm using a Microplate reader-550 (Bio-Rad, Hercules, CA, USA).
Cell cycle phase distribution (propidium iodide staining) was measured by flow cytometry using a FACS-Canto analyser (Beckton & Dickinson, San Josè, CA, USA), available at the molecular medicine facility, as previously reported [37].

4.4. RNA Interference

Lentiviruses were produced in HEK-293T cells as previously reported [28]. Lentiviral vectors for stable knockdown of MAPK7 or GLI1 in melanoma cells were TRC1.5-pLKO.1-puro vector containing shRNA sequences (shNT), or target-specific sequences (Supplementary Table S3). Transduced cells were selected with 2 µg/mL puromycin for at least 72 h. Lentiviral vectors for stable knockdown of PTCH1 in melanoma cells were pLV-CTH (pLV) and pLV-CTH-shPTCH1 (shPTCH1) [38] (Supplementary Table S3). Cells were transduced with pLV or shPTCH1 express green fluorescent protein (GFP) and were sorted using a FACS-Aria cell sorter (Beckton & Dickinson).

4.5. Plasmids and Transfection

The vector used for GLI1 overexpression was pCS2-Myc-tagged human GLI1 (pCS2-GLI1) [38]. HEK-293T cells were plated on p100 dishes (1 × 10⁵ cells/dish) and transfected after 24 h with a total amount of 8 μg of plasmid DNA using Lipofectamin2000 (Invitrogen, Thermo Fisher Scientific), following the manufacturer’s instructions. Cells were lysed after 24–48 h.

4.6. Quantitative Real-Time (Q-PCR)

Total RNA was isolated using Trizol™ (Life Technologies, Carlsbad, CA, USA) and cDNA synthesis was carried out using the ImProm-II™ Reverse Transcription System (Promega Corporation, Madison, WI, USA). Q-PCR was performed using the GoTaq® qPCR Master Mix (Promega Corporation, Madison, WI, USA). Primer sequences are reported in Supplementary Table S4.
PCR products were detected in the CFX96 Touch Real-Time PCR Detection System (Bio-Rad, Hercules, CA, USA). Results were analysed using CFX Maestro Software. A melting curve analysis was performed to discriminate between specific and non-specific PCR products. The relative expression of GLI1, GLI2, GLI3, MAPK7, and MAP2K5 mRNA was calculated using a comparative threshold cycle method and the formula 2−(DDCt) [39]. The level of expression of mRNA of interest was normalized to that of GAPDH and 18S mRNA.

4.7. ChIP

ChIP was performed as previously reported [40]. HEK-293T cells were fixed with 1% formaldehyde for 10 min at 37 °C and cross-linking was stopped by adding 125 mM glycine for 5 min. Cells were harvested and lysed in a nuclear lysis buffer (1% SDS, 10 mM EDTA, 50 mM Tris-HCl pH 8.1) containing protease inhibitors. Chromatin was sonicated to an average size of 200–600 bp using a SONOPULS Mini20 Sonicator (Bandelin, Berlin, Germany) equipped with a cup-horn and diluted with ChIP Dilution Buffer (0.01% SDS, 1.2 mM EDTA, 1.1% Triton X-100, 167 mM NaCl, and 16.7 mM Tris-HCl pH 8.1), and input material was collected. Chromatin was incubated overnight with Dynabeads Protein G (#100.03D; Life Technologies Italia, Monza, Italy) pre-conjugated with 2 µg antibodies (Supplementary Table S2). After extensive washing, immunocomplexes were eluted from beads with elution buffer (0.1 M NaHCO3, 1% SDS). Following the addition of 0.2 M NaCl, all samples, including input, were incubated for 4 h at 65 °C to revert cross-linking. After treatment with 10 µM RNAase and digestion with 40 µM proteinase-K, DNA was extracted using QIAquick PCR purification, according to the manufacturer’s recommendations (#28106; Qiagen, Hilden, Germany), and DNA was eluted. Immunoprecipitated DNA was quantified by Q-PCR. The relative amount of immunoprecipitated MAPK7 promoter DNA was determined using the primers reported in Table S4. Data were normalized to input DNA and expressed with respect to those of control IgG (used as calibrator).

4.8. Clonogenic Assay

For colony formation assay, 4000 (SSM2c), 3000 (MeWo), or 500 (A375) cells were seeded in p60 dishes in the presence of drugs or their vehicle (DMSO). Colonies (with more than 50 cells, i.e., 8 cell diameter) were counted following crystal violet staining after 7 (A375, SSM2c) or 14 (MeWo) days [41]. IC50 values were calculated using GraphPad Prism software.

4.9. Statistical Analysis

Data are mean ± SD of values obtained from at least three independent experiments. P values were calculated using Student’s t-test (two groups) or one-way analysis of variance (more than two groups; multiple comparison using Bonferroni’s correction). A two-tailed value of p < 0.05 was considered statistically significant.

Supplementary Materials

Author Contributions

Conceptualization, E.R. and B.S.; Acquisition of data, I.T., S.G., A.T., S.P. and A.M.; Analysis and interpretation of data, I.T., M.L., B.S. and E.R.; writing—original draft preparation, I.T., B.S. and E.R.; writing—review and editing, I.T., B.S., E.R. and P.D.S.; supervision, E.R., B.S. and P.D.S.; funding acquisition, E.R. and B.S. All authors have read and agreed to the published version of the manuscript.

Funding

This work was supported by grants from Associazione Italiana per la Ricerca sul Cancro, AIRC, (IG-15282 and IG-21349, ER; IG-14184 and IG-23091, BS), by Ente Fondazione Cassa di Risparmio di Firenze (ECRF, ER), and Università degli Studi di Firenze (Incentivo di Ateneo ex-60%, ER and PDS). AT is supported by a “Carlo Zanotti” FIRC-AIRC fellowship (ID-23847).

Informed Consent Statement

Not applicable.

Data Availability Statement

Data is contained within the article and Supplementary Materials.

Acknowledgments

We thank Maurizio Taddei and Elena Petricci for MRT-92.

Conflicts of Interest

The authors declare no conflict of interest.

References

  1. Drew, B.A.; Burow, M.E.; Beckman, B.S. MEK5/ERK5 pathway: The first fifteen years. Biochim. Biophys. Acta 2012, 1825, 37–48. [Google Scholar] [CrossRef] [Green Version]
  2. Lee, J.D.; Ulevitch, R.J.; Han, J. Primary structure of BMK1: A new mammalian map kinase. Biochem. Biophys. Res. Commun. 1995, 213, 715–724. [Google Scholar] [CrossRef] [PubMed]
  3. Kato, Y.; Kravchenko, V.V.; Tapping, R.I.; Han, J.; Ulevitch, R.J.; Lee, J.D. BMK1/ERK5 regulates serum-induced early gene expression through transcription factor MEF2C. EMBO J. 1997, 16, 7054–7066. [Google Scholar] [CrossRef] [PubMed] [Green Version]
  4. Gomez, N.; Erazo, T.; Lizcano, J.M. ERK5 and Cell Proliferation: Nuclear Localization Is What Matters. Front. Cell Dev. Biol. 2016, 4, 105. [Google Scholar] [CrossRef] [PubMed] [Green Version]
  5. Tubita, A.; Lombardi, Z.; Tusa, I.; Dello Sbarba, P.; Rovida, E. Beyond Kinase Activity: ERK5 Nucleo-Cytoplasmic Shuttling as a Novel Target for Anticancer Therapy. Int. J. Mol. Sci. 2020, 21, 938. [Google Scholar] [CrossRef] [Green Version]
  6. Erazo, T.; Espinosa-Gil, S.; Diéguez-Martínez, N.; Gómez, N.; Lizcano, J.M. SUMOylation Is Required for ERK5 Nuclear Translocation and ERK5-Mediated Cancer Cell Proliferation. Int. J. Mol. Sci. 2020, 21, 2203. [Google Scholar] [CrossRef] [PubMed] [Green Version]
  7. Stecca, B.; Rovida, E. Impact of ERK5 on the Hallmarks of Cancer. Int. J. Mol. Sci. 2019, 20, 1426. [Google Scholar] [CrossRef] [Green Version]
  8. Tusa, I.; Gagliardi, S.; Tubita, A.; Pandolfi, S.; Urso, C.; Borgognoni, L.; Wang, J.; Deng, X.; Gray, N.S.; Stecca, B.; et al. ERK5 is activated by oncogenic BRAF and promotes melanoma growth. Oncogene 2018, 37, 2601–2614. [Google Scholar] [CrossRef]
  9. Ingham, P.W.; McMahon, A.P. Hedgehog signaling in animal development: Paradigms and principles. Genes Dev. 2001, 15, 3059–3087. [Google Scholar] [CrossRef] [Green Version]
  10. Stecca, B.; Mas, C.; Clement, V.; Zbinden, M.; Correa, R.; Piguet, V.; Beermann, F.; Ruiz i Altaba, A. Melanomas require HEDGEHOG-GLI signaling regulated by interactions between GLI1 and the RAS-MEK/AKT pathways. Proc. Natl. Acad. Sci. USA. 2007, 104, 5895–5900. [Google Scholar] [CrossRef] [Green Version]
  11. Santini, R.; Vinci, M.C.; Pandolfi, S.; Pimpinelli, N.; Gerlini, G.; Borgognoni, L.; Stecca, B. Hedgehog-GLI signaling drives self-renewal and tumorigenicity of human melanoma-initiating cell. Stem Cells 2012, 30, 1808–1818. [Google Scholar] [CrossRef] [PubMed]
  12. Hooper, J.E.; Scott, M.P. Communicating with Hedgehogs. Nat. Rev. Mol. Cell Biol. 2005, 6, 306–317. [Google Scholar] [CrossRef] [PubMed]
  13. Kasper, M.; Regl, G.; Frischauf, A.M.; Aberger, F. GLI1 transcription factors: Mediators of oncogenic Hedgehog signalling. Eur. J. Cancer 2006, 42, 437–445. [Google Scholar] [CrossRef] [PubMed]
  14. Varjosalo, M.; Taipale, J. Hedgehog: Functions and mechanisms. Genes Dev. 2008, 22, 2454–2472. [Google Scholar] [CrossRef] [PubMed] [Green Version]
  15. Pietrobono, S.; Gagliardi, S.; Stecca, B. Non-canonical Hedgehog Signaling Pathway in Cancer: Activation of GLI Transcription Factors Beyond Smoothened. Front. Genet. 2019, 10, 556. [Google Scholar] [CrossRef] [PubMed] [Green Version]
  16. Rovida, E.; Stecca, B. Mitogen-activated protein kinases and Hedgehog-GLI signaling in cancer: A crosstalk providing therapeutic opportunities? Semin. Cancer Biol. 2015, 35, 154–167. [Google Scholar] [CrossRef] [PubMed]
  17. Chen, J.K.; Taipale, J.; Young, K.E.; Maiti, T.; Beachy, P.A. Small molecule modulation of Smoothened activity. Proc. Natl. Acad. Sci. USA 2002, 99, 14071–14076. [Google Scholar] [CrossRef] [PubMed] [Green Version]
  18. Kinzler, K.W.; Vogelstein, B. The GLI gene encodes a nuclear protein which binds specific sequences in the human genome. Mol. Cell. Biol. 1990, 10, 634–642. [Google Scholar] [CrossRef] [Green Version]
  19. Winklmayr, M.; Schmid, C.; Laner-Plamberger, S.; Kaser, A.; Aberger, F.; Eichberger, T.; Frischauf, A.M. Non-consensus GLI binding sites in Hedgehog target gene regulation. BMC. Mol. Biol. 2010, 11, 2. [Google Scholar] [CrossRef] [Green Version]
  20. Peterson, K.A.; Nishi, Y.; Ma, W.; Vedenko, A.; Shokri, L.; Zhang, X.; McFarlane, M.; Baizabal, J.M.; Junker, J.P.; van Oudenaarden, A.; et al. Neural-specific Sox2 input and differential Gli-binding affinity provide context and positional information in Shh-directed neural patterning. Genes. Dev. 2012, 26, 2802–2816. [Google Scholar] [CrossRef] [Green Version]
  21. Pandolfi, S.; Montagnani, V.; Lapucci, A.; Stecca, B. HEDGEHOG/GLI-E2F1 axis modulates iASPP expression and function and regulates melanoma cell growth. Cell Death Differ. 2015, 22, 2006–2019. [Google Scholar] [CrossRef] [PubMed]
  22. Pandolfi, S.; Montagnani, V.; Penachioni, J.Y.; Vinci, M.C.; Olivito, B.; Borgognoni, L.; Stecca, B. WIP1 phosphatase modulates the Hedgehog signaling by enhancing GLI1 function. Oncogene 2013, 32, 4737–4747. [Google Scholar] [CrossRef]
  23. Cerami, E.; Gao, J.; Dogrusoz, U.; Gross, B.E.; Sumer, S.O.; Aksoy, B.A.; Jacobsen, A.; Byrne, C.J.; Heuer, M.L.; Larsson, E.; et al. The cBio cancer genomics portal: An open platform for exploring multidimensional cancer genomics data. Cancer Discov. 2012, 2, 401–404. [Google Scholar] [CrossRef] [PubMed] [Green Version]
  24. Gao, X.J.; Potter, C.J.; Gohl, D.M.; Silies, M.; Katsov, A.Y.; Clandinin, T.R.; Luo, L. Specific kinematics and motor-related neurons for aversive chemotaxis in Drosophila. Curr. Biol. 2013, 23, 1163–1172. [Google Scholar] [CrossRef] [Green Version]
  25. O’Reilly, K.E.; de Miera, E.V.; Segura, M.F.; Friedman, E.; Poliseno, L.; Han, S.W.; Zhong, J.; Zavadil, J.; Pavlick, A.; Hernando, E.; et al. Hedgehog pathway blockade inhibits melanoma cell growth in vitro and in vivo. Pharmaceuticals (Basel) 2013, 6, 1429–1450. [Google Scholar] [CrossRef]
  26. Sabol, M.; Trnski, D.; Musani, V.; Ozretić, P.; Levanat, S. Role of GLI Transcription Factors in Pathogenesis and Their Potential as New Therapeutic Targets. Int. J. Mol. Sci. 2018, 19, 2562. [Google Scholar] [CrossRef] [Green Version]
  27. Gentilini, A.; Lori, G.; Caligiuri, A.; Raggi, C.; Di Maira, G.; Pastore, M.; Piombanti, B.; Lottini, T.; Arcangeli, A.; Madiai, S.; et al. Extracellular Signal-Regulated Kinase 5 Regulates the Malignant Phenotype of Cholangiocarcinoma Cells. Hepatology 2021, 74, 2007–2020. [Google Scholar] [CrossRef]
  28. Rovida, E.; Di Maira, G.; Tusa, I.; Cannito, S.; Paternostro, C.; Navari, N.; Vivoli, E.; Deng, X.; Gray, N.S.; Esparís-Ogando, A.; et al. The mitogen-activated protein kinase ERK5 regulates the development and growth of hepatocellular carcinoma. Gut 2015, 64, 1454–1465. [Google Scholar] [CrossRef] [PubMed] [Green Version]
  29. Tusa, I.; Cheloni, G.; Poteti, M.; Gozzini, A.; DeSouza, N.H.; Shan, Y.; Deng, X.; Gray, N.S.; Li, S.; Rovida, E.; et al. Targeting the Extracellular Signal-Regulated Kinase 5 Pathway to Suppress Human Chronic Myeloid Leukemia Stem Cells. Stem Cell Rep. 2018, 11, 929–943. [Google Scholar] [CrossRef] [PubMed] [Green Version]
  30. Santini, R.; Pietrobono, S.; Pandolfi, S.; Montagnani, V.; D’Amico, M.; Penachioni, J.Y.; Vinci, M.C.; Borgognoni, L.; Stecca, B. SOX2 regulates self-renewal and tumorigenicity of human melanoma-initiating cells. Oncogene 2014, 33, 4697–4708. [Google Scholar] [CrossRef] [Green Version]
  31. Wang, J.; Erazo, T.; Ferguson, F.M.; Buckley, D.L.; Gomez, N.; Muñoz-Guardiola, P.; Diéguez-Martínez, N.; Deng, X.; Hao, M.; Massefski, W.; et al. Structural and Atropisomeric Factors Governing the Selectivity of Pyrimido-benzodiazipinones as Inhibitors of Kinases and Bromodomains. ACS Chem. Biol. 2018, 13, 2438–2448. [Google Scholar] [CrossRef] [PubMed] [Green Version]
  32. Tatake, R.J.; O’Neill, M.M.; Kennedy, C.A.; Wayne, A.L.; Jakes, S.; Wu, D.; Kugler, S.Z.; Kashem, M.A., Jr.; Kaplita, P.; Snow, R.J. Identification of pharmacological inhibitors of the MEK5/ERK5 pathway. Biochem. Biophys. Res. Commun. 2008, 377, 120–125. [Google Scholar] [CrossRef]
  33. Lauth, M.; Bergström, A.; Shimokawa, T.; Toftgård, R. Inhibition of GLI-mediated transcription and tumor cell growth by small-molecule antagonists. Proc. Natl. Acad. Sci. USA 2007, 104, 8455–8460. [Google Scholar] [CrossRef] [PubMed] [Green Version]
  34. Hoch, L.; Faure, H.; Roudaut, H.; Schoenfelder, A.; Mann, A.; Girard, N.; Bihannic, L.; Ayrault, O.; Petricci, E.; Taddei, M.; et al. MRT-92 inhibits Hedgehog signaling by blocking overlapping binding sites in the transmembrane domain of the Smoothened receptor. FASEB J. 2015, 29, 1817–1829. [Google Scholar] [CrossRef] [PubMed] [Green Version]
  35. Pietrobono, S.; Santini, R.; Gagliardi, S.; Dapporto, F.; Colecchia, D.; Chiariello, M.; Leone, C.; Valoti, M.; Manetti, F.; Petricci, E.; et al. Targeted inhibition of Hedgehog-GLI signaling by novel acylguanidine derivatives inhibits melanoma cell growth by inducing replication stress and mitotic catastrophe. Cell Death Dis. 2018, 9, 142. [Google Scholar] [CrossRef] [PubMed]
  36. Rovida, E.; Spinelli, E.; Sdelci, S.; Barbetti, V.; Morandi, A.; Giuntoli, S.; Dello Sbarba, P. ERK5/BMK1 is indispensable for optimal colony-stimulating factor 1 (CSF-1)-induced proliferation in macrophages in a Src-dependent fashion. J. Immunol. 2008, 180, 4166–4172. [Google Scholar] [CrossRef] [PubMed] [Green Version]
  37. Del Poggetto, E.; Tanturli, M.; Ben-Califa, N.; Gozzini, A.; Tusa, I.; Cheloni, G.; Marzi, I.; Cipolleschi, M.G.; Kashman, Y.; Neumann, D.; et al. Salarin C inhibits the maintenance of chronic myeloid leukemia progenitor cells. Cell Cycle 2015, 14, 3146–3154. [Google Scholar] [CrossRef] [Green Version]
  38. Stecca, B.; Ruiz i Altaba, A. A GLI1-p53 inhibitory loop controls neural stem cell and tumour cell numbers. EMBO J. 2009, 28, 663–676. [Google Scholar] [CrossRef] [Green Version]
  39. Livak, K.J.; Schmittgen, T.D. Analysis of relative gene expression data using real-time quantitative PCR and the 2(-Delta Delta C(T)) method. Methods 2001, 25, 402–408. [Google Scholar] [CrossRef]
  40. Barbetti, V.; Tusa, I.; Cipolleschi, M.G.; Rovida, E.; Dello Sbarba, P. AML1/ETO sensitizes via TRAIL acute myeloid leukemia cells to the pro-apoptotic effects of hypoxia. Cell Death Dis. 2013, 4, e536. [Google Scholar] [CrossRef]
  41. Franken, N.A.; Rodermond, H.M.; Stap, J.; Haveman, J.; van Bree, C. Clonogenic assay of cells in vitro. Nat. Protoc. 2006, 1, 2315–2319. [Google Scholar] [CrossRef] [PubMed]
Figure 1. Activation of HH-GLI signalling enhances ERK5 activation. (A) Melanoma cells were lysed 5 days after transduction with control/empty lentiviral vectors (pLV) or lentiviral vectors carrying PTCH1-specific shRNA (shPTCH1), and GLI1 and MAPK7 mRNA levels determined by Q-PCR. Data shown are mean ± SD from three independent experiments. * p < 0.05, ** p < 0.01 and *** p < 0.001 as determined by Student’s t-test. (B) Melanoma cells were lysed 5 days after transduction with control/empty lentiviral vectors (pLV) or lentiviral vectors carrying PTCH1-specific shRNA (shPTCH1), and Western blotting performed with the indicated antibodies. Migration of molecular weight markers is indicated on the left (KDa). Images are representative of three independent experiments showing similar results. Graphs on the right show densitometric analysis performed on three independent experiments. (C) NIH/3T3 cells were treated with 100 nM SAG or DMSO (Vehicle) for 48 h and lysed. Western blotting was then performed with the indicated antibodies. Migration of molecular weight markers is indicated on the left (KDa). Images are representative of three independent experiments showing similar results. FL, full length; R, repressor.
Ijms 22 11259 g001
Figure 2. GLI1 increases RNApol II recruitment at and binds to MAPK7 promoter. (A) Possible GLI binding sites at regulatory regions (1–4) of MAPK7 gene. (B) HEK-293T cells were transduced with control/empty vectors (pCS2) or vectors carrying GLI1 (pCS2-GLI1). Cells were lysed after 48 h and ChIP was performed using anti-RNA polymerase II (RNApol II) antibody or isotype control IgG. Q-PCR for the indicated regulatory regions of the MAPK7 promoter was performed. Histograms represent the relative quantification (RQ) of DNA recovered from IP with RNApol II normalized for isotype control IgG. Data shown are mean ± SD from two independent experiments performed in triplicate. ** p < 0.01, *** p < 0.001, as determined by Student’s t-test. (C) HEK-293T cells were transduced with control/empty vectors (pCS2) or vectors carrying GLI1 (pCS2-GLI1). Cells were lysed after 48 h and ChIP was performed using anti-GLI1 antibody or isotype control IgG. Q-PCR for the indicated regulatory regions of the MAPK7 promoter was performed. Histograms represent the RQ of DNA recovered from IP with GLI1 normalized for isotype control IgG from two independent experiments performed in triplicate. * p < 0.05, as determined by Student’s t-test.
Ijms 22 11259 g002
Figure 3. GLI1 silencing reduces RNApol II recruitment at and GLI1 binding to MAPK7 promoter and decreases MAPK7 and MAP2K5 mRNA levels. (A) SSM2c cells were lysed 5 days after transduction with pLKO.1-puro vectors containing non-targeting sequence shRNA (shNT) or lentiviral vectors carrying GLI1-specific shRNA (shGLI1), and ChIP was performed using anti-RNApol II, anti-GLI1 antibody, or isotype control IgG. Q-PCR for region 2 of MAPK7 promoter was performed. Histograms represent the relative quantification (RQ) of DNA recovered from IP with RNApol II or GLI1 normalized for isotype control IgG. Data shown are mean ± SD. ** p < 0.01, as determined by Student’s t-test. (B) Melanoma cells were lysed 5 days after transduction with pLKO.1-puro vectors containing non-targeting sequence shRNA (shNT) or lentiviral vectors carrying GLI1-specific shRNA (shGLI1), and GLI1, MAPK7, and MAP2K5 mRNA levels determined by Q-PCR. Data shown are mean ± SD from three independent experiments. * p < 0.05, ** p < 0.01 as determined by Student’s t-test. (C) Correlations between the indicated mRNA as determined using the co-expression tool in cBioPortal for Cancer Genomics (Skin Cutaneous Melanoma TCGA, PanCancer Atlas, 448 patients) [23,24]. Data are represented by scatter plots showing Spearman’s correlation.
Ijms 22 11259 g003
Figure 4. ERK5 is required for HH-GLI-dependent melanoma cell proliferation. (A,B) Growth curves of viable melanoma cells transduced with the indicated lentiviral vectors. Data shown are mean ± SD of one representative experiment out of three performed in triplicate. * p < 0.05, ** p < 0.01, *** p < 0.001 as determined by Student’s t-test. (C,D) In the same experiments shown in (A,B), cell cycle phase distribution (propidium iodide staining) was estimated by flow cytometry. * p < 0.05, ** p < 0.01, *** p < 0.001 versus pLV/shNT; # p < 0.05, ## p < 0.01, ### p < 0.001 versus shPTCH1/shNT.
Ijms 22 11259 g004
Figure 5. Combined pharmacological inhibition of HH-GLI and ERK5 pathways synergistically reduces melanoma cell proliferation. Colony formation assays were performed in SSM2c (A), MeWo (B), and A375 (C) untreated (NT) cells or cells treated with DMSO (Vehicle), JWG-071 (1 μM), or GANT61 (1 μM), alone or in combination (JWG + GANT). Histograms represent mean ± SD from three independent experiments. Representative images of plates are shown. * p < 0.05, ** p < 0.01, *** p < 0.001, **** p < 0.0001 as determined by Student’s t-test. § Bliss independence score (>0) indicates synergistic effects over single treatments. (D) Cell viability assay was performed on SSM2c, MeWo, or A375 cells treated with DMSO (Vehicle) or with the indicated treatment for 72 h. MTT assay was performed in three independent experiments. In the graph are indicated the bliss independence scores for all drug combinations. Bliss score > 0 indicates synergism, = 0 additivity, < 0 antagonism.
Ijms 22 11259 g005
Publisher’s Note: MDPI stays neutral with regard to jurisdictional claims in published maps and institutional affiliations.

