Article

Human Epidermal Zinc Concentrations after Topical Application of ZnO Nanoparticles in Sunscreens

1
Department of Physics and Astronomy & Earth and Planetary Sciences & Clinical Medicine, Macquarie University, Sydney 2109, Australia
2
ARC Centre of Excellence for Nanoscale BioPhotonics, Sydney 2109, Australia
3
Clinical Health Sciences and Basil Hetzel Institute for Translational Health Research, University of South Australia, Adelaide 5000, Australia
4
National Research Centre “Kurchatov Institute”, Moscow 123098, Russia
5
Diamantina Institute, University of Queensland, Brisbane 4072, Australia
6
Centre of Biomedical Engineering, Sechenov University, Moscow 119991, Russia
*
Authors to whom correspondence should be addressed.
These authors contributed equally to this work.
Int. J. Mol. Sci. 2021, 22(22), 12372; https://0-doi-org.brum.beds.ac.uk/10.3390/ijms222212372
Submission received: 24 October 2021 / Revised: 9 November 2021 / Accepted: 11 November 2021 / Published: 16 November 2021
(This article belongs to the Special Issue Challenges, Opportunities, and Innovation in Local Drug Delivery)

Abstract

:
Zinc oxide nanoparticle (ZnO NP)-based sunscreens are generally considered safe because the ZnO NPs do not penetrate through the outermost layer of the skin, the stratum corneum (SC). However, cytotoxicity of zinc ions in the viable epidermis (VE) after dissolution from ZnO NP and penetration into the VE is ill-defined. We therefore quantified the relative concentrations of endogenous and exogenous Zn using a rare stable zinc-67 isotope (67Zn) ZnO NP sunscreen applied to excised human skin and the cytotoxicity of human keratinocytes (HaCaT) using multiphoton microscopy, zinc-selective fluorescent sensing, and a laser-ablation inductively coupled plasma–mass spectrometry (LA-ICP-MS) methodology. Multiphoton microscopy with second harmonic generation imaging showed that 67ZnO NPs were retained on the surface or within the superficial layers of the SC. Zn fluorescence sensing revealed higher levels of labile and intracellular zinc in both the SC and VE relative to untreated skin, confirming that dissolved zinc species permeated across the SC into the VE as ionic Zn and significantly not as ZnO NPs. Importantly, the LA-ICP-MS estimated exogenous 67Zn concentrations in the VE of 1.0 ± 0.3 μg/mL are much lower than that estimated for endogenous VE zinc of 4.3 ± 0.7 μg/mL. Furthermore, their combined total zinc concentrations in the VE are much lower than the exogenous zinc concentration of 21 to 31 μg/mL causing VE cytotoxicity, as defined by the half-maximal inhibitory concentration of exogenous 67Zn found in human keratinocytes (HaCaT). This speaks strongly for the safety of ZnO NP sunscreens applied to intact human skin and the associated recent US FDA guidance.

Graphical Abstract

1. Introduction

Advances in the rapidly growing field of nanotechnology have generated several new and effective products now being used in cosmetic formulations [1,2,3], in dermatology [4,5], and in nanomedicine [6,7,8]. However, due to the widespread application of nanotechnology products in industry, medicine and daily life, concerns have been raised as to whether they lead to adverse effects to humans and environment [9,10,11], including previously unknown toxicities [12]. This aspect has led to the field of nanotoxicology, defined as a toxicological assessment of engineered nanomaterials [13].
Zinc oxide (ZnO) nanoparticles (NPs) are widely used in cosmetic products, with 70% of all ZnO NPs now being used in personal care products, including as sunscreens to filter the harmful ultraviolet sunlight radiation (UVA (320–400 nm) and UVB (290–320 nm)) [14]. NPs of ZnO (<30 nm) are typically incorporated into sunscreen formulations as they are aesthetically appealing, appearing transparent on the skin, and are effective in reflecting UV absorption [15]. Typically, ZnO NPs with a diameter between 20 and 100 nm are incorporated into sunscreen formulations [16], which is the size range selected for the stable isotope engineered ZnO NPs designed and used in this study.
Controversy has existed over the last decade regarding the safety of ZnO NPs [17], with concerns raised regarding in vitro studies used to study ZnO NP cytotoxicity [18]. ZnO NPs are suggested to induce cyto- and genotoxicity in human epidermal keratinocytes through DNA damage, intracellular reactive oxygen species (ROS), and oxidative stress [19,20]. However, the cytotoxic concentrations of ZnO NPs vary with the type of immortalised keratinised monolayers and cell culture media used and range from 0.8 to 5 μg/mL in the human epidermal cell line (A431) [21] to 30–50 μg/mL for the HaCaT cell line in DMEM [22]. Typically, ZnCl2 or ZnSO4 have been used to model soluble Zn salts at equal stoichiometric Zn2+ concentrations as a positive control [23,24]. Unfortunately, these studies do not translate to in vivo human skin toxicity as the cytotoxic concentrations are less than or similar to the reported endogenous human epidermal zinc concentrations of 60 µg/g of dry weight [25,26]. Thus, it is apparent that in vitro keratinocyte monolayers may lead to misleading conclusions not relevant to in-use scenarios and the use of in vivo or ex vivo human skin is required to define the realistic safety of ZnO NPs and their dissolved zinc species.
To date, research related to ZnO NPs applied to human skin has been focussed on the extent to which ZnO NPs penetrate human skin after topical application. Gamer et al. [27] and Cross et al. [28] analysed the penetration of ZnO NPs across full-thickness porcine skin and human epidermal membranes, respectively. Zvyagin et al. [29] and Roberts et al. [30] were the first to use non-invasive multiphoton imaging to show that zinc oxide does not penetrate the outermost layer of the skin, the stratum corneum (SC), a finding also reported in later studies [31,32,33,34,35]. According to a published report by the Therapeutic Goods Administration (TGA) of Australia concerning the safety of inorganic sunscreens, ZnO NPs do not cause adverse health effects unless they reach the viable epidermis (VE) [36]. Since their penetration is limited to the SC, systemic absorption and consequent toxicity is unlikely [16,20,28].
The dissolution of ZnO NPs at the sunscreen–skin interface and subsequent permeation of solubilised zinc species throughout the VE has been observed [31]. It has been known for several decades that the human skin has an acid mantle with a pH 4–6 and a pH gradient across the SC ranging from pH 4.5–5.3 at the surface to pH 6.8 in the stratum basale [37]. This can elicit the dissolution of topically applied ZnO NPs and concomitant percutaneous absorption of zinc. Previously, an increase of zinc concentration in human skin has been reported following the exposure to topical formulations containing ZnO [38,39], although conversely, in pig skin after application of microfine ZnO, one study suggested that the levels found were similar to those dosed with the control vehicle [27]. Our work using in vitro human epidermal cells, viable and non-viable ex vivo human skin showed that solubilised zinc species that underwent dissolution can penetrate human skin after topical application of ZnO NPs used in commercial sunscreens even after simulated in use scenario [31,40,41]. To the best of our knowledge, our work showing an increase in epidermal zinc concentrations after application of ZnO NPs are the only in vivo human studies to date [42,43,44].
As zinc is the second-most abundant trace element in the human body [45], Gulson et al. [46] used the traceable isotope 68Zn to quantify zinc by inductively coupled-plasma–mass spectrometry (ICP-MS) in blood and urine samples of volunteers exposed to sunscreens containing ZnO NPs in an outdoor setting. They also measured zinc absorption in indoor studies using photochemical-based formulations containing ZnO NPs (mean diameter, ~30 nm; 68Zn enrichment, 52%) [47]. They found a small increase of 68Zn within volunteers’ blood and urine after a 5-day application, with the highest levels being observed for women dosed with ZnO NPs. As ICP-MS only measures Zn ions after acid digestion of samples, Gulson et al. were unable to determine whether intact ZnO or solubilised zinc species penetrated the skin and the localised skin concentrations were not determined.
In this work, we applied Gulson’s approach [48] to definitively quantify zinc ion absorption from ZnO NPs into the VE to determine the resulting exogenous zinc concentrations achieved after topical application to intact human skin, as well as to relate them to the endogenous zinc concentrations and to define the exogenous zinc concentrations associated with zinc-induced human keratinocyte (HaCaT cell line) cytotoxicity. We synthesised ZnO NPs enriched with 67Zn and investigated the distribution of 67ZnO NPs and dissolution products in either excised human skin epidermis (HSE) or freshly excised full-thickness human skin topically treated with 67ZnO NP sunscreen formulation. The distribution of 67ZnO nanocrystals on the superficial layers of HSE was imaged by using two-photon second harmonic generation (SHG) microscopy characterised by the reduced background [29,49,50]. The distribution of free 67Zn2+ and 67Zn labile species in SC and VE of stained HSE with zinquin and Zinpyr-1 (ZP1), respectively, were acquired by confocal microscopy. 67Zn amounts in freshly excised full-thickness human skin were quantified and mapped by ICP-MS and LA-ICP-MS, respectively. Percutaneously absorbed 67Zn in VE was compared with IC50 assayed in human keratinocytes (HaCaT cells). Figure 1 illustrates the multi-modal techniques used in this study.
This is the first time, to the best of our knowledge, that the potential human epidermal cytotoxicity of sunscreens that incorporate ZnO NPs has been evaluated based on the exogenous zinc ion concentrations detected in the epidermis. Our results support the view that sunscreens containing ZnO NPs are safe after topical application to intact human skin.

2. Results and Discussion

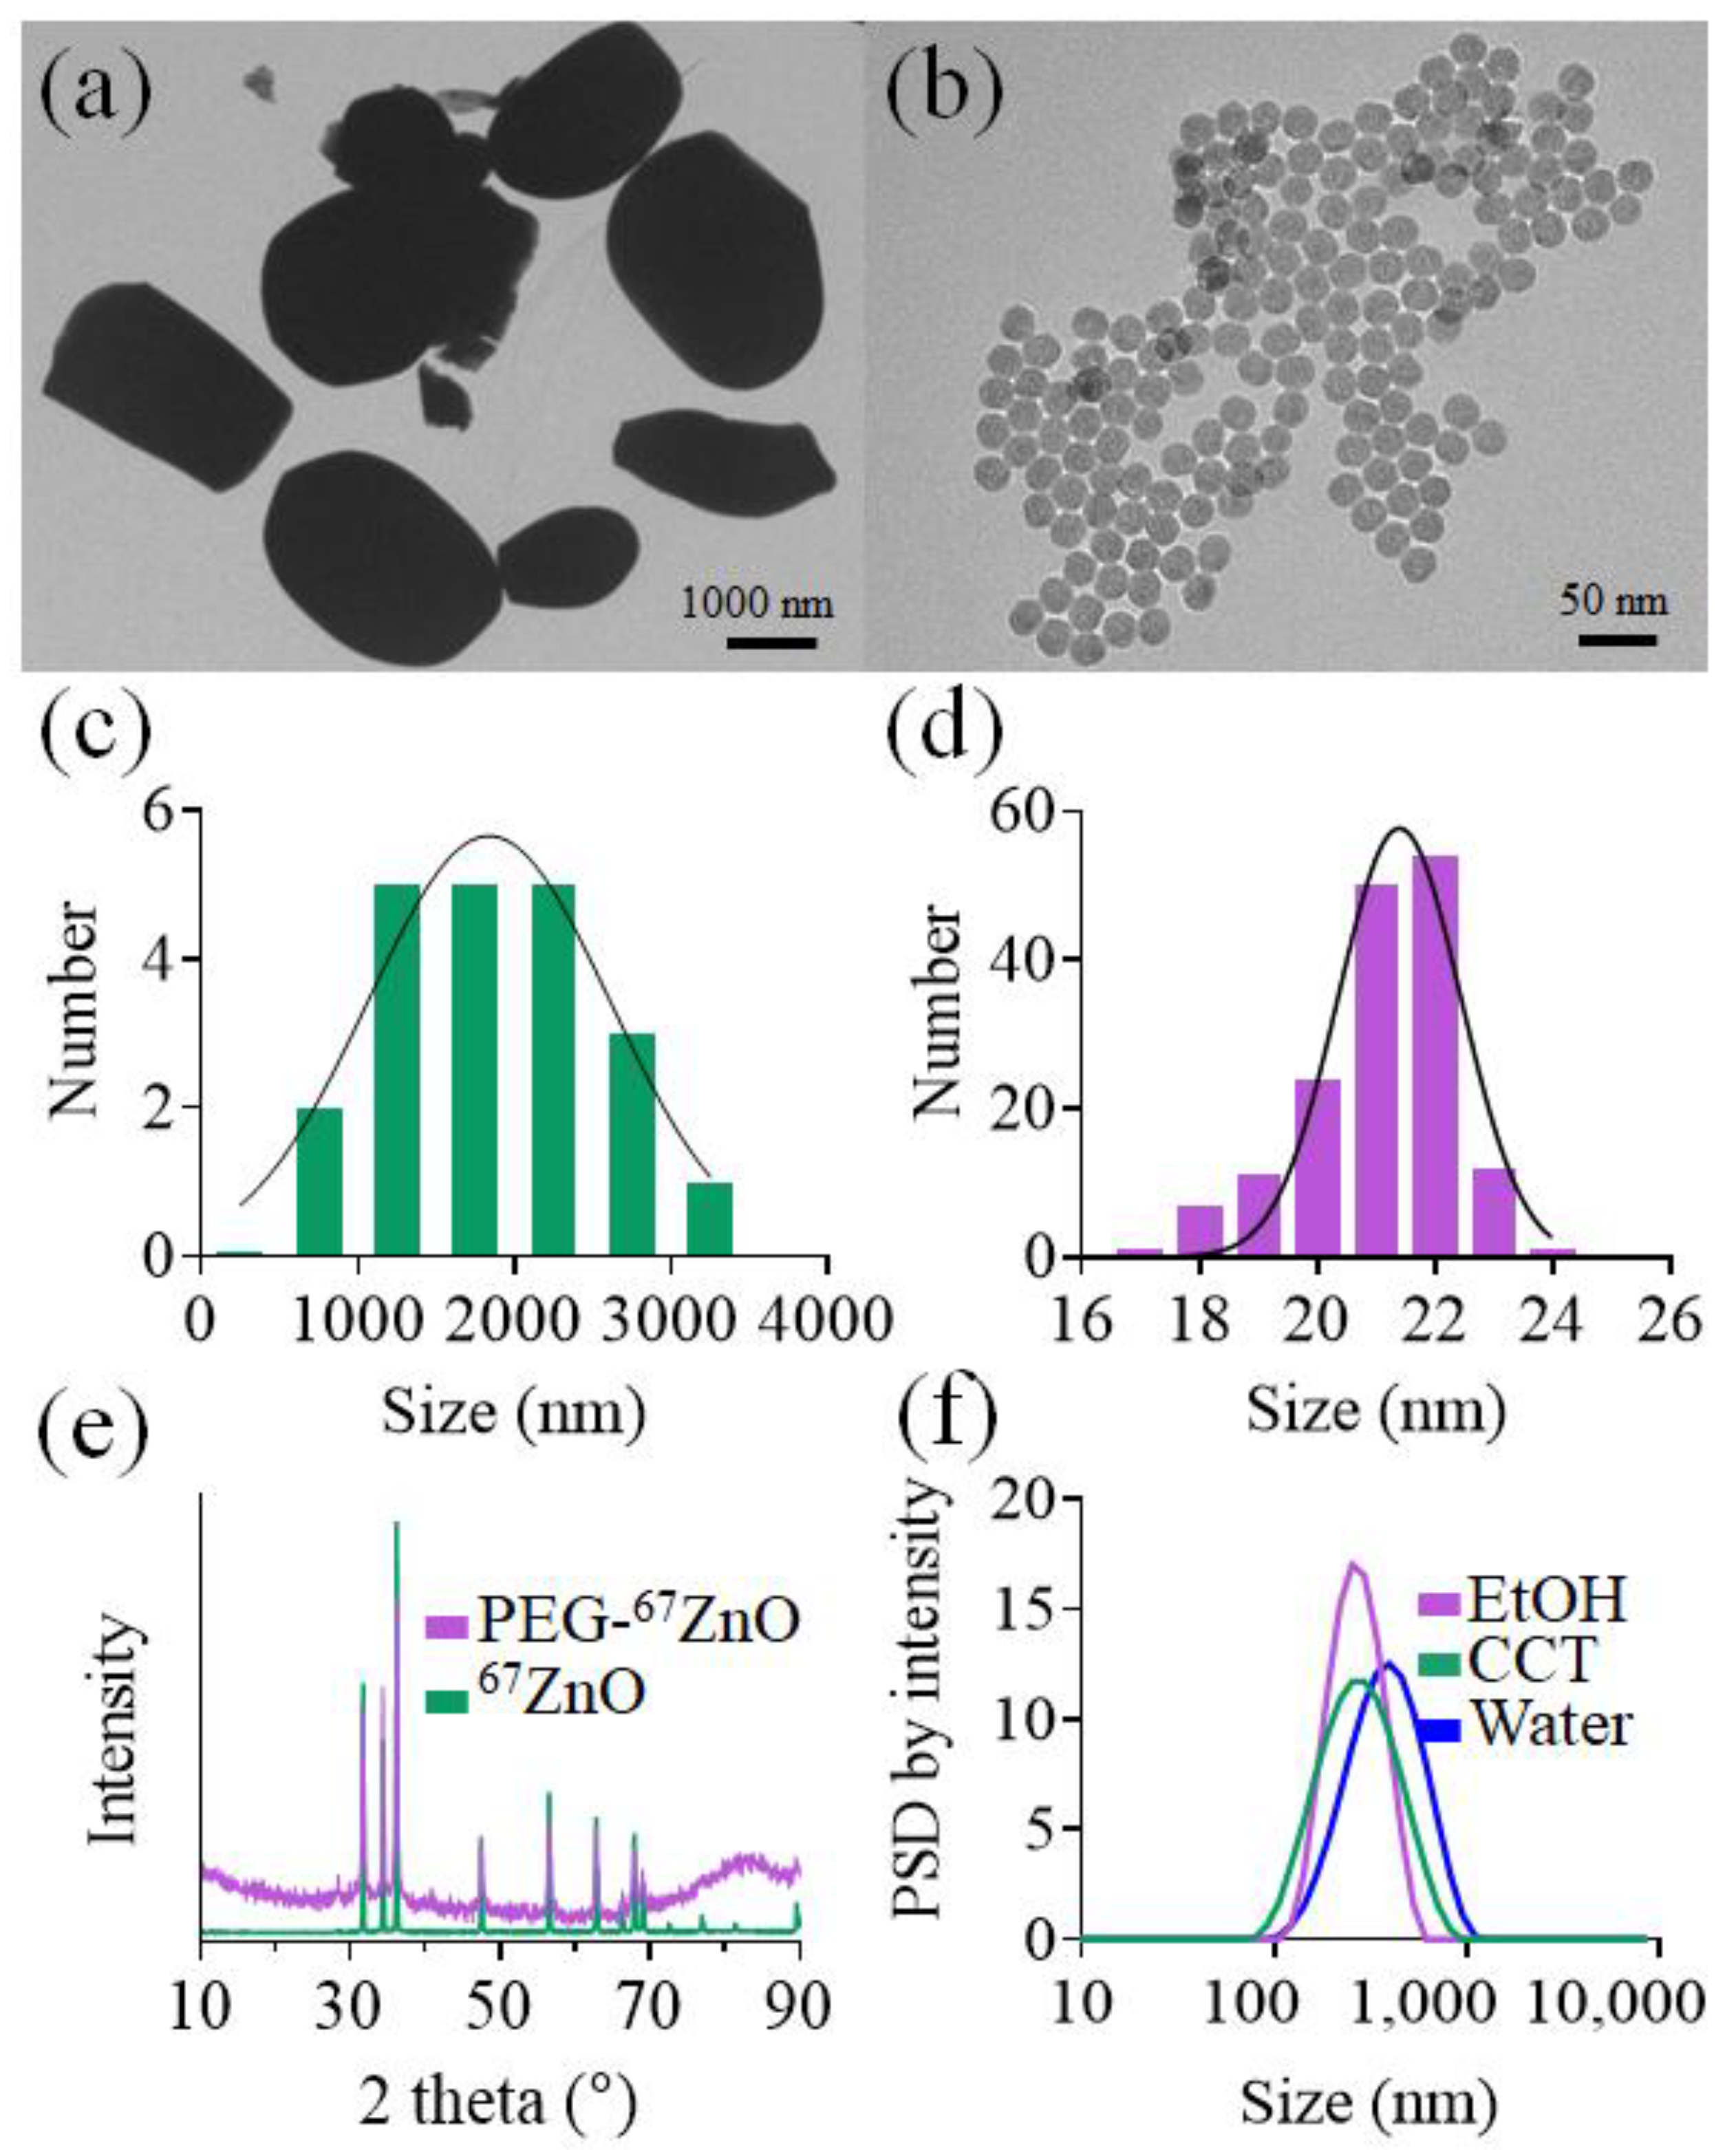
2.1. Characterisation of 67ZnO-PEG NPs

Transmission electron microscopy (TEM) images of micrometre-scale and nanometre-scale 67ZnO powders are presented in Figure 2a,b. The as-synthesised 67ZnO-PEG NPs were spheroidal in shape with a mean size of 20 nm. The particle size distribution was analysed using TEM images by fitting the histogram with a normal distribution function (Figure 2c,d), yielding FWHM (full width at half maximum), of 4 nm. By controlling the synthesis parameters, as-synthesised NPs were in the diameter range of 20–100 nm (see Supplementary Materials, Section S1, Figures S1 and S2 and Table S1). The acquired and analysed XRD spectra of the micrometre-scale and nanometre-scale 67ZnO powders (Figure 2e) showed hexagonal wurtzite crystal structure for both samples, reference code 01-079-207 of the International Centre for Diffraction Data (ICDD). 67ZnO-PEG NP XRD peaks were broadened in comparison with micrometre-scale 67ZnO. These results show the potential of the reported co-precipitation protocol to produce near monodispersed ZnO NPs with a tuneable size range.
The mean hydrodynamic diameters and (polydispersity indices) of 67ZnO-PEG NP suspensions in MQ water, ethanol (EtOH), and capric caprylic triglyceride (CCT) determined by the dynamic light scattering were 341 nm (0.162), 254 nm (0.180), and 248 nm (0.063), respectively (Figure 2f). The difference between the primary size determined by TEM and these results indicated that the NPs aggregated in the solvents: less in CCT, more so in water. Aggregation of ZnO NPs in ultra-pure MQ water is due to low ionic strength of the solvent and a lack of stabilising organic matter [51], whereas in CCT, there is reduced aggregation potentially due to its increased viscosity of the solvent conceivably inhibiting diffusion and particle collisions [52]. However, in aqueous solvent, the dissolution of zinc ions from bulk ZnO (diameter ~1920 nm) was reduced compared to that of ZnO NPs (20–75 nm) due to the increased surface area for dissolution available for the NPs [53]. Therefore, increasing the size of the particles through aggregation would likely decrease the dissolution of ionic zinc species [54], this effect would be reduced for CCT due to lower observed aggregation and that it is a non-aqueous solvent.

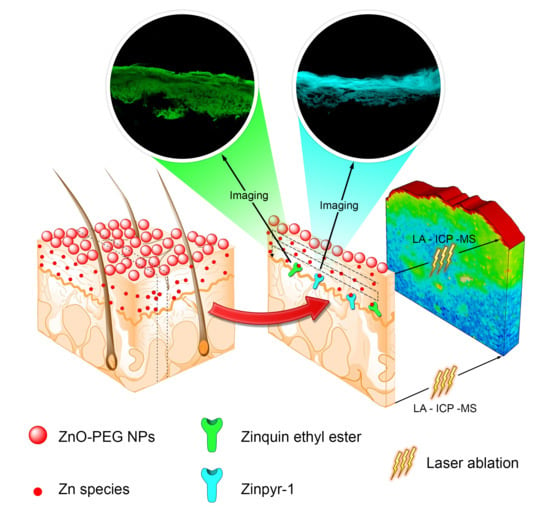
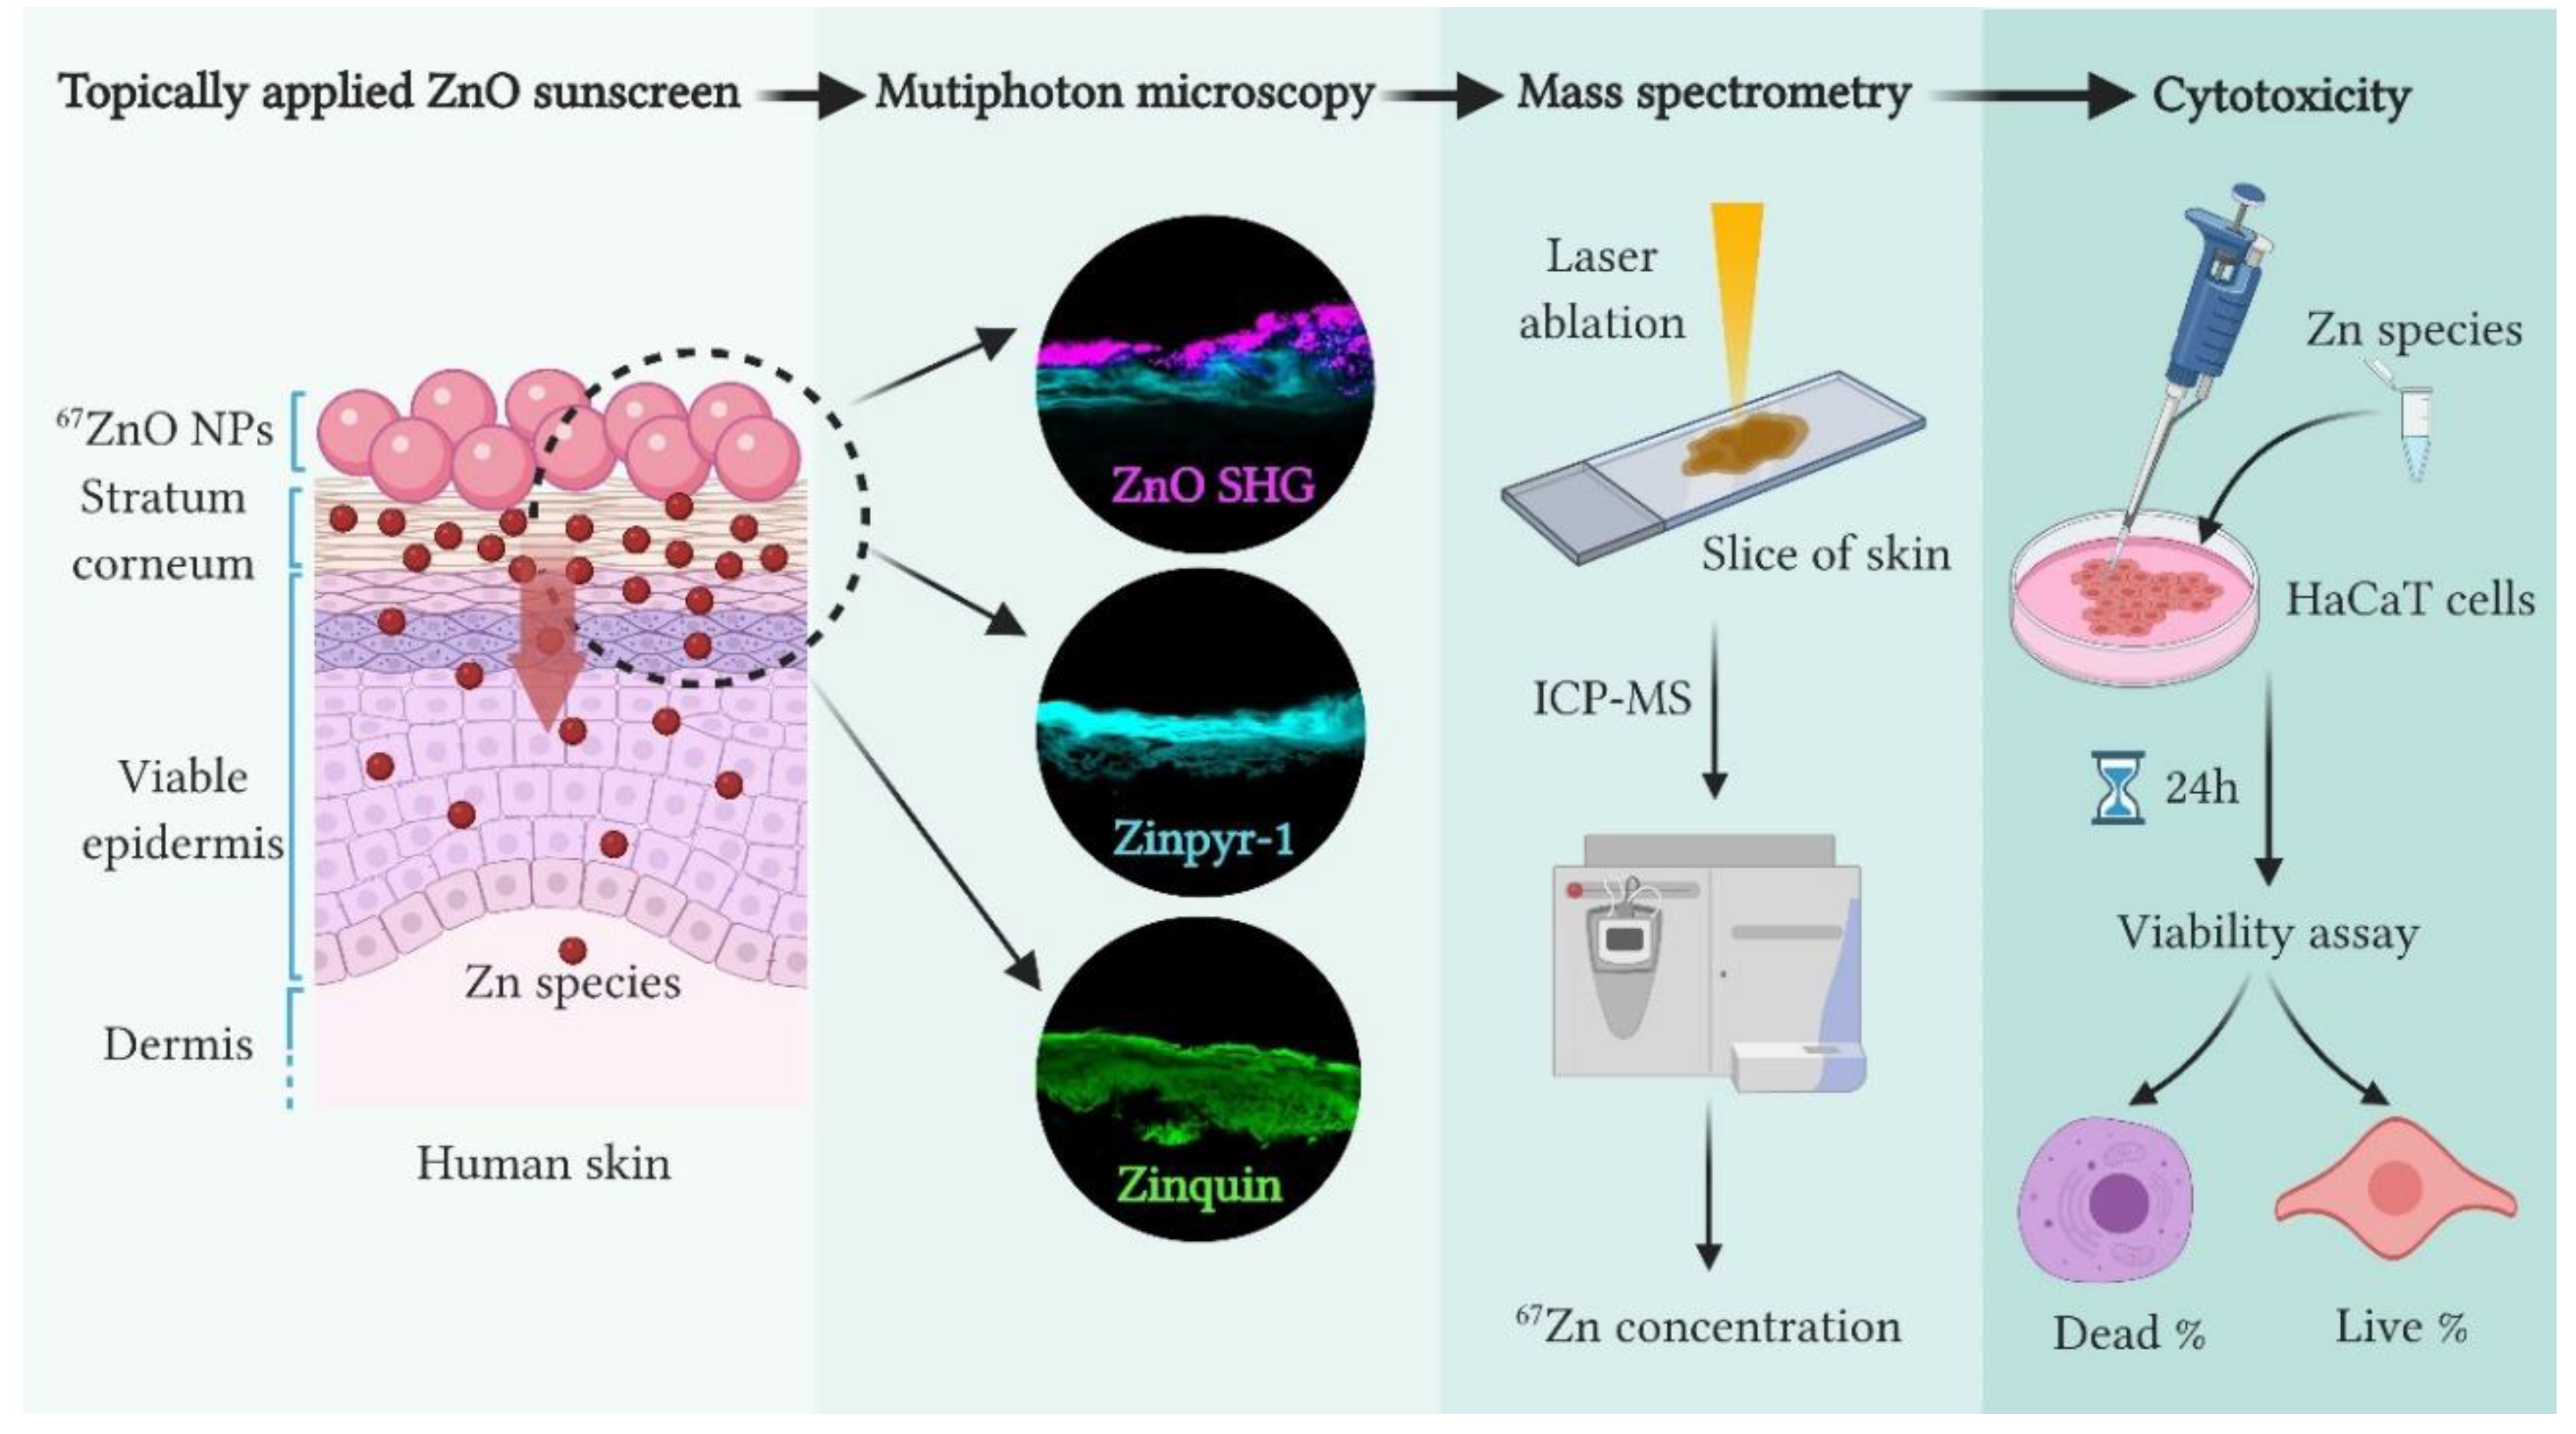
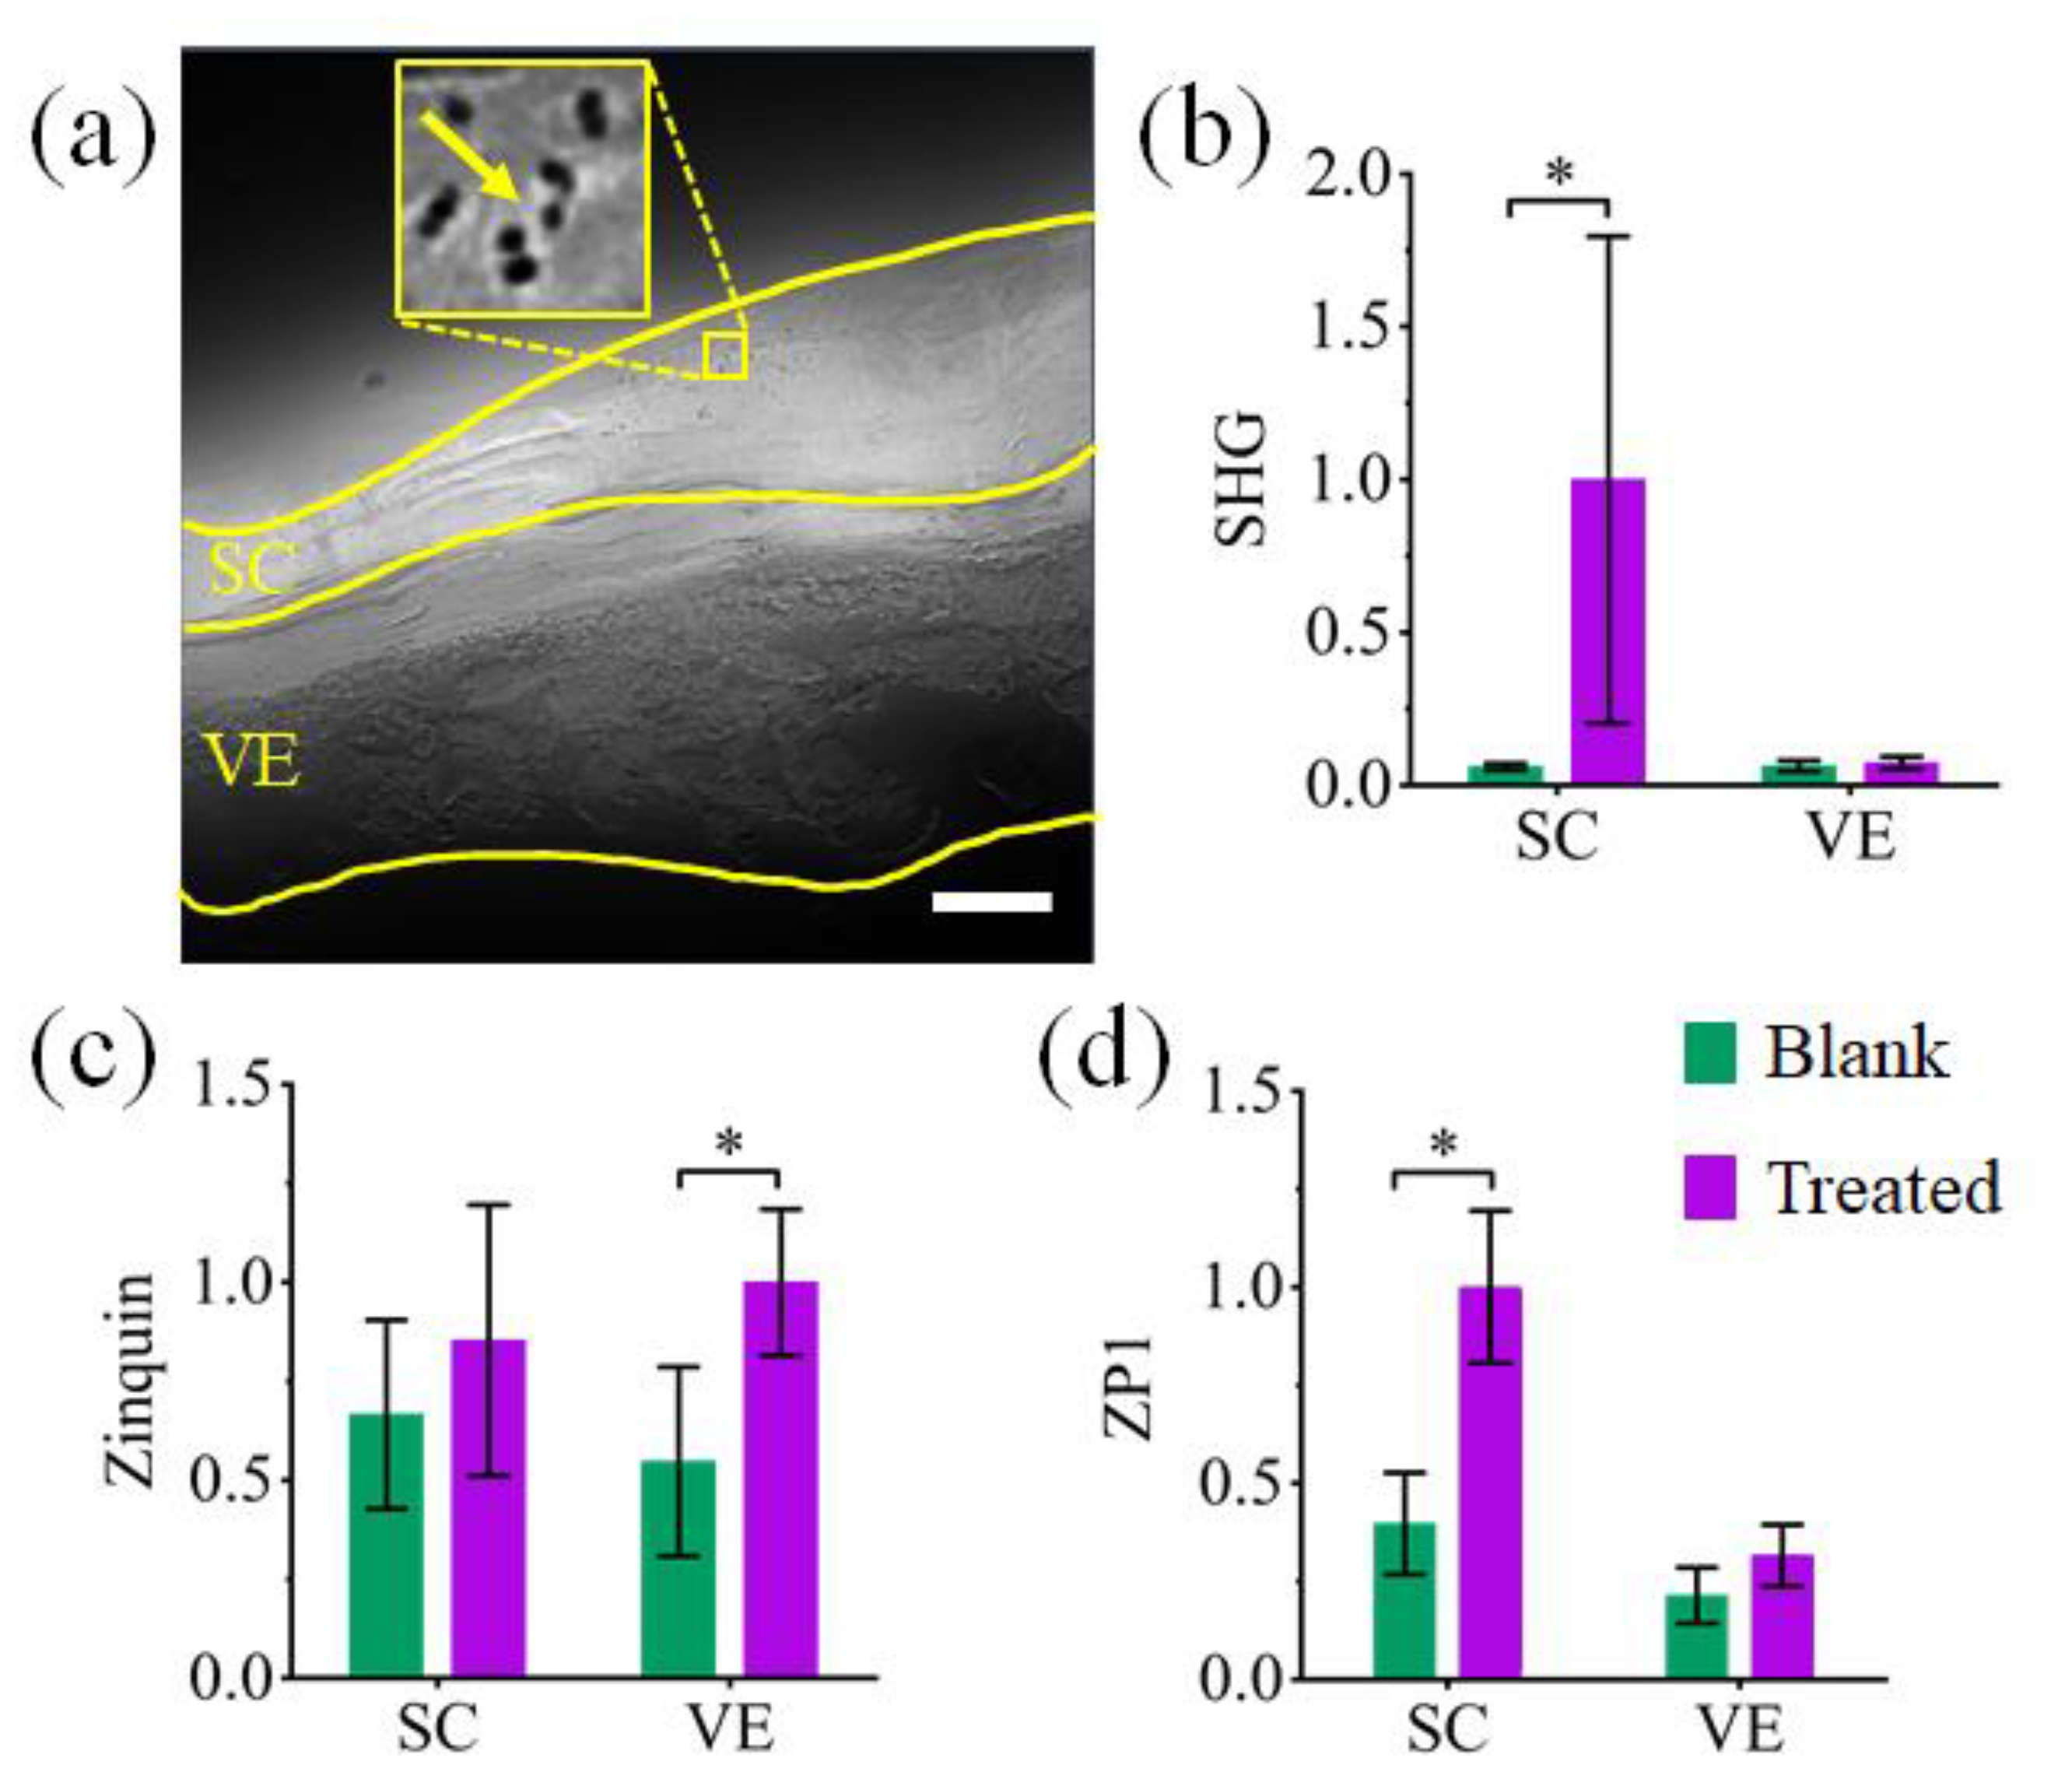
2.2. Multiphoton Microscopy Imaging

Multiphoton and confocal microscopy images of HSE are shown in Figure 3. SHG images (magenta) are shown in Figure 3, as observed in HSE treated with the 67ZnO-PEG NPs in CCT formulation (hereafter, “treated”). At the same time, no SHG signal was detected in the fluorescent channels spectrally configured for ZP1 (cyan) and zinquin (green). SHG signals were confined within the outer layers of the SC of the treated HSE, and not in the VE. Considering SHG originated exclusively from ZnO nanocrystals, this result indicated that no NPs penetrated the SC into VE. HSE (dermis removed) was used in these experiments to remove the inherent SHG signal of the collagen found throughout the dermis of human skin. Confocal microscopy images of the blank and treated HSE stained with zinquin and ZP1 zinc sensors are shown in Figure 3 and reported on the presence of intracellular and labile zinc species in HSE, respectively. It is important to note the positive fluorescence contrast of both zinquin- and ZP1-stained HSEs in both SC and VE. The contrast increased in the treated HSE in comparison with the blank HSE, as shown in Figure 3. Superimposed images of SHG and zinc sensors clearly delineate the distribution of 67ZnO-PEG NPs in SC and ZnO dissolution species across the treated HSE. The results of the multiphoton microscopy were also confirmed by structured illumination microscopy, as shown in Figure 4a. 67ZnO-PEG aggregates were detected across the superficial layers of the SC (spots marked by a yellow arrow) and no penetration was observable beyond the SC.
To evaluate the uptake of zinc species in the treated HSE, we plotted the fluorescence intensities of the zinc sensors and SHG intensity averaged over the SC and VE layers of the treated and blank HSE in Figure 4b–d. The SHG signal was found to be negligible in the VE of both treated and blank HSE, although as expected it was significantly greater in the SC of the treated HSE in comparison with the negligible SHG in the blank HSE’s SC (Figure 4b). The zinquin and ZP1 fluorescent signals were enhanced in the treated HSE in comparison with that of the blank HSE (Figure 4c,d). A statistically significant increase of the ZP1 fluorescence (p ≤ 0.05, n = 7) in the SC of the treated HSE indicated an enhanced uptake of labile zinc species within the SC, following the dissolution of 67ZnO-PEG NPs. This observation is supported by the observed zinc levels in the treated SC using X-ray fluorescence microscopy technique [55]. It has been reported that zinc sequestration into zinc-containing proteins diminishes the ZP1 fluorescence [56]. The reduced ZP1 fluorescence in the VE of the treated and blank HSE suggests that labile Zn was sequestered by intracellular proteins in VE as shown by no increase in ZinPyr-1 intensity in Figure 3. This inference was corroborated by the increased signal in zinquin fluorescence resulting from the increase in bound intracellular zinc in the treated HSE VE. Zinquin is known to be less discriminate between free, labile and bound intracellular zinc species as it measures all intracellular zinc [57], and as such, revealed a statistically significant uptake of exogenous zinc in VE resulting from 67ZnO-PEG NP topical application on excised skin.
We note that, in general, fluorescence assays of zinc sensors provide quantitative evaluation of the zinc concentration relative to a control which can be used for comparison between treated and blank skin samples. To assess the potential cytotoxic effects of Zn2+ and zinc species, quantitative measurements of the zinc uptake in treated and blank skin were performed [58].

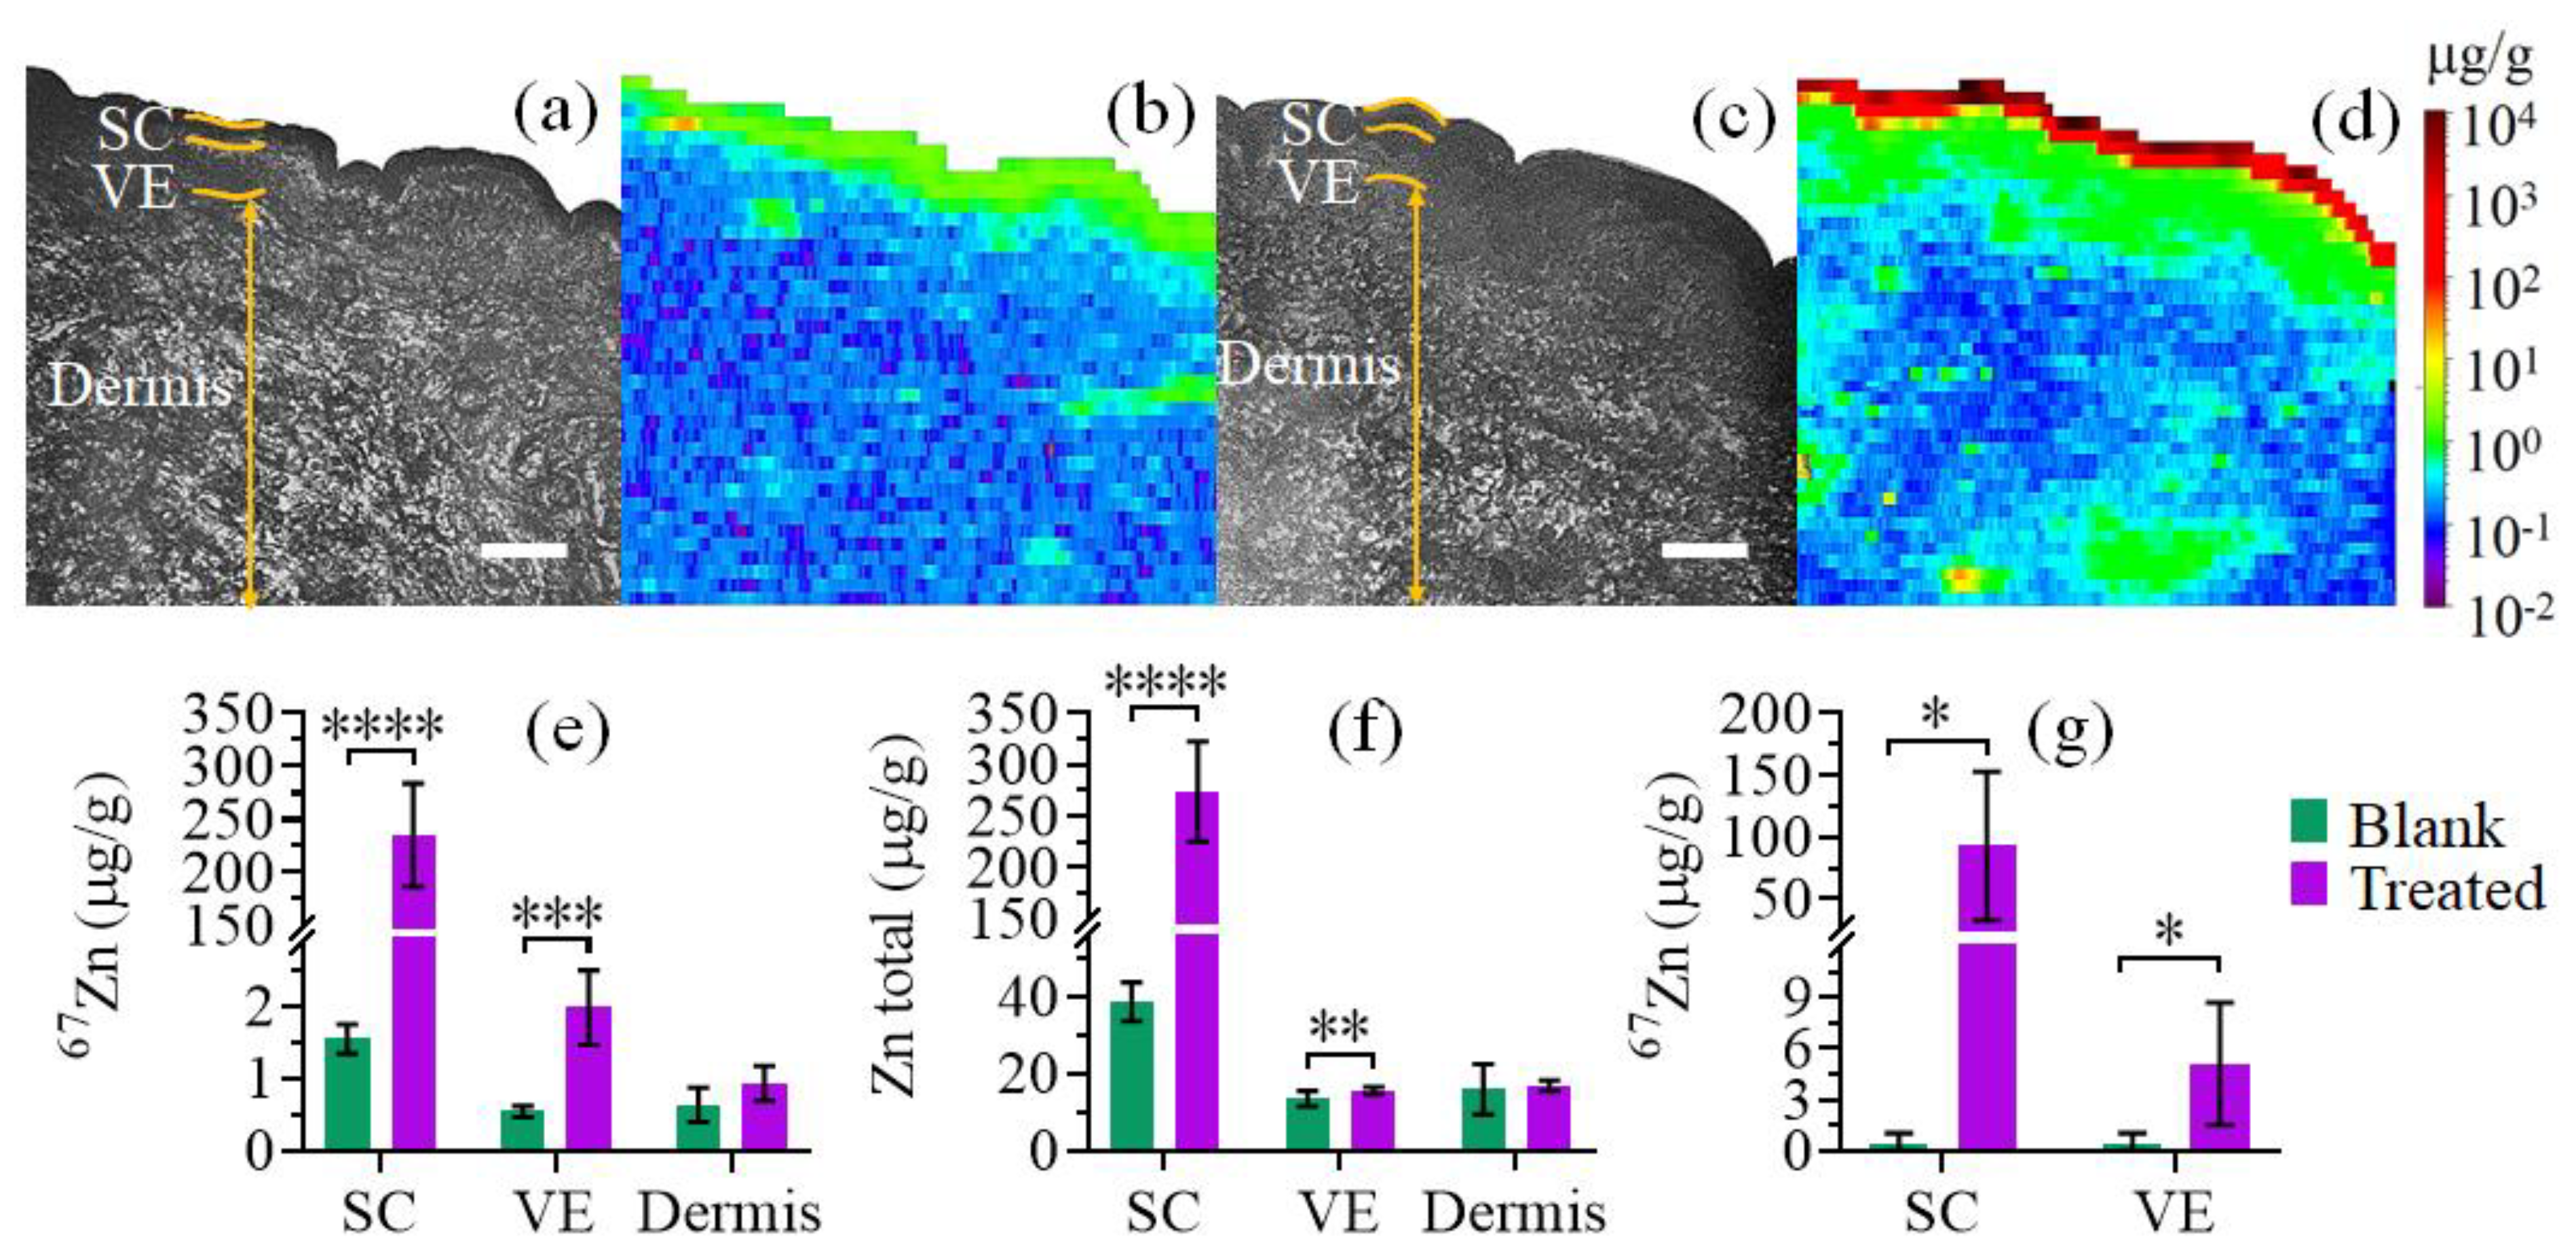
2.3. Quantitative Measurement of Absorbed 67Zn in Skin Layers by LA-ICP-MS and ICP-MS

LA-ICP-MS analysis was carried out using cross-sectioned freshly excised full-thickness human skin treated with either blank CCT (blank skin) or 67ZnO-PEG NPs (20 %wt/wt) in CCT (treated skin). Figure 5a,c shows the brightfield images of cross-sectioned blank and treated skin samples, respectively. The results of LA-ICP-MS analysis are presented as an elemental map of 67Zn for blank (Figure 5b) and treated skin (Figure 5d). Figure 5e presents the mean concentrations of 67Zn tracer in 67ZnO-PEG treated and blank skin sections determined by LA-ICP-MS. A considerable amount of 67Zn was found in the treated skin SC. 67Zn concentration, C Z   67 n gradually reduced from the uppermost layers downwards: 235 ± 49 μg/g of dry tissue in SC to 2.0 ± 0.5 μg/g in VE in the treated skin. 67Zn concentration in dermis of the treated skin was measured as 0.9 ± 0.3 μg/g and deemed indistinguishable from that of the blank skin dermis (0.6 ± 0.2 μg/g). The concentration of exogenous zinc, C e x Z n in skin layers was calculated using C e x Z n = [ C Z   67 n   ( t r e a t e d ) C Z   67 n   ( c o n t r o l ) ] / E 67 , where E 67 —the enrichment factor of 67Zn tracer determined in a separate ICP-MS measurement as 65.4 ± 0.2%, with the results summarised in Table 1.
The endogenous concentration of 67Zn tracer in blank skin VE was found to be C Z   67 n   ( c o n t r o l ) = 0.5 ± 0.1 μg/g from where the concentration of endogenous total zinc, C e n Z n   was estimated using C e n Z n = C Z   67 n   ( c o n t r o l )   / A 67 , where A 67 represents the natural abundance of 67Zn isotope tabulated as 4.04% [59]. The total zinc concentrations in SC, VE and dermis of blank skin were estimated as 39 ± 5 μg/g, 13 ± 2 μg/g, and 16 ± 7 μg/g respectively. This represents an approximately ten-fold increase in the elemental zinc amount accumulated in SC of treated skin ( C Z   67 n   ( t r e a t e d ) = 235 ± 49 μg/g) because of the ZnO NP sunscreen application, with the exogenous zinc combined as ZnO NP aggregates, Zn2+ and zinc species. In VE of the treated skin, we detected a statistically significant increase of the total zinc concentration by ca. 23% (Figure 5f), the exogenous zinc fraction comprised Zn2+ probably existed in protein-bound forms. The exogenous zinc accumulation in dermis was statistically insignificant.
The measured concentration of endogenous epidermal zinc 13 ± 2 μg/g does fall in the range of the reported values [25], but these values vary widely, ranging from 3 to 60 μg/g depending on the analysis technique [26,60]. To validate our results reported here, we carried out a separate experiment to assay C e n Z n , using homogenised untreated human skin by using “gold standard” quantitative technique ICP-MS and its modality LA-ICP-MS (see Section S2, Supplementary Materials). C e n Z n , measured by ICP-MS was 15 ± 4 μg/g. C e n Z n measured by LA-ICP-MS averaged over several sites of the homogenised human skin sample was 11 ± 8 μg/g. C e n Z n measured by ICP-MS and LA-ICP-MS were consistent with each other and consistent with the value of 13 ± 2 μg/g reported here underpinning the reliability of our results.
To validate the results obtained by LA-ICP-MS of cross-sectioned freshly excised skin, we carried out solution-based ICP-MS of tape-stripped HSEs, with the results presented in Figure 5g. Most of the 67Zn tracer was recovered within the wash (630 ± 110 μg/g) and is therefore considered unabsorbed. In comparison with the blank HSE, a significant increase of 67Zn in the treated SC was detected in good agreement with the data by the LA-ICP-MS analysis and fluorescence zinc assays (c.f. Figure 3). 67Zn recovered from the remaining VE after tape-stripping was ca. 4000-fold greater in the treated HSE compared to the blank, amounted to C Z   67 n = 4.5 ± 4.0 μg/g. This value was almost twice of C Z   67 n in VE measured by LA-ICP-MS. This discrepancy was attributed to incomplete removal of the SC containing ZnO NPs from the HSE due to an insufficient number of tape-strips—we applied 3 tape-strips due to the HSE frailty in comparison with the required number of 20 or even 40 tape-strips [61]. Therefore, C e x Z n in VE of the treated HSE derived from the ICP-MS data was overestimated. Ex vivo human skin used in the ICP-MS study was not viable, and therefore the skin’s innate zinc homeostatic system was impaired, including active transport of an excess of zinc to peripheral microcirculation. The amount of 67Zn found in the receptor fluid of the treated samples was comparable with that of the background and indicated that no significant amount of topically applied 67Zn permeated across the HSE to the receptor fluid during the 48-h observation period.
Our results offer an insight into how zinc appeared in the systemic circulation, following ZnO NP sunscreen topical application on volunteer’s human skin [46]. The elevated 67Zn levels could be found within the furrows and superficial layers of the SC, which were attributed to undissolved 67ZnO-PEG NPs. At the same time, the SC of skin contains a significant amount of keratin characterised by abundant sulfhydryl groups of proteins [62]. The high binding propensity of these groups to labile zinc could contribute to the significant Zn concentration detected in the SC. We speculate that the high amount of Zn in the SC acted as a depot for the epidermal permeation of zinc. Previously, this depot led to a long lag of 5 days for the systemic absorption of zinc in human volunteers [46]. Our LA-ICP-MS, ICP-MS and multiphoton microscopy data were consistent and indicative of the presence of the elevated exogenous Zn levels in the VE layers stemmed from Zn species desorbed from ZnO NP-based sunscreen.

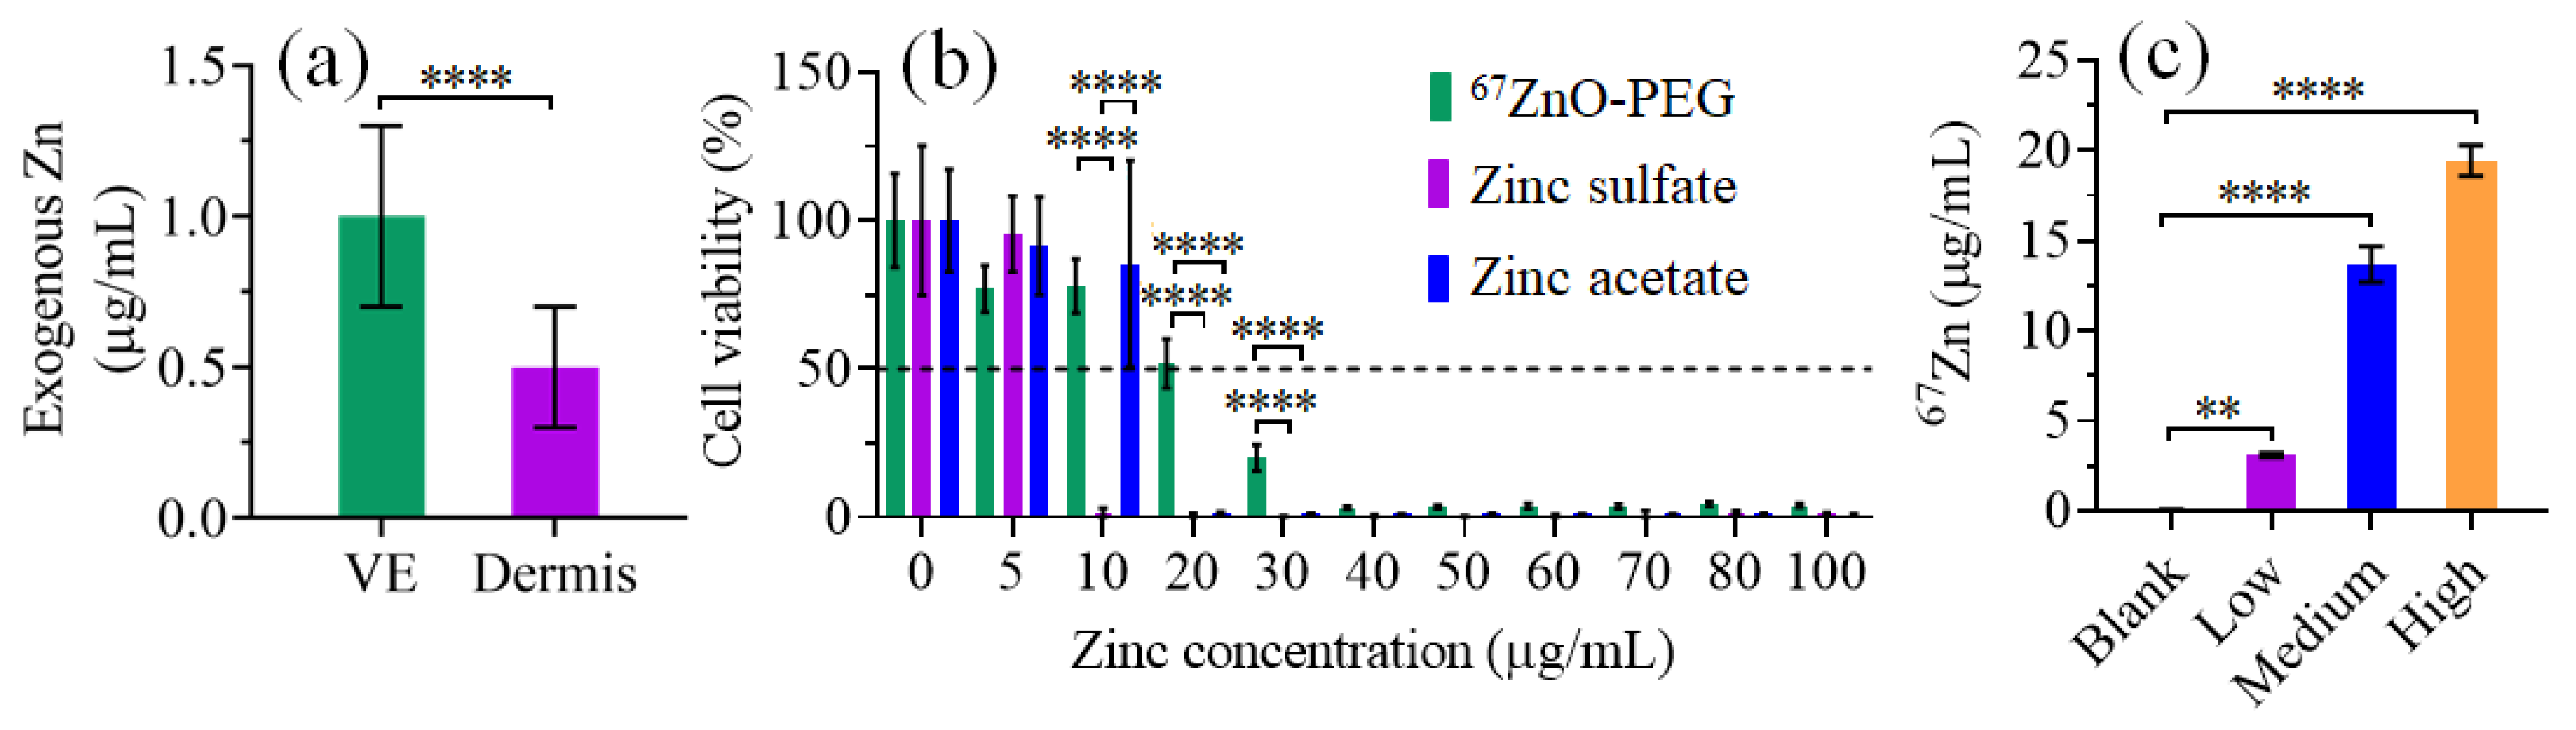
2.4. Cytotoxicity of 67ZnO-PEG NPs in HaCaT Cells

Zinc has specific roles in skin functions and can be detrimental or toxic if present in excessive amounts [63]. The detected Zn species raised a question of whether the excess of zinc that permeates the skin is cytotoxic to keratinocytes within the VE or not? To determine ZnO NP cytotoxicity to keratinocytes, we performed cell viability assays versus Zn concentration. To compare IC50 value expressed in terms of μg/mL with the values in terms of μg of 67Zn per gram of dry tissue (μg/g), μg/g units were converted to μg/mL by using the reported value of the water content in VE (ca. 70%) (see Section S3, Supplementary Materials) [64]. Figure 6a shows data taken from Figure 5f and replotted versus μg/mL, while the exogenous 67Zn concentrations in VE and dermis were recalculated as 1.0 ± 0.3 μg/mL and 0.5 ± 0.2 μg/mL, respectively.
Figure 6b presents the results of the MTT assay of keratinocyte cells (HaCaTs) treated with ionic Zn sources, zinc acetate, zinc sulphate, as well as 67ZnO-PEG NPs, in the concentration range of 0–100 μg/mL. The applied concentrations were expressed in terms of the equivalent concentrations of Zn. Zn salts and 67ZnO-PEG NPs were not cytotoxic at a concentration of <5 μg Zn/mL, although the cell viability was slightly less for 67ZnO-PEG NPs at this concentration. The cell viability dropped at 5–10 μg Zn/mL and 10–20 μg Zn/mL for zinc sulphate and zinc acetate, respectively. The greater cytotoxicity of zinc sulphate observed here was corroborated by in vitro studies using PC12 cells and explained by the greater cellular uptake of zinc [65]. The cytotoxicity of 67ZnO-PEG NPs was characterised by IC50 = 26 ± 5 μg Zn/mL (equivalent to 25 μg/mL of 67ZnO NPs), and appeared less in comparison with that of Zn salts in agreement with literature [66,67].
IC50 of 67ZnO-PEG NPs assayed in complete cell culture medium is not directly comparable with C e x Z n assayed in VE by LA-ICP-MS, because foetal bovine serum (FBS) supplement in cell cultures and extracellular matrix in skin mediates 67ZnO-PEG NP interaction with keratinocytes via two processes. Firstly, ZnO NP solubility depends on the matrix of culture medium [53]. In general, ZnO NP solubility is high in an aqueous solution, yielding mostly Zn2+, with almost complete dissolution achieved at <10 μg/mL. Secondly, a fraction of the dissolved Zn2+ species is sequestered by serum proteins or ligands thus reducing the concentration of potentially cytotoxic species-free zinc. For example, albumin added to complete culture medium in molar excess to Zn2+ markedly reduced labile Zn2+ to the nM range [68] and addition of bovine serum albumin or EDTA to culture media can chelate excess labile zinc reducing cytotoxicity of zinc species to HaCaT cells [41]. It has been reported that 20 μg/mL of ZnO NP yielded ~5 μg/mL of free zinc in complete cell culture media (RPMI1640 supplemented with 10% FBS) and equilibrated at >40 μg/mL of ZnO NPs to yield 10 μg/mL of free zinc [24].
We investigated the production of potentially cytotoxic species in complete culture medium (DMEM + 10% FBS) qualitatively and quantitatively by fluorescent zinc sensor (ZP1) and ICP-MS assays, respectively. HaCaT cells in DMEM + 10% FBS were dosed with Blank, Low (5 μg/mL), Medium (25 μg/mL) and High (50 μg/mL) concentrations of 67ZnO NPs for 24 h, followed by ultracentrifugation to remove cells and serum proteins. The resultant supernatants containing Zn2+ and zinc species bound to low molecular weight ligands (termed here, labile zinc, laZn) were assayed. Qualitative evaluation of C l a Z n based on the fluorescent intensities of zinc sensor ZP1 in the complete cell culture medium (Figure S3) indicated a monotonic increase of the concentration of labile zinc versus the dosed amount of 67ZnO and supported the increased cytotoxicity versus concentration of zinc oxide nanoparticle reported previously [24].
The results of the ICP-MS assay of C Z   67 n are presented in Figure 6c. The concentration of C l a Z n can be calculated by using equation C l a Z n = C Z   67 n   / E 67 . The low dosing (5 μg/mL of 67ZnO-PEG NPs) resulted in a 60-fold increase of C l a Z n and corresponded to an ~25% viability drop (c.f. Figure 6b). The high dosing (50 μg/mL) yielded C l a Z n = 31 ± 2 μg/mL ( C Z   67 n = 20 ± 1 μg/mL) and reduced the cell viability to ~50% level (c.f. Figure 6b). Medium to high dosing range yielded a narrow C l a Z n range of 21–31 μg/mL ( C Z   67 n , 14–20 μg/mL)—also seen in Figure S3—but resulted in a dramatic viability drop from ~50% to 2%, as obvious in Figure 6b within the C Z n range of 20–50 μg/mL. This suggests that the Zn threshold for significant cell toxicity within the culture media falls between C l a Z n range of 21–31 μg/mL per addition of 25–50 μg/mL 67ZnO-PEG NP.

2.5. Discussion

The main objective of this study was to quantify the amounts of labile zinc within the VE after topical application of ZnO NPs to excised human skin. For the first time, to the best of our knowledge, the concentration of exogenous Zn ions in viable epidermis of human skin was measured using a rare stable 67Zn isotope tracing technique and benchmarked against the cytotoxicity threshold to support a notion of ZnO sunscreen safety. We observed that 67ZnO-PEG NPs were localised and retained in the superficial layers of the SC and did not penetrate further into the VE. A statistically significant increase in the signal intensity of a labile zinc-specific probe (ZP1) post 67ZnO-PEG NP application within the SC and a statistically significant increase in the signal intensity of an intracellular zinc probe (zinquin) within the VE supports our hypothesis that zinc species from ZnO NP permeated across the SC to the VE. While most of the zinc was not absorbed percutaneously, an increase of labile zinc was found within the VE and could therefore cause localised toxicity or become systemically available. However, the cytotoxicity is dependent on the speciation of the zinc, its sequestration by extracellular proteins and cellular uptake. We measured Zn concentrations in the VE and crucially found that it was ca. >25-fold lower than the cytotoxicity threshold for 67ZnO-PEG NPs. Furthermore, ZnO NPs did not permeate beyond the SC barrier to the viable keratinocytes, thus evading physical damage caused by the NPs to the cell membranes [69].
The 67Zn concentration recovered between the IC50 and IC90 concentrations of ZnO-PEG NPs in vitro was found to be significantly, at least 15 times, higher than the exogenous zinc concentration permeated within the VE. Interestingly, Yamada et al. [18] estimated that the human epidermal Zn concentrations after a maximum FDA-approved ZnO NP dose in a sunscreen product is about 10 to 50 times lower than that causing toxicity in human epidermal cells. While intact human skin shows a good safety profile it may not stand for an impaired skin barrier as previous work has shown that dissolved zinc species can significantly increase within the VE after topical application of ZnO NPs to impaired excised human skin [40]. We did not evaluate the dissolution of uncoated ZnO NPs versus PEG-ZnO NPs specifically. According to the literature, the aqueous solubility of PEG-coated ZnO is comparable to that of uncoated ZnO nanoparticles. However, in cell culture medium (RPMI-1640) supplemented with FBS, the solubility of ZnO is almost twice that of PEG-ZnO nanoparticles [70].

3. Material and Methods

3.1. Synthesis of 67ZnO-PEG NPs via a Co-Precipitation Method

All reagents were of analytical grade and used as received without further purification. Acetic acid (CH3CO2H, ≥99.7%), poly(ethylene glycol) (PEG; average molecular weight 200 Da), potassium hydroxide (KOH, ≥85%), cyclohexane (99.5%), isopropyl alcohol (≥99.7%), acetone (≥99.5%), were obtained from Sigma-Aldrich Chemicals (Sydney, NSW, Australia). Ethanol (EtOH; 100% undenatured) was supplied from Chem-Supply (Adelaide, SA, Australia). Micron-sized ZnO powder enriched to >65% 67Zn and a chemical purity >99.96% was supplied by FSUE Integrated Plant Electrohimpribor (Lesnoy, Russia), and produced by an electromagnetic enrichment method (calutron).
A top-down chemical approach based on the co-precipitation method was used to etch 67ZnO micrometre-scale particles to nanoscale 67ZnO particles (see Supplementary Materials, Section S1, for details). The precursor concentrations and time were optimised by using commercial ZnO powder. Briefly, as-received 67ZnO micro-particles were mixed with acetic acid at the molar ratio of 1:2 heated to 50 °C to produce enriched zinc acetate 67Zn(Ac)2 salt, which was dried at the same temperature for 2 h. Then, 10 mL of 0.1-M 67Zn(Ac)2 was mixed with 0.7-mL PEG and stirred for 30 min at room temperature. Then, 5 mL of 1 M KOH solution was added dropwise and stirred at room temperature to obtain white gel, which was transferred to a water bath preheated to 75 °C. The precipitate of formed 67ZnO-PEG NPs was heated for 1 h to complete the reaction. The precipitate was collected and washed several times with EtOH.
To produce sunscreen formulation mimicking commercially available sunscreens, 20 %67ZnO-PEG (wt/wt) was mixed with capric caprylic triglyceride (CCT). To this aim, EtOH solution of 67ZnO-PEG NPs was centrifuged at 10,000 rpm for 10 min, and re-dispersed in isopropyl alcohol, followed by re-dispersion in acetone, cyclohexane, and finally in CCT.

3.2. Characterisation of 67ZnO-PEG NPs

The size and morphology of micrometre and nanometre-scale 67ZnO materials were determined by TEM (PhilipsCM10, Eindhoven, The Netherlands) operated at the accelerating voltage of 100 kV. To prepare the TEM sample, 67ZnO dry powder was dispersed in EtOH in the concentration of 1 mg/mL, dropped on a copper grid and allowed to dry. The crystal structure of as-synthesised 67ZnO-PEG NPs was determined by an X-ray diffractometer (PANalytical X’Pert Pro MPD) with a Cu Kα X-ray radiation source at the characteristic wavelength of 1.5418 Å. The data were collected over an angular range of 10–80°, step size 0.017°. The hydrodynamic diameter and polydispersity index of 67ZnO-PEG NPs dispersed in CCT, EtOH and MQ water in polystyrene cuvettes (Sigma-Aldrich, Sydney, NSW, Australia) were measured using a dynamic light scattering instrument (DLS; Zetasizer NS, Malvern, UK). 67ZnO NPs in CCT, EtOH, and MQ water were prepared at the concentration of 1 mg/mL and sonicated for 30 min.

3.3. Preparation of Heat-Separated Human Epidermis Samples

Human skin patches were excised from female donors (n = 3, aged 46–53 years) undergoing abdominoplasty surgical procedures. Prior to the research, informed written consent was obtained from all participants (The Queen Elizabeth Hospital, ethics approval protocol-2009208). The subcutaneous fat was removed by blunt dissection, and the skin samples were placed in a water bath at 60 °C for 90 s to separate the epidermis from the dermis. The human skin epidermis (HSE) was then floated on water and placed onto a filter paper to dry. The processed HSE samples were kept in ziplock bags at −20 °C and were used within 6 months.

3.4. Skin Penetration Assay

After thawing HSE, if necessary, 3-cm-diameter disks were cut out from the skin patches and mounted on static Franz diffusion cells. The receptor and donor chambers were filled with 3.5 mL and 1 mL of PBS buffer (pH 7.4), respectively, and placed in a water bath at 35 °C for 30 min to equilibrate. The transepithelial electrical resistance was measured (>20 kW) to ensure the HSE sample integrity according to Cross et al. [28]. To measure transepidermal water loss, PBS buffer was removed from the donor chamber and the skin surface was blotted dry. The measurements were carried out using an Aquaflux instrument (Biox Systems, London, UK) at 23.2 °C and 44.5% humidity to select HSE membranes with values <40 g/m2/h to ensure the skin barrier integrity. The PBS buffer was removed and replaced with 3.5 mL of HEPES buffer that was used as receptor fluid.
The HSEs were dosed at 2 mg/cm2 of either 20 %wt/wt 67ZnO-PEG NPs in CCT or CCT labelled as treated and blank, respectively, and then incubated at 35 ± 1 °C on a submersible magnetic stirrer for 48 h. We covered HSE surface by the formulation entirely avoiding direct contact with the skin sample. The decreased viscosity of the sunscreen formulation at 35 °C facilitated the uniform spreading. 0.5 mL of the receptor solution was sampled at time points 0, 0.5, 2, 4, 8, 24, and 48 h, and the receptor solution was replenished. The unabsorbed 67ZnO-PEG formulation was washed away after 48 h using a natural sponge immersed in PBS and then blotted dry.
Dried HSEs were weighed, and a tape stripping procedure was then performed three times to remove most of SC [71]. Tape strips, remaining HSE and wash sponges were weighed and transferred to labelled acid-resistant tubes to be digested for ICP-MS analysis.

3.5. Sample Preparation for Microscopy

Human HSE was used in the microscopy experiments to remove the collagen within the dermis that emits the same SHG signal as ZnO NPs. HSEs were cut into 2 × 2 mm2 pieces and embedded in optimal cutting temperature medium, which were then snap-frozen at −80 °C, sectioned into 10-µm-thick slices using a cryostat (Leica. CM 1950, Nussloch, Germany) and mounted on poly L-lysine-coated microscope slides. The slide mounted HSE samples were stained with 10 μL of ZP1 or zinquin following a protocol reported elsewhere [31]. An excess of the staining solution was removed after 10 min and rinsed twice with ultrapure MQ water. Finally, the sections were covered with coverslips and sealed for microscopy observations.

3.6. Multiphoton Laser-Scanning Microscopy

Stained HSE sections were imaged using a Zeiss LSM710 multiphoton microscope equipped with an argon gas laser (488 nm) and a tuneable titanium-sapphire femtosecond pulsed laser (Mai Tai, Spectra Physics, Stahnsdorf, Germany). A high numerical aperture objective (40×/NA1.1) was used. The SHG signal of dispersed 67ZnO-PEG NPs in CCT was detected at 400 nm by using the excitation at 800 nm (6.3 mW). The limit of quantification (LOQ) of ZnO NPs was previously determined by Leite-Silva et al. [33]. ZP1 and zinquin fluorescent sensors were excited by the argon (488 nm (0.7 μW)) and femtosecond (740 nm (6.3 mW)) lasers, with emission detected at 540 nm–560 nm and 490 nm, respectively. To achieve two-fold spatial resolution, super-resolution microscopy was carried out using a structured illumination module Zeiss Elyra PS.1 integrated into the laser-scanning confocal microscope using PlanAPOCHROMAT 100×/1.46 oil-immersion objective. For each condition, 3 samples were imaged. Image analysis was conducted using Image-J and ZEN lite software (Sigma-Aldrich, Sydney, NSW, Australia).

3.7. LA-ICP-MS Analysis

Freshly excised abdominal human skins were received from female donors (n = 3, aged 27–47 years) who had undergone abdominoplasty surgery. Before the research, informed written consent was obtained from all participants (The Macquarie University Hospital, ethics approval protocol-5201200935). The skin samples were processed for the subcutaneous fat removal and used for permeation assay on the same day. The permeation assay was performed using the same Franz cells set-up and formulations described in Section 3.4, with the incubation time changed to 24 h. Afterwards, untreated (blank) and treated skin samples were snap frozen and cut into 50-μm slices perpendicular to the skin surface, mounted on a glass slide and placed in a clean container to avoid contamination. Ultimate care was taken to cut the samples to avoid smearing the remnant sunscreen across the sample. In situ measurement of 67Zn concentration in the skin samples was carried out using a Photon-Machines Analyte Excite 193 nm Excimer laser ablation system with Helex II sample chamber coupled to an Agilent 7700× quadrupole ICP-MS system at Macquarie Geoanalytical (MQGA) Centre, Macquarie University. Helium was used as the carrier gas (flow rate, 0.8 L/min) mixed with argon (flow rate, 0.8 L/min) before introducing it to a torch in ICP-MS. To quantify the LA-ICP-MS measurement, a spiked gelatine sample with a defined concentration of 67Zn (10 μg/g) was produced as described elsewhere [72] and used as standards to quantify 67Zn concentrations in skin. The 67Zn-spiked gelatine samples were collected for acid digestion and their 67Zn concentrations were determined accurately and precisely using Solution-nebulisation ICP-MS. A carbon isotope 13C was used as the internal standard to correct for differences in the ablation yield of the materials, plasma condition, and instrumental drift. Laser energy of 2.11 J/cm2 and a repetition rate of 10 Hz were used to maintain an adequate signal-to-noise ratio of 13C. LA-ICP-MS was operated in a line-scan mode by rastering a square spot 35 × 35 μm2 at the 35 μm/s scan rate. The data compression was carried out using software Iolite (version 3.6).

3.8. Sample Preparation for Solution Nebulisation ICP-MS

The collected receptor fluid samples, natural sponges from the wash, remaining HSEs, tape strips and gelatine standard were prepared for ICP-MS assaying using a standard addition technique. The collected receptor fluids were digested by adding 4.7 mL of 2% (v/v) HNO3 (69% ultra-pure grade for ICP-MS, Choice Analytical, Australia) to 0.3 mL of each receptor fluid to make up solution volume of 5 mL. To digest the tapes and remaining HSE, 6 mL of HNO3 (69% ultra-pure grade for ICP-MS, Choice Analytical, Australia) and 1 mL of H2O2 (Westfarmer Chemicals, 30% v/v) were added to each. To digest the sponges, 3 mL of HNO3 was added. Afterwards, the samples were heated up in a heater block by increasing the temperature gradually from 35 °C to 100 °C until digestion of organic compounds was completed, and bubbling stopped. The collected gelatine samples were, first, mixed with 1 mL of HNO3 and heated at 60 °C for 3 h. All acid-digested samples were diluted with ultrapure MQ water to make the acid content ≤2% (v/v) and aliquoted accordingly. For the calibration curve sets, the aliquots of the acid-digested samples were spiked with a certified 67Zn standard solution (IRMM® Certified Reference Material, Sigma-Aldrich, Sydney, NSW, Australia) at different concentrations. A calibration set of the skin assay samples was 0, 10, 20, 50, 100, 200 and 500 ppb; and 0, 1.5, 3, 6, 12, and 16 ppb for the gelatine samples.

3.9. Solution Nebulisation ICP-MS

Trace element concentrations of the samples were measured using solution-based ICP-MS [Agilent 8900 Triple Quad (QQQ)] with a helium gas collision cell (Agilent Technologies, Tokyo, Japan) at University of Adelaide. An internal standard, yttrium, was mixed online with the samples to compensate for matrix effects. Blanks were interspersed throughout the analysis session, as well as the measurement of a 50-ppb calibration solution to check the instrument stability. The torch depth was 10 mm, octupole RF power was 170 V and argon carrier gas flow was 1.05 L/min. The measurement was performed using an octupole collision cell, with helium gas flow 5.0 mL/min to avoid polyatomic interferences. Five replicates were acquired for each sample. The data was processed using Agilent MassHunter Data AnalysisTM.

3.10. Cell Culture and MTT Cytotoxicity Assay

Immortalised human keratinocytes cell line (HaCaT) was cultured in DMEM (high-glucose, Sigma-Aldrich) supplemented with 10% FBS (Sigma-Aldrich) and 1% Penicillin-Streptomycin Solution (P/S, Life Technologies, Carlsbad, CA, USA), then incubated at 37 °C under a humidified atmosphere of 5% CO2/95% air. After 4 passages, cells were detached with trypsin and seeded in a 96-well plate (Corning Costar, Corning, NY, USA) at a density of 50,000 cells per well. HaCaT cells are a commonly used cell line that offer a robust and reproducible model for assessing keratinocyte cytotoxicity by removing inherent donor variability observed when using primary keratinocytes.
To perform a cytotoxicity test, 1 mL of stock suspension of 67ZnO-PEG NPs (1 mg/mL) in DMEM was prepared, following ultrasonication for 30 min, then diluted to concentrations ranging from 10 to 100 μg/mL. In addition, solutions of zinc salts, zinc sulphate heptahydrate (ZnSO4.7H2O; Sigma-Aldrich, Saint Louis, MO, USA), and zinc acetate dihydrate (Zn(C2H3O2)2.2H2O; Sigma-Aldrich, Saint Louis, MO, USA) were prepared at concentrations adjusted to the same Zn molar content as that of ZnO NPs. Eight wells were tested for each concentration and 8 wells were kept as control untreated cells. The media was removed 24 h later, cells were washed with PBS and then were exposed to freshly prepared dilutions of ZnO NPs for testing concentrations. After 24 h, cells were washed twice with PBS, and the cell viability was determined by MTT (3-(4,5-Dimethythiazolyl)-2,5-diphenyl-2H-tetrazolium bromide) colourimetric assay. Briefly, 100 μL of MTT reagent (0.5 mg/mL in the phenol red-free cell culture medium; DMEM/F12; #D6434, Sigma-Aldrich, Sydney, NSW, Australia) was added to each well, followed by incubation at 37 °C for 1 h to allow precipitation of insoluble formazan crystals. Then the supernatant was carefully discarded and 100 μL of DMSO (dimethyl sulfoxide) was added to each well and left for 10 min in dark on a plate shaker at room temperature to allow violet formazan crystals to be dissolved. The absorbance of the MTT product was measured at 550 nm using a PHERAstar microplate reader (BMG Labtech, Ortenberg, Germany) and the cell viability for each concentration was calculated relative to the untreated cells using the following equation [73]:
Viability   ( % ) = a b s o r b a n c e   o f   t r e a t e d   c e l l s b l a n k c o n t r o l b l a n k   ×   100 % ,
〈 〉 denotes mean value.

3.11. Determination of Labile Zinc Species in Cell-Mediated Culture Media

HaCaT cells were cultured as described in Section 3.10 and dosed with blank, low (5 μg/mL), mid (25 μg/mL) and high (50 μg/mL) concentrations of 67ZnO NPs for 24 h. 0.5-mL aliquots of the cell-conditioned media were placed into thick wall polycarbonate tubes and processed by ultra-centrifugation (Beckman-Coulter, Sydney, NSW, Australia) at 100,000× g for 45 min at 4 °C. The supernatants were collected and an aliquot of 180 μL of each sample was added to a black 96-well plate. 20 μL of 2-μM ZP1 solution was added to each well, including the blank, and agitated. Fluorescence was read out from each plate, excitation/emission, 490 nm/530 nm, respectively. The concentration of labile zinc, C Z n in each sample was evaluated by using the following equation:
C Z n = k d F     F m i n F m a x     F ,
where k d stands for the dissociation constant reported being 0.7 nM for ZP1 [74]. F is the fluorescence intensity of the samples after addition of 2-μM ZP1.   F m i n —the fluorescence intensity of the blank DMEM cell culture media containing 50 μM of TPEN (N,N,N,N-Tetrakis(2-pyridylmethyl)-ethylenediamine), Fmax—the fluorescence intensity of the blank DMEM cell culture media with 5 mM of added ZnSO4.
Alternatively, the 67Zn concentration in the sample supernatants was quantified by solution-based ICP-MS, as previously outlined in Section 3.9.

3.12. Statistical Analysis

Statistical analysis of obtained data was performed using GraphPad Prism software (version 9.2.0). One-way ANOVA and Mann–Whitney tests were performed on normally and non-normally distributed data, respectively, to determine significance of the mean difference between the blank and ZnO-treated samples. p-values < 0.05 were deemed statistically significant.

4. Conclusions

Whilst there has been concern about the general safety of zinc oxide nanoparticle sunscreens in topical products, work to date has focussed on whether nanoparticles can be found in the viable epidermis after permeation through the SC and via furrows and the follicles, including by lateral diffusion [75]. These zinc oxide nanoparticles, in turn, release zinc ions when the skin pH is either neutral or acidic and high zinc ion concentrations have been shown to be toxic in isolated keratinocytes [41]. Here, the use of 67Zn tagged nanoparticles enabled analysis of exogenous zinc ion concentrations in viable skin after topical application of zinc oxide nanoparticles.
The percutaneously absorbed 67Zn was quantified by inductively coupled plasma–mass spectrometry (ICP-MS) and laser-ablation ICP-MS to its elevated concentration in the VE as 1.0 ± 0.3 μg/mL (2.1 ± 0.5 μg per g of dry skin), much lower than our estimated endogenous total zinc ion concentration in the viable epidermis of 4.3 ± 0.7 μg/mL (13 ± 2 μg/g of dry skin). Both are, in turn, much lower than the potentially cytotoxic labile 67Zn concentrations of 21–31 μg/mL in serum-supplemented culture media causing keratinocyte HaCaT cytotoxicity. Therefore, the zinc concentration detected in VE with and without ZnO NP application was found to be significantly lower than the HaCaT cytotoxicity threshold. As such, our study validates the estimates recently made by Yamada et al. [18]. Furthermore, our work supports the recent FDA proposal for sunscreen marketing that only two of the 16 currently marketed sunscreens, zinc oxide and titanium dioxide, can generally be regarded as safe and effective [76]. This paper provides strong evidence that the NP form of ZnO sunscreens is safe after topical application to intact human skin.

Supplementary Materials

Author Contributions

Conceptualization, A.V.Z. and M.S.R.; methodology, Z.K., A.M.H., Y.-J.L., L.L.; A.D. and M.A.P.; software, Z.K.; validation, Z.K., A.M.H. and Y.-J.L.; formal analysis, Z.K.; investigation, Z.K. and A.M.H.; resources, Z.K. and A.M.H.; data curation, Z.K.; writing—original draft preparation, Z.K.; writing—review and editing, Z.K., A.M.H., A.V.Z. and M.S.R.; visualization, Z.K.; supervision, A.V.Z. and M.S.R.; project administration, Z.K. and A.V.Z.; funding acquisition, A.V.Z. and M.S.R. All authors have read and agreed to the published version of the manuscript.

Funding

This research received no external funding.

Data Availability Statement

The data presented in this study are available from the corresponding author on reasonable request.

Acknowledgments

We would like to acknowledge an Australian Government Research Training Program (RTP) Scholarship and Russian Foundation for Basic Research (grant No 20-04-00182) for supporting instrumental and material aspects of this project. AMH, MSR would like to acknowledge the NHMRC (1107356), ARC and Quality Medication Care Pty Ltd. for the financial support of the project related to the cell experiments. We also acknowledge Anna Guller for helping with the cytotoxicity test. We are grateful to Diona Damian and Vanisri Raviraj (Sydney University) for sharing HaCaT cells.

Conflicts of Interest

The authors declare no conflict of interest.

References

  1. Raj, S.; Jose, S.; Sumod, U.; Sabitha, M. Nanotechnology in cosmetics: Opportunities and challenges. J. Pharm. Bioallied Sci. 2012, 4, 186. [Google Scholar] [CrossRef] [PubMed]
  2. Chaudhri, N.; Soni, G.C.; Prajapati, S. Nanotechnology: An advance tool for nano-cosmetics preparation. Int. J. Pharma Res. Rev. 2015, 4, 28–40. [Google Scholar]
  3. Ahmad, U.; Ahmad, Z.; Khan, A.A.; Akhtar, J.; Singh, S.P.; Ahmad, F.J. Strategies in development and delivery of nanotechnology based cosmetic products. Drug Res. 2018, 68, 545–552. [Google Scholar] [CrossRef]
  4. Roberts, M.S.; Mohammed, Y.H.; Pastore, M.; Namjoshi, S.; Yousef, S.; Alinaghi, A.; Haridass, I.N.; Abd, E.; Leite-Silva, V.R.; Benson, H.A.E.; et al. Topical and cutaneous delivery using nanosystems. J. Control. Release 2017, 247, 86–105. [Google Scholar] [CrossRef] [Green Version]
  5. Prow, T.W.; Grice, J.E.; Lin, L.L.; Faye, R.; Butler, M.; Becker, W.; Wurm, E.M.; Yoong, C.; Robertson, T.A.; Soyer, H.P.; et al. Nanoparticles and microparticles for skin drug delivery. Adv. Drug Deliv. Rev. 2011, 63, 470–491. [Google Scholar] [CrossRef]
  6. Zhang, L.; Gu, F.; Chan, J.; Wang, A.; Langer, R.; Farokhzad, O. Nanoparticles in medicine: Therapeutic applications and developments. Clin. Pharmacol. Ther. 2008, 83, 761–769. [Google Scholar] [CrossRef]
  7. McDonald, T.O.; Siccardi, M.; Moss, D.; Liptrott, N.; Giardiello, M.; Rannard, S.; Owen, A. The application of nanotechnology to drug delivery in medicine. Chapter 2015, 2, 173–223. [Google Scholar]
  8. Kargozar, S.; Mozafari, M.M. Nanotechnology and Nanomedicine: Start small, think big. Mater. Today Proc. 2018, 5, 15492–15500. [Google Scholar] [CrossRef]
  9. Wiesner, M.R.; Lowry, G.V.; Alvarez, P.; Dionysiou, D.; Biswas, P. Assessing the Risks of Manufactured Nanomaterials; ACS Publications: Washington, DC, USA, 2006. [Google Scholar]
  10. Colvin, V.L. The potential environmental impact of engineered nanomaterials. Nat. Biotechnol. 2003, 21, 1166. [Google Scholar] [CrossRef]
  11. Hull, M.; Bowman, D. Nanotechnology Environmental Health and Safety: Risks, Regulation, and Management; William Andrew: Norwich, New York, NY, USA, 2018. [Google Scholar]
  12. Nel, A.; Xia, T.; Mädler, L.; Li, N. Toxic potential of materials at the nanolevel. Science 2006, 311, 622–627. [Google Scholar] [CrossRef] [Green Version]
  13. Karahalil, B. Challenges, Recommendations, and Strategies for Nanotoxicology Evaluation and Its Management. In Nanotoxicology; CRC Press: Boca Raton, USA, 2018; pp. 649–655. [Google Scholar]
  14. Piccinno, F.; Gottschalk, F.; Seeger, S.; Nowack, B. Industrial production quantities and uses of ten engineered nanomaterials in Europe and the world. J. Nanopart. Res. 2012, 14, 1109. [Google Scholar] [CrossRef] [Green Version]
  15. Nohynek, G.J.; Lademann, J.; Ribaud, C.; Roberts, M.S. Grey goo on the skin? Nanotechnology, cosmetic and sunscreen safety. Crit. Rev. Toxicol. 2007, 37, 251–277. [Google Scholar] [CrossRef]
  16. Smijs, T.G.; Pavel, S. Titanium dioxide and zinc oxide nanoparticles in sunscreens: Focus on their safety and effectiveness. Nanotechnol. Sci. Appl. 2011, 4, 95. [Google Scholar] [CrossRef] [Green Version]
  17. Berube, D.M. Rhetorical gamesmanship in the nano debates over sunscreens and nanoparticles. J. Nanopart. Res. 2008, 10, 23–37. [Google Scholar] [CrossRef] [Green Version]
  18. Yamada, M.; Mohammed, Y.; Prow, T.W. Advances and controversies in studying sunscreen delivery and toxicity. Adv. Drug Deliv. Rev. 2020, 135, 72–86. [Google Scholar] [CrossRef] [PubMed]
  19. Sharma, V.; Singh, S.K.; Anderson, D.; Tobin, D.J.; Dhawan, A. Zinc oxide nanoparticle induced genotoxicity in primary human epidermal keratinocytes. J. Nanosci. Nanotechnol. 2011, 11, 3782–3788. [Google Scholar] [CrossRef] [Green Version]
  20. Lee, S.H.; Pie, J.-E.; Kim, Y.-R.; Lee, H.R.; Son, S.W.; Kim, M.-K. Effects of zinc oxide nanoparticles on gene expression profile in human keratinocytes. Mol. Cell. Toxicol. 2012, 8, 113–118. [Google Scholar] [CrossRef]
  21. Sharma, V.; Shukla, R.K.; Saxena, N.; Parmar, D.; Das, M.; Dhawan, A. DNA damaging potential of zinc oxide nanoparticles in human epidermal cells. Toxicol. Lett. 2009, 185, 211–218. [Google Scholar] [CrossRef] [PubMed]
  22. Wu, Z.; Yang, H.; Archana, G.; Rakshit, M.; Ng, K.W.; Tay, C.Y.J.N. Human keratinocytes adapt to ZnO nanoparticles induced toxicity via complex paracrine crosstalk and Nrf2-proteasomal signal transduction. Nanotoxicology 2018, 12, 1215–1229. [Google Scholar] [CrossRef]
  23. Shuilleabhain, S.N.; Mothersill, C.; Sheehan, D.; O’Brien, N.; O’Halloran, J.; Van Pelt, F.; Davoren, M. In vitro cytotoxicity testing of three zinc metal salts using established fish cell lines. Toxicol. Vitr. 2004, 18, 365–376. [Google Scholar] [CrossRef]
  24. Song, W.; Zhang, J.; Guo, J.; Zhang, J.; Ding, F.; Li, L.; Sun, Z. Role of the dissolved zinc ion and reactive oxygen species in cytotoxicity of ZnO nanoparticles. Toxicol. Lett. 2010, 199, 389–397. [Google Scholar] [CrossRef]
  25. Momose, A.; Shiraiwa, Y.; Narita, S.; Kusumi, T.; Goto, S.; Sera, K.J.N. Total Calcium and Albumin Are Decreased in the Deeper Epidermis of Patients with Chronic Kidney Disease-Associated Pruritus. Nephron 2017, 136, 103–110. [Google Scholar] [CrossRef]
  26. Michaelsson, G.; Ljunghall, K.; Danielson, B.J. Zinc in epidermis and dermis in healthy subjects. Acta Derm. Venereol. 1980, 60, 295–299. [Google Scholar] [PubMed]
  27. Gamer, A.; Leibold, E.v.; Van Ravenzwaay, B. The in vitro absorption of microfine zinc oxide and titanium dioxide through porcine skin. Toxicol. Vitr. 2006, 20, 301–307. [Google Scholar] [CrossRef] [PubMed]
  28. Cross, S.E.; Innes, B.; Roberts, M.S.; Tsuzuki, T.; Robertson, T.A.; McCormick, P. Human skin penetration of sunscreen nanoparticles: In-vitro assessment of a novel micronized zinc oxide formulation. Ski. Pharmacol. Physiol. 2007, 20, 148–154. [Google Scholar] [CrossRef]
  29. Zvyagin, A.V.; Zhao, X.; Gierden, A.; Sanchez, W.; Ross, J.A.; Roberts, M.S. Imaging of zinc oxide nanoparticle penetration in human skin in vitro and in vivo. J. Biomed. Opt. 2008, 13, 064031–064039. [Google Scholar] [CrossRef] [PubMed] [Green Version]
  30. Roberts, M.S.; Roberts, M.J.; Robertson, T.A.; Sanchez, W.; Thörling, C.; Zou, Y.; Zhao, X.; Becker, W.; Zvyagin, A.V. In vitro and in vivo imaging of xenobiotic transport in human skin and in the rat liver. J. Biophotonics 2008, 1, 478–493. [Google Scholar] [CrossRef]
  31. Holmes, A.M.; Song, Z.; Moghimi, H.R.; Roberts, M.S. Relative penetration of zinc oxide and zinc ions into human skin after application of different zinc oxide formulations. ACS Nano 2016, 10, 1810–1819. [Google Scholar] [CrossRef]
  32. Watkinson, A.C.; Bunge, A.L.; Hadgraft, J.; Lane, M.E. Nanoparticles do not penetrate human skin—A theoretical perspective. Pharm. Res. 2013, 30, 1943–1946. [Google Scholar] [CrossRef]
  33. Leite-Silva, V.R.; Sanchez, W.Y.; Studier, H.; Liu, D.C.; Mohammed, Y.H.; Holmes, A.M.; Ryan, E.M.; Haridass, I.N.; Chandrasekaran, N.C.; Becker, W.; et al. Human skin penetration and local effects of topical nano zinc oxide after occlusion and barrier impairment. Eur. J. Pharm. Biopharm. 2016, 104, 140–147. [Google Scholar] [CrossRef] [PubMed] [Green Version]
  34. Filipe, P.; Silva, J.; Silva, R.; De Castro, J.C.; Gomes, M.M.; Alves, L.; Santus, R.; Pinheiro, T. Stratum corneum is an effective barrier to TiO2 and ZnO nanoparticle percutaneous absorption. Ski. Pharmacol. Physiol. 2009, 22, 266–275. [Google Scholar] [CrossRef]
  35. Leite-Silva, V.R.; Liu, D.C.; Sanchez, W.Y.; Studier, H.; Mohammed, Y.H.; Holmes, A.; Becker, W.; Grice, J.E.; Benson, H.A.; Roberts, M.S. Effect of flexing and massage on in vivo human skin penetration and toxicity of zinc oxide nanoparticles. Nanomedicine 2016, 11, 1193–1205. [Google Scholar] [CrossRef]
  36. GoodsAdmnistration, Therapeutic. Literature review on the safety of titanium dioxide and zinc oxide on nanoparticles in sunscreens. Dep. Health Ageing 2013. [Google Scholar]
  37. Ohman, H.; Vahlquist, A. In vivo studies concerning a pH gradient in human stratum corneum and upper epidermis. Acta Derm. Venereol. Stockh. 1994, 74, 375–379. [Google Scholar]
  38. Ågren, M.S. Percutaneous absorption of zinc from zinc oxide applied topically to intact skin in man. Dermatology 1990, 180, 36–39. [Google Scholar] [CrossRef]
  39. Pirot, F.; Millet, J.; Kalia, Y.; Humbert, P. In vitro study of percutaneous absorption, cutaneous bioavailability and bioequivalence of zinc and copper from five topical formulations. Ski. Pharmacol. Physiol. 1996, 9, 259–269. [Google Scholar] [CrossRef]
  40. Holmes, A.M.; Kempson, I.; Turnbull, T.; Paterson, D.; Roberts, M.S. Penetration of zinc into human skin after topical application of nano zinc oxide used in commercial sunscreen formulations. ACS Appl. Bio Mater. 2020, 3, 3640–3647. [Google Scholar] [CrossRef]
  41. Holmes, A.M.; Mackenzie, L.; Roberts, M.S. Disposition and measured toxicity of zinc oxide nanoparticles and zinc ions against keratinocytes in cell culture and viable human epidermis. Nanotoxicology 2020, 14, 263–274. [Google Scholar] [CrossRef] [PubMed]
  42. Mohammed, Y.H.; Holmes, A.; Haridass, I.N.; Sanchez, W.Y.; Studier, H.; Grice, J.E.; Benson, H.A.; Roberts, M.S. Support for the safe use of zinc oxide nanoparticle sunscreens: Lack of skin penetration or cellular toxicity after repeated application in volunteers. J. Investig. Dermatol. 2019, 139, 308–315. [Google Scholar] [CrossRef] [Green Version]
  43. Mohammed, Y.H.; Haridass, I.N.; Grice, J.E.; Benson, H.A.; Roberts, M.S. Bathing Does Not Facilitate Human Skin Penetration or Adverse Cellular Effects of Nanoparticulate Zinc Oxide Sunscreens after Topical Application. J. Investig. Dermatol. 2020, 140, 1656–1659. [Google Scholar] [CrossRef] [PubMed]
  44. Mohammed, Y.H.; Barkauskas, D.S.; Holmes, A.; Grice, J.; Roberts, M.S. Noninvasive in vivo human multiphoton microscopy: A key method in proving nanoparticulate zinc oxide sunscreen safety. J. Biomed. Opt. 2020, 25, 014509. [Google Scholar] [CrossRef] [PubMed] [Green Version]
  45. Cotton, A.F.; Wilkinson, G.; Bochmann, M.; Murillo, C.A. Advanced Inorganic Chemistry; Wiley: New York, NY, USA, 1999. [Google Scholar]
  46. Gulson, B.; McCall, M.; Korsch, M.; Gomez, L.; Casey, P.; Oytam, Y.; Taylor, A.; McCulloch, M.; Trotter, J.; Kinsley, L. Small amounts of zinc from zinc oxide particles in sunscreens applied outdoors are absorbed through human skin. Toxicol. Sci. 2010, 118, 140–149. [Google Scholar] [CrossRef] [Green Version]
  47. Gulson, B.; Wong, H.; Korsch, M.; Gomez, L.; Casey, P.; McCall, M.; McCulloch, M.; Trotter, J.; Stauber, J.; Greenoak, G. Comparison of dermal absorption of zinc from different sunscreen formulations and differing UV exposure based on stable isotope tracing. Sci. Total Environ. 2012, 420, 313–318. [Google Scholar] [CrossRef] [PubMed]
  48. Gulson, B.; Wong, H. Stable isotopic tracing—a way forward for nanotechnology. Environ. Health Perspect. 2006, 114, 1486. [Google Scholar] [CrossRef] [PubMed] [Green Version]
  49. Darvin, M.; König, K.; Kellner-Hoefer, M.; Breunig, H.; Werncke, W.; Meinke, M.; Patzelt, A.; Sterry, W.; Lademann, J. Safety assessment by multiphoton fluorescence/second harmonic generation/hyper-Rayleigh scattering tomography of ZnO nanoparticles used in cosmetic products. Ski. Pharmacol. Physiol. 2012, 25, 219–226. [Google Scholar] [CrossRef] [PubMed]
  50. Joulaud, C.; Mugnier, Y.; Djanta, G.; Dubled, M.; Marty, J.-C.; Galez, C.; Wolf, J.-P.; Bonacina, L.; Le Dantec, R. Characterization of the nonlinear optical properties of nanocrystals by Hyper Rayleigh Scattering. J. Nanobiotechnol. 2013, 11, S8. [Google Scholar] [CrossRef] [PubMed] [Green Version]
  51. Keller, A.A.; Wang, H.; Zhou, D.; Lenihan, H.S.; Cherr, G.; Cardinale, B.J.; Miller, R.; Ji, Z. Stability and aggregation of metal oxide nanoparticles in natural aqueous matrices. Environ. Sci. Technol. 2010, 44, 1962–1967. [Google Scholar] [CrossRef]
  52. Tso, C.-P.; Zhung, C.-M.; Shih, Y.-H.; Tseng, Y.-M.; Wu, S.-C.; Doong, R.-A. Stability of metal oxide nanoparticles in aqueous solutions. Water Sci. Technol. 2010, 61, 127–133. [Google Scholar] [CrossRef] [Green Version]
  53. Reed, R.B.; Ladner, D.A.; Higgins, C.P.; Westerhoff, P.; Ranville, J.F. Solubility of nano-zinc oxide in environmentally and biologically important matrices. Environ. Toxicol. Chem. 2012, 31, 93–99. [Google Scholar] [CrossRef]
  54. Liu, Z.; Wang, C.; Hou, J.; Wang, P.; Miao, L.; Lv, B.; Yang, Y.; You, G.; Xu, Y.; Zhang, M.J.E.S.; et al. Aggregation, sedimentation, and dissolution of CuO and ZnO nanoparticles in five waters. Environ. Sci. Pollut. Res. 2018, 25, 31240–31249. [Google Scholar] [CrossRef]
  55. Al-Ebraheem, A.; Dao, E.; Desouza, E.; Li, C.; Wainman, B.; McNeill, F.; Farquharson, M. Effect of sample preparation techniques on the concentrations and distributions of elements in biological tissues using µSRXRF: A comparative study. Physiol. Meas. 2015, 36, N51. [Google Scholar] [CrossRef]
  56. Figueroa, J.A.L.; Vignesh, K.S.; Deepe, G.S.; Caruso, J. Selectivity and specificity of small molecule fluorescent dyes/probes used for the detection of Zn2+ and Ca2+ in cells. Metallomics 2014, 6, 301–315. [Google Scholar] [CrossRef] [PubMed] [Green Version]
  57. Nowakowski, A.B.; Petering, D.H. Reactions of the fluorescent sensor, Zinquin, with the zinc-proteome: Adduct formation and ligand substitution. Inorg. Chem. 2011, 50, 10124–10133. [Google Scholar] [CrossRef] [PubMed] [Green Version]
  58. Karim, M.R. The Role of Proteome in Cellular Zn2+ Trafficking and in the Ability of Fluorescent Zinc Sensors to Image Intracellular Zn2+. Doctoral Dissertation, The University of Wisconsin-Milwaukee, Milwaukee, WI, USA, 2016. [Google Scholar]
  59. Meija, J.; Coplen, T.B.; Berglund, M.; Brand, W.A.; De Bièvre, P.; Gröning, M.; Holden, N.E.; Irrgeher, J.; Loss, R.D.; Walczyk, T. Isotopic compositions of the elements 2013 (IUPAC technical Report). Pure Appl. Chem. 2016, 88, 293–306. [Google Scholar] [CrossRef] [Green Version]
  60. Gorodetsky, R.; Sheskin, J.; Weinreb, A. Iron, copper, and zinc concentrations in normal skin and in various nonmalignant and malignant lesions. Int. J. Dermatol. 1986, 25, 440–445. [Google Scholar] [CrossRef]
  61. Popov, A.; Priezzhev, A.; Lademann, J.; Myllylä, R. TiO2 nanoparticles as an effective UV-B radiation skin-protective compound in sunscreens. J. Phys. D Appl. Phys. 2005, 38, 2564. [Google Scholar] [CrossRef]
  62. Ogawa, H.; Taneda, A.; Kanaoka, Y.; Sekine, T. The histochemical distribution of protein bound sulfhydryl groups in human epidermis by the new staining method. J. Histochem. Cytochem. 1979, 27, 942–946. [Google Scholar] [CrossRef]
  63. Plum, L.M.; Rink, L.; Haase, H. The essential toxin: Impact of zinc on human health. Int. J. Environ. Res. Public Health 2010, 7, 1342–1365. [Google Scholar] [CrossRef] [Green Version]
  64. Bielfeldt, S.; Schoder, V.; Ely, U.; Van Der Pol, A.; De Sterke, J.; Wilhelm, K.P. Assessment of human stratum corneum thickness and its barrier properties by in-vivo confocal Raman spectroscopy. Int. J. Cosmet. Sci. 2009, 31, 479–480. [Google Scholar] [CrossRef]
  65. Pavlica, S.; Gaunitz, F.; Gebhardt, R. Comparative in vitro toxicity of seven zinc-salts towards neuronal PC12 cells. Toxicol. Vitr. 2009, 23, 653–659. [Google Scholar] [CrossRef] [PubMed]
  66. Vinardell, M.P.; Llanas, H.; Marics, L.; Mitjans, M. In Vitro Comparative Skin Irritation Induced by Nano and Non-Nano Zinc Oxide. Nanomaterials 2017, 7, 56. [Google Scholar] [CrossRef] [Green Version]
  67. Jeong, S.H.; Kim, H.J.; Ryu, H.J.; Ryu, W.I.; Park, Y.-H.; Bae, H.C.; Jang, Y.S.; Son, S.W. ZnO nanoparticles induce TNF-α expression via ROS-ERK-Egr-1 pathway in human keratinocytes. J. Dermatol. Sci. 2013, 72, 263–273. [Google Scholar] [CrossRef] [PubMed]
  68. Haase, H.; Hebel, S.; Engelhardt, G.; Rink, L. The biochemical effects of extracellular Zn2+ and other metal ions are severely affected by their speciation in cell culture media. Metallomics 2015, 7, 102–111. [Google Scholar] [CrossRef] [PubMed]
  69. Karlsson, H.L.; Cronholm, P.; Hedberg, Y.; Tornberg, M.; De Battice, L.; Svedhem, S.; Wallinder, I.O. Cell membrane damage and protein interaction induced by copper containing nanoparticles—Importance of the metal release process. Toxicology 2013, 313, 59–69. [Google Scholar] [CrossRef] [PubMed]
  70. Luo, M.; Shen, C.; Feltis, B.N.; Martin, L.L.; Hughes, A.E.; Wright, P.F.; Turney, T.W. Reducing ZnO nanoparticle cytotoxicity by surface modification. Nanoscale 2014, 6, 5791–5798. [Google Scholar] [CrossRef]
  71. Lademann, J.; Jacobi, U.; Surber, C.; Weigmann, H.-J.; Fluhr, J. The tape stripping procedure–evaluation of some critical parameters. Eur. J. Pharm. Biopharm. 2009, 72, 317–323. [Google Scholar] [CrossRef]
  72. Šala, M.; Šelih, V.S.; van Elteren, J.T.J.A. Gelatin gels as multi-element calibration standards in LA-ICP-MS bioimaging: Fabrication of homogeneous standards and microhomogeneity testing. Analyst 2017, 142, 3356–3359. [Google Scholar] [CrossRef] [Green Version]
  73. Liang, L.; Lu, Y.; Zhang, R.; Care, A.; Ortega, T.A.; Deyev, S.M.; Qian, Y.; Zvyaginacd, A.V. Upconversion nanoparticles mediated deep-penetrating photodynamic therapy of KillerRed. Acta Biomater. 2017, 51, 461–470. [Google Scholar] [CrossRef]
  74. Woodroofe, C.C.; Masalha, R.; Barnes, K.R.; Frederickson, C.J.; Lippard, S.J. Membrane-permeable and-impermeable sensors of the Zinpyr family and their application to imaging of hippocampal zinc in vivo. Chem. Biol. 2004, 11, 1659–1666. [Google Scholar] [CrossRef] [Green Version]
  75. Roberts, M.S.; Cheruvu, H.S.; Mangion, S.E.; Alinaghi, A.; Benson, H.A.E.; Mohammed, Y.; Holmes, A.; van der Hoek, J.; Pastore, M.; Grice, J.E. Topical drug delivery: History, percutaneous absorption, and product development. Adv Drug Deliv Rev. 2021, 177, 113929. [Google Scholar] [CrossRef]
  76. Food and Drug Administration. FDA Advances new proposed regulation to make sure that sunscreens are safe and effective. Fed. Regist. 84FR6204 2019, 3019, 2019. [Google Scholar]
Figure 1. Schematic illustration of techniques used in this study to image and quantify the permeated zinc species formed by 67ZnO dissolution on the skin surface. Zinc species were detected by multiphoton microscopy using the second harmonic generation signal of ZnO nanocrystals, by multiphoton and confocal fluorescence microscopies using fluorescent zinc sensors, Zinquin ethyl ester and Zinpyr-1; and mass spectrometry. Created with BioRender.com.
Ijms 22 12372 g001
Figure 2. (a) TEM image of as-received micron-sized 67ZnO powder. Scale bar, 2 μm. (b) TEM image of 67ZnO-PEG NPs synthesised by the co-precipitation method. Scale bar, 50 nm. Particle size distribution histograms of (c) micron-sized 67ZnO and (d) 67ZnO-PEG NPs powders. Solid curves show Gaussian fitting. (e) XRD patterns of micro-67ZnO and 67ZnO-PEG NPs powders. (f) Particle size distribution by intensity of colloidal dispersion of 67ZnO-PEG NPs in CCT, EtOH and water acquired by dynamic light scattering.
Ijms 22 12372 g002
Figure 3. Multiphoton and confocal microscopy images of cross-sectioned HSEs post-treatment with either blank CCT formulation (Blank) or 67ZnO-PEG (20 %wt/wt) in CCT formulation (Treated) for 48 h at 35 ± 1 °C. First and second rows show the images of blank HSEs stained with zinquin and ZP1, respectively. Third and fourth rows are the images of treated HSEs stained with zinquin and ZP1, respectively. From left, first, second, third and fourth columns show images of HSEs in SHG (magenta), zinquin (green), ZP1 (cyan) and merged channels, respectively. SHG signal of nano-sized 67ZnO-PEG was acquired with multiphoton excitation/emission at 800 nm/400 nm. Zinquin signal was obtained with multiphoton excitation/emission at 740 nm/490 nm. For ZP1, excitation/emission was collected at 488 nm/540–560 nm using a 488-nm argon laser. Scale bar, 40 mm.
Ijms 22 12372 g003
Figure 4. (a) Structured illumination microscopy image of ZnO-treated HSE. The inset is a magnified area of the image showing 67ZnO-PEG NPs aggregates (pointed by a yellow arrow) on SC surface. Scale bar, 5 μm. Results of image analysis of SHG, zinquin and ZP1 signals in untreated (Blank) and 67ZnO-treated-HSEs (Treated). Bar plots compare the normalised intensities (mean ± 95% confidence interval, n = 7) of (b) SHG, (c) zinquin, and (d) ZP1 signals in SC and VE of blank and treated HSEs. (*) shows significance difference levels at p < 0.05.
Ijms 22 12372 g004
Figure 5. Results of mass spectrometry analysis of untreated and 67ZnO-PEG NPs treated human skin samples. (a) Brightfield image of full-thickness freshly excised human skin section post-treatment with blank CCT formulation (Blank) for 48 h at 35 ± 1 °C. SC, VE and Dermis designate stratum corneum, viable epidermis and dermis layers, respectively. (b) LA-ICP-MS map of 67Zn concentration (μg/g) of (a). (c) Brightfield image of full-thickness freshly excised human skin section post-treatment with 67ZnO-PEG NPs (20 %wt/wt) in CCT formulation (Treated) for 48 h at 35 ± 1 °C. (d) LA-ICP-MS map of 67Zn concentration (μg/g) of (c). (e) 67Zn and (f) total zinc concentrations in skin measured by LA-ICP-MS for blank and treated samples. (g) 67Zn concentration measured by solution-based ICP-MS for untreated and treated HSEs. (*), (**), (***) and (****) show significance difference levels at p < 0.05, p < 0.01, p < 0.001 and p < 0.0001, respectively. Data are presented as mean ± 95% confidence interval, n3 4. Scale bars are 200 μm.
Ijms 22 12372 g005
Figure 6. (a) Exogenous C Z   67 n   expressed in μg/mL, as assayed by LA-ICP-MS in VE and dermis layers (replotted from Figure 5f). (b) HaCaT cell viability exposed to zinc acetate, zinc sulphate, and 67ZnO-PEG NPs for 24 h. The data format: mean ± SD for n = 8 replicates. (c) C Z   67 n   from supernatant of HaCaT cell-mediated culture media on addition of 67ZnO-PEG NPs measured by ICP-MS. Blank, Low, Medium and High stand for cell incubation with 0, 5, 25 and 50 μg/mL of 67ZnO-PEG NPs, respectively. The data format: mean ± SD, n = 3. (**) and (****) show significance difference levels at p < 0.01 and p < 0.0001, respectively.
Ijms 22 12372 g006
Table 1. Summary of the measured and calculated zinc values in human skin.
C Z   67 n ,
μg/g
C e x Z n ,
μg/g
C e n Z n ,
μg/g
C e x Z n ,
μg/mL
C e n Z n ,
μg/mL
IC50 *,
μg Zn/mL
SC235 ± 49360 ± 7039 ± 5120 ± 2313 ± 2-
VE2.0 ± 0.53.1 ± 0.813 ± 21.0 ± 0.34.3 ± 0.7-
Dermis0.9 ± 0.31.4 ± 0.516 ± 70.5 ± 0.25 ± 2-
HaCaT cells-----26 ± 5
* cytotoxicity of 67ZnO-PEG NPs, equivalent to 25 μg/mL of 67ZnO NPs.
Publisher’s Note: MDPI stays neutral with regard to jurisdictional claims in published maps and institutional affiliations.

