
Transcriptome Changes in Three Brain Regions during Chronic Lithium Administration in the Rat Models of Mania and Depression

 , , , , , , , , and
Abstract
:1. Introduction
2. Results
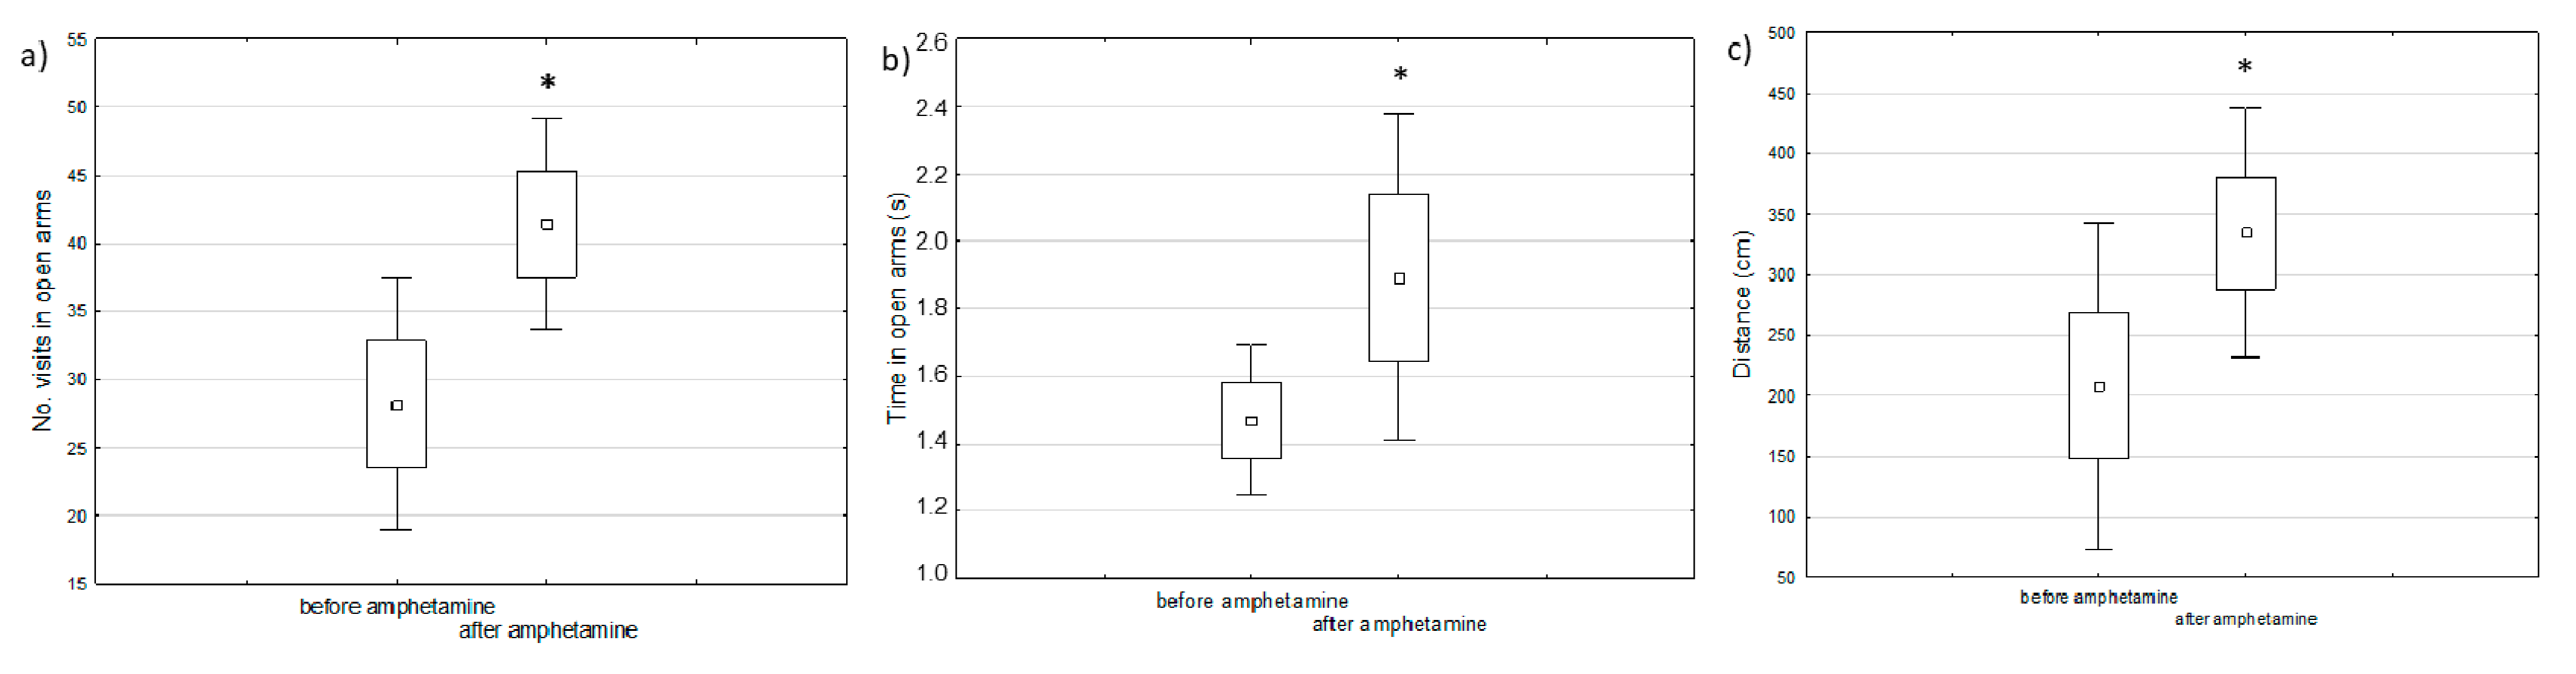
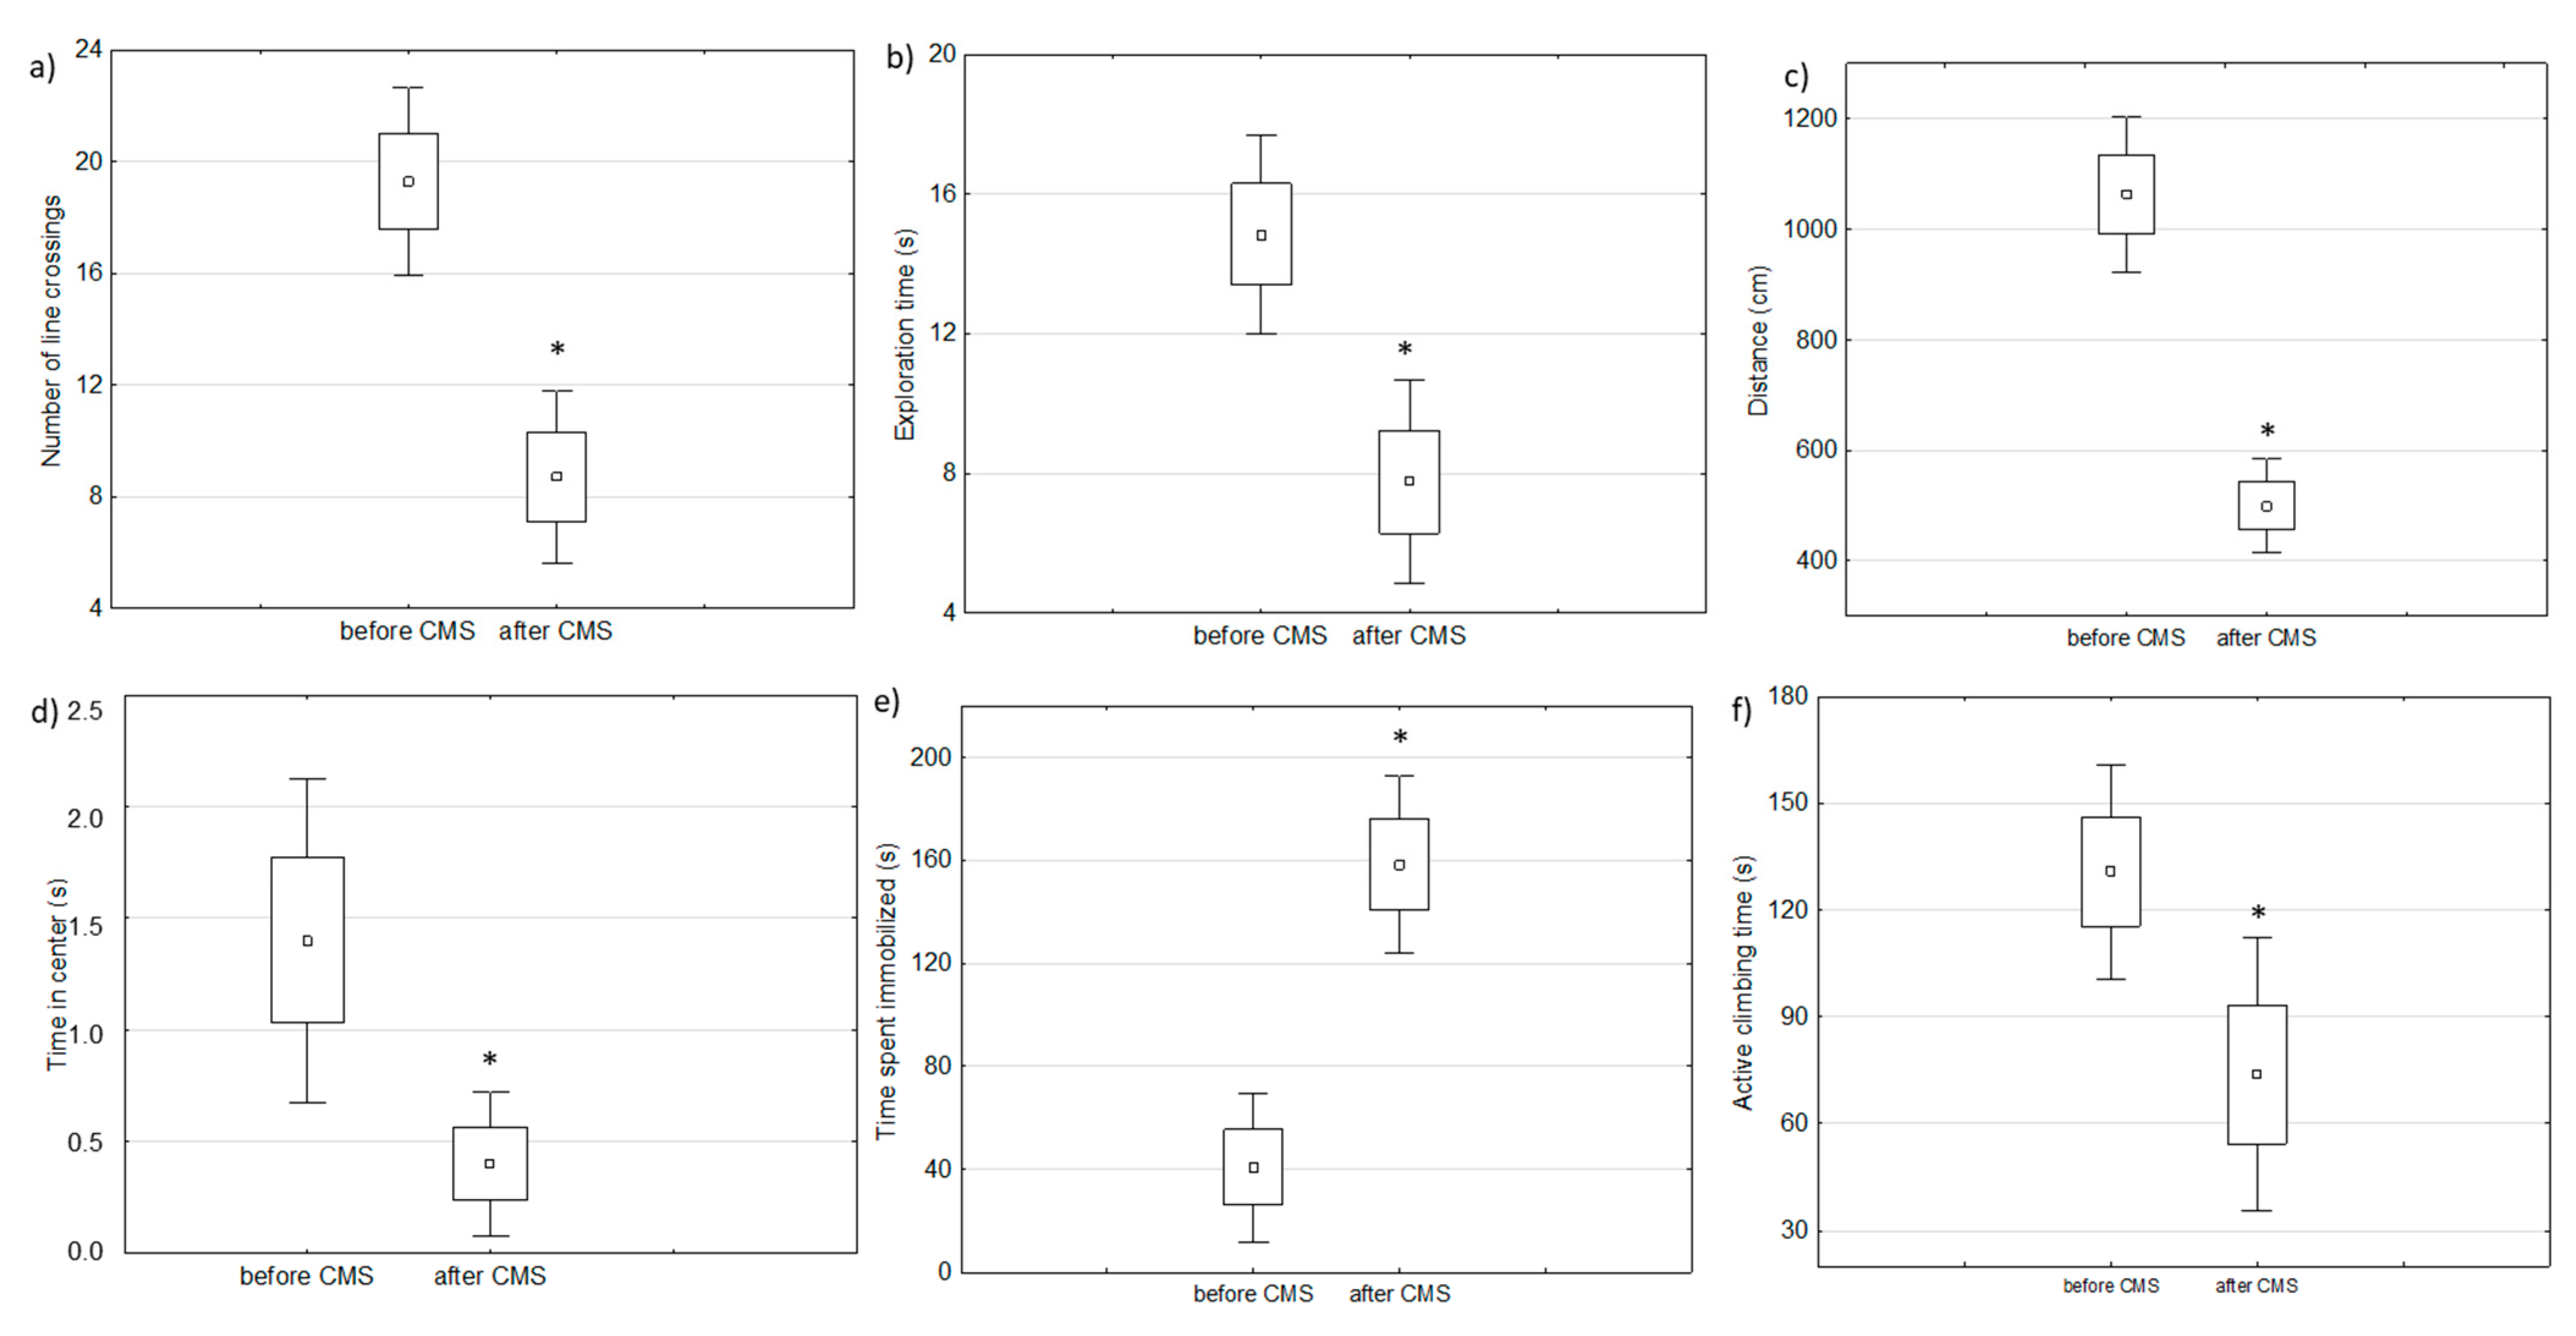
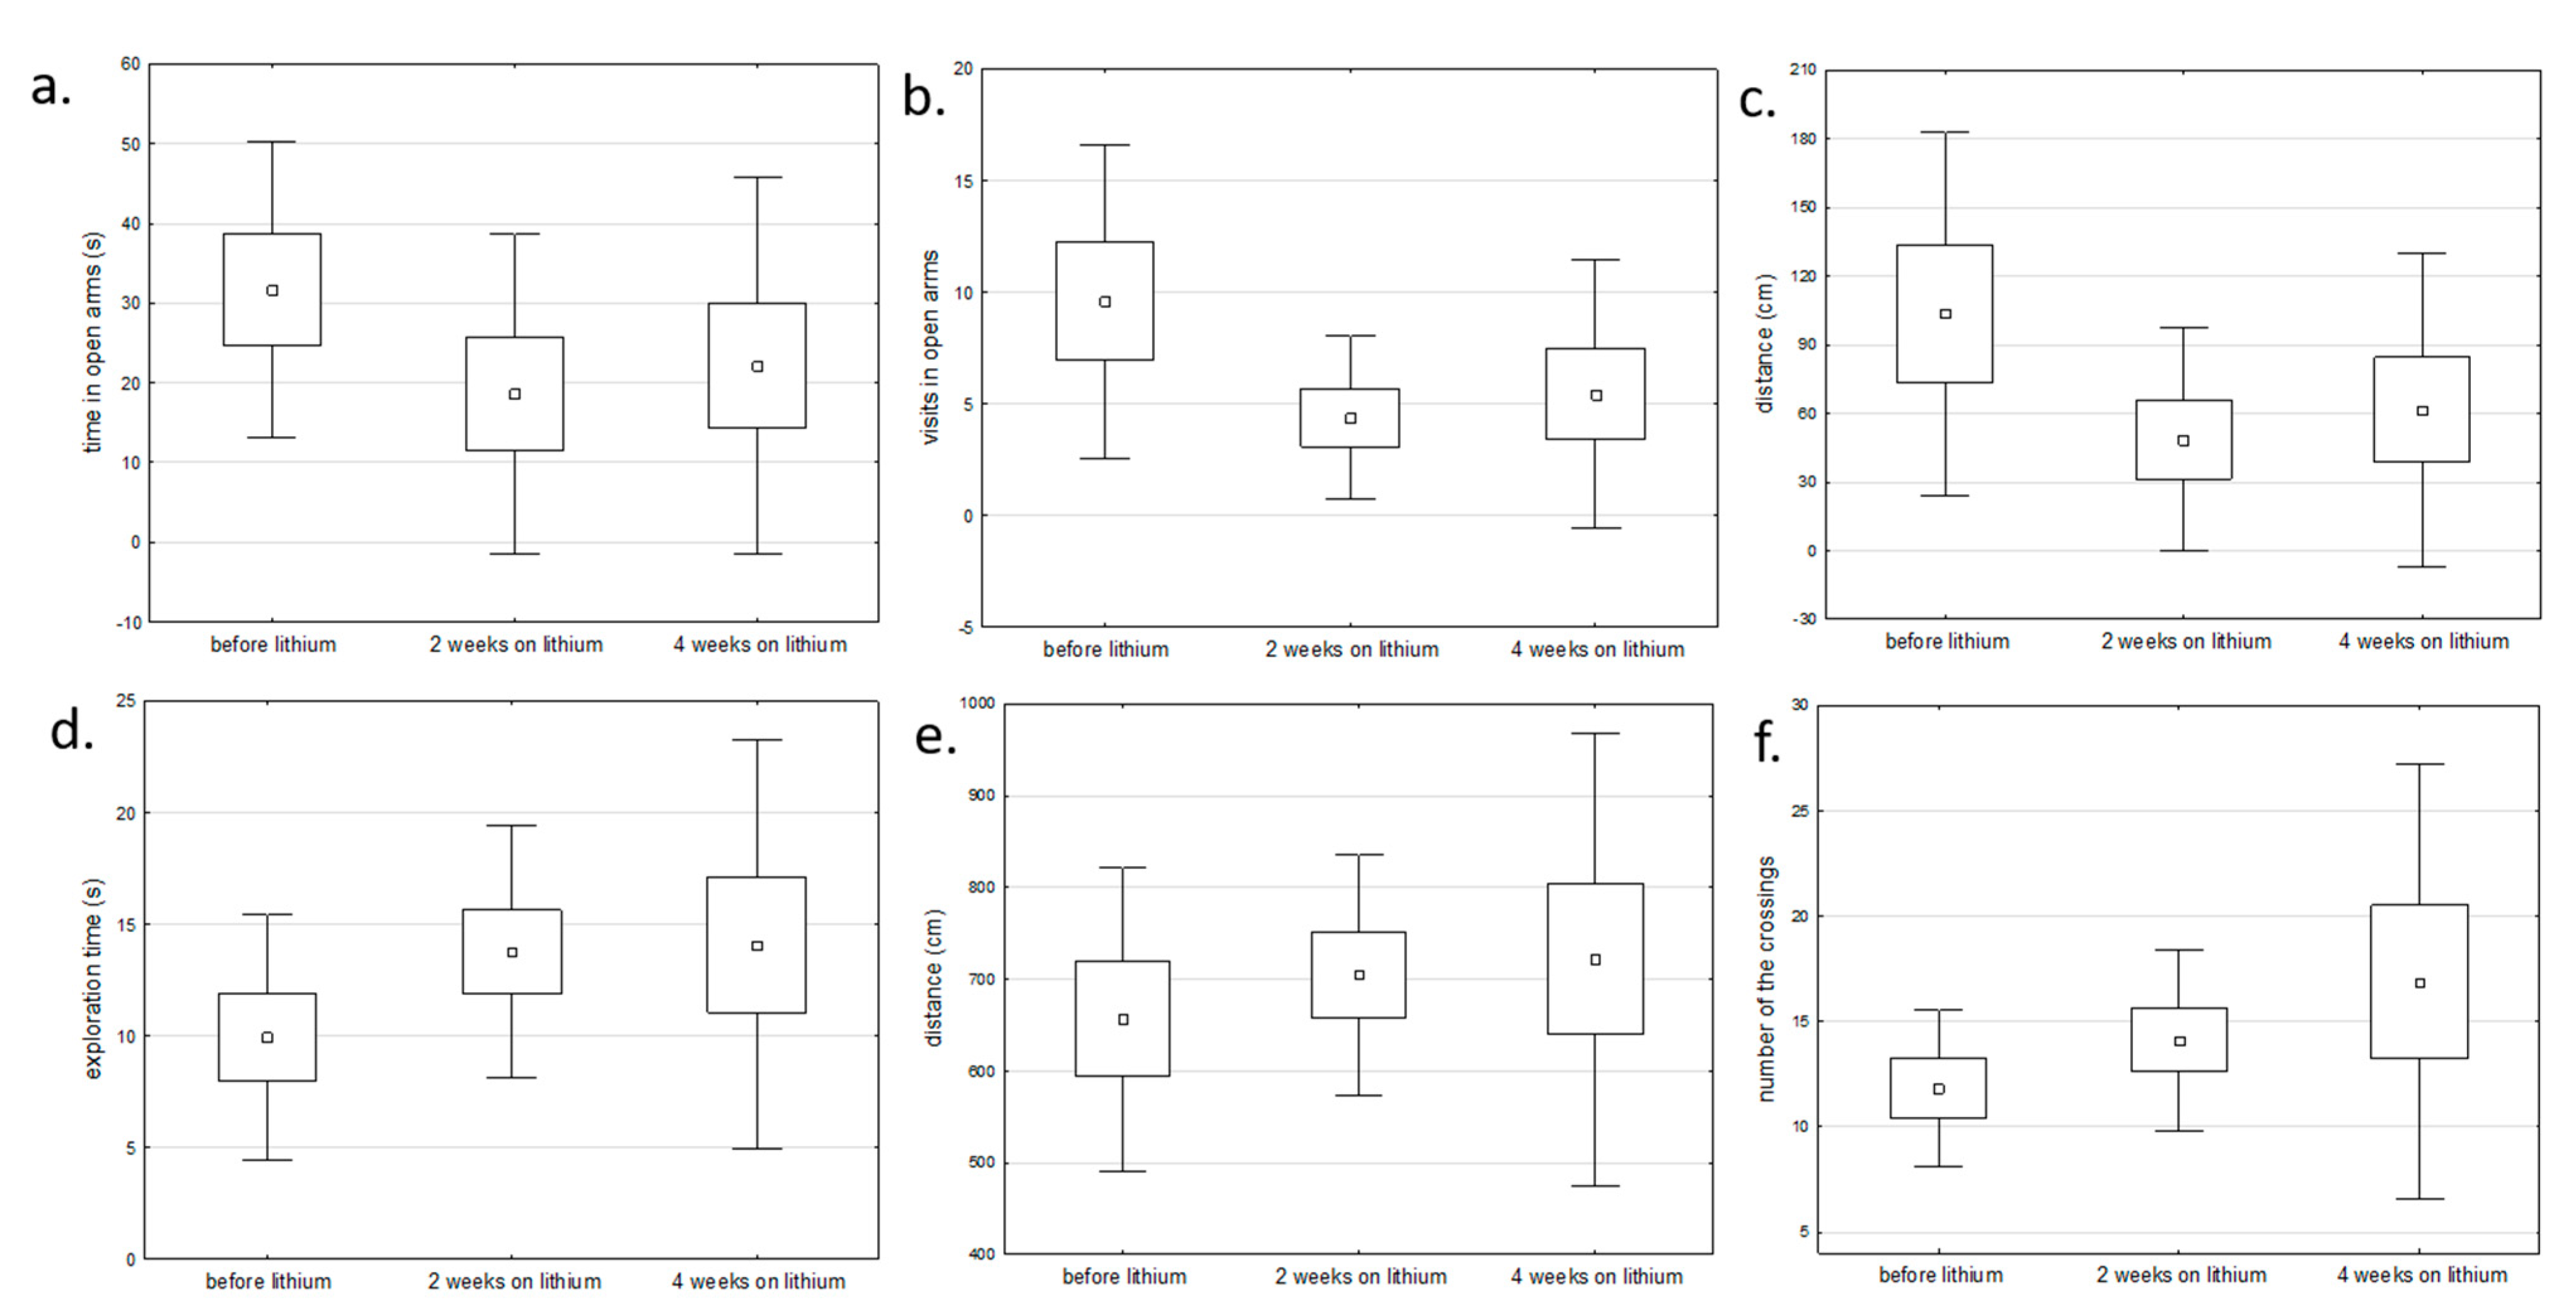
2.1. Behavioral Changes in Amphetamine-Exposed and Stress-Exposed Animals (Models of Mania and Depression)
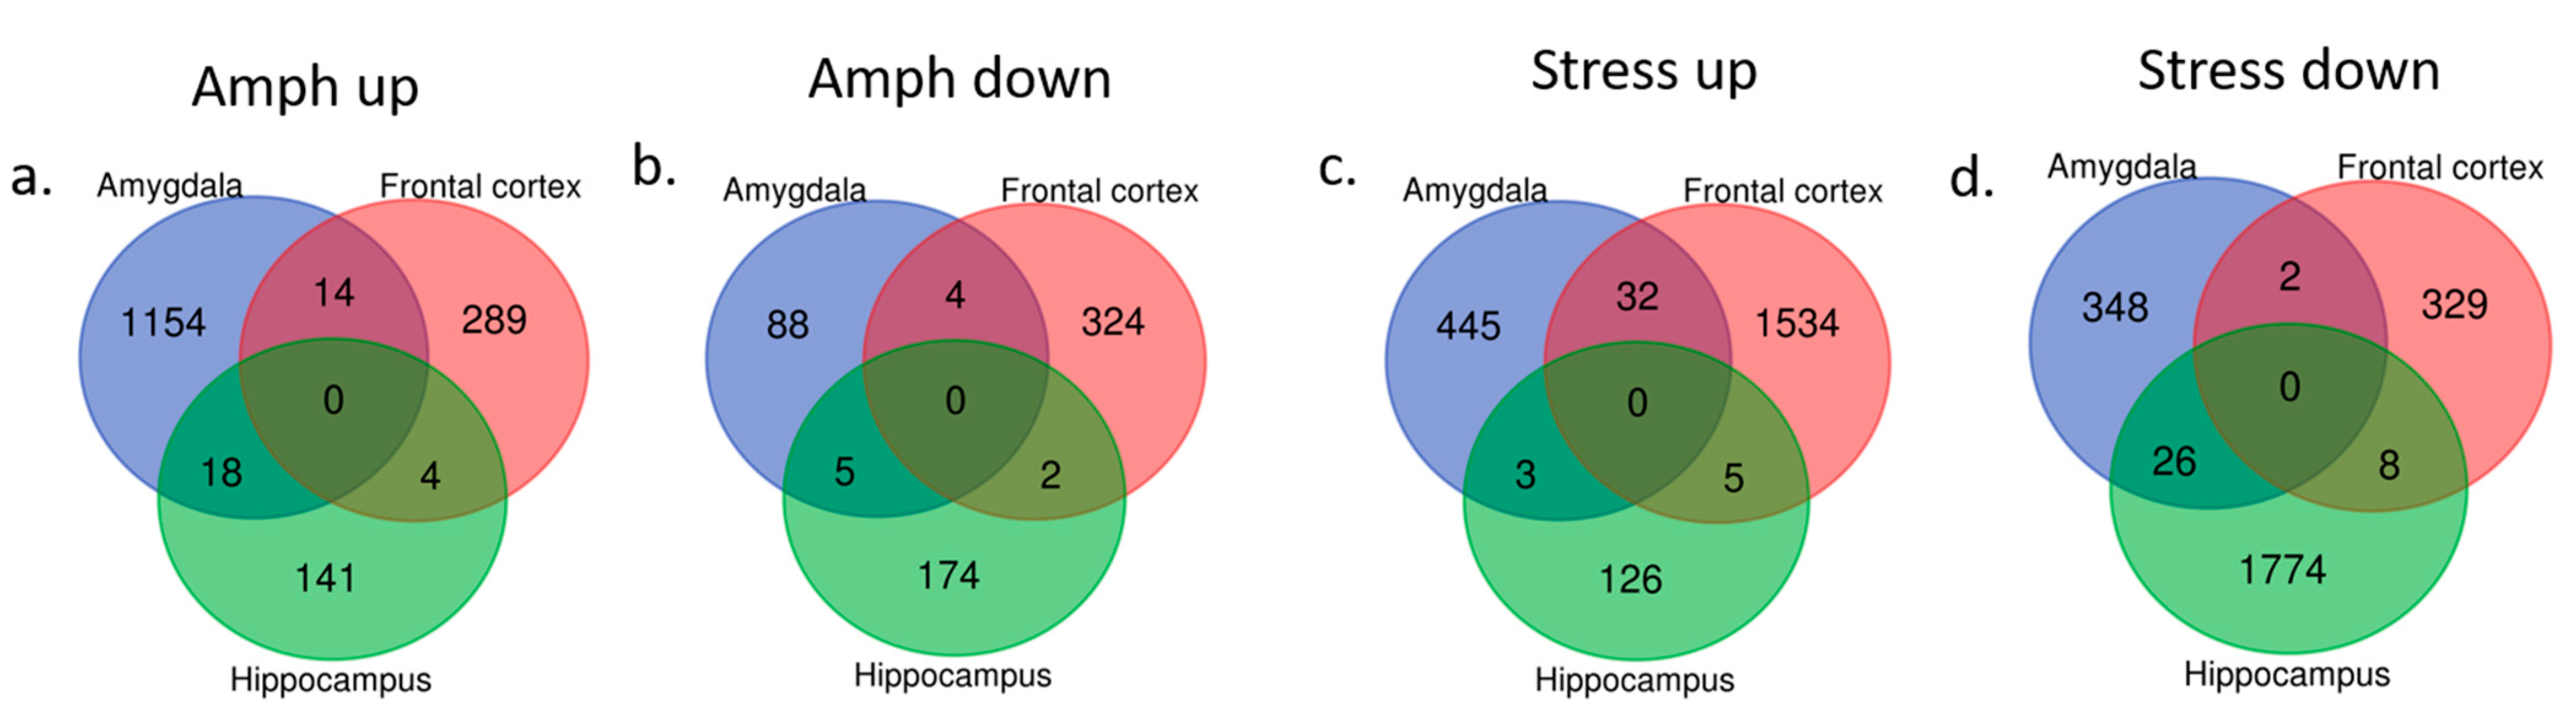
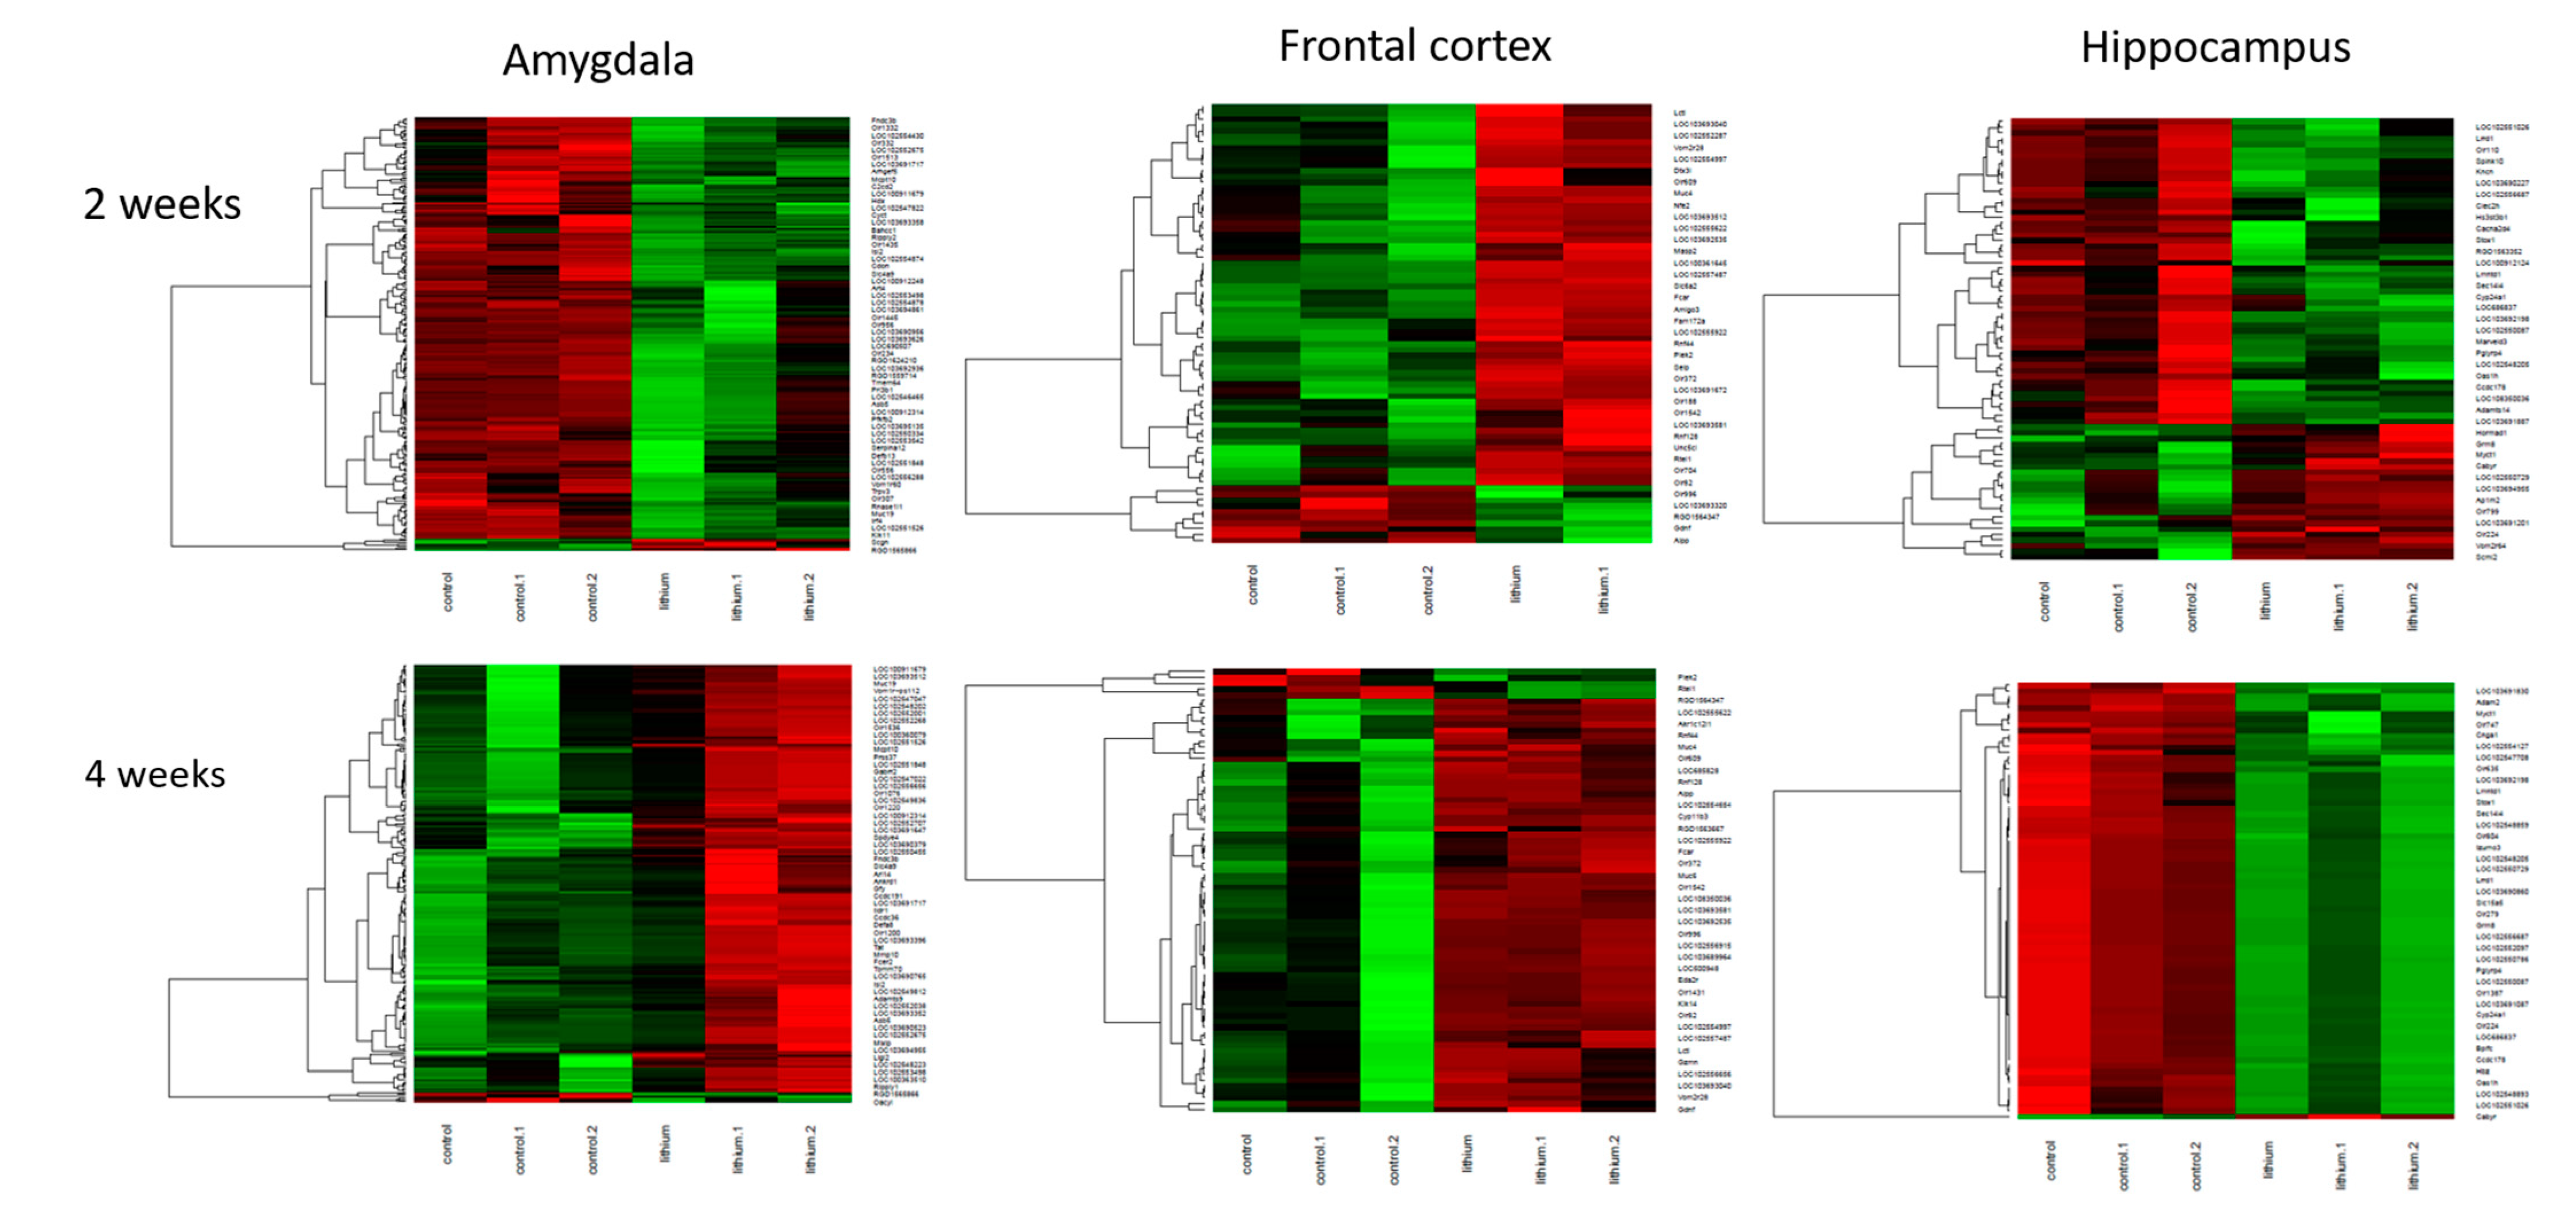
2.2. Brain Transcriptome Changes in the Model of Mania and Depression
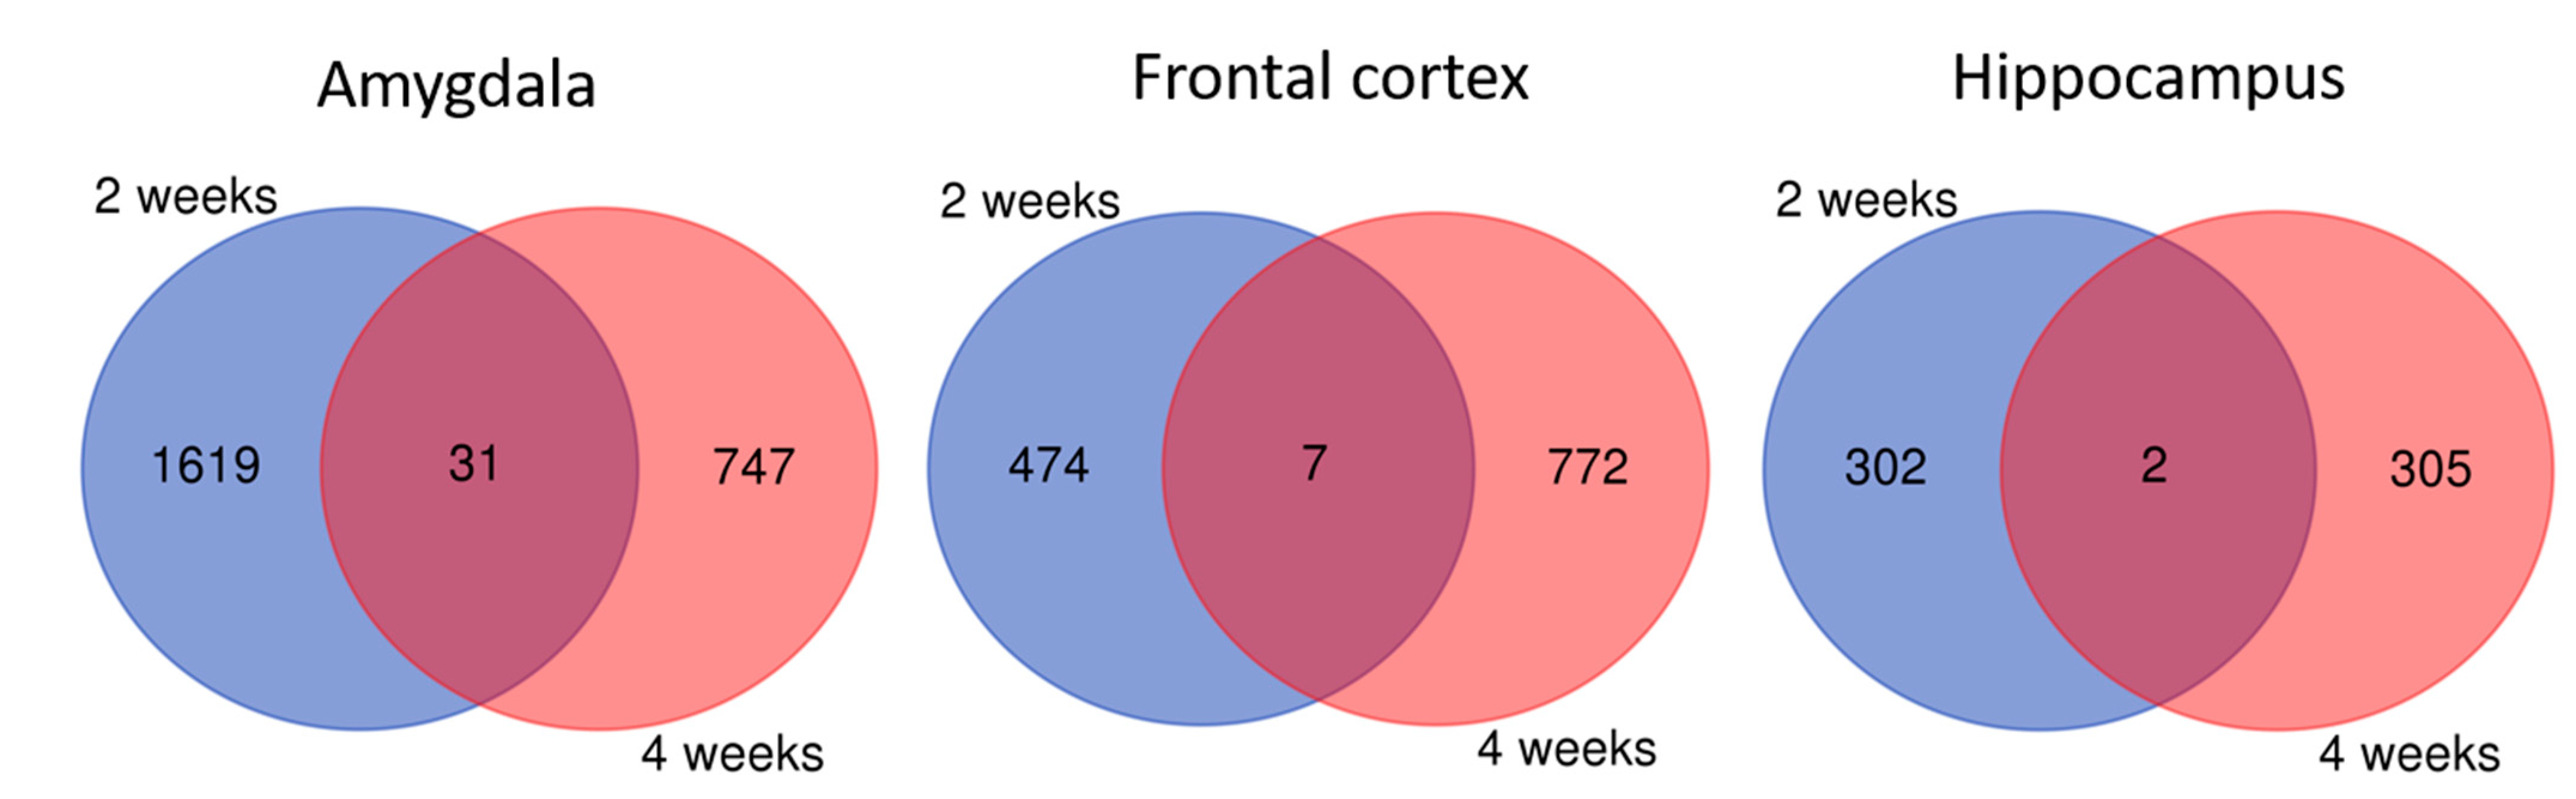
2.3. Brain Transcriptome Changes during Chronic Lithium Administration
2.3.1. Two-Week Lithium Administration
2.3.2. Four-Week Lithium Administration
2.3.3. Molecular Pathways in the Brain during Chronic Lithium Treatment
2.4. Brain Transcriptome Changes in Lithium Responders
3. Discussion
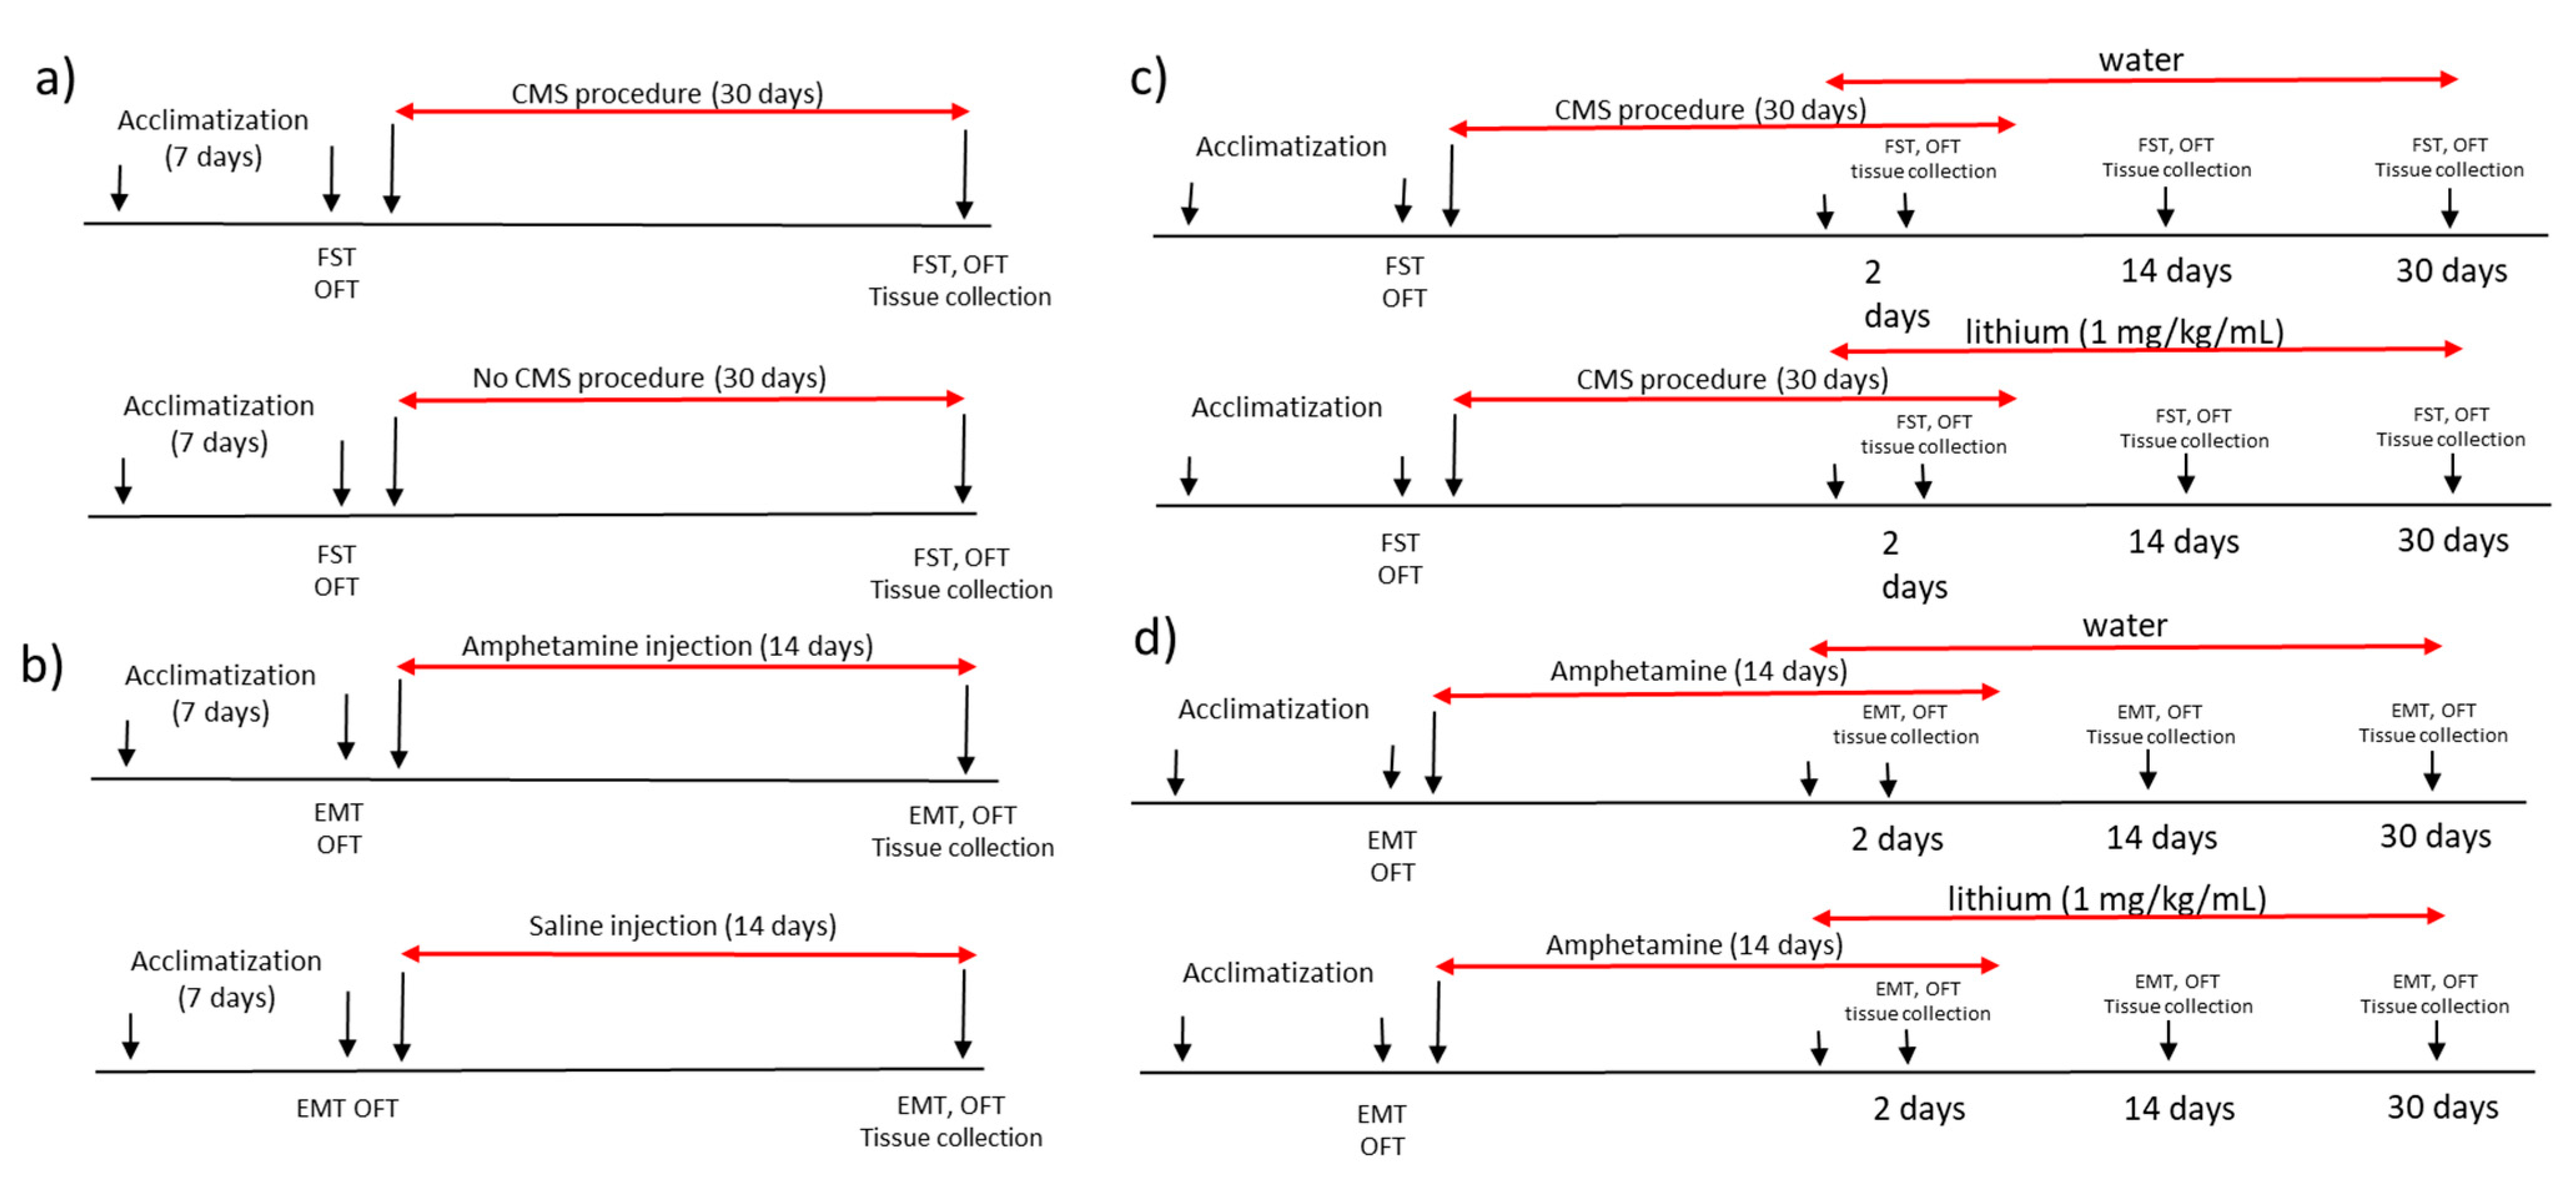
4. Materials and Methods
4.1. Experimental Animals
4.2. Animal Model of Mania
4.3. Animal Model of Depression
4.4. Lithium Administration
4.5. Behaviour Assessment
4.6. Microarray-Based Gene Expression Analysis
4.7. Statistical Analysis
5. Conclusions
Author Contributions
Funding
Institutional Review Board Statement
Data Availability Statement
Acknowledgments
Conflicts of Interest
References
- American Psychiatric Association. Diagnostic and Statistical Manual of Mental Disorders; American Psychiatric Pub.: Washington, DC, USA, 2013. [Google Scholar]
- Cade, J.F. Lithium salts in the treatment of psychotic excitement. Med. J. Aust. 1949, 2, 349–352. [Google Scholar] [CrossRef] [Green Version]
- Rybakowski, J. Lithium carbonate in endogenous depression. Psychiatr. Pol. 1972, 6, 547–550. [Google Scholar]
- Mendels, J. Lithium in the treatment of depression. Am. J. Psychiatry 1976, 133, 373–378. [Google Scholar]
- Rybakowski, J.K. Lithium-past, present, future. Int J. Psychiatry Clin. Pr. 2020, 24, 330–340. [Google Scholar] [CrossRef]
- Harwood, A.J. Lithium and bipolar mood disorder: The inositol-depletion hypothesis revisited. Mol. Psychiatry 2005, 10, 117–126. [Google Scholar] [CrossRef]
- Chalecka-Franaszek, E.; Chuang, D.M. Lithium activates the serine/threonine kinase akt-1 and suppresses glutamate-induced inhibition of akt-1 activity in neurons. Proc. Natl. Acad. Sci. USA 1999, 96, 8745–8750. [Google Scholar] [CrossRef] [Green Version]
- De Sarno, P.; Li, X.; Jope, R.S. Regulation of akt and glycogen synthase kinase-3 beta phosphorylation by sodium valproate and lithium. Neuropharmacology 2002, 43, 1158–1164. [Google Scholar] [CrossRef]
- Severino, G.; Squassina, A.; Costa, M.; Pisanu, C.; Calza, S.; Alda, M.; Del Zompo, M.; Manchia, M. Pharmacogenomics of bipolar disorder. Pharmacogenomics 2013, 14, 655–674. [Google Scholar] [CrossRef]
- Alda, M. Lithium in the treatment of bipolar disorder: Pharmacology and pharmacogenetics. Mol. Psychiatry 2015, 20, 661–670. [Google Scholar] [CrossRef] [Green Version]
- Bosetti, F.; Seemann, R.; Bell, J.M.; Zahorchak, R.; Friedman, E.; Rapoport, S.I.; Manickam, P. Analysis of gene expression with cdna microarrays in rat brain after 7 and 42 days of oral lithium administration. Brain Res. Bull. 2002, 57, 205–209. [Google Scholar] [CrossRef]
- McQuillin, A.; Rizig, M.; Gurling, H.M. A microarray gene expression study of the molecular pharmacology of lithium carbonate on mouse brain mrna to understand the neurobiology of mood stabilization and treatment of bipolar affective disorder. Pharm. Genom. 2007, 17, 605–617. [Google Scholar] [CrossRef] [PubMed]
- Kazour, F.; Richa, S.; Desmidt, T.; Lemaire, M.; Atanasova, B.; El Hage, W. Olfactory and gustatory functions in bipolar disorders: A systematic review. Neurosci. Biobehav. Rev. 2017, 80, 69–79. [Google Scholar] [CrossRef] [PubMed]
- Parker, G.; Paterson, A.; Romano, M.; Granville Smith, I. Suprasensory phenomena in those with a bipolar disorder. Australas. Psychiatry 2018, 26, 384–387. [Google Scholar] [CrossRef] [PubMed]
- Zanni, G.; Michno, W.; Di Martino, E.; Tjarnlund-Wolf, A.; Pettersson, J.; Mason, C.E.; Hellspong, G.; Blomgren, K.; Hanrieder, J. Lithium accumulates in neurogenic brain regions as revealed by high resolution ion imaging. Sci. Rep. 2017, 7, 40726. [Google Scholar] [CrossRef] [PubMed] [Green Version]
- Bertolino, A.; Frye, M.; Callicott, J.H.; Mattay, V.S.; Rakow, R.; Shelton-Repella, J.; Post, R.; Weinberger, D.R. Neuronal pathology in the hippocampal area of patients with bipolar disorder: A study with proton magnetic resonance spectroscopic imaging. Biol. Psychiatry 2003, 53, 906–913. [Google Scholar] [CrossRef]
- Colla, M.; Schubert, F.; Bubner, M.; Heidenreich, J.O.; Bajbouj, M.; Seifert, F.; Luborzewski, A.; Heuser, I.; Kronenberg, G. Glutamate as a spectroscopic marker of hippocampal structural plasticity is elevated in long-term euthymic bipolar patients on chronic lithium therapy and correlates inversely with diurnal cortisol. Mol. Psychiatry 2009, 14, 696–704. [Google Scholar] [CrossRef] [PubMed]
- Giakoumatos, C.I.; Nanda, P.; Mathew, I.T.; Tandon, N.; Shah, J.; Bishop, J.R.; Clementz, B.A.; Pearlson, G.D.; Sweeney, J.A.; Tamminga, C.A.; et al. Effects of lithium on cortical thickness and hippocampal subfield volumes in psychotic bipolar disorder. J. Psychiatr. Res. 2015, 61, 180–187. [Google Scholar] [CrossRef] [Green Version]
- Poretti, M.B.; Rask-Andersen, M.; Kumar, P.; Rubiales de Barioglio, S.; Fiol de Cuneo, M.; Schioth, H.B.; Carlini, V.P. Ghrelin effects expression of several genes associated with depression-like behavior. Prog. Neuropsychopharmacol. Biol. Psychiatry 2015, 56, 227–234. [Google Scholar] [CrossRef]
- Savic, I.; Gulyas, B.; Larsson, M.; Roland, P. Olfactory functions are mediated by parallel and hierarchical processing. Neuron 2000, 26, 735–745. [Google Scholar] [CrossRef] [Green Version]
- Anderson, A.K.; Christoff, K.; Stappen, I.; Panitz, D.; Ghahremani, D.G.; Glover, G.; Gabrieli, J.D.; Sobel, N. Dissociated neural representations of intensity and valence in human olfaction. Nat. Neurosci. 2003, 6, 196–202. [Google Scholar] [CrossRef]
- Parker, G.; Paterson, A.; Romano, M.; Graham, R. Altered sensory phenomena experienced in bipolar disorder. Am. J. Psychiatry 2017, 174, 1146–1150. [Google Scholar] [CrossRef] [PubMed]
- Kazour, F.; Richa, S.; Abi Char, C.; Surget, A.; Elhage, W.; Atanasova, B. Olfactory markers for depression: Differences between bipolar and unipolar patients. PLoS ONE 2020, 15, e0237565. [Google Scholar] [CrossRef] [PubMed]
- Madan, J.S.; Gupta, K.; Chattarji, S.; Bhattacharya, A. Hippocampal and amygdalar cell-specific translation is similar soon after stress but diverge over time. Hippocampus 2018, 28, 441–452. [Google Scholar] [CrossRef] [PubMed]
- Lee, Y.C.; Chao, Y.L.; Chang, C.E.; Hsieh, M.H.; Liu, K.T.; Chen, H.C.; Lu, M.L.; Chen, W.Y.; Chen, C.H.; Tsai, M.H.; et al. Transcriptome changes in relation to manic episode. Front. Psychiatry 2019, 10, 280. [Google Scholar] [CrossRef] [PubMed] [Green Version]
- Ansoleaga, B.; Garcia-Esparcia, P.; Pinacho, R.; Haro, J.M.; Ramos, B.; Ferrer, I. Decrease in olfactory and taste receptor expression in the dorsolateral prefrontal cortex in chronic schizophrenia. J. Psychiatr. Res. 2015, 60, 109–116. [Google Scholar] [CrossRef]
- De Coo, I.F.; Haan, J. Long lasting impairment of taste and smell as side effect of lithium carbonate in a cluster headache patient. Headache 2016, 56, 1201–1203. [Google Scholar] [CrossRef] [PubMed]
- Terao, T.; Watanabe, S.; Hoaki, N.; Hoaki, T. Strange taste and mild lithium intoxication. BMJ Case Rep. 2011, 2011. [Google Scholar] [CrossRef] [Green Version]
- Hou, L.; Heilbronner, U.; Degenhardt, F.; Adli, M.; Akiyama, K.; Akula, N.; Ardau, R.; Arias, B.; Backlund, L.; Banzato, C.E.M.; et al. Genetic variants associated with response to lithium treatment in bipolar disorder: A genome-wide association study. Lancet 2016, 387, 1085–1093. [Google Scholar] [CrossRef] [Green Version]
- Akula, N.; Barb, J.; Jiang, X.; Wendland, J.R.; Choi, K.H.; Sen, S.K.; Hou, L.; Chen, D.T.; Laje, G.; Johnson, K.; et al. Rna-sequencing of the brain transcriptome implicates dysregulation of neuroplasticity, circadian rhythms and gtpase binding in bipolar disorder. Mol. Psychiatry 2014, 19, 1179–1185. [Google Scholar] [CrossRef] [Green Version]
- Fatemi, S.H.; Reutiman, T.J.; Folsom, T.D. The role of lithium in modulation of brain genes: Relevance for aetiology and treatment of bipolar disorder. Biochem. Soc. Trans. 2009, 37, 1090–1095. [Google Scholar] [CrossRef] [Green Version]
- Kato, T.; Kasahara, T.; Kubota-Sakashita, M.; Kato, T.M.; Nakajima, K. Animal models of recurrent or bipolar depression. Neuroscience 2016, 321, 189–196. [Google Scholar] [CrossRef] [PubMed] [Green Version]
- Beyer, D.K.E.; Freund, N. Animal models for bipolar disorder: From bedside to the cage. Int. J. Bipolar Disord. 2017, 5, 35. [Google Scholar] [CrossRef] [PubMed] [Green Version]
- Lan, A.; Einat, H. Questioning the predictive validity of the amphetamine-induced hyperactivity model for screening mood stabilizing drugs. Behav. Brain Res. 2019, 362, 109–113. [Google Scholar] [CrossRef] [PubMed]
- Willner, P. Reliability of the chronic mild stress model of depression: A user survey. Neurobiol. Stress 2017, 6, 68–77. [Google Scholar] [CrossRef] [PubMed] [Green Version]
- Remus, J.L.; Jamison, D.; Johnson, J.D. An animal model of recurrent depression: Sensitized depression-like behavior when rats are re-exposed to chronic mild stress. Brain Behav. Immun. 2013, 32, e4–e5. [Google Scholar] [CrossRef]
- Frey, B.N.; Martins, M.R.; Petronilho, F.C.; Dal-Pizzol, F.; Quevedo, J.; Kapczinski, F. Increased oxidative stress after repeated amphetamine exposure: Possible relevance as a model of mania. Bipolar Disord. 2006, 8, 275–280. [Google Scholar] [CrossRef] [PubMed]
- Szabo, S.T.; Machado-Vieira, R.; Yuan, P.; Wang, Y.; Wei, Y.; Falke, C.; Cirelli, C.; Tononi, G.; Manji, H.K.; Du, J. Glutamate receptors as targets of protein kinase c in the pathophysiology and treatment of animal models of mania. Neuropharmacology 2009, 56, 47–55. [Google Scholar] [CrossRef] [Green Version]
- Feier, G.; Valvassori, S.S.; Varela, R.B.; Resende, W.R.; Bavaresco, D.V.; Morais, M.O.; Scaini, G.; Andersen, M.L.; Streck, E.L.; Quevedo, J. Lithium and valproate modulate energy metabolism in an animal model of mania induced by methamphetamine. Pharm. Biochem. Behav. 2013, 103, 589–596. [Google Scholar] [CrossRef]
- Zhou, Z.; Wang, Y.; Tan, H.; Bharti, V.; Che, Y.; Wang, J.F. Chronic treatment with mood stabilizer lithium inhibits amphetamine-induced risk-taking manic-like behaviors. Neurosci. Lett. 2015, 603, 84–88. [Google Scholar] [CrossRef]
- Valvassori, S.S.; Resende, W.R.; Dal-Pont, G.; Sangaletti-Pereira, H.; Gava, F.F.; Peterle, B.R.; Carvalho, A.F.; Varela, R.B.; Dal-Pizzol, F.; Quevedo, J. Lithium ameliorates sleep deprivation-induced mania-like behavior, hypothalamic-pituitary-adrenal (hpa) axis alterations, oxidative stress and elevations of cytokine concentrations in the brain and serum of mice. Bipolar Disord. 2017, 19, 246–258. [Google Scholar] [CrossRef]
- Valvassori, S.S.; Gava, F.F.; Dal-Pont, G.C.; Simoes, H.L.; Damiani-Neves, M.; Andersen, M.L.; Boeck, C.R.; Quevedo, J. Effects of lithium and valproate on erk/jnk signaling pathway in an animal model of mania induced by amphetamine. Heliyon 2019, 5, e01541. [Google Scholar] [CrossRef] [PubMed] [Green Version]
- Valvassori, S.S.; Tonin, P.T.; Varela, R.B.; Carvalho, A.F.; Mariot, E.; Amboni, R.T.; Bianchini, G.; Andersen, M.L.; Quevedo, J. Lithium modulates the production of peripheral and cerebral cytokines in an animal model of mania induced by dextroamphetamine. Bipolar Disord. 2015, 17, 507–517. [Google Scholar] [CrossRef] [PubMed]
- Menegas, S.; Dal-Pont, G.C.; Cararo, J.H.; Varela, R.B.; Aguiar-Geraldo, J.M.; Possamai-Della, T.; Andersen, M.L.; Quevedo, J.; Valvassori, S.S. Efficacy of folic acid as an adjunct to lithium therapy on manic-like behaviors, oxidative stress and inflammatory parameters in an animal model of mania. Metab. Brain Dis. 2020, 35, 413–425. [Google Scholar] [CrossRef] [PubMed]
- Varela, R.B.; Resende, W.R.; Dal-Pont, G.C.; Gava, F.F.; Nadas, G.B.; Tye, S.J.; Andersen, M.L.; Quevedo, J.; Valvassori, S.S. Role of epigenetic regulatory enzymes in animal models of mania induced by amphetamine and paradoxical sleep deprivation. Eur J. Neurosci. 2020. [Google Scholar] [CrossRef] [PubMed]
- Valvassori, S.S.; Tonin, P.T.; Dal-Pont, G.C.; Varela, R.B.; Cararo, J.H.; Garcia, A.F.; Gava, F.F.; Menegas, S.; Soares, J.C.; Quevedo, J. Coadministration of lithium and celecoxib reverses manic-like behavior and decreases oxidative stress in a dopaminergic model of mania induced in rats. Transl. Psychiatry 2019, 9, 297. [Google Scholar] [CrossRef]
- Bristot, G.; Ascoli, B.M.; Scotton, E.; Gea, L.P.; Pfaffenseller, B.; Kauer-Sant’Anna, M. Effects of lithium on inflammatory and neurotrophic factors after an immune challenge in a lisdexamfetamine animal model of mania. Braz. J. Psychiatry 2019, 41, 419–427. [Google Scholar] [CrossRef] [PubMed] [Green Version]
- Willner, P.; Muscat, R.; Papp, M. Chronic mild stress-induced anhedonia: A realistic animal model of depression. Neurosci. Biobehav. Rev. 1992, 16, 525–534. [Google Scholar] [CrossRef]
- Papp, M. Models of affective illness: Chronic mild stress in the rat. Curr. Protoc. Pharm. 2012, 57. [Google Scholar] [CrossRef]
- Atcha, Z.; Rourke, C.; Neo, A.H.; Goh, C.W.; Lim, J.S.; Aw, C.C.; Browne, E.R.; Pemberton, D.J. Alternative method of oral dosing for rats. J. Am. Assoc. Lab. Anim. Sci. 2010, 49, 335–343. [Google Scholar]
- Chen, G.; Rajkowska, G.; Du, F.; Seraji-Bozorgzad, N.; Manji, H.K. Enhancement of hippocampal neurogenesis by lithium. J. Neurochem. 2000, 75, 1729–1734. [Google Scholar] [CrossRef]
- Porsolt, R.D.; Bertin, A.; Jalfre, M. Behavioral despair in mice: A primary screening test for antidepressants. Arch. Int. Pharm. 1977, 229, 327–336. [Google Scholar]
- Willner, P.; Bergman, J.; Vanderschuren, L.; Ellenbroek, B. Pharmacological approaches to the study of social behaviour. Behav. Pharm. 2015, 26, 501–504. [Google Scholar] [CrossRef] [PubMed] [Green Version]
- Jindal, A.; Mahesh, R.; Bhatt, S. Etazolate rescues behavioral deficits in chronic unpredictable mild stress model: Modulation of hypothalamic-pituitary-adrenal axis activity and brain-derived neurotrophic factor level. Neurochem. Int. 2013, 63, 465–475. [Google Scholar] [CrossRef] [PubMed]
- Belovicova, K.; Bogi, E.; Csatlosova, K.; Dubovicky, M. Animal tests for anxiety-like and depression-like behavior in rats. Interdiscip. Toxicol. 2017, 10, 40–43. [Google Scholar] [CrossRef] [Green Version]
- Sun, H.L.; Zhou, Z.Q.; Zhang, G.F.; Yang, C.; Wang, X.M.; Shen, J.C.; Hashimoto, K.; Yang, J.J. Role of hippocampal p11 in the sustained antidepressant effect of ketamine in the chronic unpredictable mild stress model. Transl. Psychiatry 2016, 6, e741. [Google Scholar] [CrossRef] [Green Version]
- Raudvere, U.; Kolberg, L.; Kuzmin, I.; Arak, T.; Adler, P.; Peterson, H.; Vilo, J. G:Profiler: A web server for functional enrichment analysis and conversions of gene lists (2019 update). Nucleic Acids Res. 2019, 47, W191–W198. [Google Scholar] [CrossRef] [Green Version]


| GO Accession | GO Term | Corr p | No. Genes |
|---|---|---|---|
| GO:0007186 | G-protein coupled receptor signaling pathway | 0.000 | 117 |
| GO:0007600 | sensory perception | 0.000 | 103 |
| GO:0051606 | detection of stimulus | 0.000 | 88 |
| GO:0050906 | detection of stimulus involved in sensory perception | 0.000 | 84 |
| GO:0038023 | signaling receptor activity | 0.000 | 120 |
| GO:0060089 | molecular transducer activity | 0.000 | 120 |
| GO:0009593 | detection of chemical stimulus | 0.000 | 81 |
| GO:0050907 | detection of chemical stimulus involved in sensory perception | 0.000 | 79 |
| GO:0004888 | transmembrane signaling receptor activity | 0.000 | 111 |
| GO:0004930 | G-protein coupled receptor activity | 0.000 | 93 |
| GO:0004871 | signal transducer activity | 0.000 | 126 |
| GO:0007606 | sensory perception of chemical stimulus | 0.000 | 82 |
| GO:0004984 | olfactory receptor activity | 0.000 | 74 |
| GO:0050911 | detection of chemical stimulus involved in sensory perception of smell | 0.000 | 74 |
| GO:0007608 | sensory perception of smell | 0.000 | 75 |
| GO:0007165 | signal transduction | 0.000 | 201 |
| GO:0003008 | system process | 0.000 | 123 |
| GO:0050877 | nervous system process | 0.000 | 106 |
| GO:0023052 | signaling | 0.000 | 209 |
| GO:0007154 | cell communication | 0.000 | 212 |
| GO:0050896 | response to stimulus | 0.001 | 287 |
| GO:0051716 | cellular response to stimulus | 0.004 | 238 |
| GO:0005833 | hemoglobin complex | 0.019 | 5 |
| GO Accession | GO Term | Corr p | No. Genes |
|---|---|---|---|
| Downregulated | |||
| GO:0007610 | behavior | 0.002 | 26 |
| GO:0007188 | adenylate cyclase-modulating G-protein coupled receptor signaling pathway | 0.002 | 12 |
| GO:0007187 | G-protein coupled receptor signaling pathway, coupled to cyclic nucleotide second messenger | 0.003 | 12 |
| GO:0044459 | plasma membrane part | 0.004 | 53 |
| GO:0003013 | circulatory system process | 0.004 | 17 |
| GO:0008015 | blood circulation | 0.004 | 17 |
| GO:0007626 | locomotory behavior | 0.004 | 14 |
| GO:0007193 | adenylate cyclase-inhibiting G-protein coupled receptor signaling pathway | 0.037 | 7 |
| Upregulated | |||
| GO:0023052 | signaling | 0.000 | 102 |
| GO:0007154 | cell communication | 0.000 | 102 |
| GO:0007165 | signal transduction | 0.000 | 95 |
| GO:0038023 | signaling receptor activity | 0.001 | 55 |
| GO:0060089 | molecular transducer activity | 0.001 | 55 |
| GO:0004888 | transmembrane signaling receptor activity | 0.001 | 52 |
| GO:0004871 | signal transducer activity | 0.006 | 57 |
| GO:0007186 | G-protein coupled receptor signaling pathway | 0.006 | 49 |
| GO:0003008 | system process | 0.006 | 57 |
| GO:0051606 | detection of stimulus | 0.017 | 37 |
| GO:0050896 | response to stimulus | 0.022 | 126 |
| GO:0004930 | G-protein coupled receptor activity | 0.028 | 40 |
| GO:0009593 | detection of chemical stimulus | 0.028 | 34 |
| GO:0050906 | detection of stimulus involved in sensory perception | 0.045 | 34 |
| GO:0009653 | anatomical structure morphogenesis | 0.050 | 45 |
| GO Accession | GO Term | Corr p | No. Genes |
|---|---|---|---|
| Amygdala upregulated | |||
| GO:0038023 | signaling receptor activity | 0.000 | 367 |
| GO:0060089 | molecular transducer activity | 0.000 | 367 |
| GO:0004888 | transmembrane signaling receptor activity | 0.000 | 352 |
| GO:0007186 | G-protein coupled receptor signaling pathway | 0.000 | 344 |
| GO:0007600 | sensory perception | 0.000 | 310 |
| GO:0004930 | G-protein coupled receptor activity | 0.000 | 299 |
| GO:0007606 | sensory perception of chemical stimulus | 0.000 | 285 |
| GO:0051606 | detection of stimulus | 0.000 | 281 |
| GO:0050906 | detection of stimulus involved in sensory perception | 0.000 | 273 |
| GO:0009593 | detection of chemical stimulus | 0.000 | 268 |
| GO:0050907 | detection of chemical stimulus involved in sensory perception | 0.000 | 264 |
| GO:0007608 | sensory perception of smell | 0.000 | 256 |
| GO:0004984 | olfactory receptor activity | 0.000 | 247 |
| GO:0050911 | detection of chemical stimulus involved in sensory perception of smell | 0.000 | 247 |
| GO:0004871 | signal transducer activity | 0.000 | 379 |
| GO:0050877 | nervous system process | 0.000 | 330 |
| GO:0003008 | system process | 0.000 | 363 |
| GO:0031224 | intrinsic component of membrane | 0.000 | 640 |
| GO:0016021 | integral component of membrane | 0.000 | 627 |
| GO:0007165 | signal transduction | 0.000 | 509 |
| GO:0042221 | response to chemical | 0.000 | 507 |
| GO:0044425 | membrane part | 0.000 | 687 |
| GO:0005886 | plasma membrane | 0.000 | 521 |
| GO:0005549 | odorant binding | 0.000 | 68 |
| GO:0071944 | cell periphery | 0.000 | 528 |
| GO:0023052 | signaling | 0.000 | 523 |
| GO:0007154 | cell communication | 0.000 | 533 |
| GO:0032501 | multicellular organismal process | 0.000 | 669 |
| GO:0050896 | response to stimulus | 0.000 | 731 |
| GO:0004252 | serine-type endopeptidase activity | 0.000 | 44 |
| GO:0051716 | cellular response to stimulus | 0.000 | 597 |
| GO:0008236 | serine-type peptidase activity | 0.000 | 44 |
| GO:0017171 | serine hydrolase activity | 0.000 | 44 |
| GO:0008527 | taste receptor activity | 0.000 | 15 |
| GO:0050912 | detection of chemical stimulus involved in sensory perception of taste | 0.001 | 17 |
| GO:0050913 | sensory perception of bitter taste | 0.002 | 16 |
| GO:0033038 | bitter taste receptor activity | 0.002 | 13 |
| GO:0001580 | detection of chemical stimulus involved in sensory perception of bitter taste | 0.004 | 15 |
| GO:0004175 | endopeptidase activity | 0.005 | 61 |
| GO:0050909 | sensory perception of taste | 0.007 | 19 |
| Frontal cortex downregulated | |||
| GO:0038023 | signaling receptor activity | 0.022 | 80 |
| GO:0060089 | molecular transducer activity | 0.022 | 80 |
| GO:0007608 | sensory perception of smell | 0.022 | 52 |
| GO:0004984 | olfactory receptor activity | 0.022 | 50 |
| GO:0050911 | detection of chemical stimulus involved in sensory perception of smell | 0.022 | 50 |
| GO:0009593 | detection of chemical stimulus | 0.026 | 52 |
| GO:0050907 | detection of chemical stimulus involved in sensory perception | 0.026 | 51 |
| GO:0051606 | detection of stimulus | 0.029 | 55 |
| GO:0007606 | sensory perception of chemical stimulus | 0.033 | 54 |
| GO:0050906 | detection of stimulus involved in sensory perception | 0.033 | 52 |
| GO:0004888 | transmembrane signaling receptor activity | 0.036 | 72 |
| GO Accession | GO Term | Corr p | No. Genes |
|---|---|---|---|
| Amygdala (top 20 out of 206) | |||
| GO:0005578 | proteinaceous extracellular matrix | 0.000 | 41 |
| GO:0031012 | extracellular matrix | 0.000 | 34 |
| GO:0005576 | extracellular region | 0.000 | 117 |
| GO:0044421 | extracellular region part | 0.000 | 108 |
| GO:0005615 | extracellular space | 0.000 | 104 |
| GO:0044420 | extracellular matrix component | 0.000 | 19 |
| GO:0009888 | tissue development | 0.000 | 62 |
| GO:0030198 | extracellular matrix organization | 0.000 | 21 |
| GO:0009653 | anatomical structure morphogenesis | 0.000 | 68 |
| GO:0043062 | extracellular structure organization | 0.000 | 21 |
| GO:0007275 | multicellular organism development | 0.000 | 112 |
| GO:0030199 | collagen fibril organization | 0.000 | 11 |
| GO:0072001 | renal system development | 0.000 | 24 |
| GO:0005581 | collagen trimer | 0.000 | 13 |
| GO:0032502 | developmental process | 0.000 | 122 |
| GO:0048513 | animal organ development | 0.000 | 87 |
| GO:0048646 | anatomical structure formation involved in morphogenesis | 0.000 | 39 |
| GO:0009887 | animal organ morphogenesis | 0.000 | 41 |
| GO:0048731 | system development | 0.000 | 104 |
| Hippocampus | |||
| GO:0002474 | antigen processing and presentation of peptide antigen via MHC class I | 0.024 | 4 |
| GO:0042605 | peptide antigen binding | 0.024 | 4 |
| GO Accession | GO Term | Corr p | No. Genes |
|---|---|---|---|
| Amygdala downregulated | |||
| GO:0038023 | signaling receptor activity | 0.000 | 228 |
| GO:0060089 | molecular transducer activity | 0.000 | 228 |
| GO:0004888 | transmembrane signaling receptor activity | 0.000 | 212 |
| GO:0007608 | sensory perception of smell | 0.000 | 149 |
| GO:0004984 | olfactory receptor activity | 0.000 | 144 |
| GO:0050911 | detection of chemical stimulus involved in sensory perception of smell | 0.000 | 144 |
| GO:0007606 | sensory perception of chemical stimulus | 0.000 | 159 |
| GO:0007600 | sensory perception | 0.000 | 186 |
| GO:0050907 | detection of chemical stimulus involved in sensory perception | 0.000 | 147 |
| GO:0050906 | detection of stimulus involved in sensory perception | 0.000 | 151 |
| GO:0051606 | detection of stimulus | 0.000 | 157 |
| GO:0009593 | detection of chemical stimulus | 0.000 | 147 |
| GO:0004930 | G-protein coupled receptor activity | 0.000 | 172 |
| GO:0004871 | signal transducer activity | 0.000 | 237 |
| GO:0007186 | G-protein coupled receptor signaling pathway | 0.000 | 196 |
| GO:0050877 | nervous system process | 0.000 | 199 |
| GO:0031224 | intrinsic component of membrane | 0.000 | 451 |
| GO:0016021 | integral component of membrane | 0.000 | 441 |
| GO:0003008 | system process | 0.000 | 220 |
| GO:0044425 | membrane part | 0.002 | 488 |
| GO:0005886 | plasma membrane | 0.003 | 365 |
| GO:0023052 | signaling | 0.007 | 366 |
| GO:0071944 | cell periphery | 0.008 | 369 |
| GO:0007165|GO:0023033 | signal transduction | 0.009 | 346 |
| GO:0007154 | cell communication | 0.011 | 373 |
| GO:0005549 | odorant binding | 0.020 | 40 |
| Frontal cortex downregulated | |||
| GO:0007606 | sensory perception of chemical stimulus | 0.000 | 154 |
| GO:0004984 | olfactory receptor activity | 0.000 | 140 |
| GO:0050911 | detection of chemical stimulus involved in sensory perception of smell | 0.000 | 140 |
| GO:0009593 | detection of chemical stimulus | 0.000 | 145 |
| GO:0050907 | detection of chemical stimulus involved in sensory perception | 0.000 | 143 |
| GO:0007608 | sensory perception of smell | 0.000 | 142 |
| GO:0007600 | sensory perception | 0.000 | 171 |
| GO:0050906 | detection of stimulus involved in sensory perception | 0.000 | 144 |
| GO:0051606 | detection of stimulus | 0.000 | 148 |
| GO:0004888 | transmembrane signaling receptor activity | 0.000 | 183 |
| GO:0004930 | G-protein coupled receptor activity | 0.000 | 154 |
| GO:0038023 | signaling receptor activity | 0.000 | 190 |
| GO:0060089 | molecular transducer activity | 0.000 | 190 |
| GO:0050877 | nervous system process | 0.000 | 177 |
| GO:0007186 | G-protein coupled receptor signaling pathway | 0.000 | 172 |
| GO:0004871 | signal transducer activity | 0.000 | 197 |
| GO:0003008 | system process | 0.000 | 195 |
| GO:0031224 | intrinsic component of membrane | 0.000 | 340 |
| GO:0016021 | integral component of membrane | 0.000 | 334 |
| GO:0071944 | cell periphery | 0.000 | 287 |
| GO:0005886 | plasma membrane | 0.000 | 281 |
| GO:0042221 | response to chemical | 0.000 | 269 |
| GO:0044425 | membrane part | 0.000 | 364 |
| GO:0032501 | multicellular organismal process | 0.001 | 352 |
| GO:0005549 | odorant binding | 0.001 | 34 |
| GO:0036156 | inner dynein arm | 0.006 | 4 |
| GO:0007165 | signal transduction | 0.006 | 252 |
| GO:0004252 | serine-type endopeptidase activity | 0.019 | 22 |
| GO:0023052 | signaling | 0.030 | 261 |
| GO:0007154 | cell communication | 0.030 | 267 |
| GO:0008236 | serine-type peptidase activity | 0.043 | 23 |
| Hippocampus downregulated | |||
| GO:0001580 | detection of chemical stimulus involved in sensory perception of bitter taste | 0.000 | 1394 |
| GO:0001594 | trace-amine receptor activity | 0.000 | 1323 |
| GO:0003008 | system process | 0.000 | 1316 |
| GO:0004252 | serine-type endopeptidase activity | 0.000 | 1313 |
| GO:0004866 | endopeptidase inhibitor activity | 0.000 | 1212 |
| GO:0004867 | serine-type endopeptidase inhibitor activity | 0.000 | 1119 |
| GO:0004869 | cysteine-type endopeptidase inhibitor activity | 0.000 | 1105 |
| GO:0004871 | signal transducer activity | 0.000 | 1083 |
| GO:0004888 | transmembrane signaling receptor activity | 0.000 | 1062 |
| GO:0004930 | G-protein coupled receptor activity | 0.000 | 1053 |
| GO:0004984 | olfactory receptor activity | 0.000 | 1037 |
| GO:0005179 | hormone activity | 0.000 | 888 |
| GO:0005549 | odorant binding | 0.000 | 877 |
| GO:0005886 | plasma membrane | 0.000 | 877 |
| GO:0007154 | cell communication | 0.000 | 850 |
| GO:0007165 | signal transduction | 0.000 | 845 |
| GO:0007186 | G-protein coupled receptor signaling pathway | 0.000 | 835 |
| GO:0007600 | sensory perception | 0.000 | 791 |
| GO:0007606 | sensory perception of chemical stimulus | 0.000 | 769 |
| GO:0007608 | sensory perception of smell | 0.000 | 740 |
| GO:0008527 | taste receptor activity | 0.000 | 720 |
| GO:0009593 | detection of chemical stimulus | 0.000 | 697 |
| GO:0010466 | negative regulation of peptidase activity | 0.000 | 684 |
| GO:0010951 | negative regulation of endopeptidase activity | 0.000 | 675 |
| GO:0016020 | membrane | 0.000 | 673 |
| GO:0016021 | integral component of membrane | 0.000 | 652 |
| GO:0016503 | pheromone receptor activity | 0.000 | 644 |
| GO:0017171 | serine hydrolase activity | 0.000 | 644 |
| GO:0019236 | response to pheromone | 0.000 | 173 |
| GO:0023052 | signaling | 0.000 | 1413 |
| GO:0030414 | peptidase inhibitor activity | 0.000 | 1507 |
| GO:0030545 | receptor regulator activity | 0.000 | 41 |
| GO:0031224 | intrinsic component of membrane | 0.000 | 41 |
| GO:0032501 | multicellular organismal process | 0.000 | 1583 |
| GO:0033038 | bitter taste receptor activity | 0.000 | 27 |
| GO:0038023 | signaling receptor activity | 0.000 | 24 |
| GO:0042221 | response to chemical | 0.000 | 1644 |
| GO:0042742 | defense response to bacterium | 0.000 | 29 |
| GO:0044425 | membrane part | 0.000 | 1726 |
| GO:0048018 | receptor ligand activity | 0.000 | 26 |
| GO:0050789 | regulation of biological process | 0.000 | 26 |
| GO:0050794 | regulation of cellular process | 0.000 | 32 |
| GO:0050877 | nervous system process | 0.000 | 57 |
| GO:0050896 | response to stimulus | 0.000 | 54 |
| GO:0050906 | detection of stimulus involved in sensory perception | 0.000 | 54 |
| GO:0050907 | detection of chemical stimulus involved in sensory perception | 0.000 | 13 |
| GO:0050909 | sensory perception of taste | 0.000 | 40 |
| GO:0050911 | detection of chemical stimulus involved in sensory perception of smell | 0.001 | 90 |
| GO:0050912 | detection of chemical stimulus involved in sensory perception of taste | 0.001 | 57 |
| GO:0050913 | sensory perception of bitter taste | 0.001 | 94 |
| GO:0051606 | detection of stimulus | 0.001 | 63 |
| GO:0051716 | cellular response to stimulus | 0.002 | 60 |
| GO:0060089 | molecular transducer activity | 0.010 | 23 |
| GO:0061134 | peptidase regulator activity | 0.011 | 54 |
| GO:0061135 | endopeptidase regulator activity | 0.014 | 49 |
| GO:0065007 | biological regulation | 0.025 | 28 |
| GO:0071944 | cell periphery | 0.043 | 53 |
| GO Accession | GO Term | Corr p | No. Genes |
|---|---|---|---|
| Amygdala upregulated | |||
| GO:0038023 | signaling receptor activity | 0.000 | 63 |
| GO:0060089 | molecular transducer activity | 0.000 | 63 |
| GO:0004888 | transmembrane signaling receptor activity | 0.000 | 59 |
| GO:0007600 | sensory perception | 0.000 | 54 |
| GO:0050907 | detection of chemical stimulus involved in sensory perception | 0.000 | 43 |
| GO:0007606 | sensory perception of chemical stimulus | 0.000 | 45 |
| GO:0009593 | detection of chemical stimulus | 0.000 | 43 |
| GO:0051606 | detection of stimulus | 0.000 | 45 |
| GO:0050906 | detection of stimulus involved in sensory perception | 0.000 | 43 |
| GO:0007608 | sensory perception of smell | 0.000 | 41 |
| GO:0004984 | olfactory receptor activity | 0.000 | 40 |
| GO:0050911 | detection of chemical stimulus involved in sensory perception of smell | 0.000 | 40 |
| GO:0007186 | G-protein coupled receptor signaling pathway | 0.000 | 56 |
| GO:0004871 | signal transducer activity | 0.002 | 63 |
| GO:0003008 | system process | 0.003 | 63 |
| GO:0050877 | nervous system process | 0.003 | 55 |
| GO:0004930 | G-protein coupled receptor activity | 0.003 | 46 |
| Frontal cortex upregulated | |||
| GO:0000786 | nucleosome | 0.000 | 5 |
| GO:0006334 | nucleosome assembly | 0.000 | 5 |
| GO:0044815 | DNA packaging complex | 0.000 | 5 |
| GO:0045653 | negative regulation of megakaryocyte differentiation | 0.000 | 3 |
| GO:0031497 | chromatin assembly | 0.000 | 5 |
| GO:0006333 | chromatin assembly or disassembly | 0.000 | 5 |
| GO:0034728 | nucleosome organization | 0.000 | 5 |
| GO:0006323 | DNA packaging | 0.000 | 5 |
| GO:0065004 | protein-DNA complex assembly | 0.000 | 5 |
| GO:0006335 | DNA replication-dependent nucleosome assembly | 0.000 | 3 |
| GO:0034723 | DNA replication-dependent nucleosome organization | 0.000 | 3 |
| GO:0032993 | protein-DNA complex | 0.000 | 5 |
| GO:0071824 | protein-DNA complex subunit organization | 0.000 | 5 |
| GO:0000788 | nuclear nucleosome | 0.000 | 3 |
| GO:0006336 | DNA replication-independent nucleosome assembly | 0.000 | 3 |
| GO:0045652 | regulation of megakaryocyte differentiation | 0.000 | 3 |
| GO:0034724 | DNA replication-independent nucleosome organization | 0.000 | 3 |
| GO:0071103 | DNA conformation change | 0.001 | 5 |
| GO:0051290 | protein heterotetramerization | 0.002 | 3 |
| GO:0051291 | protein heterooligomerization | 0.006 | 4 |
| GO:0030492 | hemoglobin binding | 0.008 | 2 |
| GO:0006352 | DNA-templated transcription. initiation | 0.018 | 3 |
| GO:0045638 | negative regulation of myeloid cell differentiation | 0.018 | 3 |
| GO:0000785 | chromatin | 0.047 | 5 |
| Hippocampus upregulated | |||
| GO:0005578 | proteinaceous extracellular matrix | 0.022 | 10 |
| GO:0031012 | extracellular matrix | 0.009 | 13 |
| Go Accession | GO Term | Corr p | No. Genes |
|---|---|---|---|
| upregulated in the amygdala | |||
| GO:0007606 | sensory perception of chemical stimulus | 0.000 | 232 |
| GO:0009593 | detection of chemical stimulus | 0.000 | 220 |
| GO:0050907 | detection of chemical stimulus involved in sensory perception | 0.000 | 216 |
| GO:0051606 | detection of stimulus | 0.000 | 232 |
| GO:0050906 | detection of stimulus involved in sensory perception | 0.000 | 220 |
| GO:0004930 | G-protein coupled receptor activity | 0.000 | 252 |
| GO:0007608 | sensory perception of smell | 0.000 | 210 |
| GO:0004984 | olfactory receptor activity | 0.000 | 205 |
| GO:0050911 | detection of chemical stimulus involved in sensory perception of smell | 0.000 | 205 |
| GO:0007186 | G-protein coupled receptor signaling pathway | 0.000 | 291 |
| GO:0007600 | sensory perception | 0.000 | 261 |
| GO:0004888 | transmembrane signaling receptor activity | 0.000 | 293 |
| GO:0038023 | signaling receptor activity | 0.000 | 306 |
| GO:0060089 | molecular transducer activity | 0.000 | 306 |
| GO:0004871 | signal transducer activity | 0.000 | 317 |
| GO:0050877 | nervous system process | 0.000 | 275 |
| GO:0003008 | system process | 0.000 | 306 |
| GO:0031224 | intrinsic component of membrane | 0.000 | 556 |
| GO:0016021 | integral component of membrane | 0.000 | 548 |
| GO:0007165 | signal transduction | 0.000 | 436 |
| GO:0032501 | multicellular organismal process | 0.000 | 596 |
| GO:0007154 | cell communication | 0.000 | 464 |
| GO:0023052 | signaling | 0.000 | 452 |
| GO:0044425 | membrane part | 0.000 | 596 |
| GO:0005886 | plasma membrane | 0.000 | 447 |
| GO:0042221 | response to chemical | 0.000 | 429 |
| GO:0071944 | cell periphery | 0.000 | 455 |
| GO:0030414 | peptidase inhibitor activity | 0.000 | 35 |
| GO:0005549 | odorant binding | 0.001 | 50 |
| GO:0004252 | serine-type endopeptidase activity | 0.001 | 34 |
| GO:0004866 | endopeptidase inhibitor activity | 0.001 | 32 |
| GO:0061135 | endopeptidase regulator activity | 0.003 | 32 |
| GO:0061134 | peptidase regulator activity | 0.005 | 35 |
| GO:0010466 | negative regulation of peptidase activity | 0.011 | 38 |
| GO:0008236 | serine-type peptidase activity | 0.019 | 34 |
| GO:0017171 | serine hydrolase activity | 0.025 | 34 |
| GO:0050896 | response to stimulus | 0.026 | 631 |
| GO:003024 | carbohydrate binding | 0.041 | 38 |
| GO:0010951 | negative regulation of endopeptidase activity | 0.044 | 35 |
| GO:0004869 | cysteine-type endopeptidase inhibitor activity | 0.046 | 15 |
| upregulated in the frontal cortex | |||
| GO:0004930 | G-protein coupled receptor activity | 0.000 | 44 |
| GO:0004888 | transmembrane signaling receptor activity | 0.000 | 49 |
| GO:0007186 | G-protein coupled receptor signaling pathway | 0.000 | 49 |
| GO:0038023 | signaling receptor activity | 0.001 | 51 |
| GO:0060089 | molecular transducer activity | 0.001 | 51 |
| GO:0004871 | signal transducer activity | 0.003 | 53 |
| downregulated in the hippocampus | |||
| GO:0007186 | G-protein coupled receptor signaling pathway | 0.000 | 87 |
| GO:0004888 | transmembrane signaling receptor activity | 0.000 | 85 |
| GO:0038023 | signaling receptor activity | 0.000 | 89 |
| GO:0060089 | molecular transducer activity | 0.000 | 89 |
| GO:0004930 | G-protein coupled receptor activity | 0.000 | 68 |
| GO:0004871| | signal transducer activity | 0.000 | 92 |
| GO:0007600 | sensory perception | 0.003 | 67 |
| GO:0050906 | detection of stimulus involved in sensory perception | 0.007 | 54 |
| GO:0050907 | detection of chemical stimulus involved in sensory perception | 0.008 | 52 |
| GO:0051606 | detection of stimulus | 0.009 | 56 |
| GO:0007606 | sensory perception of chemical stimulus | 0.011 | 55 |
| GO:0009593 | detection of chemical stimulus | 0.011 | 52 |
| GO:0003008 | system process | 0.011 | 86 |
| GO:0004984 | olfactory receptor activity | 0.014 | 49 |
| GO:0050911 | detection of chemical stimulus involved in sensory perception of smell | 0.014 | 49 |
| GO:0007608 | sensory perception of smell | 0.031 | 49 |
| GO:0050877 | nervous system process | 0.071 | 71 |
| Go Accession | GO Term | Corr p | No. Genes |
|---|---|---|---|
| downregulated in the amygdala | |||
| GO:0044425 | membrane part | 0.000 | 1150 |
| GO:0032501| | multicellular organismal process | 0.000 | 1107 |
| GO:0031224 | intrinsic component of membrane | 0.000 | 1098 |
| GO:0016021 | integral component of membrane | 0.000 | 1090 |
| GO:0007154 | cell communication | 0.000 | 941 |
| GO:0023052 | signaling | 0.000 | 930 |
| GO:0007165 | signal transduction | 0.000 | 909 |
| GO:0042221 | response to chemical | 0.000 | 895 |
| GO:0071944 | cell periphery | 0.000 | 881 |
| GO:0005886 | plasma membrane | 0.000 | 874 |
| GO:0004871 | signal transducer activity | 0.000 | 773 |
| GO:0038023 | signaling receptor activity | 0.000 | 762 |
| GO:0060089 | molecular transducer activity | 0.000 | 762 |
| GO:0004888 | transmembrane signaling receptor activity | 0.000 | 749 |
| GO:0007186 | G-protein coupled receptor signaling pathway | 0.000 | 736 |
| GO:0003008 | system process | 0.000 | 720 |
| GO:0050877 | nervous system process | 0.000 | 683 |
| GO:0007600 | sensory perception | 0.000 | 667 |
| GO:0004930 | G-protein coupled receptor activity | 0.000 | 652 |
| GO:0007606 | sensory perception of chemical stimulus | 0.000 | 632 |
| GO:0051606 | detection of stimulus | 0.000 | 593 |
| GO:0050906 | detection of stimulus involved in sensory perception | 0.000 | 586 |
| GO:0009593 | detection of chemical stimulus | 0.000 | 578 |
| GO:0050907 | detection of chemical stimulus involved in sensory perception | 0.000 | 578 |
| GO:0007608 | sensory perception of smell | 0.000 | 565 |
| GO:0004984 | olfactory receptor activity | 0.000 | 556 |
| GO:0050911 | detection of chemical stimulus involved in sensory perception of smell | 0.000 | 556 |
| GO:0005549 | odorant binding | 0.000 | 164 |
| GO:0051716 | cellular response to stimulus | 0.000 | 1009 |
| GO:0050896 | response to stimulus | 0.000 | 1174 |
| GO:0016503 | pheromone receptor activity | 0.000 | 48 |
| GO:0019236 | response to pheromone | 0.000 | 47 |
| GO:0016020 | membrane | 0.000 | 1232 |
| GO:0050789 | regulation of biological process | 0.000 | 1346 |
| GO:0065007 | biological regulation | 0.000 | 1417 |
| GO:0050794 | regulation of cellular process | 0.000 | 1286 |
| GO:0033038 | bitter taste receptor activity | 0.000 | 19 |
| GO:0008527 | taste receptor activity | 0.000 | 20 |
| GO:0001580 | detection of chemical stimulus involved in sensory perception of bitter taste | 0.000 | 21 |
| GO:0050909 | sensory perception of taste | 0.000 | 27 |
| GO:0050912 | detection of chemical stimulus involved in sensory perception of taste | 0.000 | 22 |
| GO:0050913 | sensory perception of bitter taste | 0.000 | 21 |
| GO:0030414 | peptidase inhibitor activity | 0.000 | 47 |
| GO:0004866 | endopeptidase inhibitor activity | 0.000 | 44 |
| GO:0061135 | endopeptidase regulator activity | 0.001 | 44 |
| GO:0004252 | serine-type endopeptidase activity | 0.001 | 45 |
| GO:0008227 | G-protein coupled amine receptor activity | 0.003 | 22 |
| GO:0017171 | serine hydrolase activity | 0.003 | 49 |
| GO:0008236 | serine-type peptidase activity | 0.004 | 48 |
| GO:0061134 | peptidase regulator activity | 0.006 | 47 |
| GO:0004867 | serine-type endopeptidase inhibitor activity | 0.016 | 25 |
| GO:0019373 | epoxygenase P450 pathway | 0.030 | 10 |
| GO:0010466 | negative regulation of peptidase activity | 0.037 | 50 |
| downregulated in the frontal cortex | |||
| GO:0004930 | G-protein coupled receptor activity | 0.000 | 50 |
| GO:0007606 | sensory perception of chemical stimulus | 0.000 | 45 |
| GO:0009593 | detection of chemical stimulus | 0.000 | 43 |
| GO:0038023 | signaling receptor activity | 0.000 | 61 |
| GO:0060089 | molecular transducer activity | 0.000 | 61 |
| GO:0007600 | sensory perception | 0.000 | 51 |
| GO:0050907 | detection of chemical stimulus involved in sensory perception | 0.000 | 42 |
| GO:0007608 | sensory perception of smell | 0.000 | 41 |
| GO:0004984 | olfactory receptor activity | 0.000 | 40 |
| GO:0050911 | detection of chemical stimulus involved in sensory perception of smell | 0.000 | 40 |
| GO:0051606 | detection of stimulus | 0.000 | 44 |
| GO:0050906 | detection of stimulus involved in sensory perception | 0.000 | 42 |
| GO:0004888 | transmembrane signaling receptor activity | 0.000 | 56 |
| GO:0007186 | G-protein coupled receptor signaling pathway | 0.001 | 54 |
| GO:0003008 | system process | 0.001 | 63 |
| GO:0004871 | signal transducer activity | 0.002 | 62 |
| GO:0050877 | nervous system process | 0.002 | 54 |
| GO:0016021 | integral component of membrane | 0.006 | 112 |
| GO:0031224 | intrinsic component of membrane | 0.007 | 113 |
| upregulated in the hippocampus | |||
| GO:0004930 | G-protein coupled receptor activity | 0.000 | 118 |
| GO:0007606 | sensory perception of chemical stimulus | 0.000 | 108 |
| GO:0050907 | detection of chemical stimulus involved in sensory perception | 0.000 | 102 |
| GO:0009593 | detection of chemical stimulus | 0.000 | 103 |
| GO:0050906 | detection of stimulus involved in sensory perception | 0.000 | 104 |
| GO:0004984 | olfactory receptor activity | 0.000 | 98 |
| GO:0050911 | detection of chemical stimulus involved in sensory perception of smell | 0.000 | 98 |
| GO:0051606 | detection of stimulus | 0.000 | 105 |
| GO:0007608 | sensory perception of smell | 0.000 | 98 |
| GO:0004888 | transmembrane signaling receptor activity | 0.000 | 129 |
| GO:0038023 | signaling receptor activity | 0.000 | 135 |
| GO:0060089 | molecular transducer activity | 0.000 | 135 |
| GO:0007186 | G-protein coupled receptor signaling pathway | 0.000 | 127 |
| GO:0007600 | sensory perception | 0.000 | 115 |
| GO:0004871 | signal transducer activity | 0.000 | 136 |
| GO:0050877 | nervous system process | 0.000 | 119 |
| GO:0003008 | system process | 0.000 | 127 |
| GO:0016021 | integral component of membrane | 0.000 | 217 |
| GO:0031224 | intrinsic component of membrane | 0.000 | 219 |
| GO:0007165 | signal transduction | 0.000 | 173 |
| GO:0023052 | signaling | 0.000 | 178 |
| GO:0044425 | membrane part | 0.000 | 225 |
| GO:0007154 | cell communication | 0.000 | 179 |
| GO:0042221 | response to chemical | 0.000 | 167 |
| GO:0071944 | cell periphery | 0.000 | 174 |
| GO:0005886 | plasma membrane | 0.000 | 171 |
| GO:0032501 | multicellular organismal process | 0.000 | 214 |
| GO:0005549 | odorant binding | 0.000 | 25 |
| GO:0051716 | cellular response to stimulus | 0.000 | 193 |
Publisher’s Note: MDPI stays neutral with regard to jurisdictional claims in published maps and institutional affiliations. |
© 2021 by the authors. Licensee MDPI, Basel, Switzerland. This article is an open access article distributed under the terms and conditions of the Creative Commons Attribution (CC BY) license (http://creativecommons.org/licenses/by/4.0/).
Share and Cite
Szczepankiewicz, D.; Celichowski, P.; Kołodziejski, P.A.; Pruszyńska-Oszmałek, E.; Sassek, M.; Zakowicz, P.; Banach, E.; Langwiński, W.; Sakrajda, K.; Nowakowska, J.; et al. Transcriptome Changes in Three Brain Regions during Chronic Lithium Administration in the Rat Models of Mania and Depression. Int. J. Mol. Sci. 2021, 22, 1148. https://0-doi-org.brum.beds.ac.uk/10.3390/ijms22031148
Szczepankiewicz D, Celichowski P, Kołodziejski PA, Pruszyńska-Oszmałek E, Sassek M, Zakowicz P, Banach E, Langwiński W, Sakrajda K, Nowakowska J, et al. Transcriptome Changes in Three Brain Regions during Chronic Lithium Administration in the Rat Models of Mania and Depression. International Journal of Molecular Sciences. 2021; 22(3):1148. https://0-doi-org.brum.beds.ac.uk/10.3390/ijms22031148
Chicago/Turabian StyleSzczepankiewicz, Dawid, Piotr Celichowski, Paweł A. Kołodziejski, Ewa Pruszyńska-Oszmałek, Maciej Sassek, Przemysław Zakowicz, Ewa Banach, Wojciech Langwiński, Kosma Sakrajda, Joanna Nowakowska, and et al. 2021. "Transcriptome Changes in Three Brain Regions during Chronic Lithium Administration in the Rat Models of Mania and Depression" International Journal of Molecular Sciences 22, no. 3: 1148. https://0-doi-org.brum.beds.ac.uk/10.3390/ijms22031148