Article

The Role of the FOXO1/β2-AR/p-NF-κB p65 Pathway in the Development of Endometrial Stromal Cells in Pregnant Mice under Restraint Stress

1
Laboratory of Neurobiology, College of Veterinary Medicine, China Agricultural University, Beijing 100193, China
2
Key Laboratory of Precision Nutrition and Food Quality, Ministry of Education, China Agricultural University, Beijing 100193, China
*
Author to whom correspondence should be addressed.
Int. J. Mol. Sci. 2021, 22(3), 1478; https://0-doi-org.brum.beds.ac.uk/10.3390/ijms22031478
Submission received: 8 December 2020 / Revised: 23 January 2021 / Accepted: 28 January 2021 / Published: 2 February 2021
(This article belongs to the Special Issue Molecular Morphology and Function of Stromal Cells)

Abstract

:
Restraint stress causes various maternal diseases during pregnancy. β2-Adrenergic receptor (β2-AR) and Forkhead transcription factor class O 1 (FOXO1) are critical factors not only in stress, but also in reproduction. However, the role of FOXO1 in restraint stress, causing changes in the β2-AR pathway in pregnant mice, has been unclear. The aim of this research was to investigate the β2-AR pathway of restraint stress and its impact on the oxidative stress of the maternal uterus. In the study, maternal mice were treated with restraint stress by being restrained in a transparent and ventilated device before sacrifice on Pregnancy Day 5 (P5), Pregnancy Day 10 (P10), Pregnancy Day 15 (P15), and Pregnancy Day 20 (P20) as well as on Non-Pregnancy Day 5 (NP5). Restraint stress augmented blood corticosterone (CORT), norepinephrine (NE), and blood glucose levels, while oestradiol (E2) levels decreased. Moreover, restraint stress increased the mRNA levels of the FOXO family, β2-AR, and even the protein levels of FOXO1 and β2-AR in the uterus and ovaries. Furthermore, restraint stress increased uterine oxidative stress level. In vitro, the protein levels of FOXO1 were also obviously increased when β2-AR was activated in endometrial stromal cells (ESCs). In addition, phosphorylated-nuclear factor kappa-B p65 (p-NF-κB p65) and its target genes decreased significantly when FOXO1 was inhibited. Overall, it can be said that the β2-AR/FOXO1/p-NF-κB p65 pathway was activated when pregnant mice were under restraint stress. This study provides a scientific basis for the origin of psychological stress in pregnant women.

1. Introduction

Some researchers have found that psychological stress has a negative effect on pregnancy development, mainly in the study of future generations, including delayed foetal maturation [1], loss of foetal immune function [2], and offspring neuropsychiatric risk [3]. Most scholars have used the model of restraint stress to simulate psychological stress [4]. In the uterus, Liu et al. found that the balance of oxidative and antioxidative stress and the balance of apoptosis and proliferation in the uterus were altered under restraint stress [5,6]. The mechanism of this dysregulation might be due to the involvement of the nervous and endocrine systems. Gonadotropin-releasing hormone (GnRH) is inhibited by corticotropin-releasing hormone (CRH), and CRH-induced proopiomelanocortin peptides suppress ovarian oestradiol and progesterone as well as pituitary luteinizing hormone (LH) secretion [7].
Exogenous stress activates sympathetic nerve endings to release catecholamine-type transmitters, including norepinephrine (NE), which acts by binding to adrenergic receptors located on target organs. Both NE and corticosterone (CORT) are marker of stress, and they increase during stress response [8]. It has been reported that β2-AR existed in the uterus of mice four days after pregnancy. Meanwhile, the β2-AR signalling pathway is activated after restraint stress, resulting in an asymmetric distribution of intrauterine embryos [9]. During early pregnancy and placenta formation, local reactive oxygen species (ROS) levels in the uterus are high in order to induce oxidative stress, while the content of the antioxidant substance Total Superoxide Dismutase (T-SOD) increases, maintaining the local oxidative–antioxidant balance of the uterus [10]. However, excessive oxidative stress is considered to be responsible for the initiation or development of pathological processes affecting female reproductive activities [11,12,13], such as embryonic resorption, recurrent pregnancy loss, intrauterine growth restriction (IUGR), preeclampsia, and foetal death [13,14]. It was reported that oxidative stress may affect the pregnancy process by inducing the signalling pathway of NF-κB [15]. As is known, NF-κB can promote inflammation [16]. Meanwhile, changes in NF-κB caused by oxidative stress may also suggest an inflammatory response in the uterus [5]. However, the relationship between NF-κB and β2-AR is unclear. Therefore, whether NF-κB is involved in the β2-AR signal pathway remains to be studied.
The Forkhead transcription factor class O (FOXO) gene encodes a series of transcription factors that regulate oxidative stress, DNA repair, and apoptosis in cells in order to maintain homeostasis [17,18,19]. In addition, the important role of FOXO in the reproductive process is mainly in its ability to regulate decidualization, under the influence of progesterone content, and to regulate cell apoptosis and differentiation [20]. A study showed that the β2-AR agonist induced the expression of FOXO1 in mouse skeletal muscle [21]. In view of the role of FOXO in oxidative stress and decidualization, the role of FOXO in the activation of β2-AR should also be taken seriously.
In this study, a model of restraint stress was established to study various changes throughout pregnancy, including the detection of hormones in plasma, changes in the uterine antioxidant capacity, and the detection of membrane receptor and intracellular signalling molecules. Finally, the FOXO1-mediated β2-AR/NF-κB signalling pathway was examined by a cell assay. We focused on the effect of restraint stress in pregnant mothers throughout pregnancy and conducted preliminary studies of signalling pathways.

2. Results

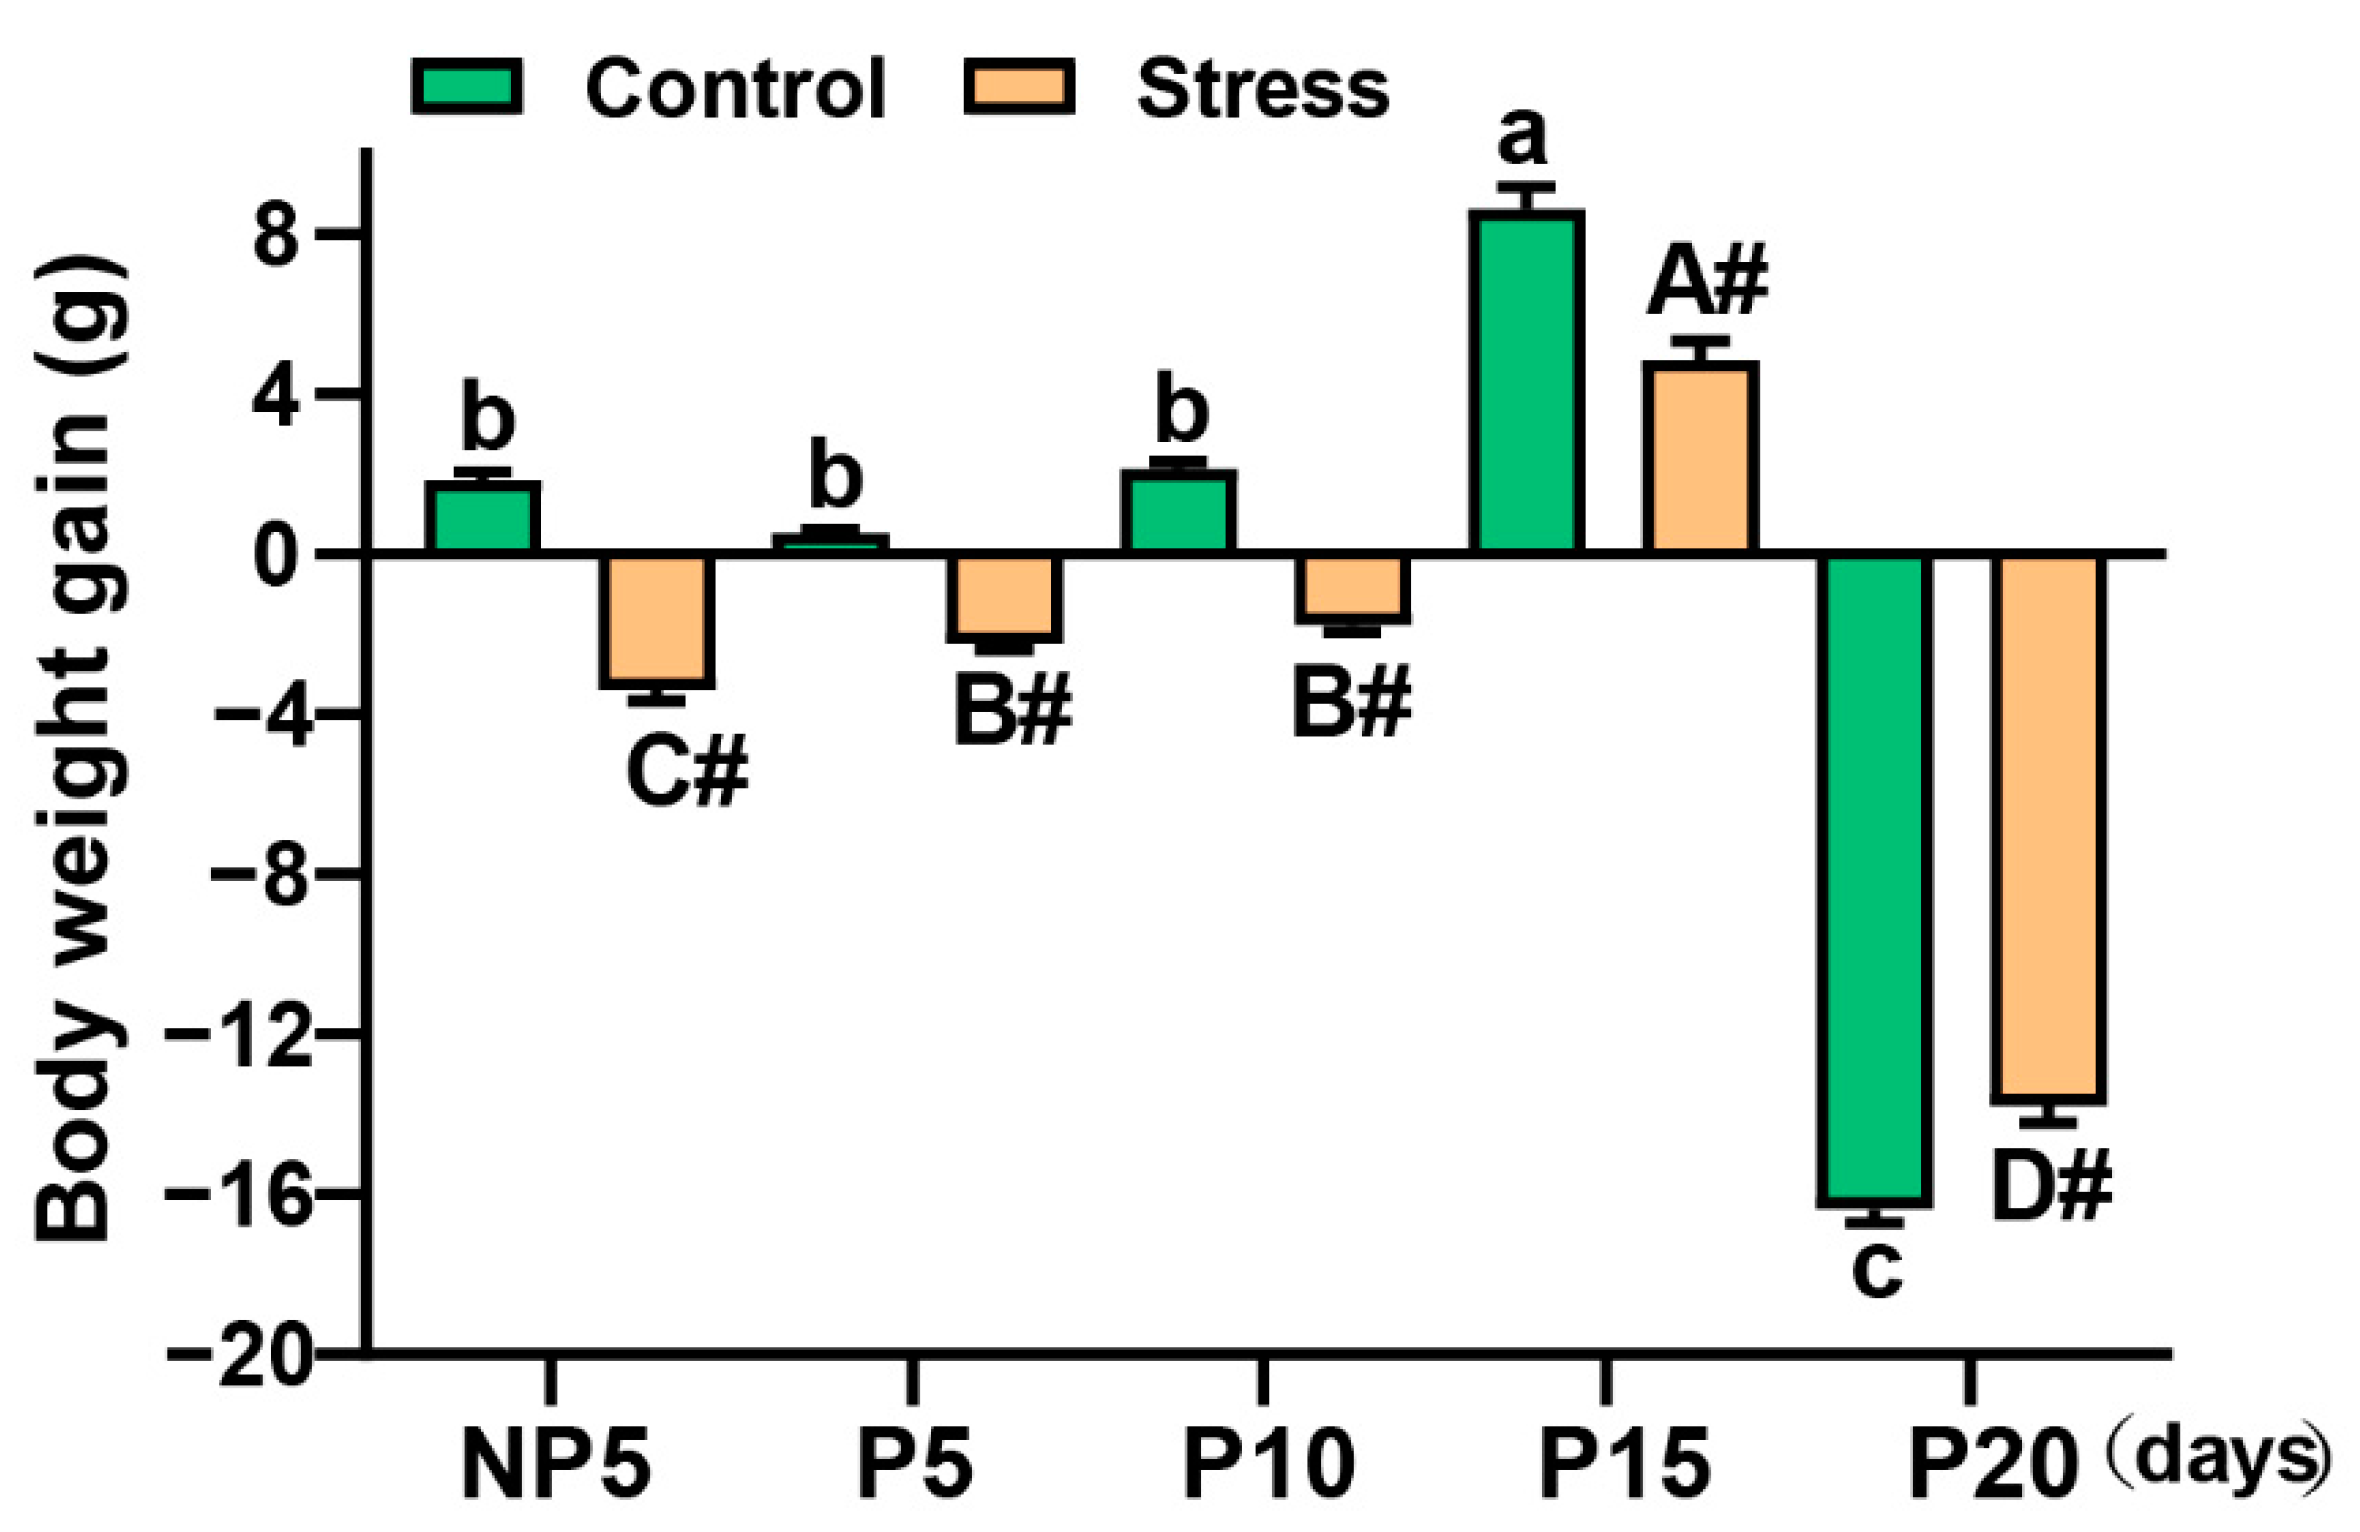
2.1. Effect of Restraint Stress on Body Weight in Pregnant Mice

Body weight was measured before (1st day) and after stress (5th day). The body weight gain (BWG) was calculated. SBWG = S5th-S1st (Stress group), CBWG = C5th-C1st (Control group). Body weight gains were affected by pregnancy age (p < 0.001) and restraint stress (p < 0.001). In this study, the body weight gain was reduced significantly after restraint stress in different ages compared with control groups (independent sample t test, NP5: 281.07%, p < 0.001; P5: 517.86%, p < 0.001; P10: 182.81%, p < 0.001; P15: 43.74%, p = 0.004) (Figure 1). However, on the 20th day, the mother delivered the pups, which led to the rapid decline of weight at P20. Besides, in our previous study, the number of foetuses were fewer under restraint stress than control mice [5]. So, the change of BWG in the stress group was fewer than in the control group (independent sample t test, P20: 15.60%, p = 0.006) (Figure 1) at P20 (for the specific value, see Table S1 of the Supplementary Material). Overall, restraint stress led to loss in body weight.

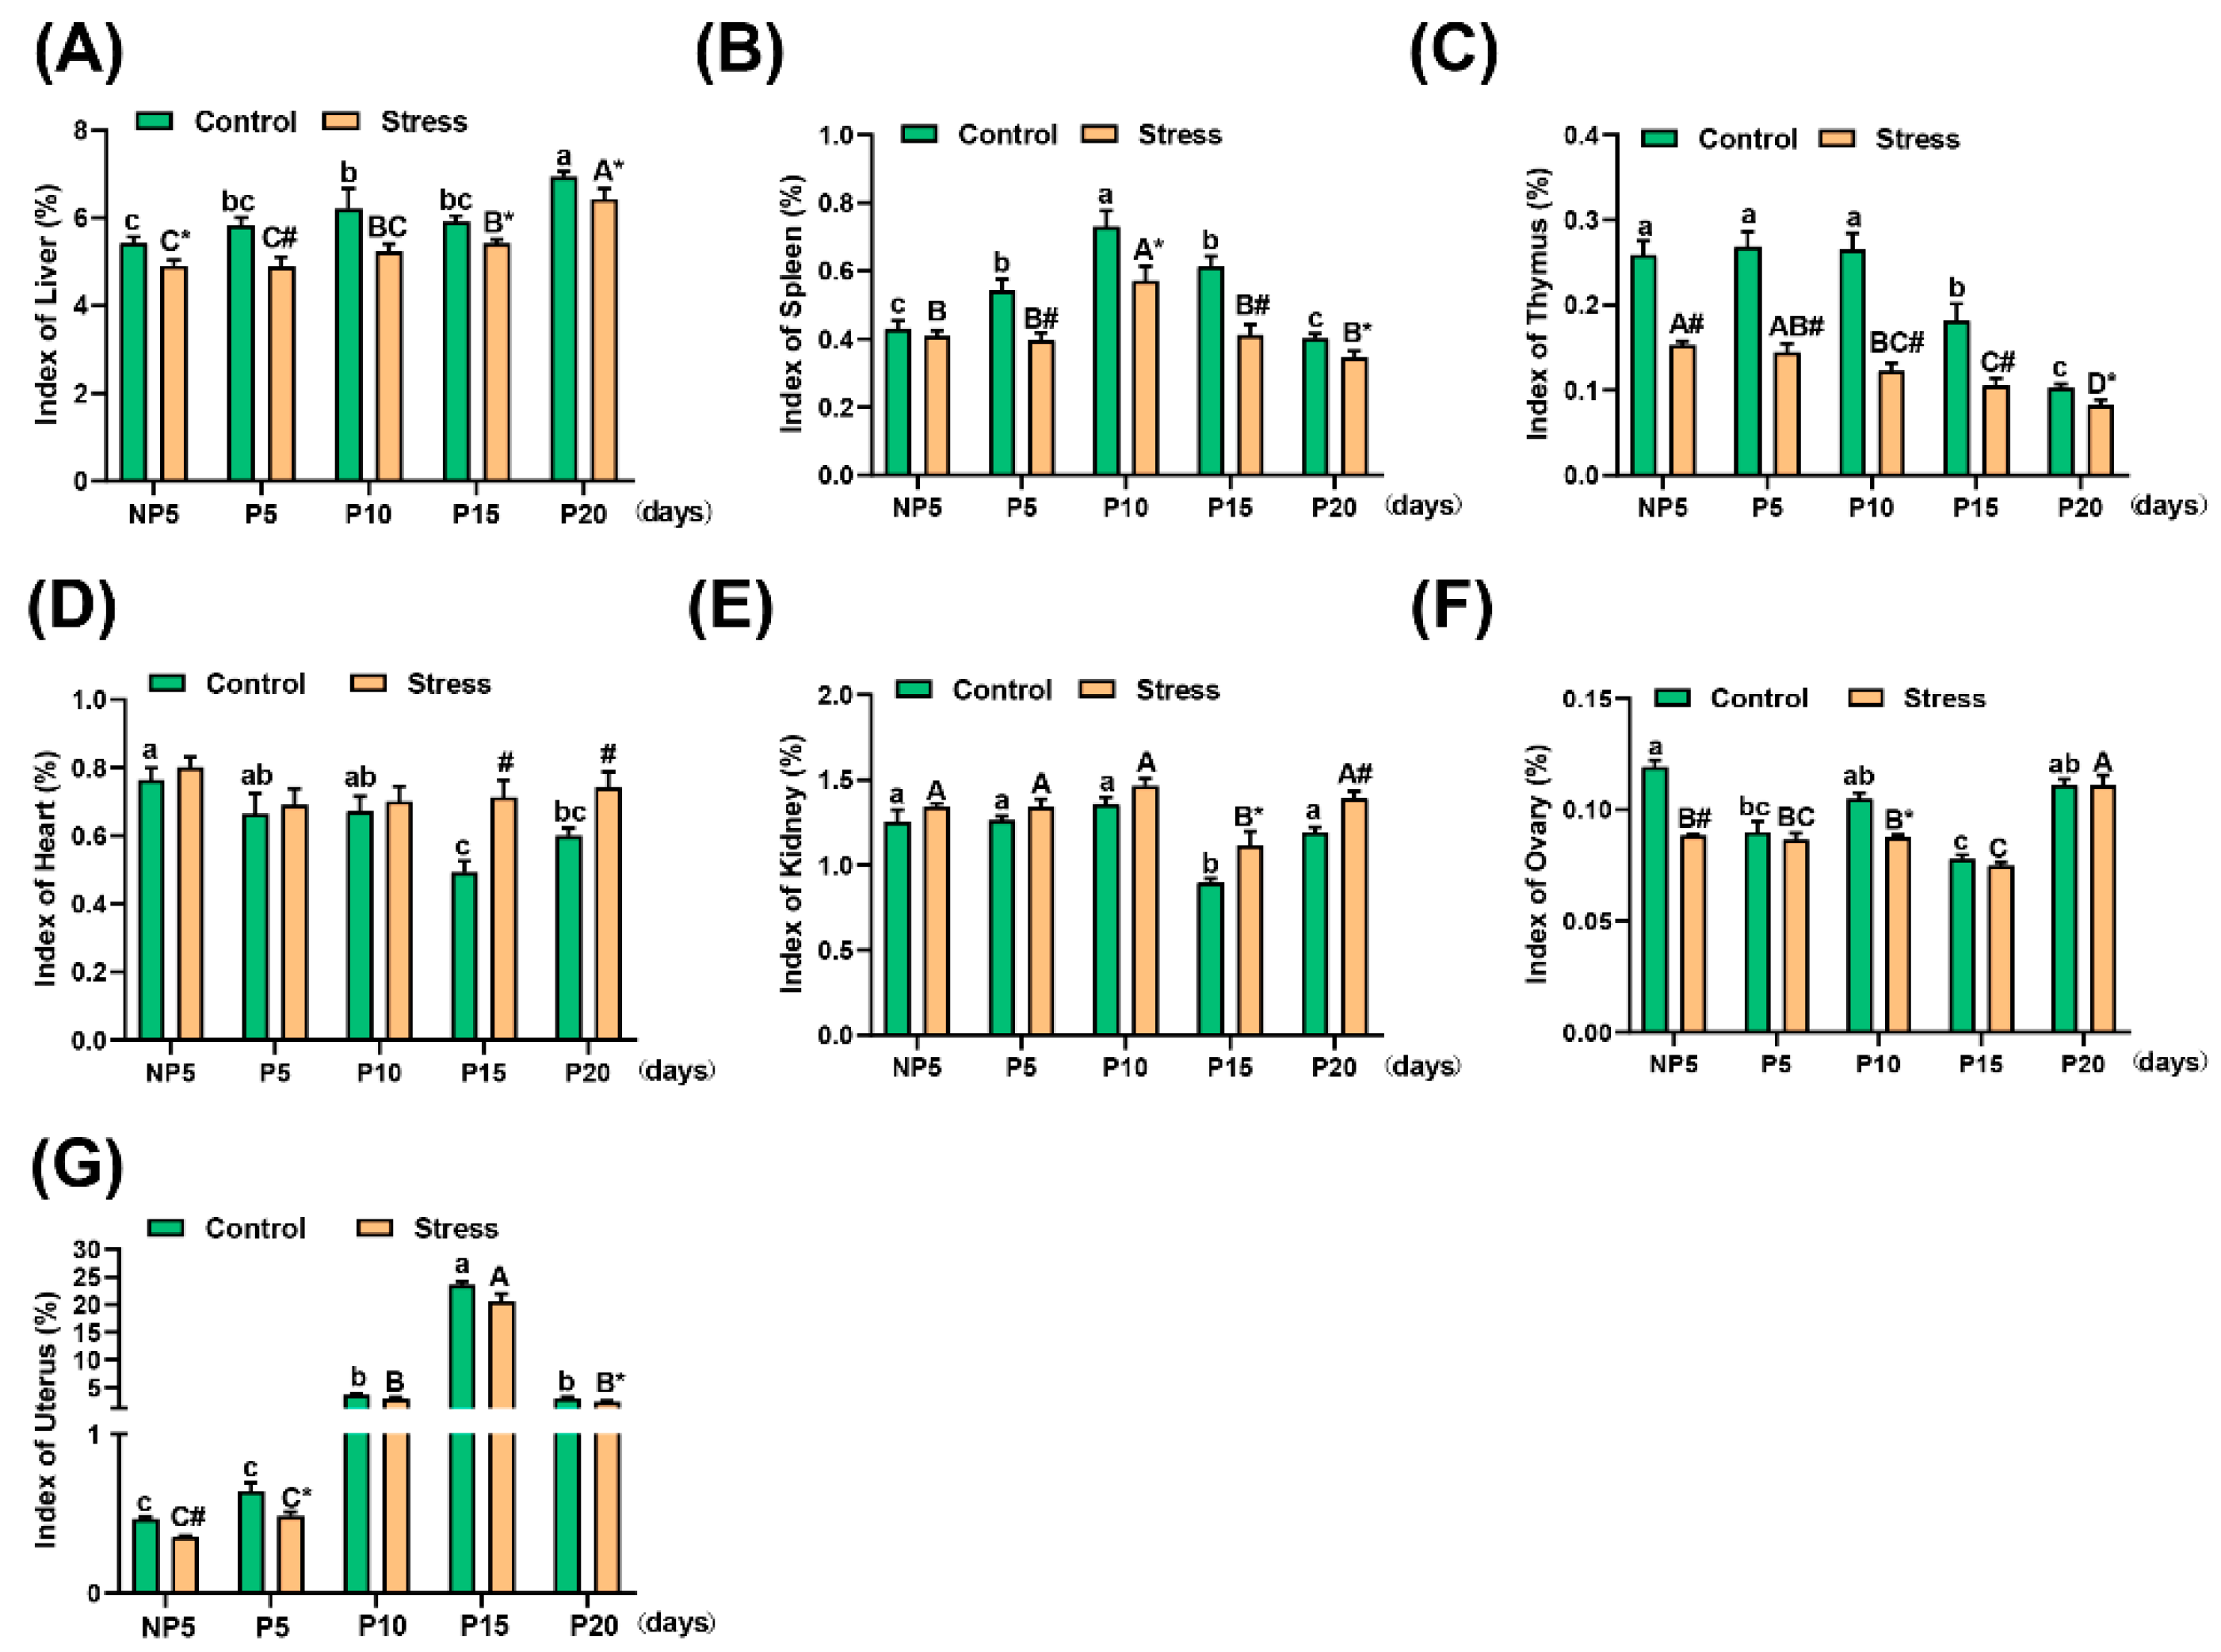
2.2. Effect of Restraint Stress on Organ Index in Pregnant Mice

In this study, there was no apparent pathological change in most organs, according to the pathologic anatomy (Figure S1). Thus, we measured the weights of the liver, spleen, thymus, heart, kidney, ovary, and uterus. The organ weight and body weight ratio represent the organ index. From Figure 2, the pregnancy age affected the change in all organ indexes (p <0.001) and the organ indexes were affected by restraint stress (Liver, p < 0.001; spleen, p < 0001; thymus, p < 0.001; heart, p < 0.001, kidney; p < 0.001; ovary, p = 0.005; uterus, p = 0.009). The indexes of the liver (independent sample t test, NP5: 9.62%, p = 0.013; P5: 16.10%, p = 0.008; P15: 8.41%, p = 0.010; P20: 7.35%, p = 0.048) (Figure 2A), spleen (independent sample t test, P5: 26.74%, p = 0.008; P10: 21.79%, p = 0.034; P15: 32.81%, p = 0.001; P20: 14.06%, p = 0.045) (Figure 2B), thymus (independent sample t test, NP5: 40.86%, p < 0.001; P5: 46.17%, p < 0.001; P10: 53.64%, p < 0.001; P15: 41.79%, p = 0.005; P20: 19.62%, p = 0.023) (Figure 2C), ovary (independent sample t test, NP5: 25.87%, p = 0.008; P10: 16.50%, p = 0.016), and uterus (independent sample t test, NP5: 24.10%, p < 0.001; P5: 24.51%, p = 0.016; P20: 20.67%, p = 0.047) decreased significantly in the stress group compared with the control group (Figure 2F,G). The indexes had the same tendency in the control and stress groups with changes in age (Figure 2A–C,F,G). However, the indexes of the heart (independent sample t test, P15: 44.75%, p = 0.003; P20: 23.76%, p = 0.008) and kidney (Independent sample t test, P15: 24.46%, p = 0.019; P20: 16.76%, p = 0.003) were obviously increased in stressed mice compared with control mice at different ages (Figure 2D,E) (for the specific value, see Table S2 of Supplementary Material). In summary, restraint stress may affect the index of organ.

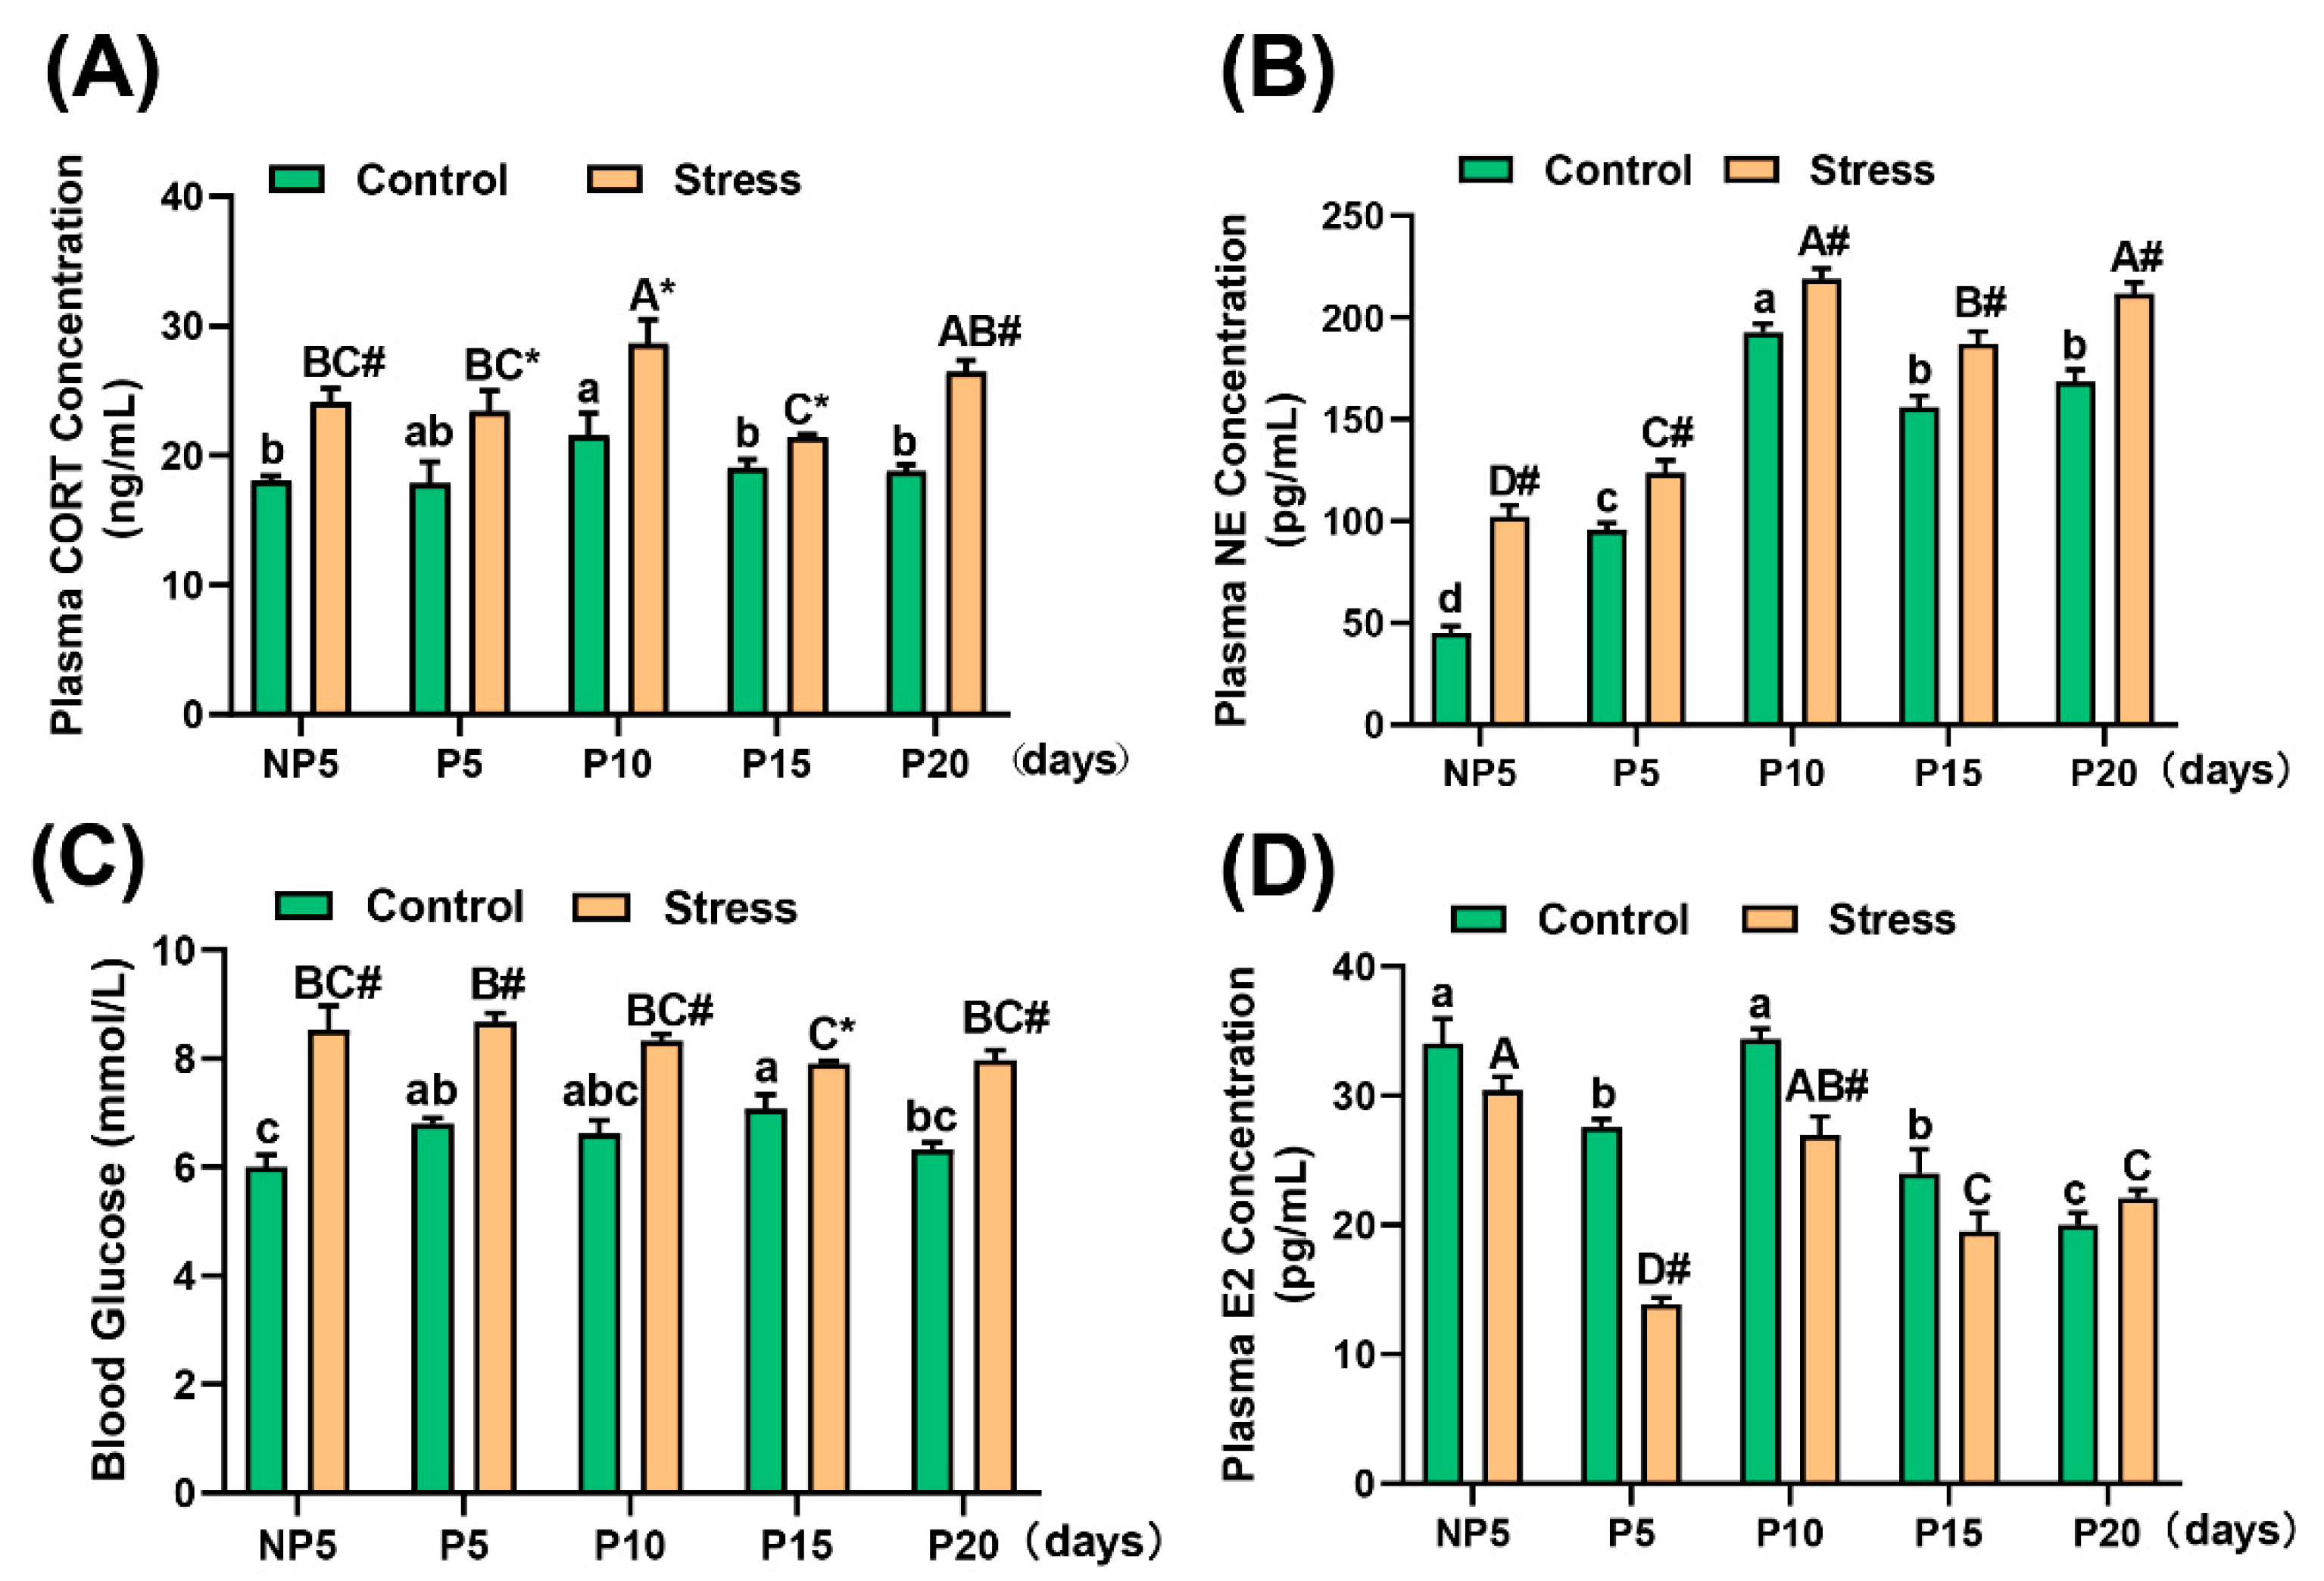
2.3. Effect of Restraint Stress on Plasma Hormone Levels in Pregnant Mice

As is known, stress activates the hypothalamic–pituitary–adrenal (HPA) axis and the sympathetic-adrenal medullary system (SAS), which induce the release of glucocorticoids from the adrenal cortex and the catecholamines epinephrine (EPI) and NE from the adrenal medulla and sympathetic nerve termini [22]. In our study, the concentration of stress hormones increased significantly, including the concentrations of CORT (independent sample t test, NP5: 6.048 ng/mL, 33.48%, p = 0.001, P5: 3.544 ng/mL, 17.82%, p = 0.044, P10: 7.118 ng/mL, 33.05%, p = 0.040; P15: 2.411 ng/mL 12.67%, p = 0.010; P20: 7.669 ng/mL, 40.82%, p < 0.001) (Figure 3A) and NE (independent sample t test, NP5: 56.754 pg/mL, 125.01%, p < 0.001; P5: 28.205 pg/mL, 29.49%, p < 0.001; P10: 26.251 pg/mL, 13.61%, p < 0.001; P15: 31.445 pg/mL, 20.18%, p < 0.001; P20: 43.289 pg/mL, 25.68%, p < 0.001) (Figure 3B). Additionally, gluconeogenesis is usually enhanced by glucocorticoids and then increases blood glucose levels [23]. Compared with control mice, in stress mice, the blood glucose level increased significantly in each age group (independent sample t test, NP5: 2.533 mmol/L, 42.22%, p = 0.007; P5: 1.875 mmol/L, 27.57%, p < 0.001; P10: 1.700 mmol/L, 25.63%, p = 0.003; P15: 0.825 mmol/L, 11.66%, p = 0.047; P20: 1.633 mmol/L, 25.79%, p = 0.002) (Figure 3C). As is well known, E2 is a marker of female reproduction. The concentration of E2 was detected by radioimmunoassay, and there was a significant decrease at P5 (independent sample t test, 13.704 pg/mL, 49.66%, p < 0.001) and P10 (independent sample t test, 7.440 pg/mL, 21.63%, p = 0.004) in stress mice compared with control mice (Figure 3D) (for the specific value, see Table S3 of Supplementary Material). A two-way analysis of variance showed that the age of pregnancy affected the change in these index levels (p < 0.001), except for the blood glucose (p = 0.085), and all of them were influenced by restraint stress (p < 0.001). This result showed that restraint stress increased stress levels and inhibited E2 levels.

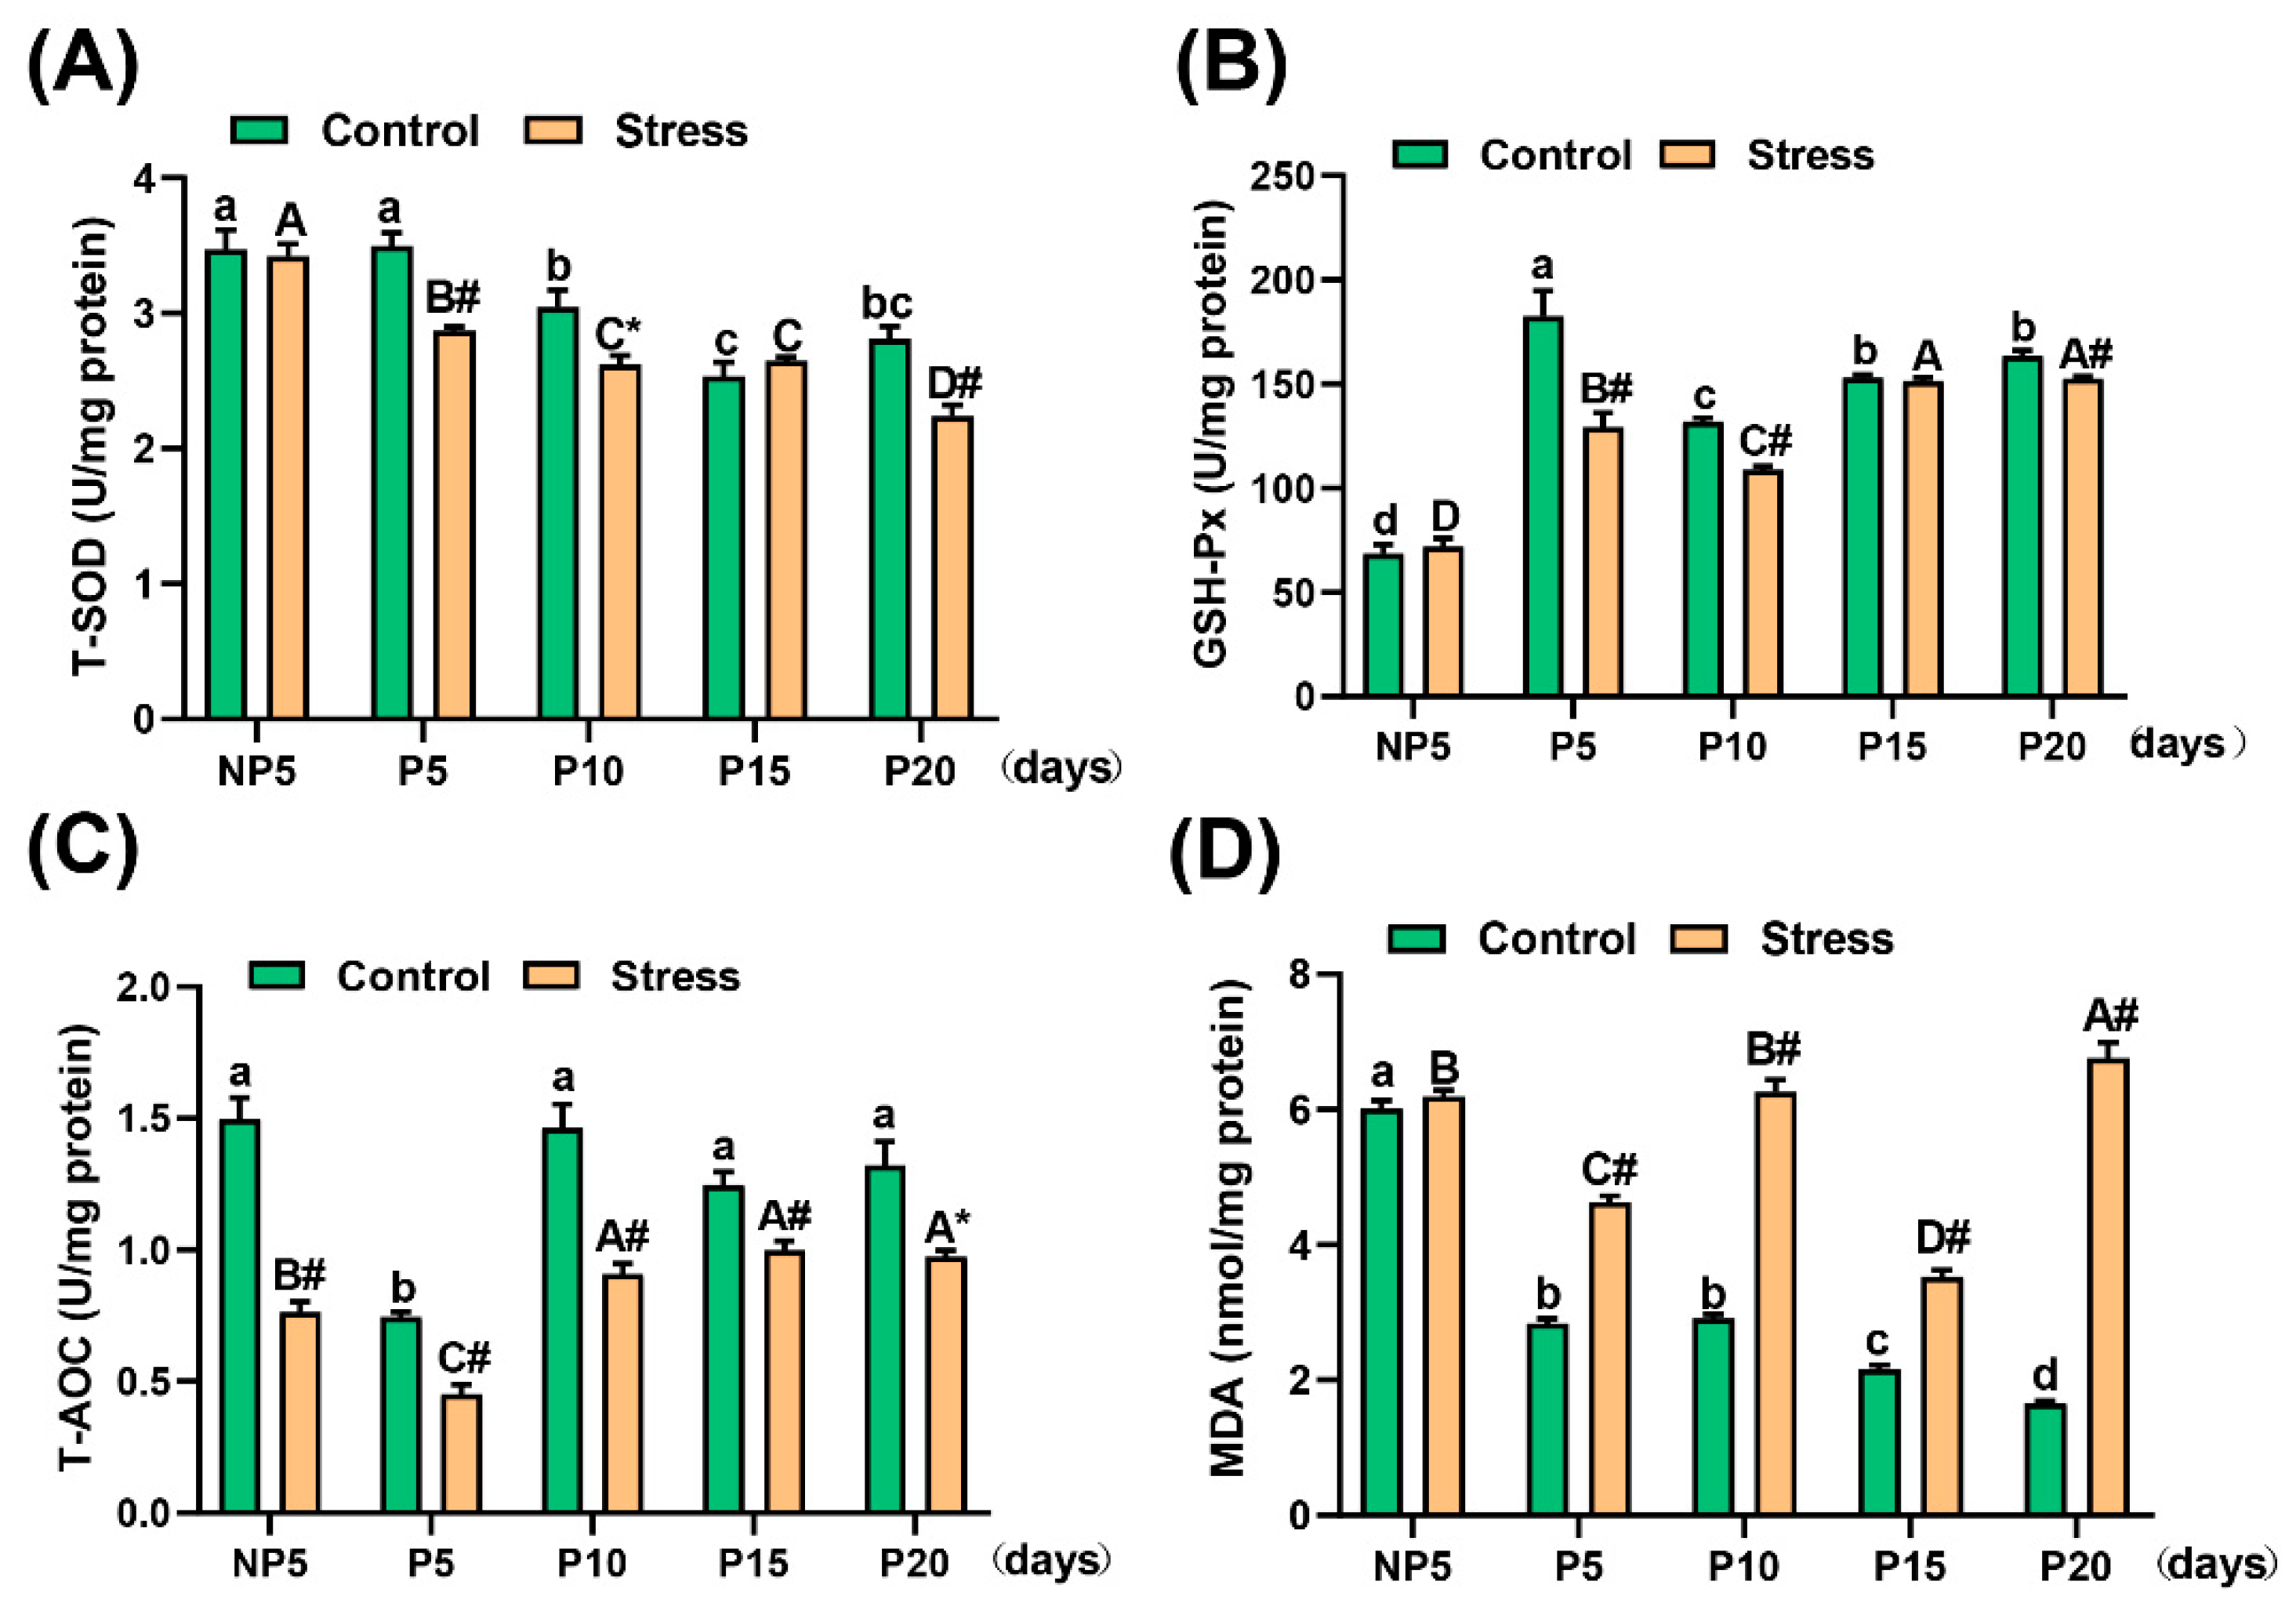
2.4. Effect of Restraint Stress on Antioxidative Ability in the Uterus of Pregnant Mice

Antioxidant enzymes and oxidative products represent the antioxidative ability and oxidant level of mice, respectively. The related anti-oxidases were tested, including Glutathione peroxidase (GSH-Px), T-SOD, and Total Antioxidant Capacity (T-AOC). The concentrations of T-SOD and GSH-Px in the stress group compared with the control group were significantly decreased at P5 (independent sample t test, T-SOD, 0.626 U/mg, 17.89%, p < 0.001; GSH-Px, 53.409 U/mg, 29.23%, p = 0.001), P10 (independent sample t test, T-SOD, 0.427 U/mg, 14.02%, p = 0.011; GSH-Px, 23.180 U/mg, 17.57%, p < 0.001), and P20 (independent sample t test, T-SOD, 0.576 U/mg, 20.49%, p < 0.001; GSH-Px, 10.956 U/mg, 6.70%, p < 0.001) (Figure 4A,B). The activity of T-AOC decreased significantly in the stress group compared with the control group at every age (independent sample t test, NP5: 0.735 U/mg, 49.10%, p < 0.001; P5: 0.294 U/mg, 39.52%, p < 0.001; P10: 0.556 U/mg, 37.98%, p < 0.001; P15: 0.247 U/mg, 19.84%, p = 0.001; P20: 0.347 U/mg, 26.27%, p = 0.012) (Figure 4C). Furthermore, the levels of Malondialdehyde (MDA) increased in each age group except NP5. Additionally, the degree of elevation was significant (independent sample t test, P5: 1.798 nmol/mg, 63.43%, p < 0.001; P10: 3.348 nmol/mg, 114.97%, p < 0.001; P15: 1.363 nmol/mg, 63.12%, p < 0.001; P20: 5.101 nmol/mg, 307.84%, p < 0.001) (Figure 4D) (for the specific value, see Table S4 of Supplementary Material). A two-way analysis of variance found that both pregnancy age (p < 0.001) and restraint stress (p < 0.001) affected the change in anti-oxidation ability. Overall, the antioxidative ability of the uterus decreased under restraint stress.

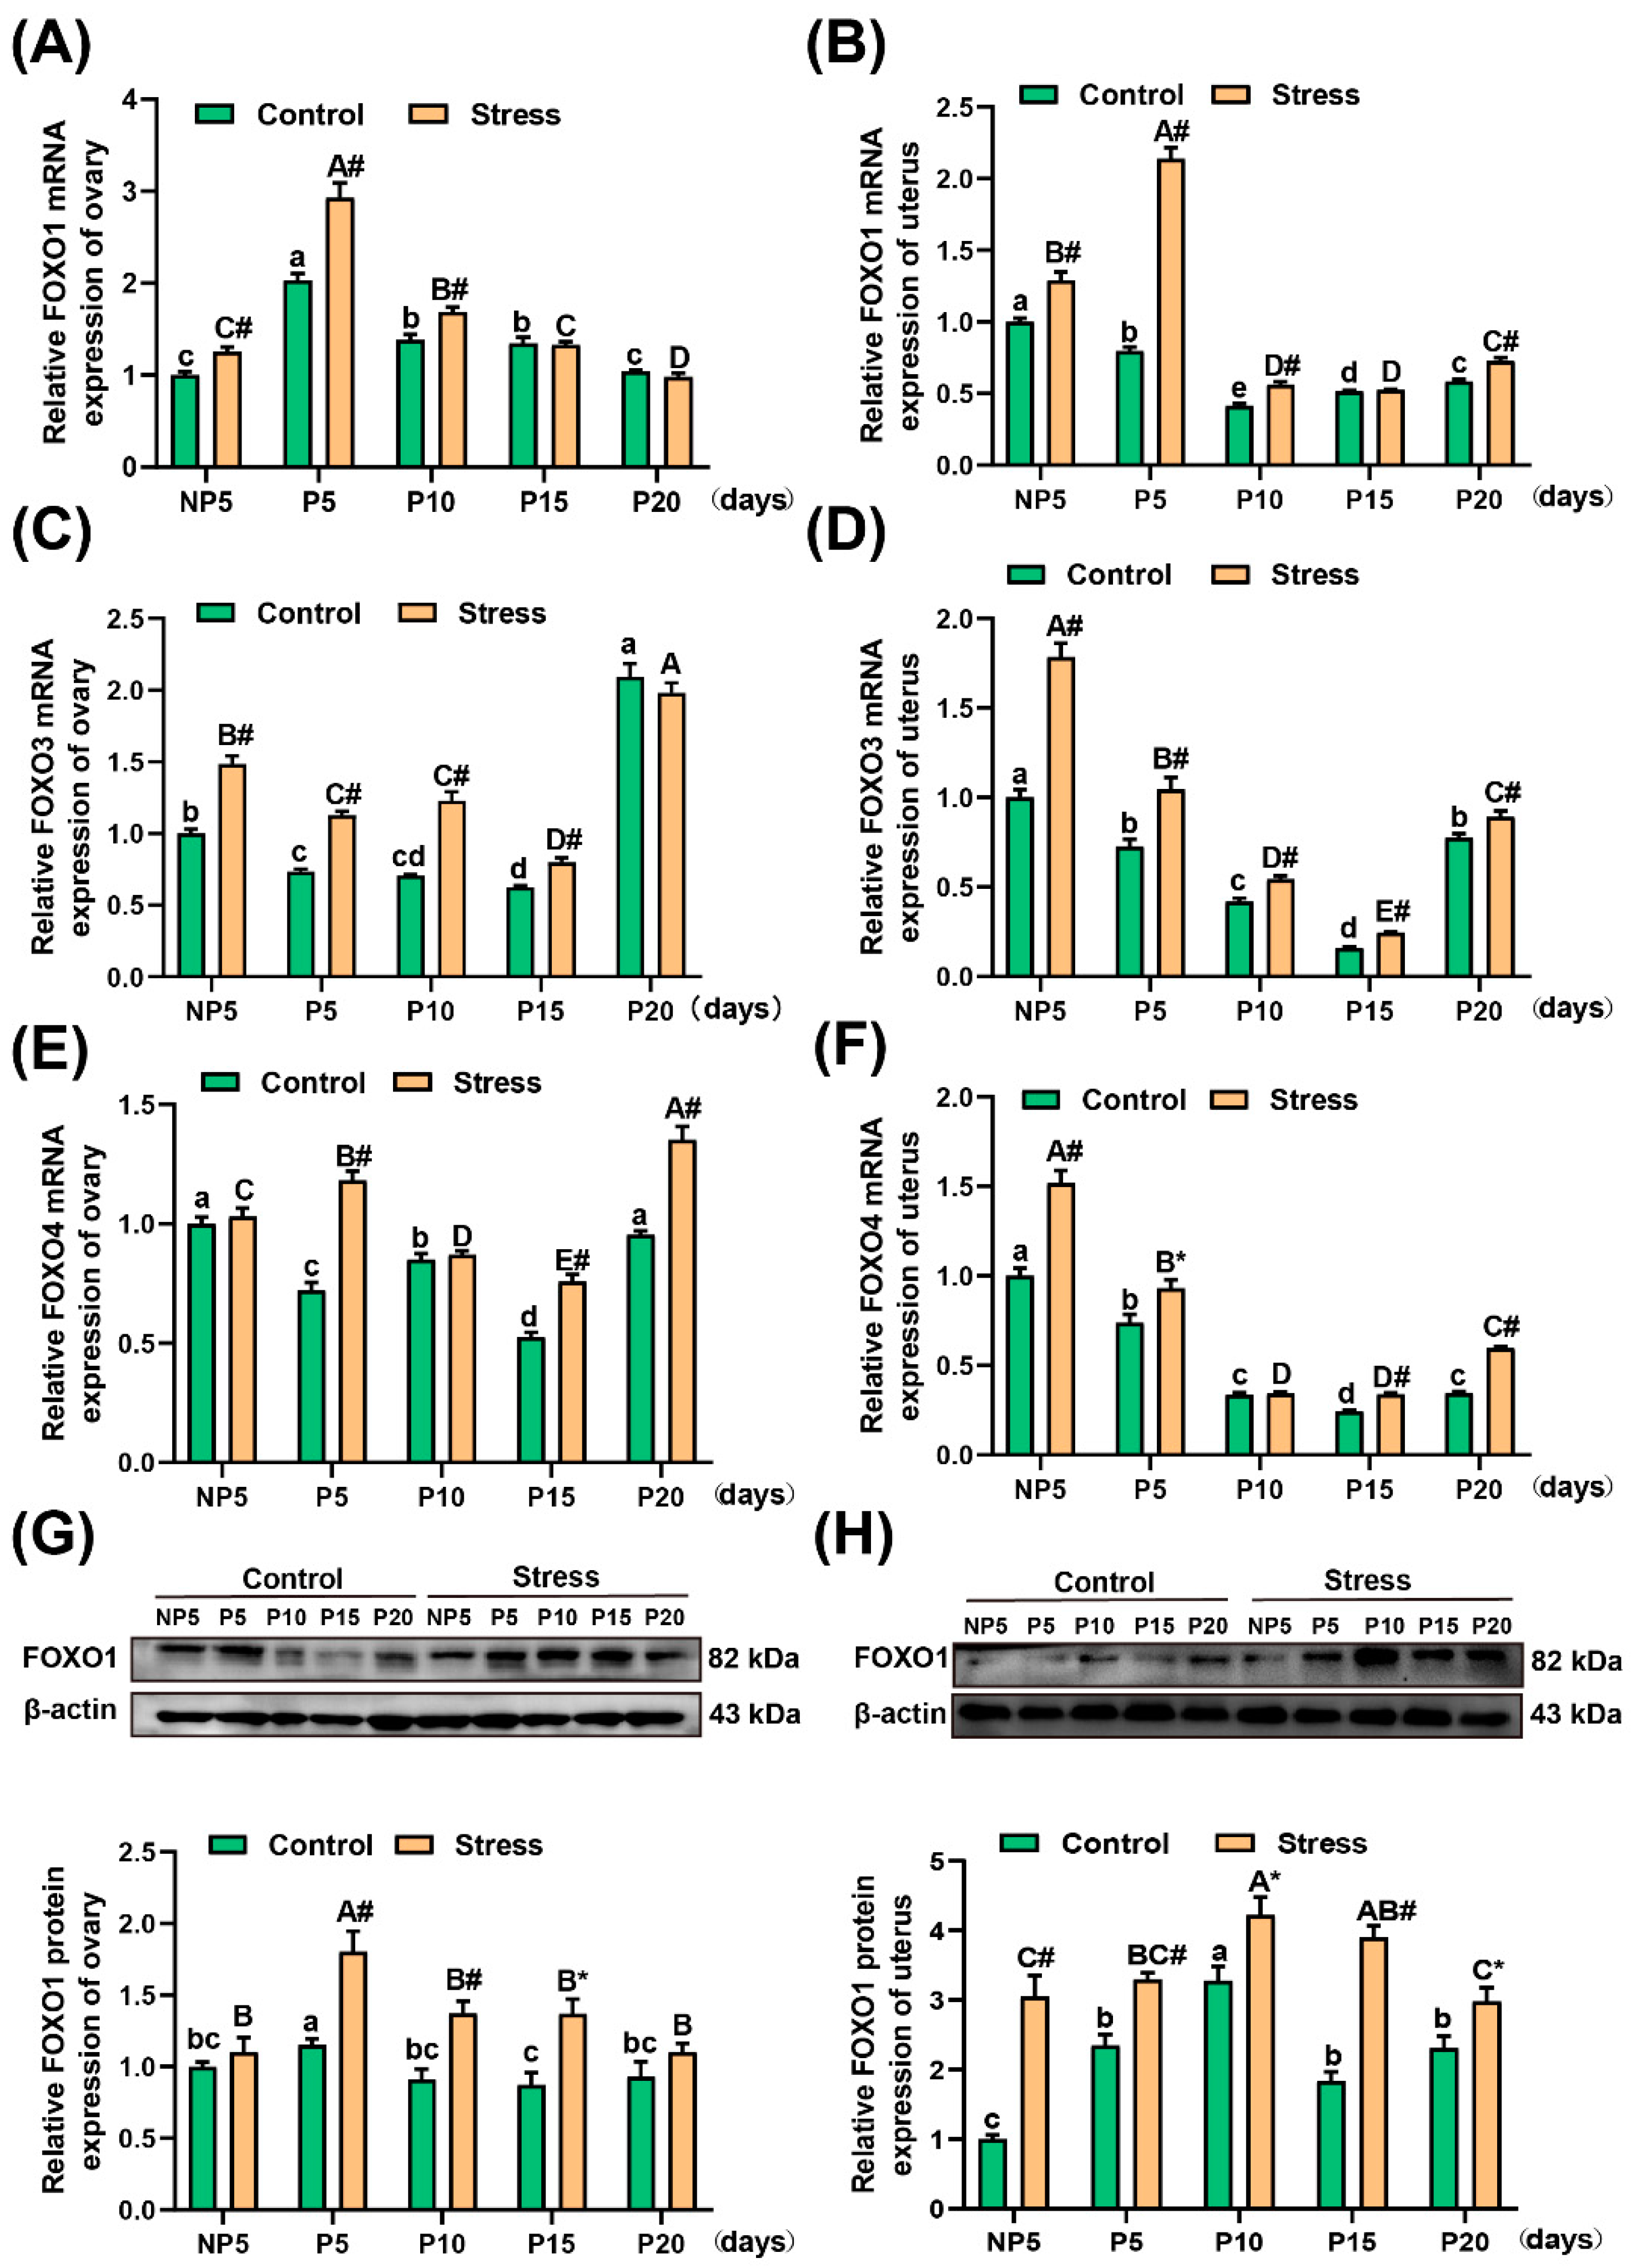
2.5. Effect of Restraint Stress on FOXO1, FOXO3, and FOXO4 mRNA Levels and FOXO1 Protein in the Uterus and Ovary of Pregnant Mice

The FOXO family plays an important role in oxidative stress and reproduction. In this study, FOXO family members were studied via real-time fluorescence quantitative PCR (qRT-PCR) and Western blotting. As shown in Figure 5, in the stress group, the mRNA levels of FOXO1 in the ovary increased significantly at NP5 (independent sample t test, 25.38%, p < 0.001), P5 (independent sample t test, 44.29%, p < 0.001), and P10 (independent sample t test, 22.11%, p < 0.001) (Figure 5A). In the uterus, the mRNA levels of FOXO1 increased significantly at NP5 (independent sample t test, 29.01%, p < 0.001), P5 (independent sample t test, 168.07%, p < 0.001), P10 (independent sample t test, 36.04%, p < 0.001), and P20 (independent sample t test, 24.45%, p < 0.001) (Figure 5B). Furthermore, the mRNA levels of FOXO3 increased significantly at NP5 (independent sample t test, 48.53%, p < 0.001), P5 (independent sample t test, 53.89%, p < 0.001), P10 (independent sample t test, 73.64%, p < 0.001), and P15 (independent sample t test, 27.99%, p < 0.001) in the ovary (Figure 5C). These levels also increased significantly at NP5 (independent sample t test, 78.34%, p < 0.001), P5 (independent sample t test, 43.81%, p = 0.001), P10 (independent sample t test, 30.08%, p < 0.001), P15 (independent sample t test, 53.52%, p < 0.001), and P20 (independent sample t test, 15.07%, p = 0.006) in the uterus (Figure 5D) (for the specific value, see Table S5 of Supplementary Material).
Additionally, the changes seemed to be the same for FOXO4 by FOXO1 and FOXO3. The mRNA levels of FOXO4 in the ovary increased in each age group, especially at P5 (independent sample t test, 63.67%, p < 0.001), P15 (independent sample t test, 44.14%, p < 0.001), and P20 (independent sample t test, 41.77%, p < 0.001) (Figure 5E). Similarly, the mRNA levels of FOXO4 in the uterus increased significantly at NP5 (independent sample t test, 51.74%, p < 0.001), P5 (independent sample t test, 25.98%, p = 0.016), P15 (independent sample t test, 38.42%, p < 0.001), and P20 (independent sample t test, 73.09%, p < 0.001) (Figure 5F) (for the specific value, see Table S5 of Supplementary Material). A two-way analysis of variance showed that both pregnancy age (p < 0.001) and restraint stress (p < 0.001) affected the change in mRNA levels of FOXO1, FOXO3 and FOXO4.
From the Table S5, the mRNA expression of FOXO1 were higher than FOXO3 and FOXO4. Meanwhile, FOXO1 is more involved in the stress and reproduction than FOXO3 and FOXO4. Thus, FOXO1 protein expression was detected in the ovary and uterus. A two-way analysis of variance showed that both pregnancy age (p < 0.001) and restraint stress (p < 0.001) affected the change in protein levels of FOXO1. The protein expression of FOXO1 was obviously increased at P5 (independent sample t test, 56.57%, p = 0.005), P10 (independent sample t test, 50.66%, p = 0.001) and P15 (independent sample t test, 57.18%, p = 0.010) in the ovary (Figure 5G). Furthermore, in the uterus, the protein expression of FOXO1increased significantly at NP5 (independent sample t test, 204.72%, p = 0.003), P5 (independent sample t test, 40.50%, p < 0.001), P10 (independent sample t test, 28.75%, p = 0.011), P15 (independent sample t test, 112.56%, p < 0.001), and P20 (independent sample t test, 28.87%, p = 0.035) (Figure 5H) (for the specific value, see Table S5 of Supplementary Material). Overall, the levels of FOXO1, FOXO3, and FOXO4 increased in the stress group.

2.6. Effect of Restraint Stress on β2-AR Levels in the Uterus and Ovary of Pregnant Mice

In this study, a two-way analysis of variance showed that the age of pregnancy (p < 0.001) and restraint stress (p < 0.001) affected the change in mRNA and protein levels of β2-AR. The mRNA levels of β2-AR increased significantly at NP5 (independent sample t test, 58.43%, p < 0.001), P5 (independent sample t test, 105.72%, p < 0.001), P10 (independent sample t test, 71.90%, p < 0.001), and P20 (independent sample t test, 159.03%, p < 0.001) in the ovary (Figure 6A); in the uterus, the mRNA levels of β2-AR increased significantly at NP5 (independent sample t test, 18.84%, p = 0.002), P5 (independent sample t test, 79.62%, p < 0.001), P15 (independent sample t test, 21.68%, p = 0.011), and P20 (independent sample t test, 50.92%, p < 0.001) (Figure 6B). Additionally, the protein expression of β2-AR was detected in this study. As shown in Figure 6, the protein expression of β2-AR in the ovary was obviously increased in each age group (independent sample t test, NP5: 71.97%, p = 0.002; P5: 28.93%, p = 0.006; P15: 272.57%, p < 0.001) (Figure 6C). In the uterus, the protein levels of β2-AR increased significantly at NP5 (independent sample t test, 61.87%, p = 0.007), P5 (independent sample t test, 114.72%, p = 0.005), and P20 (independent sample t test, 32.31%, p = 0.031) (Figure 6D) (for the specific value, see Table S6 of Supplementary Material). The stimulation of restraint stress caused a significant increase in the protein expression of β2-AR. Overall, the expression of β2-AR increased under restraint stress.

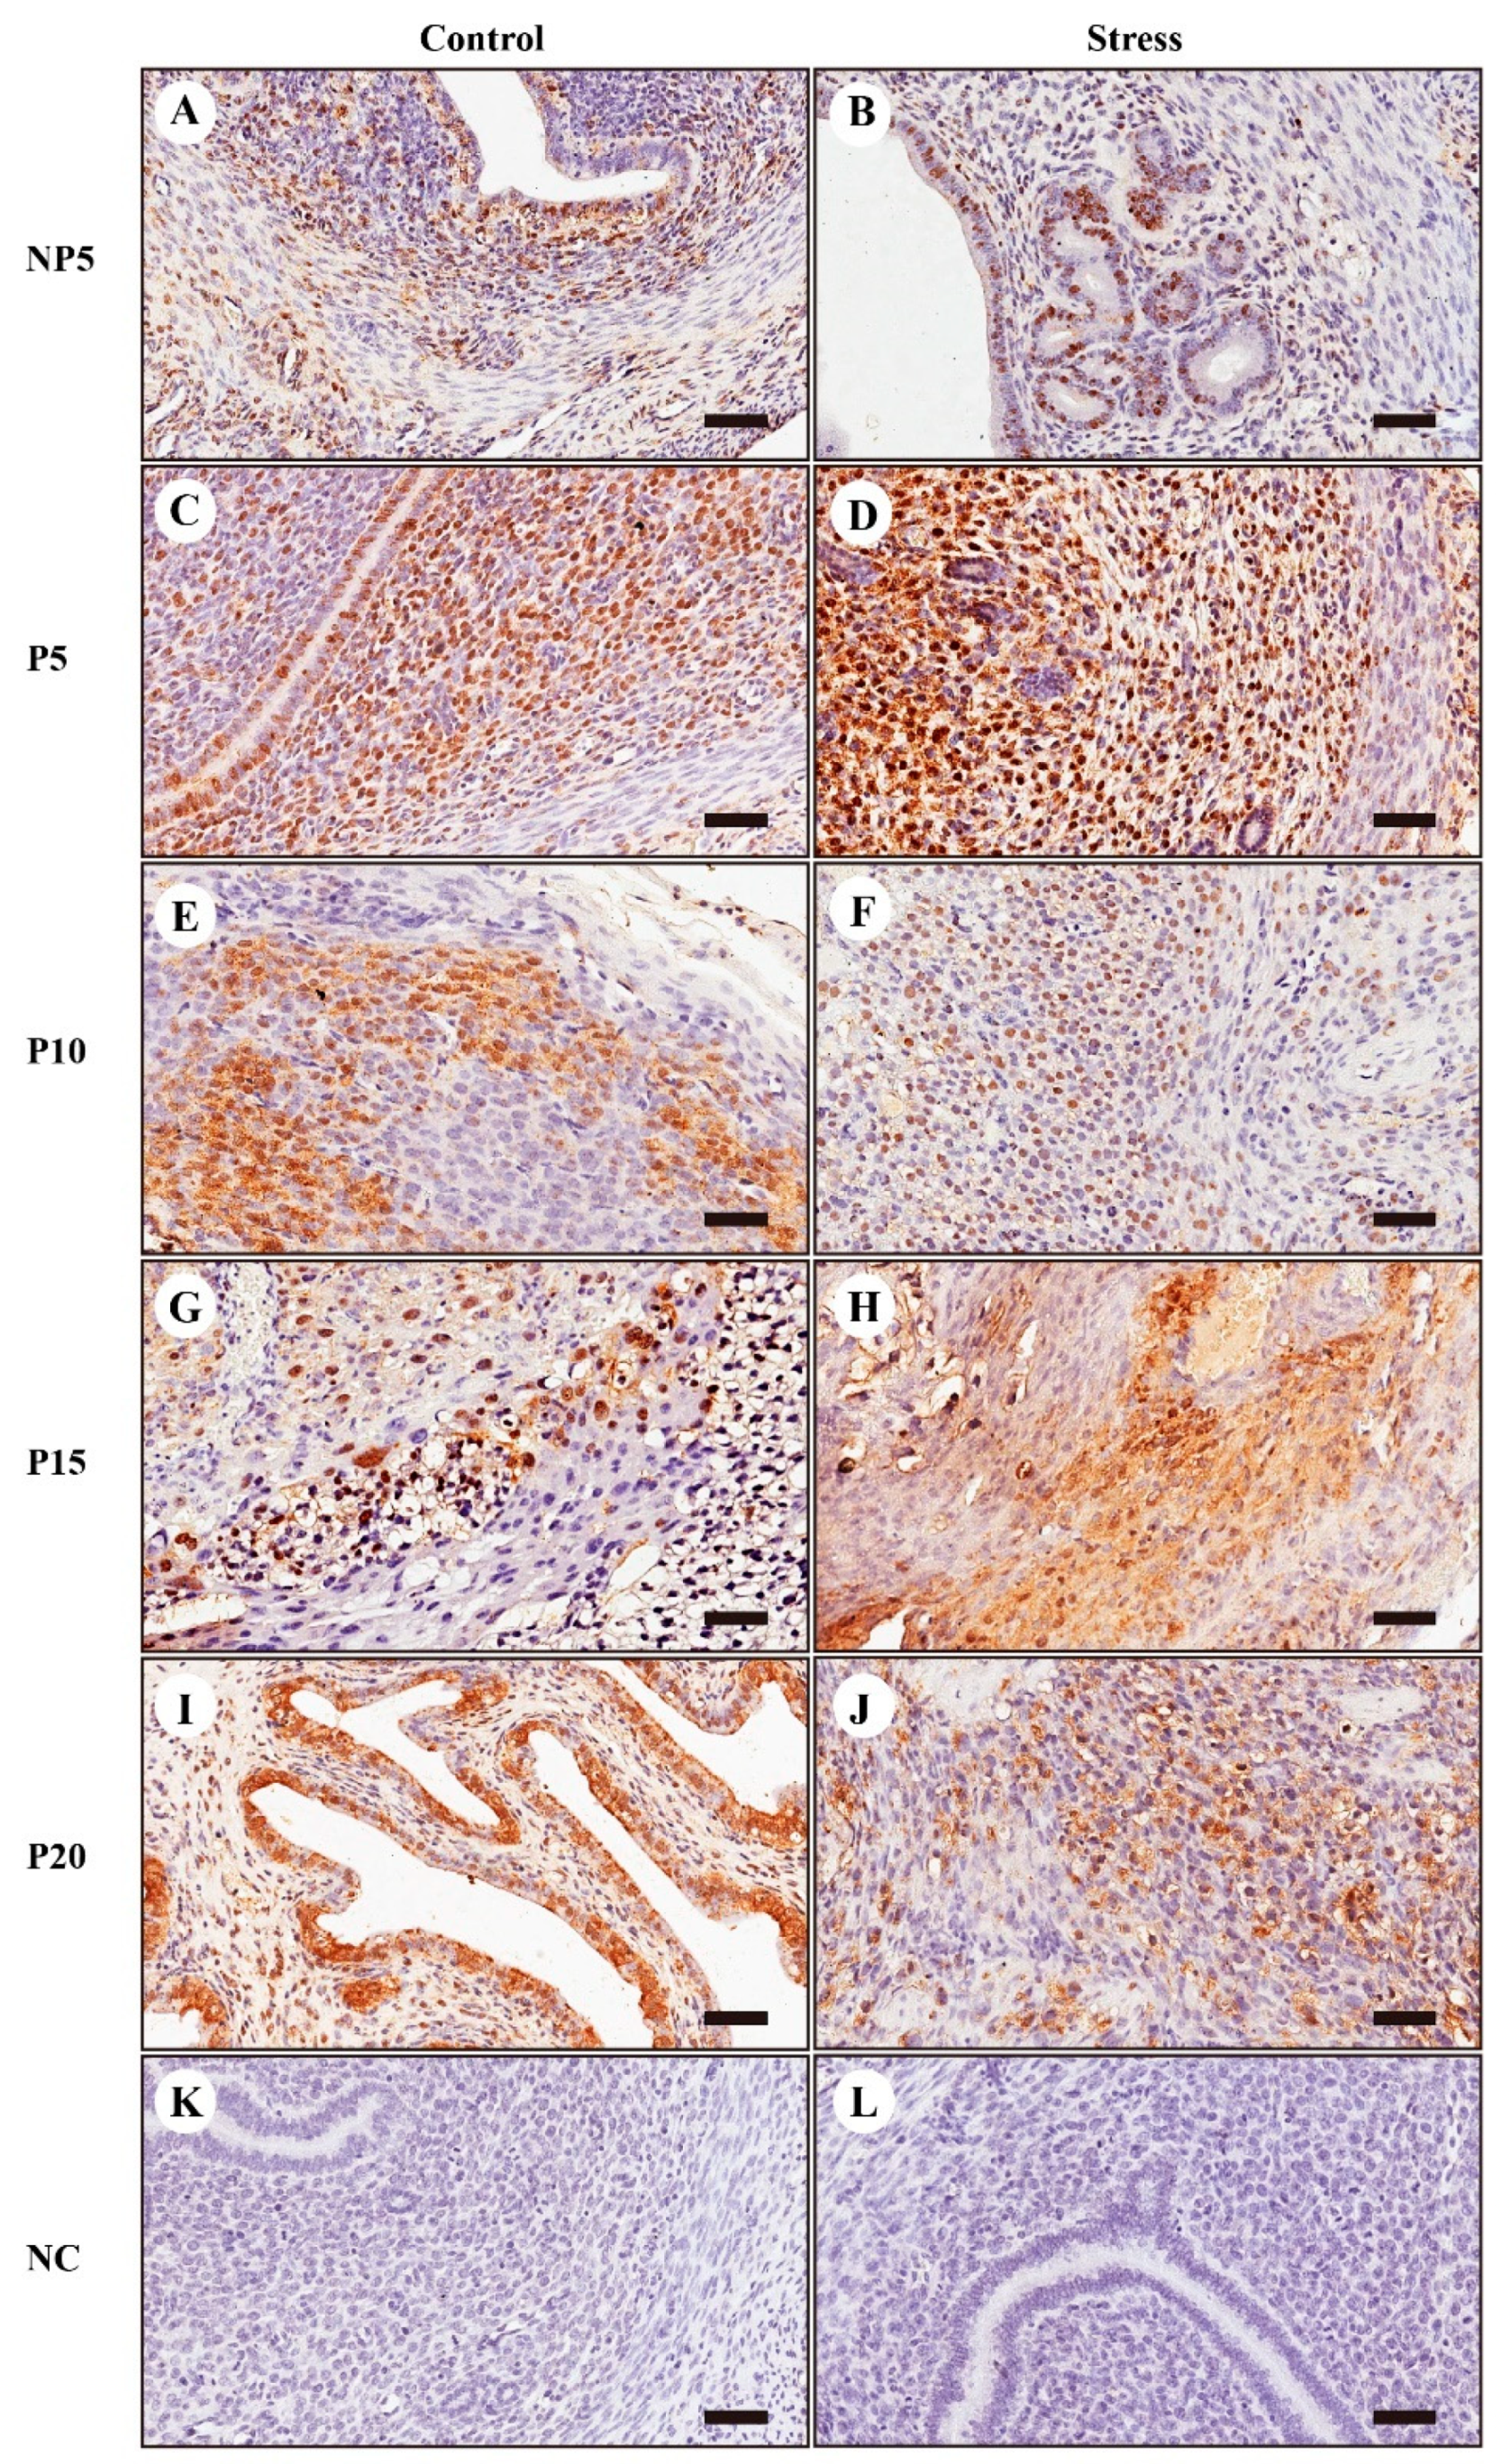
2.7. Immunohistochemical Localization of FOXO1

To explore the relationship between β2-AR and FOXO1, we performed immunohistochemical localization of FOXO1 in the uterus at every gestation age. The brownish yellow portion indicated positive cells. At NP5, P5, P10, P15 and P20, the FOXO1 was located in the endometrial luminal epithelium cell and in the ESCs. Meanwhile, FOXO1 was located at the nuclear during pregnancy, which demonstrated that FOXO1 exerted the transcription regulation function during pregnancy. As shown in Figure 7 and Figure 5H, at P5, FOXO1 increased under restraint stress, which showed that FOXO1 was not only involved in pregnancy but also related to restraint stress.

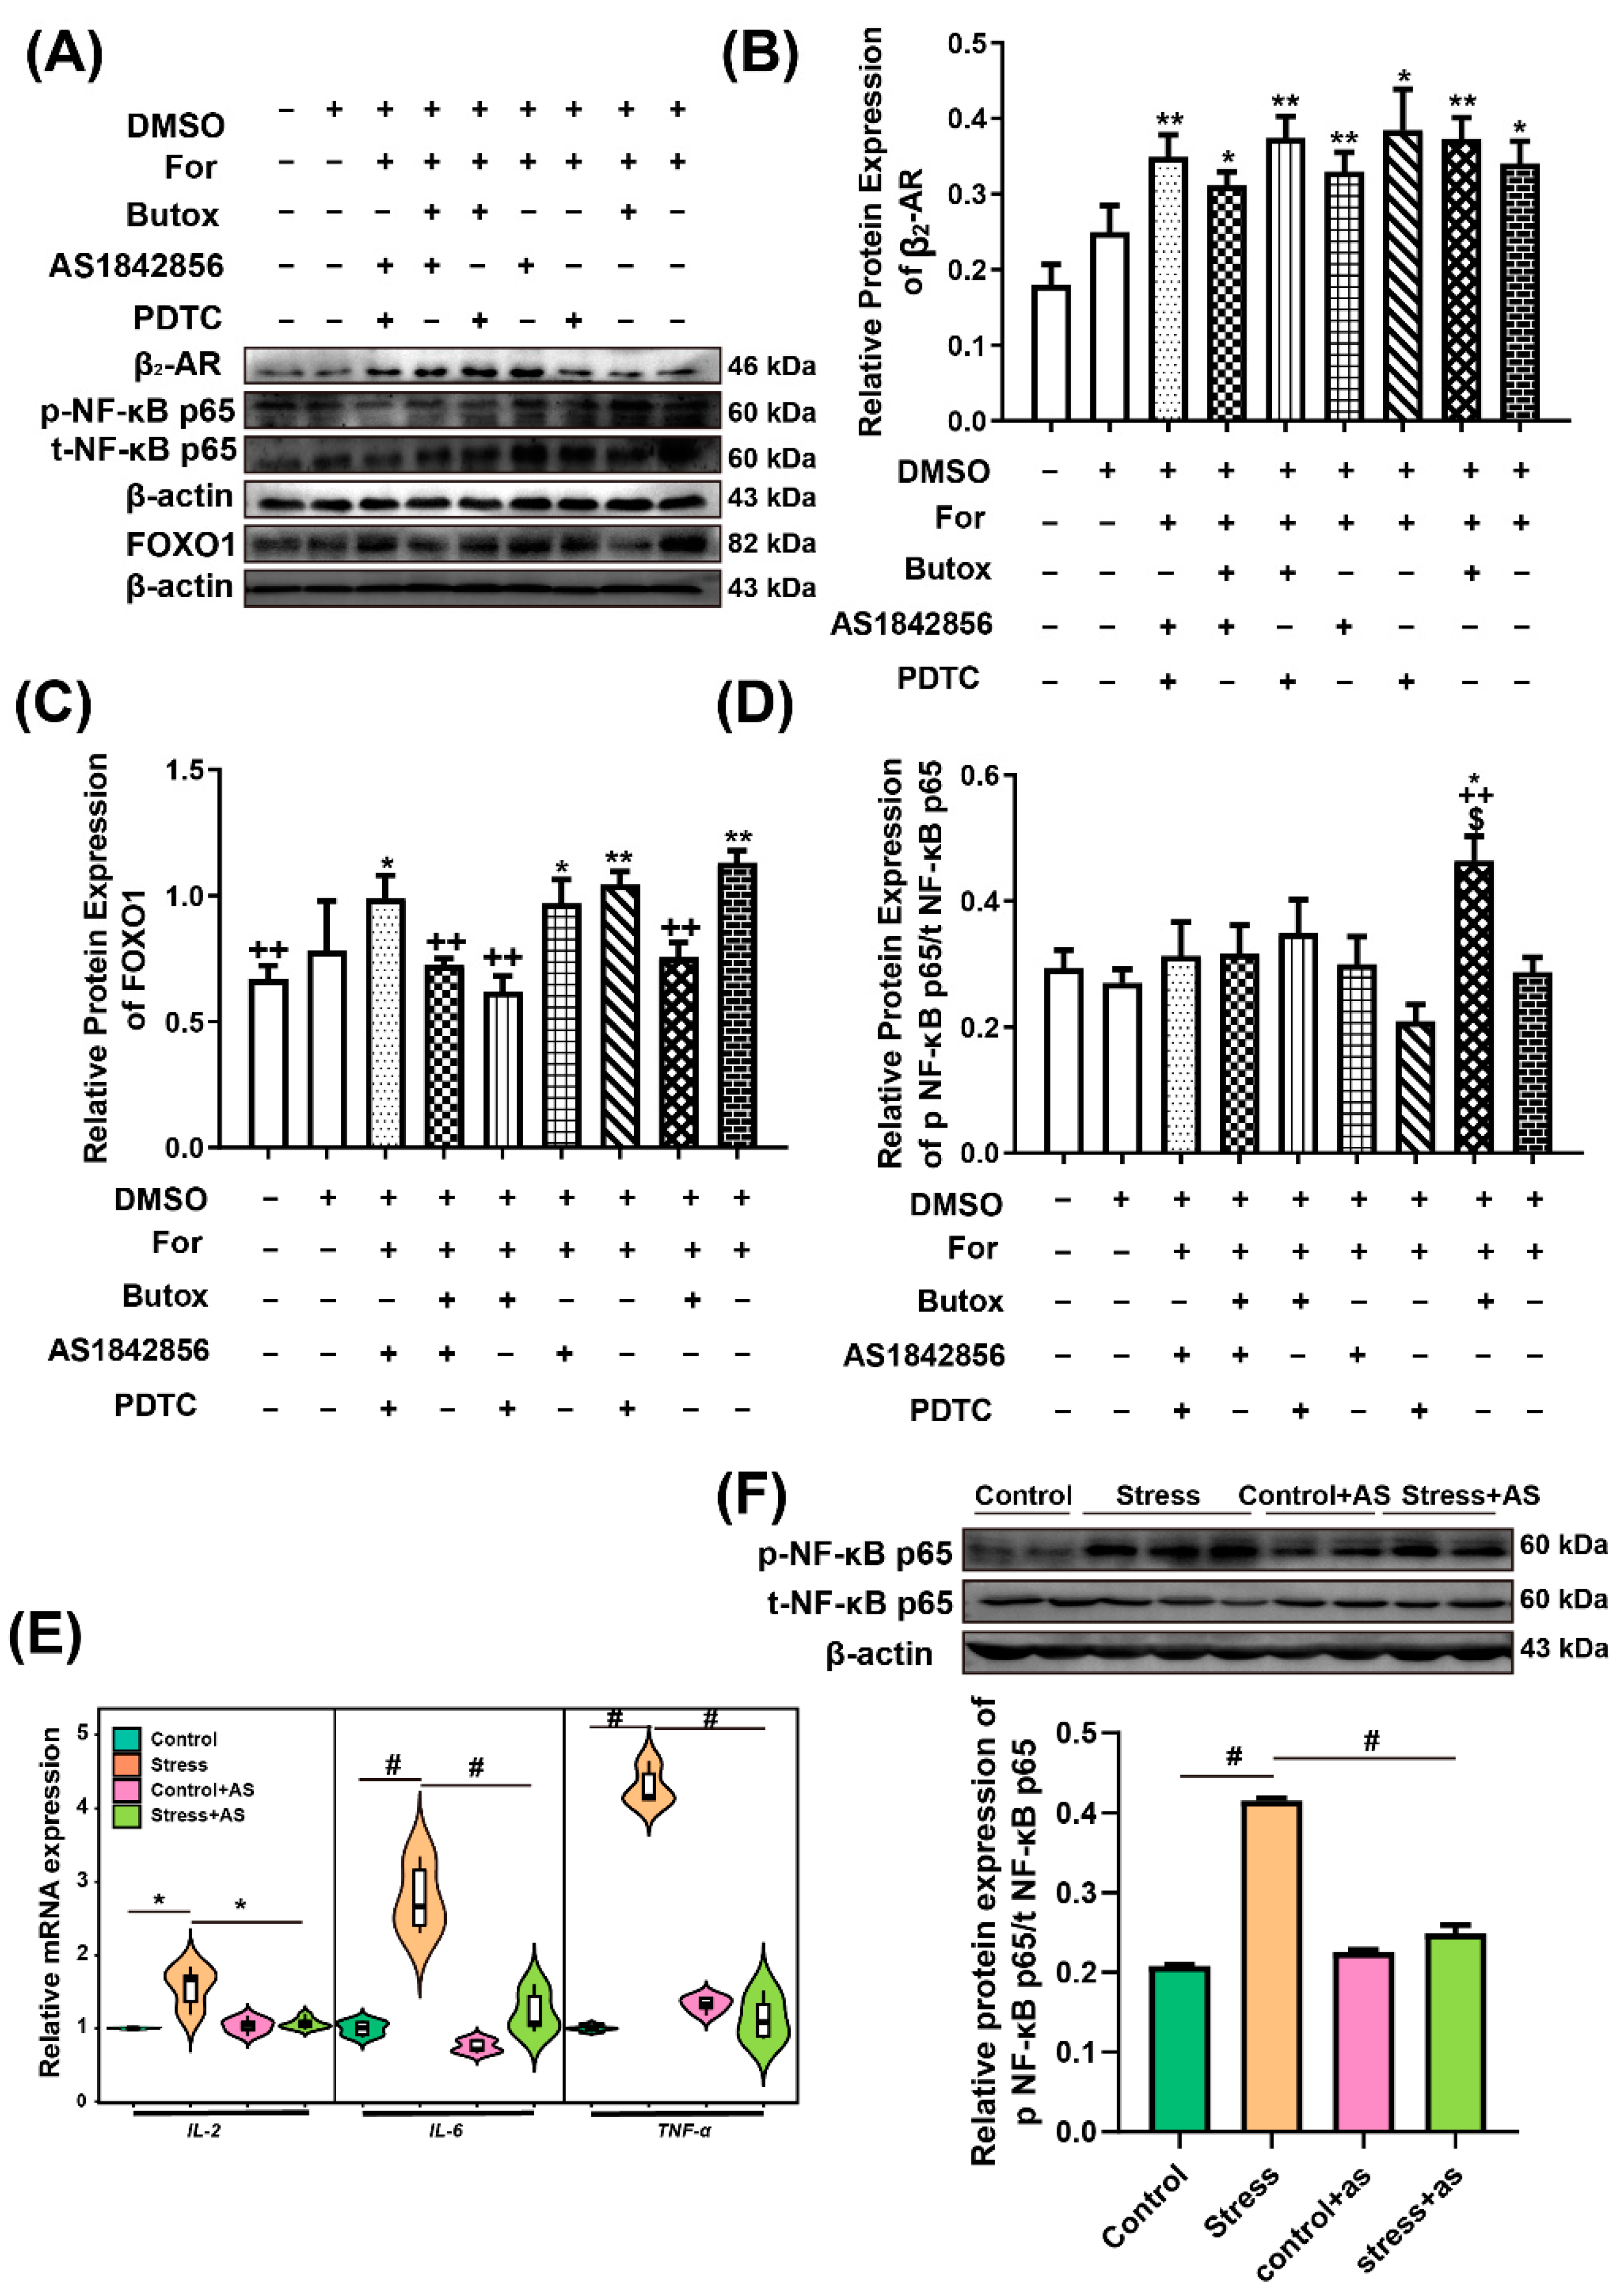
2.8. Relativity Analysis among FOXO1, p-NF-κB p65, and β2-AR

In view of the above, we isolated and cultured the ESCs of the uterus at P5 to explore the relationship between FOXO1, p-NF-κB p65, and β2-AR. The protein levels of β2-AR increased after adding the agonists of β2-AR compared with control cells (independent sample t test, 88.81%, p = 0.010) (Figure 8A,B). Interestingly, the protein levels of FOXO1 were also obviously increased when β2-AR was activated (independent sample t test 69.19%, p= 0.001) (Figure 8A,C). However, the protein levels of FOXO1 decreased significantly when Butoxamine hydrochloride (Butox) was added to the cultured cells (independent sample t test, 33.14%, p = 0.001) (Figure 8A,C). It is worth noting that the protein expression of p-NF-κB p65 did not change when β2-AR was activated, but it increased obviously when β2-AR was blocked by Butox (independent sample t test, 61.64%, p = 0.009) (Figure 8A,D). Furthermore, the expression decreased significantly when FOXO1 was inhibited by AS1842865 (independent sample t test, 47.53%, p = 0.022) compared with Butox treatment (Figure 8A,D). Next, in vivo, the target gene of p-NF-κB p65, including IL-2 (independent sample t test, 44.94%, p = 0.021), Interleukin-6 (IL-6) (independent sample t test, 177.14%, p = 0.001), and the target gene of FOXO1, tumour necrosis factor-alpha (TNF-α) (independent sample t test, 322.70%, p < 0.001), increased significantly in the restraint stress group compared with control group. However, they decreased when the FOXO1 was inhibited in the restraint stress group (independent sample t test, IL-2, 30.25%, p = 0.032; IL-6, 55.95%, p = 0.001; TNF-α, 73.08%, p < 0.001) (Figure 8E) compared with restraint stress group. Meanwhile, the protein levels of p-NF-κB p65/t- NF-κB p65 were obviously facilitated (independent sample t test, 99.77%, p < 0.001) in the restraint stress group. However, it decreased when the FOXO1 was inhibited (independent sample t test, 40.09%, p < 0.001) (Figure 8F) (for the specific value, see Table S7 of Supplementary Material). Therefore, FOXO1 may be a critical mediator in the crosstalk between β2-AR and p-NF-κB p65 in ESCs.

3. Discussion

3.1. Restraint Stress Disturbs Neuroendocrine Signalling in Pregnant Mice

Stress can cause neuroendocrine disorders and a range of reproductive diseases. For example, long-term chronic prenatal stress can lead to postpartum depression [24], pregnancy obesity syndrome [25], endometriosis, cancer, recurrent pregnancy loss, and pregnancy complications associated with pre-term birth [26]. The mechanism of stress on reproduction involved the HPA and hypothalamic–pituitary–gonadal (HPG) axis. Restraint stress can induce psychological stress, which induces the activation of the HPA axis [27]. Activation of the HPA axis by various stressors primarily inhibits reproductive function and is able to alter foetal development, inducing biological stress in the uterus [28]. CORT, NE, and blood glucose levels in mice are generally regarded as stress makers [29,30]. CORT can reduce the amount of oestradiol in the body and can cause damage during the reproductive process [31]. Therefore, restraint stress exacerbates this negative effect during pregnancy by activating the HPA axis. In this study, CORT, NE, and blood glucose levels increased significantly in stress mice, and E2 concentration decreased significantly at P5 and P15 (Figure 3). Disordered E2 affects eating, energy expenditure, and body adiposity [32]. Meanwhile, anxiety can induce weight loss [33]. In this study, the loss of body weight significantly increased after restraint stress at different ages compared with the control group. Elevation of CORT and NE caused by restraint stress reduced the spleen index in mice and induced an involution of red pulp and an expansion of white pulp. This phenomenon is also involved in the alterations of spleen immune cell subsets [34]. In summary, we believe that restraint stress disrupted hormone levels and resulted in malnutrition during pregnancy.
It was well known that E2 is important to embryo implantation and supports the growing foetus and counteract pregnancy stresses [35]. Generally, oxidative stress is accompanied by a decrease in E2 levels, and E2 treatment can maintain the redox balance. Therefore, oxidative stress is one of the reasons for the decrease in E2 levels [36]. Related studies have shown that oxidative stress can cause a variety of reproductive diseases, including endometriosis [37,38], foetal growth restriction [39], and intrauterine immune disorders [13,40]. In this work, restraint stress induced the oxidative stress. T-AOC level decreased at NP5 and throughout pregnancy (P5-P20) under restraint stress. In particular, T-SOD and GSH-Px decreased in the implantation (P5), post-implantation (P10), and childbirth periods (P20). The levels of MDA were significantly increased throughout pregnancy (P5-P20) (Figure 4). SOD, T-AOC, and GSH-Px, biomarkers of antioxidation, are decreased under oxidative stress. MDA, a biomarker of oxidative stress reflected by oxidation level, is increased under oxidative stress [41]. Stress not only stimulates the HPA axis but also disrupts the balance between oxidative and antioxidative stress [42]. Therefore, we considered that restraint stress threatened the intracellular equilibrium between oxidants and antioxidants.
Oxidative stress is closely related to the immune response. The indexes of the spleen and thymus, the lymphatic organs used in this study, decreased in stressed mice, showing that restraint stress leads to immune disorders in pregnant mice (Figure S1 and Figure 2). Our previous study suggested that restraint stress disturbed the balance of the uterine immune microenvironment during the implantation period, which altered the number of uterus natural killer cell (uNK) and mast cells, decreased the CD3+CD4+ T/CD3+CD8+ T cell ratio and the proliferative activities of T and B lymphocytes, and increased the IL-2/IL-4 ratio [5]. In our study, the uterus index was also decreased in the implantation (P5) and childbirth periods (P20) (Figure S1 and Figure 2). Therefore, we speculated that restraint stress may disrupt the immune environment of pregnant mothers and may limit uterine cell proliferation.

3.2. The FOXO Family is Involved in the Oxidative Stress Induced by Restraint Stress

FOXO, an evolutionarily conserved subfamily of Forkhead transcription factors, has emerged as a master regulator of cell fate decisions capable of integrating a variety of stress, growth factor and cytokine signalling pathways with the transcription machinery [43]. FOXO transcription factors function mostly as transcriptional activators, and their activity is inhibited by the phosphatidylinositol 3-kinase-serine/threonine kinase (PI3K-AKT) signalling pathway, resulting in FOXO exclusion from the nucleus and repression of transcriptional activity in order to resist oxidative stress [44]. There have also been reports that FOXO ablation in myeloid cells increases the generation of ROS [45], and that FOXO1 enhances the antioxidant capacity under normal physiological conditions [30]. Treatment with either FOXO1 small interfering RNA (siRNA) or resveratrol, a sirt1 agonist, results in oxidative stress in QBC939 cells [46]. FOXO also plays a critical role in the induction of human uterine decidualization [47]. The capabilities of trophoblast adhesion and migration are inhibited by silencing FOXO1 or oxidative stress with H2O2 [48].
In this work, mRNA levels of FOXO1, FOXO3, and FOXO4 were detected in the uterus and ovary, and all of them were significantly elevated under restraint stress during pregnancy. As stated previously, it is well known that FOXO1, FOXO3, and FOXO4 differ only in tissue specificity. FOXO1, FOXO3, and FOXO4 proteins are localized in the cytoplasm during embryo development and are located in the nucleus in embryos with developmental delay [49]. In the setting of growth factor stimulation, FOXO1, -3, and -4 are subject to Akt-mediated phosphorylation, which results in their nuclear export and the inhibition of FOXO-mediated transcription [44]. Therefore, we performed a protein assay of FOXO1 to illustrate the effect of restraint stress on the FOXO family. Interestingly, although FOXO family members, especially FOXO1, were activated by restraint stress, the antioxidation levels decreased in the stress group. Similar reports, in which a vicious cycle of oxidative stress results in insulin resistance (InsRes), promoting sustained FOXO activity and the induction of apoptosis, have been made [50]. Oxidative stress may promote the transcriptional activity of FOXO proteins, resulting in hyperglycaemia and a further increased production of ROS [51]. Therefore, the decline in antioxidant capacity confirms the excessive increase in ROS, indicating that ROS are promoted by FOXO and result in a vicious cycle.
Overall, there are two sides to the FOXO response to oxidative stress. Short-term stress promotes the upregulation of protective mechanisms. However, oxidative stress is not addressed, and associated damage is continuously activated. As a result, FOXO may lead to an induction of apoptosis. For instance, FOXO1 is a positive regulator of bone formation by resisting oxidative stress and favouring protein synthesis in osteoblasts [52]. However, continuously active FOXO1 overexpression induces apoptosis associated with the altered expression of genes regulating cell cycle and survival in rheumatoid arthritis fibroblast-like synoviocytes [53].

3.3. Restraint Stress Promotes the β2-AR Pathway

β2-AR belongs to the G protein-coupled receptor. It promotes or inhibits the expression of cyclic adenosine monophosphate (cAMP) in combination with Gs [54] and Gi [55,56]. β2-AR is closely related to the secretion of oestradiol and progesterone in mothers during pregnancy, and it may be involved in the process of embryo implantation [57]. As is well known, endogenous catecholamines such as EPI and NE are released from the adrenal gland and sympathetic nervous system under stress. The adrenergic system plays a central role in stress signalling, and excessive stress has been found to be associated with increased production of ROS [58].
NE and EPI stimulate cell surface α- (α1A, α1B, α1D, α2A, α2B, and α2C) and β- (β1, β2, and β3) adrenergic receptors (ARs) with differing affinities [59]. The expression of adrenergic receptor mRNA in the uterus of E4 mice has been detected using reverse transcription-polymerase chain reaction (RT-PCR), and it was found that the expression of β2-AR mRNA was much higher than in other subtypes [9]. In our study, the mRNA levels and protein expression levels of β2-AR increased significantly in the ovary and uterus under restraint stress. This implied that restraint stress activated β2-AR (Figure 6). β2-AR often mediates intracellular and extracellular signalling during stress [60]. Sympathetic nervous system activation and immune suppression occur due to the chronic stress of caregiving. β2-AR contributes to the stress-induced loss of immune-cell function [61]. Stress-induced elevation of EPI levels results in the activation of β2-AR on keratinocytes [62]. A study showed that β2-AR mediated the effect of chronic stress on lesions and exacerbated endometriosis-associated generalized hyperalgesia, thus accelerating the development of endometriosis [63]. In the development of pancreatic cancer, psychological stress is considered to be a risk factor associated with β2-AR [64].

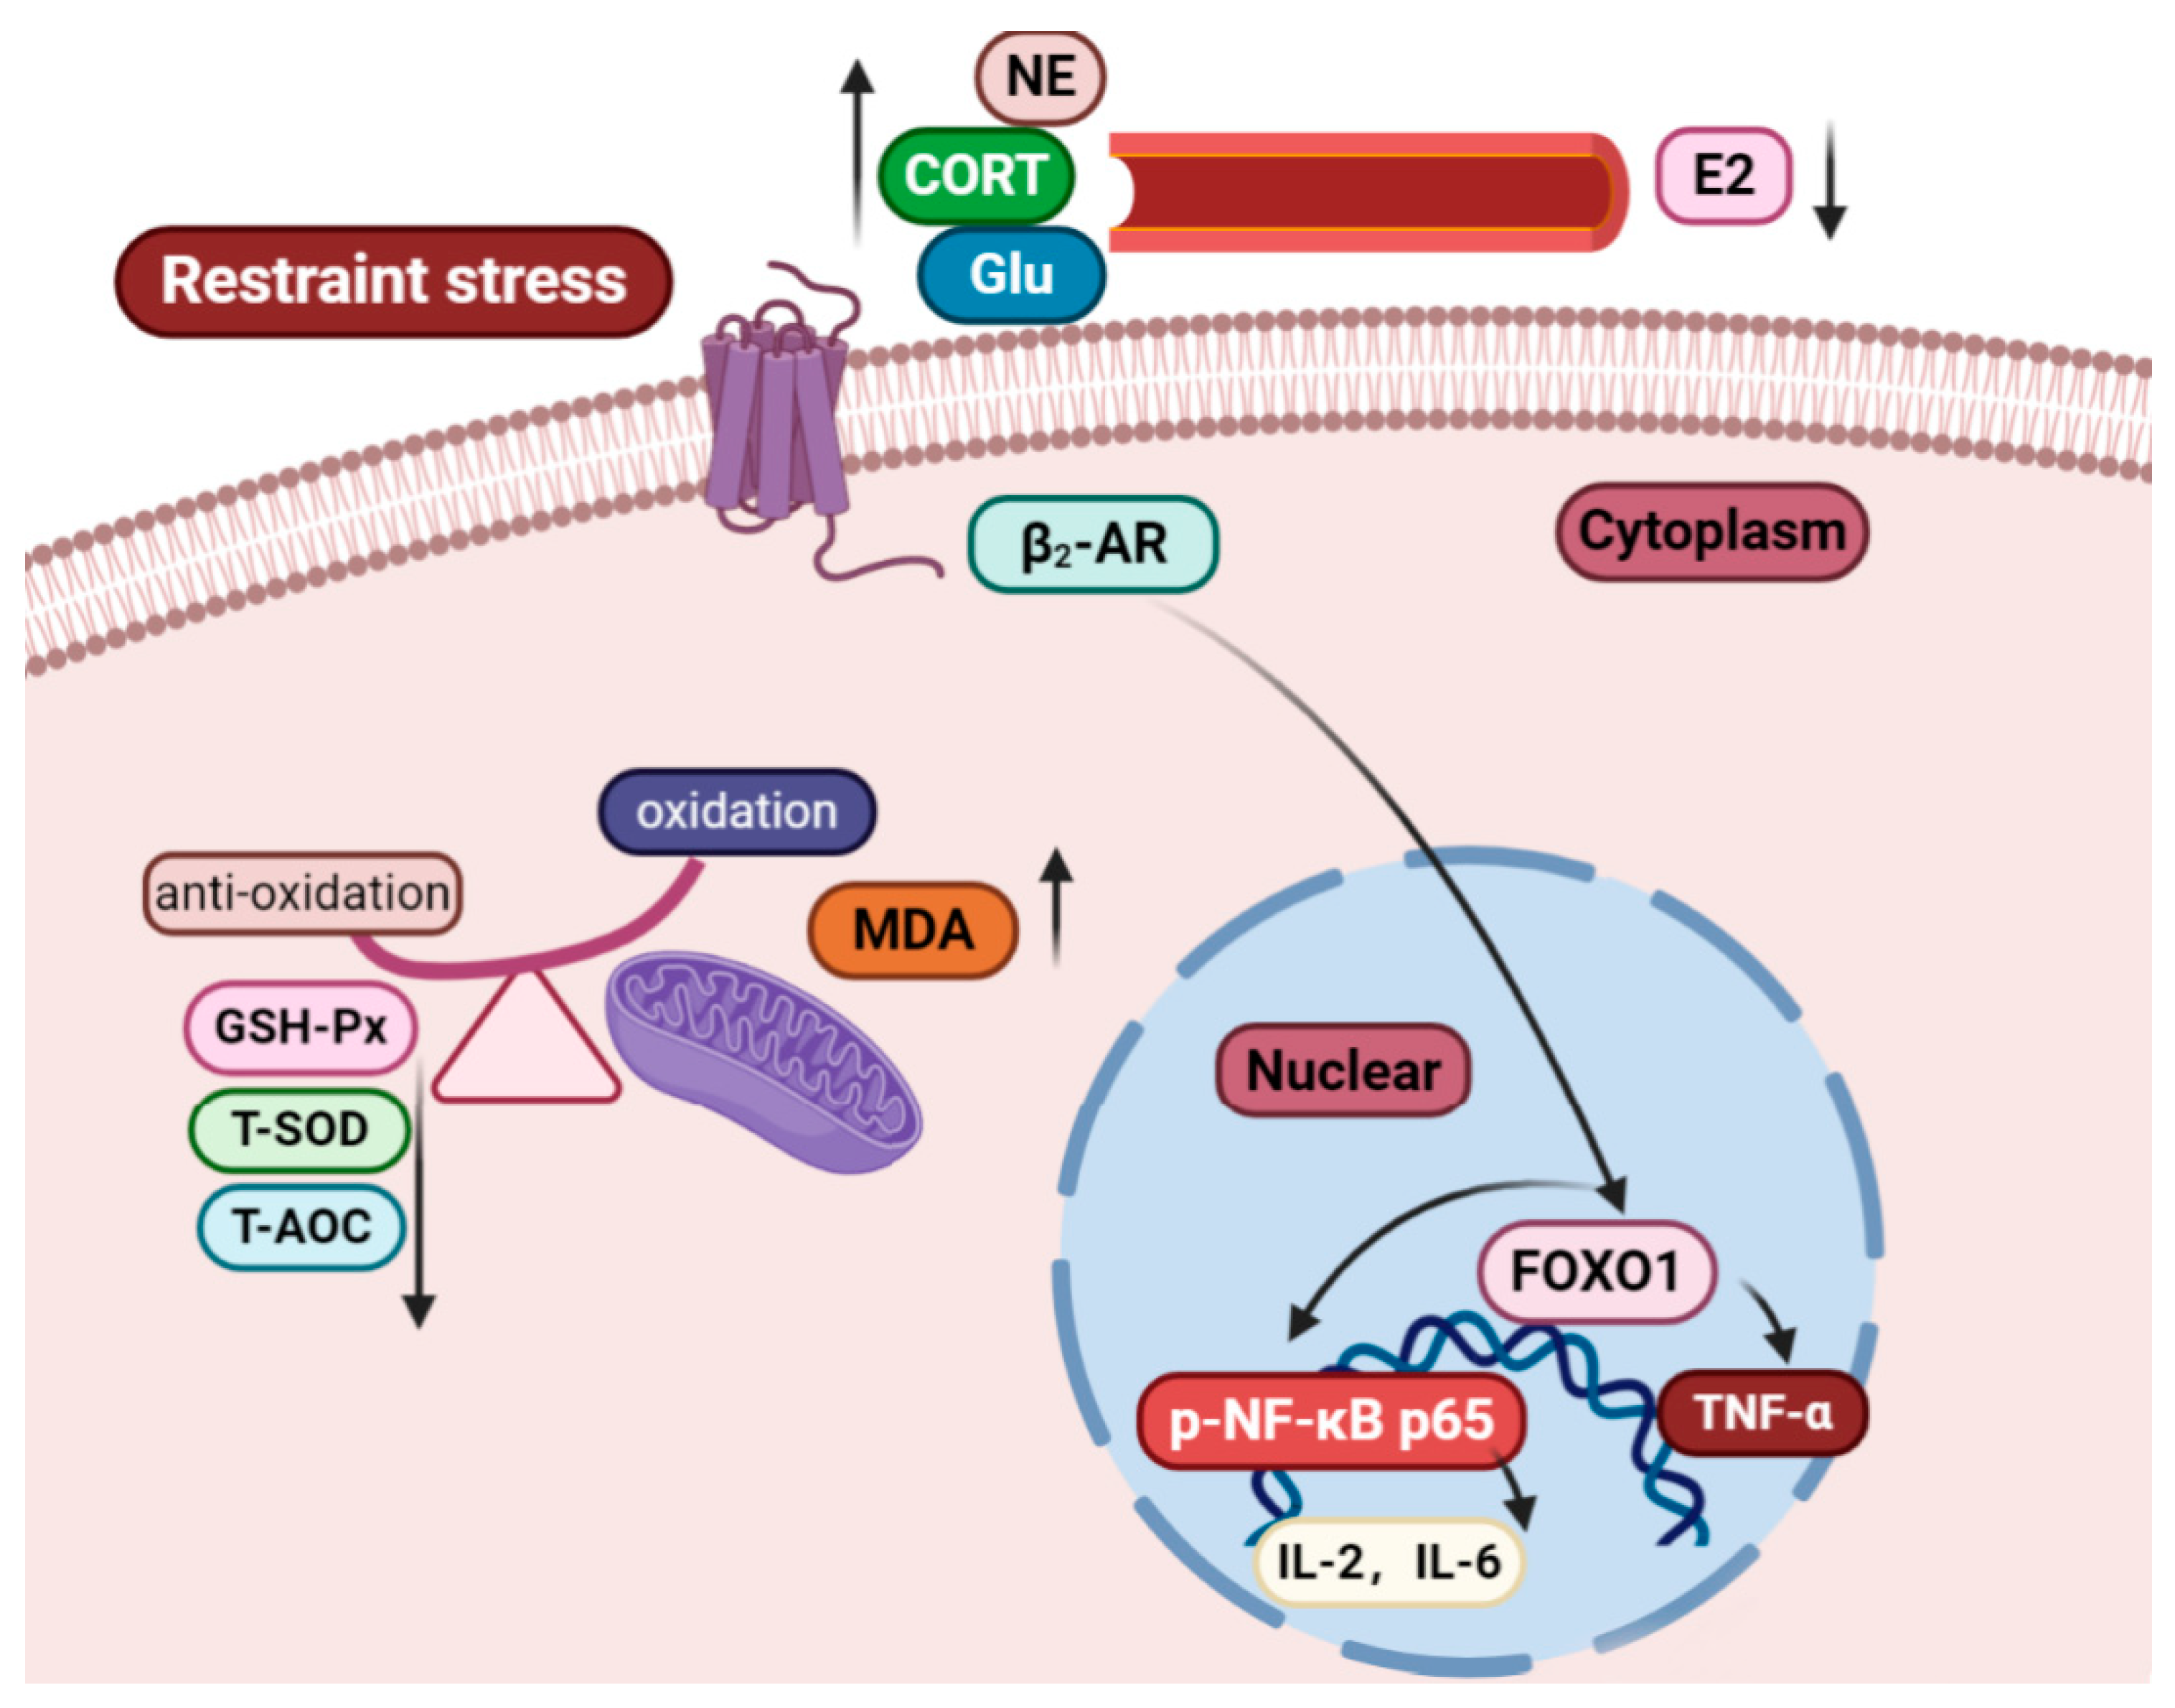
3.4. FOXO1 Mediates the β2-AR and p-NF-κB p65 Signalling Pathways

In vivo studies have shown that FOXO1 and β2-AR undergo significant changes under restraint stress conditions. In current studies, we investigated whether FOXO1 and β2-AR mediated NF-κB p65. The immunohistochemical results showed that FOXO1 was expressed in ESCs at every gestation age, so this study selected ESCs to explore signal transduction (Figure 7).
In recent years, the relationship between β2-AR and NF-κB has been studied by a large number of researchers, and many achievements have been made in inflammation and apoptosis. In this work, we focused on the relationship between β2-AR, FOXO1, and NF-κB; we also added a selective agonist of β2-AR (formoterol hemifumarate), which activates the intracellular signalling pathway, and added a blocker or inhibitor of β2-AR (butox), FOXO1 (AS1842865), and NF-κB (PDTC) to explore the relationship between the three factors. However, we found a more interesting phenomenon in cultured cells in vitro. Although FOXO1 was activated with formoterol hemifumarate, the phosphorylation of NF-κB p65 did not change. This was consistent with related reports. In some studies, β2-AR inhibited the degradation of inhibitor of NF-κB (IκB) [65,66,67], thereby impeding NF-κB entry into the nucleus and reducing inflammation [68,69]. This was related to β-arrestin 2, which prevents the inflammation of NF-κB p65 [70]. Gao et al. proved that β2-AR promoted IκB binding to NF-κB p65 to prevent it from entering the nucleus in order to increase the expression of IL-6, interleukin-8 (IL-8), tumour necrosis factor-alpha (TNF-α), and interleukin-1 beta (IL-1β) [71]. However, many studies have suggested that isoproterenol (ISO) activates NF-κB DNA binding activity and induces myocardial and systemic elaboration of interleukin-18 (IL-18) via β2-AR signalling, thereby promoting inflammation [72,73]. These results were different from our conclusion, which was considered to be due to the different agonists used. These previous studies used ISO (non-selective of β2-AR), but we used formoterol hemifumarate (a specific agonist of β2-AR). The difference might also be caused by pathways other than β2-AR.
Notably, when butox, the blocking agent of β2-AR, was added, the phosphorylation of NF-κB p65 was significantly increased. We speculated that there may be another way to activate p-NF-κB p65. Freddolino et al. reported that β2-AR had a number of residues for agonist and antagonist binding, including Asp-113; Ser-203, -204, and -207, Asn-293, Ile-169, Val-117, and Phe-290. Butox acted as an antagonist interacting with Ser-203, Ser-204, Asn-293, and Phe-290 of β2-AR and was considered to be a strong β2-AR-selective antagonist because of its strong binding to Asn-293, but it did not bind to the more potent Ser-207 [74]. Therefore, we speculated that the Butox may only block the site that can activate β-arrestin 2 to promote the activity of NF-κB. Thus, it made the formoterol hemifumarate able to activate p-NF-κB p65. The mechanism is unclear in current studies. Therefore, we speculated that β2-AR may also have promoted the increase in NF-κB to a certain extent.
In this work, it was found that β2-AR could significantly activate the protein levels of FOXO1. Furthermore, a study reported that administration of β2-AR agonists in mouse skeletal muscle induced expression of FOXO1 [21]. Both insulin resistance and oxidative stress may promote the transcriptional activity of FOXO proteins, resulting in a further increased production of ROS [51]. However, Zhang et al. proved that β2-AR was able to mediate PI3K-AKT signalling to inhibit the protein levels of FOXO1 in a mouse model of acute cardiac ischaemia-reperfusion [75]. In summary, we believe that when acute stress occurs, EPI or NE acts on β2-AR, which plays a protective role on the body; however, when the body is unable to cope with stress, we believe that FOXO1 will have sustained activation.
In addition, we found that the p-NF-κB p65 level was significantly reduced after the addition of AS1842865, which was the blocking agent of FOXO1 (Figure 8). There is little indirect evidence for the relationship between FOXO1 and NF-κB. It has been reported that the NF-κB pathway is activated by TNF-α and is significantly reduced by FOXO1 knockdown [76]. Other articles have suggested that, under the same condition, both FOXO1 and NF-κB tend to increase or decrease in parallel. For example, RELA (NF-κB p65) has a similar role to FOXO1, and both may prevent signal transducers and activators of transcription 3 (STAT3)-mediated leptin activation of a pro-opiomelanocortin (Pomc) promoter [77]. Patients with muscle atrophy from type 2 diabetes mellitus show increased expression of NF-κB and higher expression of the atrophy transcription factor FOXO1 in skeletal muscle [78]. Our study provides evidence that will assist in the study of the relationship between FOXO1 and NF-κB. In summary, we believe that FOXO1 may play a mediating role between β2-AR and NF-κB.

4. Materials and Methods

4.1. Animal Treatments

A total of 150 female ICR mice and 50 male mice (being used for mating, 8 weeks of age; Vital River Laboratory Animal Technology Co. Ltd., Beijing, China) were housed under conventional conditions (at a relative humidity of 50 ± 10% and a temperature of 21 ± 1 °C) with a regular 10 h dark/14 h light cycle (with lights on at 7:00 a.m.). First, the mice were maintained in a room for a week in order to adapt to the environment. Oestrus mice were placed with a sexually experienced male at night, and females with vaginal sperm plugs were then considered to be P1 (Pregnancy Day 1) on the next morning. Mice were divided into control (n = 50) and restraint stress groups (n = 50), each group were sacrificed on NP5 (Non-pregnancy, n = 10), P5 (n = 10), P10 (n = 10), P15 (n = 10), and P20 (n = 10). Restraint stress female mice were individually placed into transparent and ventilated plastic centrifuge tubes (they were able to breathe freely but were unable to escape) to limit their movements for 4 h (from 8:00 a.m. to 12:00 p.m.), and the female mice of the control group were freedom in the cage. Restraint stress and control conditions were initiated on NP1 (Non-Pregnancy Day 1, during the dioestrus period), P1 (Pregnancy Day 1), P6 (Pregnancy Day 6), P11 (Pregnancy day 11), and P16 (Pregnancy Day 16) until the mice were sacrificed on NP5 P5, P10, P15, and P20. The weight of the female mice was measured daily. The definition of body weight gain was the final weight minus the weight before stress. After the mouse was dissected, the liver, spleen, kidney, heart, ovary, uterus, and thymus were weighed. The organ index was expressed as the ratio of the weight of the organ to the body weight. 20 normal pregnancy mice (P5) were used to isolate ESCs to explore the signal pathway in vitro. Finally, 30 normal pregnant mice were divided into control group (n = 6), stress group (n = 8), control + AS group (n = 8), and stress+ AS group (n = 8) on P1. Stress+ AS group were treated by subcutaneous injection with FOXO1 inhibitor (AS1842856 (AS), 25 mg/kg at 6 p.m. every day until P5) and restraint stress. All animal procedures were approved by the China Agricultural University Institutional Animal Care and Use Committee (AW18079102-3-2).

4.2. Plasma and Tissue Preparations

Females mice were anaesthetized with 2% pentobarbital (4 mL/kg body weight, i.p.) on NP5, P5, P10, P15, and P20 immediately following the treatment. Plasma samples with eyeball extraction were collected to detect CORT, NE, and E2. Some of the uterine specimens were rapidly dissected, excluding the embryos, and stored in liquid nitrogen for protein analysis and mRNA analysis. Some of the uterine was immediately fixed in 4% paraformaldehyde for 48 h.

4.3. Quantitative Real-Time Polymerase Chain Reaction

Total RNA was extracted using TRIzol reagent (CW0580A, CoWin Biotech Co., Inc., Beijing, China). The concentration and purity of RNA was measured with a NanoPhotometer (P330, Implen, Munich, Germany). The concentration of RNA was 1500–1800 ng/μL. Afterward, 2 μg of total RNA were mixed with reverse transcriptase, and other reagents from the cDNA were synthesized using the GoScriptTM Reverse Transcription System (A5001, Promega, Madison, WI., USA). The cDNA was diluted 10 times to conduct polymerase chain reactions. Primers were synthesized by Invitrogen Trading of Shanghai. We used the following primers: FOXO1 primer (forward, 5′-GTGAAGAGCGTGCCCTACT-3′; reverse, 5′-GATTGAGCATCCACCAAGAAC-3′); FOXO3 primer (forward, 5′-CTCTCAGGCTCCTCACTGTA-3′; reverse, 5′-ATGAGTTCACTACGGATGAT-3′); FOXO4 primer (forward, 5′-TCATCAAGGTTCACAACGAGGC-3′; reverse, 5′-AGGACAGACGGCTTCTTCTTGG-3′); β2-AR primer (forward, 5′-TCACTCAGGAACGGGACGAAG-3′; reverse, 5′-CAGCACACGCCAAGGAGATTATG-3′); IL-2 primer (forward, 5′-TGAACTTGGACCTCTGCG -3′; reverse, 5′-AGGGCTTGTTGAGATGATGC-3′); IL-6 primer (forward, 5′- CTGCAAGAGACTTCCATCCAG-3′; reverse, 5′-AGTGGTATAGACAGGTCTGTTGG-3′); TNF-α primer (forward, 5′-CAGGCGGTGCCTATGTCTC-3′; reverse, 5′-CGATCACCCCGAAGTTCAGTAG-3′); β-actin primer (forward, 5′-TGCTGTCCCTGTATGCCTCTG-3′; reverse, 5′-TTGATGTCACGCACGATTTCC-3′). β-actin was used as the housekeeping gene. qRT-PCR amplification was performed by Roche LightCycler480 (Roche, Basel, Switzerland). Primers of qRT-PCR efficiency with one specific melting peak were used for the analysis. In this experiment, we used a 20 μL system containing 0.4 μL of forward primers, 0.4 μL of reverse primers, a 10 μL SYBR Green qPCR Master Mix kit (without ROX) (Q121-02, Vazyme Biotech Co., Ltd., Nanjing, China), 7.2 μL of nuclease free water, and 2 μL of cDNA. Relative target gene expression was obtained by normalizing the result to β-actin. The calculation method of mRNA expression was 2−△Ct. The value of NP5 was regarded as 1 and was used as the base level for assessment. Each sample was tested in triplicate.

4.4. Measurement of Plasma CORT, NE, Blood Glucose, and E2 Concentration

Total plasma CORT and NE concentrations were measured using a competitive enzyme-linked immunosorbent assay, the Mouse CORT enzyme linked immunosorbent assay (ELISA) Kit (LBTR-EL-1490, Beijing Limbo Terry Technology Development Co., Ltd., Beijing, China) and Mouse NE ELISA Kit (LBTR-EL-1487, Beijing Limbo Terry Technology Development Co., Ltd., Beijing, China). All of the tests were performed according to the manufacturers’ instructions. The antigen and antibodies were combined with biotinylated secondary antibodies and bound with streptavidin-horseradish peroxidase (HRP). The immune complex was formed and incubated at 37 °C for 60 min. After the colour was developed at 37 °C, the OD value was measured with a microplate reader, and the NE and CORT contents of the sample were calculated according to the standard curve (NE: y = 274.79x−22.276, R2 = 0.9908; CORT: y = 34.542x−3.782, R2 = 0.9886). The limit of detection for the NE assay ranged from 5 to 1000 ng/L. The limit of detection for the CORT assay ranged from 0.5 to 100 ng/mL. Five plasma samples were included in each group. Each sample was tested in triplicate.
E2 was detected via radioimmunoassay (RIA). Radioimmunoassay is a labelled immunoassay that uses radionuclides as a marker for the quantitative determination of antigens in a sample to be tested. The labelled antigen (Ag*) and the non-labelled antigen (Ag) compete with the specific antibody (Ab) for the binding reaction. The fitting was performed using a logarithmic measure-log pair logarithm (log(dose)~logit (Bi/B0)) mathematical model or a four-parameter mathematical model. Afterward, the percent binding rate of each tube was calculated: S0 (number of cpm) was B0, each calibration tube Si (number of cpm) was Bi, and the percent binding ratio of each tube was obtained. Using logX ~ logitY regression, the formula was obtained (logitY = 3.3388–0.6342logX). The content of the sample can be obtained by the formula. Five plasma samples were included in each group. Each sample was tested in triplicate.
Blood glucose was measured with a blood glucose meter (GC14906201, ACCU-CHEK, Basel, Switzerland, Germany), and the blood was collected through the tail vein. Five blood samples were included in each group. Each sample was tested in triplicate.

4.5. Measurements of Oxidative Stress-Related Enzymes

Immediately after the mice were sacrificed, the uterus was rapidly dissected, and the embryos were removed, frozen in liquid nitrogen, and stored. The uterus with removed embryos was weighed and placed in a 0.9% saline solution (1:9) to prepare a uterine homogenate. Finally, supernatants were extracted by centrifugation (2000× g, 20 min). The total protein concentration was measured using a BCA Protein Assay Kit (CW0014S, CoWin Biotech Co., Inc., Beijing, China). Total antioxidant capacity (T-AOC) (A015), SOD (A001-1), GSH-Px (A005), and MDA (A003-1) assay kits were purchased from Nanjing Jiancheng Bioengineering Institute (Nanjing, China). GSH-Px and SOD are well-known scavenger enzymes that protect cells from oxidative stress. SOD was detected by the xanthine oxidase method, and GSH-Px was determined by the rate at which it was converted to the enzymatic reaction of oxidized glutathione disulfide (GSSG). T-AOC was detected by converting Fe3+ to Fe2+. Those values were expressed as U/mg of protein. MDA is responsible for inducing oxidative stress, and it reacts with thiobarbituric acid to form a red complex and is expressed as nmol/mg of protein. These results were detected at specific wavelengths (T-SOD: 550 nm, GSH-Px: 412 nm, T-AOC: 520 nm, and MDA: 532 nm). Five tissue samples were included in each group, and each sample was tested in triplicate.

4.6. Western Blotting

Whole-tissue lysates were prepared from tissue, and protein concentrations were measured using a BCA protein assay reagent (CW0014S, CoWin Biotech Co., Inc., Beijing, China). These proteins were separated by 10% sodium dodecyl sulfate polyacrylamide gel electrophoresis (SDS-PAGE), followed by electrotransfer onto a polyvinylidene fluoride membrane (Millipore, Billerica, MA, USA). The membrane was blocked with 5% skim milk/0.5% Tween-20 in TBST for 2 h at room temperature. The primary antibody was probed with an anti-β-actin antibody (1:4000; CW0096M, CoWin Biotech Co., Inc., Beijing, China), an anti-FOXO1 antibody (1:1000, 2880T, Cell Signalling Technology, Beverly, MA, USA), an anti-RELA antibody (1:1000, total-NF-κB p65 (t-NF-κB p65), A1115, ABclonal Biotech Co., Ltd., Cambridge, MA, USA), an anti-phospho-RELA-S536 antibody (1:500, p-NF-κB p65, AP0475, ABclonal Biotech Co., Ltd., Cambridge, MA, USA), and an anti-ADRB2 antibody (1:1000, β2-AR, A1295, ABclonal Biotech Co., Ltd., Cambridge, MA, USA) overnight at 4 °C. Afterward, the membranes were washed in TBST, followed by a horseradish peroxidase-conjugated goat anti-mouse IgG (1:6000; CW0102M; CoWin Biotech Co., Inc., Beijing, China) for β-actin or goat anti-rabbit IgG (1:6000; CW0103M; CoWin Biotech Co., Inc., Beijing, China) for FOXO1, β2-AR, p-NF-κB p65, and t-NF-κB p65 for 2 h at room temperature. Immunoblotting was visualized with an ECL Western Blot Kit (CW0049M, CoWin Biotech Co., Inc., Beijing, China). The bands obtained in the blots were scanned and analysed with ImageJ (National Institutes of Health, Bethesda, MD, USA). The data are expressed as the integral optical density (IOD) of the bands, normalized to the IOD of the corresponding β-actin bands. Five tissue samples were included in each group. Each sample was repeated three times.

4.7. Immunohistochemistry

FOXO1 was localized by immunohistochemistry. The uterus taken at P5 was processed into paraffin sections. All sections (5 μm) were routinely dewaxed in xylene and rehydrated with graded concentrations of ethanol. Afterward, all slides were subjected to antigen retrieval by 0.01 M sodium citrate hydrochloric acid buffer. Tissue sections were washed 3 times with phosphate-buffered saline (PBS, pH 7.0) for 5 min each. Endogenous peroxidase activity was blocked with 3% H2O2 for 30 min. Non-specific staining was blocked with 5% normal goat serum for 30 min. The sections were incubated at 4 °C overnight with anti-FOXO1 antibody (1:100, 2880T, Cell Signalling Technology, Beverly, MA, USA). Next, the slides were washed with PBS and incubated sequentially with 1:400 biotin-conjugated goat anti-rabbit IgG (Beijing CoWin Biotech Co., Ltd., Beijing, China) for 2 h. The slides were washed with PBS and incubated sequentially with 1:400 HRP-streptavidin (Beijing CoWin Biotech Co., Ltd., Beijing, China) for 2 h. The immunoreactivity was revealed by diaminobenzidine (DAB) treatment, and nuclei were counterstained with haematoxylin for 5 min. The sections incubated with PBS instead of primary antibody served as negative controls. Images were acquired using an upright DP72 microscope (Olympus, Tokyo, Japan).

4.8. Cell Culture with Drug Treatment

ESCs taken during mouse pregnancy (P5) were cultured according to a reported method [79]. The uterus was placed in Hanks balanced saline solution (HBSS) containing 1% penicillin–streptomycin to clean the uterus. Afterward, the uterus was digested in a mixed digestive solution containing 2.5% pancreatin and 0.25% trypsin for 1 h in a 4 °C shaker; afterward, the uterus was left to stand at 25 °C for 45 min and at 37 °C for 15 min. The uterus was then moved and placed in DMEM medium containing 10% foetal bovine serum for 5 min and then placed in cold HBSS and vortexed for 10 s; this step was repeated twice. The uterus was placed in a mixed digestive solution containing 0.05% trypsin-EDTA and 0.1% collagenase I and shaken at 37 °C for 30 min. The uterus was washed in cold HBBS, and the uterus was placed into a DMEM/F12 medium containing 10% foetal bovine serum and vortexed for 10 s. The cells collected with DMEM/F12 complete medium were passed through a 40 μm sieve to collect single cells with 500 g centrifugation for 7 min. Resuspended cells were cultured in a 12-well plate at 1 × 10⁶ cells/well. The cells were cultivated in a 37 °C, 5% CO2 incubator for 45 min; afterward, the non-adherent cells were discarded, and the DMEM/F12 complete medium was added to the cells to cultivate for 24 h. Finally, the cells were starved for 6 h with DMEM/F12 basic medium.
Addition of drugs: Formoterol hemifumarate (For) (10−8 M, 1448, Tocris Bioscience, Minneapolis, MN, USA) is a selective agonist of β2-AR. Butoxamine hydrochloride (Butox) (10−6 M, B1385, Sigma, St. Louis, MO, USA) is the blocking agent of β2-AR, but its specific mechanism of action is not yet clear. AS1842865 (8 × 10⁻⁷ M, HY-100596, Med Chem Express, Brea, CA, USA) is an inhibitor of FOXO1. Pyrrolidine dithiocarbamate ammonium (PDTC) (10−6 M, 5108-96-3, Tocris Bioscience, Minneapolis, MN, USA) [80] is an inhibitor of NF-κB, as it prevents an increase in NOS mRNA. The cells were cultured with different drugs and named Cell+For (F), Cell+For+Butox (F+B), Cell+For+AS1842865 (F+A), Cell+For+PDTC (F+P), Cell+For+AS1842865+PDTC (F+A+P), Cell+For+Butox+AS1842865 (F+B+A), Cell+For+Butox+PDTC (F+B+P), Cell, and 0.02% DMSO. The inhibitor was added for 30 min, followed by the addition of For or not for 24 h [80]. Cells were collected with protein lysate and subjected to ultrasonic vibration. The supernatant was collected by centrifugation at 14,000 rpm for 10 min to detect the protein levels of FOXO1, β2-AR, and p NF-κB p65/t-NF-κB p65 in different groups. The same experiment was performed four times, and each sample was tested in triplicate.

4.9. Statistical Methods

The data were analysed with SPSS 18.0 (SPSS Inc., Chicago, IL, USA). To analyse the effects of restraint stress and different gestational stages on the experimental data, a two-way analysis of variance was performed. A one-way analysis of variance (ANOVA) was performed, followed by Duncan’s post hoc test, to analyse the differences of all indexes at different age in the control and stress group. Different uppercase letters (A, B, C, D, and E) represent the differences between NP5, P5, P10, P15 and P20 in the stressed group, and different lowercase letters (a, b, c, d, and e) represent the differences between NP5, P5, P10, P15 and P20 in the control group. Treatment groups are significantly different from each other if no labelling letter (a to e or A to E) is shared between groups. The significant difference between the control and stress mice at the same gestational stage were evaluated by an independent sample t test (two-tailed test). The data are expressed as the mean ± standard error of mean (SEM). In this result, the percentage ((Value Stress-Value Control)/Value Control) represented that the ratio of increase or decrease in stress group compared with control group in vivo. * p < 0.05 was used to indicate that the difference was significant, and # p < 0.01 indicated that the difference was extremely significant compared with the corresponding control group. In vitro, the stimulate index of ESCs (see Figures S2 and S3 of Supplement Material 1) was calculated as follows:
SI = OD570 treatment group/OD570 control group
where * represents the difference compared with the For group; + represents the difference compared with the For+Butox group. $ represents the difference compared with the For+Butox+As group. A single symbol indicates that the difference was significant, and a double symbol indicates that the difference was extremely significant, compared with the corresponding groups.

5. Conclusions

In vivo, restraint stress triggered the generation of oxidative stress, resulting in a state of imbalance between levels of oxidative and antioxidative stress, and leading to the loss of body weight in pregnant mothers. Restraint stress effected the index of organs and promoted an increase in CORT, NE, and blood glucose levels and a decrease in E2, leading to neuroendocrine disorders. Furthermore, β2-AR and FOXO in the uterus and ovary were activated. In vitro, FOXO1 may be a critical mediator in the crosstalk between β2-AR and p-NF-κB p65 in ESCs (Figure 9). This finding also provides evidence to support the study of human pregnancy-related diseases.

Supplementary Materials

The following are available online at https://0-www-mdpi-com.brum.beds.ac.uk/1422-0067/22/3/1478/s1, Figure S1: Images of the liver, spleen, thymus, heart, kidney, ovary and uterus; Figure S2: The stimulation index of uterus ESCs after adding For; Figure S3: The stimulation index of uterus ESCs after adding AS1842865 before adding For; Table S1: Data of Section 2.1; Table S2: Data of Section 2.2; Table S3: Data of Section 2.3; Table S4: Data of Section 2.4; Table S5: Data of Section 2.5; Table S6: Data of Section 2.6; Table S7: Data of Section 2.8.

Author Contributions

Data curation, J.L.; funding acquisition, Y.D.; methodology, Y.C. and Z.W.; project administration, Y.D.; resources, Y.C., Z.W. and J.C.; software, J.L. and Y.D.; supervision, Z.W. and Y.D.; writing—original draft, J.L.; writing—review and editing, Y.D. All authors have read and agreed to the published version of the manuscript.

Funding

The present work was supported by the National Natural Science Foundation of China (grant nos. 31972633, 31572476, 31272483) and National Natural Science Foundation of Beijing (grant no. 6172022).

Institutional Review Board Statement

All animal procedures were approved by the China Agricultural University Institutional Animal Care and Use Committee (AW18079102-3-2).

Informed Consent Statement

Not applicable.

Data Availability Statement

The data used to support the findings of this study are available from the corresponding author upon request.

Acknowledgments

The authors would like to thank all of the members of the neurobiology laboratory. The authors are grateful for the experimental animal platform of China Agricultural University for their support for this research. The authors acknowledge the comments of the reviewers that helped to improve the study.

Conflicts of Interest

The authors declare no competing interests.

Abbreviations

BWGBody weight gain
ButoxButoxamine hydrochloride
cAMPCyclic adenosine monophosphate
CORTCorticosterone
CRHCorticotropin-releasing hormone
HBSSD’Hanks balanced saline solution
DABDiaminobenzidine
ESCsEndometrial stromal cells
EPIEpinephrine
FOXOForkhead transcription factor class O
ForFormoterol hemifumarate
GSH-PxGlutathione peroxidase
GnRHGonadotropin releasing hormone
HRPHorseradish peroxidase
HPAHypothalamic-pituitary-adrenal
HPGHypothalamic-pituitary-gonadal
IκBInhibitor of NF-κB
InsResInsulin resistance
IODIntegral optical density
IL-18Interleukin 18
IL-6Interleukin-6
IL-8Interleukin 8
IL-1βInterleukin -1 beta
IUGRIntrauterine growth restriction
ISOIsoproterenol
MDAMalondialdehyde
NENorepinephrin
NP1Non-pregnancy Day 1
NP5Non-pregnancy Day 5
NF-κBNuclear factor-kappa B
E2Oestradiol
ANOVAOne-way analysis of variance
GSSGOxidized glutathione disulphide
P1Pregnancy Day 1
P10Pregnancy Day 10
P15Pregnancy Day 15
P20Pregnancy Day 20
P11Pregnancy Day 11
P16Pregnancy Day 16
P5Pregnancy Day 5
P6Pregnancy Day 6
PI3K-AKTPhosphatidylinositol 3-kinase-serine/threonine kinase
PomcPro-opiomelanocortin
PDTCPyrrolidine dithiocarbamate ammonium
qRT-PCRQuantitative real-time polymerase chain reaction
ROSReactive oxygen species
RT-PCRReverse transcription-polymerase chain reaction
STAT3Signal transducers and activators of transcription 3
siRNASmall interfering RNA
SASSympathetic-adrenal medullary system
SDS-PAGESodium dodecyl sulfate polyacrylamide gel electrophoresis
SEMStandard error of mean
TNF-αTumor necrosis factor-alpha
T-AOCTotal antioxidant capacity
T-SODTotal superoxide dismutase
uNKUterus natural killer cell
β2-ARβ2-adrenergic receptor

References

  1. Sandman, C.A.; Davis, E.P.; Buss, C.; Glynn, L.M. Exposure to prenatal psychobiological stress exerts programming influences on the mother and her fetus. Neuroendocrinology 2012, 95, 7–21. [Google Scholar] [CrossRef] [Green Version]
  2. Veru, F.; Laplante, D.P.; Luheshi, G.; King, S. Prenatal maternal stress exposure and immune function in the offspring. Stress 2014, 17, 133–148. [Google Scholar] [CrossRef]
  3. Hantsoo, L.; Kornfield, S.; Anguera, M.C.; Epperson, C.N. Inflammation: A Proposed Intermediary between Maternal Stress and Offspring Neuropsychiatric Risk. Biol. Psychiatry 2019, 85, 97–106. [Google Scholar] [CrossRef]
  4. Murison, R.; Overmier, J.B. Some psychosomatic causal factors of restraint-in-water stress ulcers. Physiol. Behav. 1993, 53, 577–581. [Google Scholar] [CrossRef]
  5. Liu, G.; Dong, Y.; Wang, Z.; Cao, J.; Chen, Y. Restraint stress alters immune parameters and induces oxidative stress in the mouse uterus during embryo implantation. Stress 2014, 17, 494–503. [Google Scholar] [CrossRef]
  6. Liu, G.; Dong, Y.; Wang, Z.; Cao, J.; Chen, Y. Restraint stress delays endometrial adaptive remodeling during mouse embryo implantation. Stress 2015, 18, 699–709. [Google Scholar] [CrossRef]
  7. Chrousos, G.P.; Torpy, D.J.; Gold, P.W. Interactions between the hypothalamic-pituitary-adrenal axis and the female reproductive system: Clinical implications. Ann. Intern. Med. 1998, 129, 229–240. [Google Scholar] [CrossRef]
  8. de Kloet, E.R.; Joels, M.; Holsboer, F. Stress and the brain: From adaptation to disease. Nat. Rev. Neurosci. 2005, 6, 463–475. [Google Scholar]
  9. Chen, Q.; Zhang, Y.; Peng, H.; Lei, L.; Kuang, H.; Zhang, L.; Ning, L.; Cao, Y.; Duan, E. Transient {beta}2-adrenoceptor activation confers pregnancy loss by disrupting embryo spacing at implantation. J. Biol. Chem. 2011, 286, 4349–4356. [Google Scholar] [CrossRef] [Green Version]
  10. Burton, G.J.; Jauniaux, E. Oxidative stress. Best Pract. Res. Clin. Obstet. Gynaecol. 2011, 25, 287–299. [Google Scholar] [CrossRef] [Green Version]
  11. Agarwal, A.; Allamaneni, S.S. Role of free radicals in female reproductive diseases and assisted reproduction. Reprod. Biomed. Online 2004, 9, 338–347. [Google Scholar] [CrossRef]
  12. Gupta, S.; Agarwal, A.; Krajcir, N.; Alvarez, J.G. Role of oxidative stress in endometriosis. Reprod. Biomed. Online 2006, 13, 126–134. [Google Scholar] [CrossRef]
  13. Abolaji, A.O.; Ojo, M.; Afolabi, T.T.; Arowoogun, M.D.; Nwawolor, D.; Farombi, E.O. Protective properties of 6-gingerol-rich fraction from Zingiber officinale (Ginger) on chlorpyrifos-induced oxidative damage and inflammation in the brain, ovary and uterus of rats. Chem. Biol. Interact. 2017, 270, 15–23. [Google Scholar] [CrossRef]
  14. Gupta, S.; Agarwal, A.; Banerjee, J.; Alvarez, J.G. The role of oxidative stress in spontaneous abortion and recurrent pregnancy loss: A systematic review. Obstet. Gynecol. Surv. 2007, 62, 335–347, quiz 353–334. [Google Scholar] [CrossRef] [Green Version]
  15. Lu, J.; Wang, Z.; Cao, J.; Chen, Y.; Dong, Y. A novel and compact review on the role of oxidative stress in female reproduction. Reprod. Biol. Endocrinol. 2018, 16, 80. [Google Scholar] [CrossRef]
  16. Hoesel, B.; Schmid, J.A. The complexity of NF-κB signaling in inflammation and cancer. Mol. Cancer 2013, 12, 86. [Google Scholar] [CrossRef] [Green Version]
  17. Burgering, B.M.; Medema, R.H. Decisions on life and death: FOXO Forkhead transcription factors are in command when PKB/Akt is off duty. J. Leukoc. Biol. 2003, 73, 689–701. [Google Scholar] [CrossRef]
  18. Curtis, C.; Landis, G.N.; Folk, D.; Wehr, N.B.; Hoe, N.; Waskar, M.; Abdueva, D.; Skvortsov, D.; Ford, D.; Luu, A.; et al. Transcriptional profiling of MnSOD-mediated lifespan extension in Drosophila reveals a species-general network of aging and metabolic genes. Genome Biol. 2007, 8, R262. [Google Scholar] [CrossRef] [Green Version]
  19. Peternelj, T.T.; Marsh, S.A.; Morais, C.; Small, D.M.; Dalbo, V.J.; Tucker, P.S.; Coombes, J.S. O-GlcNAc protein modification in C2C12 myoblasts exposed to oxidative stress indicates parallels with endogenous antioxidant defense. Biochem. Cell Biol. Biochim. Biol. Cell. 2015, 93, 63–73. [Google Scholar] [CrossRef]
  20. Kajihara, T.; Brosens, J.J.; Ishihara, O. The role of FOXO1 in the decidual transformation of the endometrium and early pregnancy. Med. Mol. Morphol. 2013, 46, 61–68. [Google Scholar] [CrossRef]
  21. Pearen, M.A.; Myers, S.A.; Raichur, S.; Ryall, J.G.; Lynch, G.S.; Muscat, G.E. The orphan nuclear receptor, NOR-1, a target of beta-adrenergic signaling, regulates gene expression that controls oxidative metabolism in skeletal muscle. Endocrinology 2008, 149, 2853–2865. [Google Scholar] [CrossRef] [PubMed] [Green Version]
  22. Kolmus, K.; Tavernier, J.; Gerlo, S. β2-Adrenergic receptors in immunity and inflammation: stressing NF-κB. Brain Behav. Immun. 2015, 45, 297–310. [Google Scholar] [CrossRef] [PubMed]
  23. Fagerholm, V.; Rokka, J.; Nyman, L.; Sallinen, J.; Tiihonen, J.; Tupala, E.; Haaparanta, M.; Hietala, J. Autoradiographic characterization of alpha(2C)-adrenoceptors in the human striatum. Synapse 2008, 62, 508–515. [Google Scholar] [CrossRef] [PubMed]
  24. Xia, B.; Chen, C.; Zhang, H.; Xue, W.; Tang, J.; Tao, W.; Wu, R.; Ren, L.; Wang, W.; Chen, G. Chronic stress prior to pregnancy potentiated long-lasting postpartum depressive-like behavior, regulated by Akt-mTOR signaling in the hippocampus. Sci. Rep. 2016, 6, 35042. [Google Scholar] [CrossRef] [Green Version]
  25. Goldstein, J.M.; Holsen, L.; Huang, G.; Hammond, B.D.; James-Todd, T.; Cherkerzian, S.; Hale, T.M.; Handa, R.J. Prenatal stress-immune programming of sex differences in comorbidity of depression and obesity/metabolic syndrome. Dialogues Clin. Neurosci. 2016, 18, 425–436. [Google Scholar]
  26. Guzel, E.; Arlier, S.; Guzeloglu-Kayisli, O.; Tabak, M.S.; Ekiz, T.; Semerci, N.; Larsen, K.; Schatz, F.; Lockwood, C.J.; Kayisli, U.A. Endoplasmic Reticulum Stress and Homeostasis in Reproductive Physiology and Pathology. Int. J. Mol. Sci. 2017, 18, 792. [Google Scholar] [CrossRef] [Green Version]
  27. Zafir, A.; Banu, N. Modulation of in vivo oxidative status by exogenous corticosterone and restraint stress in rats. Stress 2009, 12, 167–177. [Google Scholar] [CrossRef]
  28. Joseph, D.N.; Whirledge, S. Stress and the HPA Axis: Balancing Homeostasis and Fertility. Int. J. Mol. Sci. 2017, 18, 2224. [Google Scholar] [CrossRef]
  29. Cort, A.; Ozben, T.; Saso, L.; De Luca, C.; Korkina, L. Redox Control of Multidrug Resistance and Its Possible Modulation by Antioxidants. Oxid. Med. Cell. Longev. 2016, 2016, 4251912. [Google Scholar] [CrossRef] [Green Version]
  30. de Kloet, E.R.; Otte, C.; Kumsta, R.; Kok, L.; Hillegers, M.H.; Hasselmann, H.; Kliegel, D.; Joëls, M. Stress and Depression: A Crucial Role of the Mineralocorticoid Receptor. J. Neuroendocrinol. 2016, 28. [Google Scholar] [CrossRef]
  31. Schmidt, K.L.; Macdougall-Shackleton, E.A.; Soma, K.K.; Macdougall-Shackleton, S.A. Developmental programming of the HPA and HPG axes by early-life stress in male and female song sparrows. Gen. Comp. Endocrinol. 2014, 196, 72–80. [Google Scholar] [CrossRef] [PubMed]
  32. Leeners, B.; Geary, N.; Tobler, P.N.; Asarian, L. Ovarian hormones and obesity. Hum. Reprod. Update 2017, 23, 300–321. [Google Scholar] [CrossRef] [PubMed]
  33. Morris, A. Anxiety-induced weight loss. Nat. Rev. Endocrinol. 2019, 15, 130. [Google Scholar] [PubMed]
  34. Li, Y.; Jiang, W.; Li, Z.Z.; Zhang, C.; Huang, C.; Yang, J.; Kong, G.Y.; Li, Z.F. Repetitive restraint stress changes spleen immune cell subsets through glucocorticoid receptor or beta-adrenergic receptor in a stage dependent manner. Biochem. Biophys. Res. Commun. 2018, 495, 1108–1114. [Google Scholar] [CrossRef]
  35. Kodogo, V.; Azibani, F.; Sliwa, K. Role of pregnancy hormones and hormonal interaction on the maternal cardiovascular system: A literature review. Clin. Res. Cardiol. 2019, 108, 831–846. [Google Scholar] [CrossRef] [PubMed]
  36. Jin, L.Y.; Lv, Z.D.; Wang, K.; Qian, L.; Song, X.X.; Li, X.F.; Shen, H.X. Estradiol Alleviates Intervertebral Disc Degeneration through Modulating the Antioxidant Enzymes and Inhibiting Autophagy in the Model of Menopause Rats. Oxid. Med. Cell. Longev. 2018, 2018, 7890291. [Google Scholar] [CrossRef] [Green Version]
  37. Lambrinoudaki, I.V.; Augoulea, A.; Christodoulakos, G.E.; Economou, E.V.; Kaparos, G.; Kontoravdis, A.; Papadias, C.; Creatsas, G. Measurable serum markers of oxidative stress response in women with endometriosis. Fertil. Steril. 2009, 91, 46–50. [Google Scholar] [CrossRef]
  38. Prieto, L.; Quesada, J.F.; Cambero, O.; Pacheco, A.; Pellicer, A.; Codoceo, R.; Garcia-Velasco, J.A. Analysis of follicular fluid and serum markers of oxidative stress in women with infertility related to endometriosis. Fertil. Steril. 2012, 98, 126–130. [Google Scholar] [CrossRef]
  39. Londero, A.P.; Orsaria, M.; Marzinotto, S.; Grassi, T.; Fruscalzo, A.; Calcagno, A.; Bertozzi, S.; Nardini, N.; Stella, E.; Lellé, R.J.; et al. Placental aging and oxidation damage in a tissue micro-array model: An immunohistochemistry study. Histochem. Cell Biol. 2016, 146, 191–204. [Google Scholar] [CrossRef] [Green Version]
  40. Kwak-Kim, J.; Bao, S.; Lee, S.K.; Kim, J.W.; Gilman-Sachs, A. Immunological modes of pregnancy loss: Inflammation, immune effectors, and stress. Am. J. Reprod. Immunol. 2014, 72, 129–140. [Google Scholar] [CrossRef]
  41. Doukali, H.; Ben Salah, G.; Hamdaoui, L.; Hajjaji, M.; Tabebi, M.; Ammar-Keskes, L.; Masmoudi, M.E.; Kamoun, H. Oxidative stress and glutathione S-transferase genetic polymorphisms in medical staff professionally exposed to ionizing radiation. Int. J. Radiat. Biol. 2017, 93, 697–704. [Google Scholar] [CrossRef]
  42. Sies, H.; Berndt, C.; Jones, D.P. Oxidative Stress. Annu. Rev. Biochem. 2017, 86, 715–748. [Google Scholar] [CrossRef]
  43. Kaestner, K.H.; Knochel, W.; Martinez, D.E. Unified nomenclature for the winged helix/forkhead transcription factors. Genes Dev. 2000, 14, 142–146. [Google Scholar]
  44. Brunet, A.; Bonni, A.; Zigmond, M.J.; Lin, M.Z.; Juo, P.; Hu, L.S.; Anderson, M.J.; Arden, K.C.; Blenis, J.; Greenberg, M.E. Akt promotes cell survival by phosphorylating and inhibiting a Forkhead transcription factor. Cell 1999, 96, 857–868. [Google Scholar] [CrossRef] [Green Version]
  45. Tsuchiya, K.; Westerterp, M.; Murphy, A.J.; Subramanian, V.; Ferrante, A.W., Jr.; Tall, A.R.; Accili, D. Expanded granulocyte/monocyte compartment in myeloid-specific triple FoxO knockout increases oxidative stress and accelerates atherosclerosis in mice. Circ. Res. 2013, 112, 992–1003. [Google Scholar] [CrossRef] [Green Version]
  46. He, W.; Zhang, A.; Qi, L.; Na, C.; Jiang, R.; Fan, Z.; Chen, J. FOXO1, a Potential Therapeutic Target, Regulates Autophagic Flux, Oxidative Stress, Mitochondrial Dysfunction, and Apoptosis in Human Cholangiocarcinoma QBC939 Cells. Cell. Physiol. Biochem. 2018, 45, 1506–1514. [Google Scholar] [CrossRef]
  47. Grinius, L.; Kessler, C.; Schroeder, J.; Handwerger, S. Forkhead transcription factor FOXO1A is critical for induction of human decidualization. J. Endocrinol. 2006, 189, 179–187. [Google Scholar] [CrossRef] [Green Version]
  48. Chen, C.P.; Chen, C.Y.; Wu, Y.H.; Chen, C.Y. Oxidative stress reduces trophoblast FOXO1 and integrin beta3 expression that inhibits cell motility. Free Radic. Biol. Med. 2018, 124, 189–198. [Google Scholar] [CrossRef]
  49. Kuscu, N.; Celik-Ozenci, C. FOXO1, FOXO3, AND FOXO4 are differently expressed during mouse oocyte maturation and preimplantation embryo development. Gene Expr. Patterns 2015, 18, 16–20. [Google Scholar] [CrossRef]
  50. Martin, B.; Mattson, M.P.; Maudsley, S. Caloric restriction and intermittent fasting: Two potential diets for successful brain aging. Ageing Res. Rev. 2006, 5, 332–353. [Google Scholar] [CrossRef] [Green Version]
  51. Manolopoulos, K.N.; Klotz, L.O.; Korsten, P.; Bornstein, S.R.; Barthel, A. Linking Alzheimer’s disease to insulin resistance: The FoxO response to oxidative stress. Mol. Psychiatry 2010, 15, 1046–1052. [Google Scholar] [CrossRef] [PubMed] [Green Version]
  52. Rached, M.T.; Kode, A.; Xu, L.; Yoshikawa, Y.; Paik, J.H.; Depinho, R.A.; Kousteni, S. FoxO1 is a positive regulator of bone formation by favoring protein synthesis and resistance to oxidative stress in osteoblasts. Cell Metab. 2010, 11, 147–160. [Google Scholar] [CrossRef] [PubMed] [Green Version]
  53. Grabiec, A.M.; Angiolilli, C.; Hartkamp, L.M.; van Baarsen, L.G.; Tak, P.P.; Reedquist, K.A. JNK-dependent downregulation of FoxO1 is required to promote the survival of fibroblast-like synoviocytes in rheumatoid arthritis. Ann. Rheum. Dis. 2015, 74, 1763–1771. [Google Scholar] [CrossRef]
  54. Walsh, D.A.; Perkins, J.P.; Krebs, E.G. An adenosine 3’,5’-monophosphate-dependant protein kinase from rabbit skeletal muscle. J. Biol. Chem. 1968, 243, 3763–3765. [Google Scholar] [CrossRef]
  55. Xiao, R.P.; Ji, X.; Lakatta, E.G. Functional coupling of the beta 2-adrenoceptor to a pertussis toxin-sensitive G protein in cardiac myocytes. Mol. Pharmacol. 1995, 47, 322–329. [Google Scholar]
  56. Philipp, M.; Hein, L. Adrenergic receptor knockout mice: Distinct functions of 9 receptor subtypes. Pharmacol. Ther. 2004, 101, 65–74. [Google Scholar] [CrossRef]
  57. Bruzzone, M.E.; Fabres, C.; Benitez, D.A.; Castellon, E.A.; Zegers-Hochschild, F. Influence of embryonic conditioned media upon the endometrial beta-adrenergic receptor. Reprod. Biomed. Online 2005, 11, 58–63. [Google Scholar] [CrossRef]
  58. Yamazaki, S.; Miyoshi, N.; Kawabata, K.; Yasuda, M.; Shimoi, K. Quercetin-3-O-glucuronide inhibits noradrenaline-promoted invasion of MDA-MB-231 human breast cancer cells by blocking beta(2)-adrenergic signaling. Arch. Biochem. Biophys. 2014, 557, 18–27. [Google Scholar] [CrossRef]
  59. Madden, K.S. Catecholamines, sympathetic innervation, and immunity. Brain Behav. Immun. 2003, 17 (Suppl. S1), S5–S10. [Google Scholar] [CrossRef]
  60. McReynolds, J.R.; Vranjkovic, O.; Thao, M.; Baker, D.A.; Makky, K.; Lim, Y.; Mantsch, J.R. Beta-2 adrenergic receptors mediate stress-evoked reinstatement of cocaine-induced conditioned place preference and increases in CRF mRNA in the bed nucleus of the stria terminalis in mice. Psychopharmacology 2014, 231, 3953–3963. [Google Scholar] [CrossRef]
  61. Mills, P.J.; Adler, K.A.; Dimsdale, J.E.; Perez, C.J.; Ziegler, M.G.; Ancoli-Israel, S.; Patterson, T.L.; Grant, I. Vulnerable caregivers of Alzheimer disease patients have a deficit in beta 2-adrenergic receptor sensitivity and density. Am. J. Geriatr. Psychiatry 2004, 12, 281–286. [Google Scholar] [PubMed]
  62. Sivamani, R.K.; Pullar, C.E.; Manabat-Hidalgo, C.G.; Rocke, D.M.; Carlsen, R.C.; Greenhalgh, D.G.; Isseroff, R.R. Stress-mediated increases in systemic and local epinephrine impair skin wound healing: Potential new indication for beta blockers. PLoS Med. 2009, 6, e12. [Google Scholar] [CrossRef] [PubMed] [Green Version]
  63. Long, Q.; Liu, X.; Qi, Q.; Guo, S.W. Chronic stress accelerates the development of endometriosis in mouse through adrenergic receptor beta2. Hum. Reprod. 2016, 31, 2506–2519. [Google Scholar] [CrossRef] [PubMed] [Green Version]
  64. Xiao, M.B.; Jin, D.D.; Jiao, Y.J.; Ni, W.K.; Liu, J.X.; Qu, L.S.; Lu, C.H.; Ni, R.Z.; Jiang, F.; Chen, W.C. beta2-AR regulates the expression of AKR1B1 in human pancreatic cancer cells and promotes their proliferation via the ERK1/2 pathway. Mol. Biol. Rep. 2018, 1, 1863–1871. [Google Scholar] [CrossRef] [PubMed]
  65. Johnson, M. Molecular mechanisms of beta(2)-adrenergic receptor function, response, and regulation. J. Allergy Clin. Immunol. 2006, 117, 18–24, quiz 25. [Google Scholar] [CrossRef]
  66. Mantyh, P.W.; Rogers, S.D.; Allen, C.J.; Catton, M.D.; Ghilardi, J.R.; Levin, L.A.; Maggio, J.E.; Vigna, S.R. Beta 2-adrenergic receptors are expressed by glia in vivo in the normal and injured central nervous system in the rat, rabbit, and human. J. Neurosci. 1995, 15, 152–164. [Google Scholar]
  67. Pullar, C.E.; Rizzo, A.; Isseroff, R.R. beta-Adrenergic receptor antagonists accelerate skin wound healing: Evidence for a catecholamine synthesis network in the epidermis. J. Biol. Chem. 2006, 281, 21225–21235. [Google Scholar] [CrossRef] [Green Version]
  68. Farmer, P.; Pugin, J. beta-adrenergic agonists exert their “anti-inflammatory” effects in monocytic cells through the IκB/NF-κB pathway. Am. J. Physiol. 2000, 279, L675–L682. [Google Scholar]
  69. Gavrilyuk, V.; Dello Russo, C.; Heneka, M.T.; Pelligrino, D.; Weinberg, G.; Feinstein, D.L. Norepinephrine increases I κ B alpha expression in astrocytes. J. Biol. Chem. 2002, 277, 29662–29668. [Google Scholar] [CrossRef] [Green Version]
  70. Sharma, M.; Flood, P.M. β-arrestin2 regulates the anti-inflammatory effects of Salmeterol in lipopolysaccharide-stimulated BV2 cells. J. Neuroimmunol. 2018, 325, 10–19. [Google Scholar] [CrossRef]
  71. Gao, H.; Sun, Y.; Wu, Y.; Luan, B.; Wang, Y.; Qu, B.; Pei, G. Identification of beta-arrestin2 as a G protein-coupled receptor-stimulated regulator of NF-κB pathways. Mol. Cell 2004, 14, 303–317. [Google Scholar] [CrossRef]
  72. Chandrasekar, B.; Marelli-Berg, F.M.; Tone, M.; Bysani, S.; Prabhu, S.D.; Murray, D.R. Beta-adrenergic stimulation induces interleukin-18 expression via beta2-AR, PI3K, Akt, IKK, and NF-κB. Biochem. Biophys. Res. Commun. 2004, 319, 304–311. [Google Scholar] [CrossRef] [PubMed]
  73. Kong, Y.; Ruan, L.; Qian, L.; Liu, X.; Le, Y. Norepinephrine promotes microglia to uptake and degrade amyloid beta peptide through upregulation of mouse formyl peptide receptor 2 and induction of insulin-degrading enzyme. J. Neurosci. 2010, 30, 11848–11857. [Google Scholar] [CrossRef] [PubMed] [Green Version]
  74. Freddolino, P.L.; Kalani, M.Y.; Vaidehi, N.; Floriano, W.B.; Hall, S.E.; Trabanino, R.J.; Kam, V.W.; Goddard, W.A. 3rd. Predicted 3D structure for the human beta 2 adrenergic receptor and its binding site for agonists and antagonists. Proc. Natl. Acad. Sci. USA 2004, 101, 2736–2741. [Google Scholar] [CrossRef] [PubMed] [Green Version]
  75. Zhang, W.; Yano, N.; Deng, M.; Mao, Q.; Shaw, S.K.; Tseng, Y.T. beta-Adrenergic receptor-PI3K signaling crosstalk in mouse heart: Elucidation of immediate downstream signaling cascades. PLoS ONE 2011, 6, e26581. [Google Scholar]
  76. Siqueira, M.F.; Li, J.; Chehab, L.; Desta, T.; Chino, T.; Krothpali, N.; Behl, Y.; Alikhani, M.; Yang, J.; Braasch, C.; et al. Impaired wound healing in mouse models of diabetes is mediated by TNF-alpha dysregulation and associated with enhanced activation of forkhead box O1 (FOXO1). Diabetologia 2010, 53, 378–388. [Google Scholar]
  77. Shi, X.; Wang, X.; Li, Q.; Su, M.; Chew, E.; Wong, E.T.; Lacza, Z.; Radda, G.K.; Tergaonkar, V.; Han, W. Nuclear factor κB (NF-κB) suppresses food intake and energy expenditure in mice by directly activating the Pomc promoter. Diabetologia 2013, 56, 925–936. [Google Scholar] [CrossRef] [Green Version]
  78. Perry, B.D.; Caldow, M.K.; Brennan-Speranza, T.C.; Sbaraglia, M.; Jerums, G.; Garnham, A.; Wong, C.; Levinger, P.; Asrar Ul Haq, M.; Hare, D.L.; et al. Muscle atrophy in patients with Type 2 Diabetes Mellitus: Roles of inflammatory pathways, physical activity and exercise. Exerc. Immunol. Rev. 2016, 22, 94–109. [Google Scholar]
  79. De Clercq, K.; Hennes, A.; Vriens, J. Isolation of Mouse Endometrial Epithelial and Stromal Cells for In Vitro Decidualization. J. Vis. Exp. 2017. [Google Scholar] [CrossRef] [Green Version]
  80. Lu, J.; Liu, G.; Wang, Z.; Cao, J.; Chen, Y.; Dong, Y. Restraint stress induces uterine microenvironment disorder in mice during early pregnancy through the β2-AR/cAMP/PKA pathway. Stress 2020, 1–15. [Google Scholar] [CrossRef]
Figure 1. Changes in body weight after restraint stress. Restraint stress caused a significant decrease in the weight gain of pregnant mothers. The data are expressed as the mean ± standard error of mean (SEM). # was used to denote extremely significant difference between stress and corresponding control groups (p < 0.01). Uppercase letters in the column (A, B, C, D) represent the differences between different ages in the stress group (p < 0.05). A (in the P15 group) represents the biggest value in the stress. Lowercase letters in the column (a, b, c) represent the differences between different ages in the control group (p < 0.05). a (in the P15) represents the biggest value in the control. Treatment groups are significantly different from each other if no labelling letter (a to e or A to E) is shared between groups. The X axis represents the days of pregnancy, NP5: Non-Pregnancy Day 5, P5: Pregnancy Day 5, P10: Pregnancy Day 10, P15: Pregnancy Day 15, P20: Pregnancy Day 20. Every group has 10 mice.
Ijms 22 01478 g001
Figure 2. Effect of restraint stress on organ index in pregnant mice. The liver, spleen, kidney, heart, ovary, uterus, and thymus were weighed. The organ index was expressed as the ratio of the weight of the organ to the body weight. The result showed that restraint stress caused a significant decrease in the organ index of the liver (A), spleen (B), thymus (C), ovary (F), and uterus (G), indicating that restraint stress affects the immune system, the digestive system, and the reproductive system. At the same time, the heart (D) index and kidney (E) index increased under restraint stress. In general, restraint stress may affect the function of the various systems of the body. The data were expressed as the mean ± SEM. Non-Pregnancy Day 5 (NP5) (nstress = 10, ncontrol = 10), Pregnancy Day 5 (P5) (nstress = 10, ncontrol = 10), Pregnancy Day 10 (P10) (nstress = 10, ncontrol = 10), Pregnancy Day 15 (P15) (nstress = 10, ncontrol = 10), and Pregnancy Day 20 (P20) (nstress = 10, ncontrol = 10). Lowercase letters in the column (a, b, c) represented the differences between NP5, P5, P10, P15, and P20 in the control group (p < 0.05), and uppercase letters in the column (A, B, C, D) represented the differences between NP5, P5, P10, P15, and P20 in the stress group (p < 0.05). * p < 0.05 and # p < 0.01 were used to denote the significance of the stress group compared with the corresponding control group.
Ijms 22 01478 g002
Figure 3. Changes in plasma hormone levels in pregnant mice. Restraint stress caused an increase in corticosterone (CORT) (A), norepinephrine (NE) (B), and blood glucose (C) levels but a decrease in oestradiol (E2) (D) in the plasma of pregnant mice. Restraint stress caused disorders of stress hormones and reproductive hormone levels, resulting in endocrine disorders. The data are expressed as the mean ± SEM. Lowercase letters in the column (a, b, c, d) represent the differences between NP5 (n = 10), P5 (n = 10), P10 (n = 10), P15 (n = 10), and P20 (n = 10) in the control group (p < 0.05), and uppercase letters in the column (A, B, C and D) represent the differences between NP5 (n = 10), P5 (n = 10), P10 (n = 10), P15 (n = 10), and P20 (n = 10) in the stress group (p < 0.05). * p < 0.05 and # p < 0.01 were used to denote the significance of the stress group compared with the corresponding age of the control group.
Ijms 22 01478 g003
Figure 4. Effects of restraint stress on the oxidative stress states in the uterus in pregnant mice. These graphs show the contents of total superoxide dismutase (T-SOD) (A), glutathione peroxidase (GSH-Px) (B), total antioxidant capacity (T-AOC) (C), and malondialdehyde (MDA) (D) in the uterus of the control and stress group at NP5, P5, P10, P15, and P20. Restraint stress reduced the levels of T-SOD (A), GSH-Px (B), and total antioxidant capacity (C) in pregnant mice, resulting in increased lipid peroxide MDA content (D). In conclusion, restraint stress reduced the antioxidant capacity of the uterus in pregnant mice. Values are expressed as the mean ± SEM. Lowercase letters in the column (a, b, c, d) represent the differences between NP5 (n = 10), P5 (n = 10), P10 (n = 10), P15 (n = 10), and P20 (n = 10) in the control group (p < 0.05), and uppercase letters in the column (A, B, C and D) represent the differences between NP5 (n = 10), P5 (n = 10), P10 (n = 10), P15 (n = 10), and P20 (n = 10) in the stress group (p < 0.05). * p < 0.05 and # p < 0.01 were used to denote the significance of the stress group compared with the corresponding control group.
Ijms 22 01478 g004
Figure 5. Effect of restraint stress on FOXO mRNA levels and FOXO1 protein in the uterus and ovary of pregnant mice. Restraint stress significantly increased the level of Forkhead transcription factor class O (FOXO) mRNA associated with oxidative stress in the ovary (A,C,E) and uterus (B,D,F), suggesting that the oxidative stress experienced by the body was excessive. Furthermore, the relative expression of FOXO1 was highest among FOXO, so the protein level of FOXO1 was detected by WB and significantly increased in the ovary (G) and uterus (H). The data are expressed as the mean ± SEM. Lowercase letters in the column (a, b, c and d) represent the differences between NP5 (n = 10), P5 (n = 10), P10 (n = 10), P15 (n = 10), and P20 (n = 10) in the control group (p < 0.05), and uppercase letters in the column (A, B, C, D and E) represent the differences between NP5 (n = 10), P5 (n = 10), P10 (n = 10), P15 (n = 10), and P20 (n = 10) in the stress group (p < 0.05). The value of NP1 was regard as 1 to be used as the base level of assessment. * p < 0.05 and # p < 0.01 were used to denote the significance of the stress group compared with the corresponding control group.
Ijms 22 01478 g005
Figure 6. Effect of restraint stress on β2-AR in the uterus and ovary of pregnant mice. Oxidative stress led to a significant increase in mRNA levels and protein expression of β2-AR in the ovary (A,C) and uterus (B,D) of pregnant mice, suggesting that oxidative stress caused the body’s G-protein coupled receptors to be activated. The mRNA levels of β2-AR were detected by quantitative real-time polymerase chain reaction (qRT-PCR), and the protein level of β2-AR was measured by WB. The data are expressed as the mean ± SEM. Lowercase letters in the column (a, b, c, d) represent the differences between NP5 (n = 10), P5 (n = 10), P10 (n = 10), P15 (n = 10), and P20 (n = 10) in the control group (p < 0.05), and uppercase letters in the column (A, B, C and D) represent the differences between NP5 (n = 10), P5 (n = 10), P10 (n = 10), P15 (n = 10), and P20 (n = 10) in the stress group (p < 0.05). The value of NP1 was regard as 1 to be used as the base level of assessment. * p < 0.05 and # p < 0.01 were used to denote the significance of the stress group compared with the corresponding control group.
Ijms 22 01478 g006
Figure 7. Immunohistochemical localization of FOXO1. To detect FOXO1 expression in the uterus, immunohistochemical localization was performed. A large number of positive cells were expressed in endometrial stromal cells of the uterus at NP5 (A,B), P5 (C,D), P10 (E,F), P15 (G,H), and P20 (I,J). The negative control (NC) were K (Control group) and L (Stress group). The yellow particles indicate positive cells. The scale bar is 50 μm.
Ijms 22 01478 g007
Figure 8. β2-AR activates FOXO1 and FOXO1 induced the expression of p-NF-κB p65/t-NF-κB p65 protein and its downstream inflammation genes. These protein bands of β2-AR, FOXO1, p-NF-κB p65, and t-NF-κB p65 in ESCs were tested by adding agonist and blocking agents (A). The protein levels of β2-AR increased after adding the agonists of β2-AR compared with the control cells (B). Interestingly, the protein levels of FOXO1 were obviously increased when β2-AR was activated but were significantly decreased when Butox was added to the cultured cells (C). It is worth noting that the protein expression of p-NF-κB p65/t-NF-κB p65 did not change when β2-AR was activated, but it increased when β2-AR was blocked by Butox, and it decreased significantly when FOXO1 was inhibited by AS1842865 (D). (E) The mRNA levels of IL-2, IL-6, and TNF-α in the uterus of pregnant mice at P5 after restraint stress and adding AS. (F) Protein band and quantitative analysis of p-NF-κB p65/t-NF-κB p65. Formoterol hemifumarate (For) is a selective agonist of β2-AR. Butox is the blocking agent of β2-AR, and AS1842865 is an inhibitor of FOXO1. Pyrrolidine dithiocarbamate ammonium (PDTC) is an inhibitor of NF-κB. DMSO is the solvent for the drugs. These data are expressed as the mean ± SEM. * p < 0.05 and ** p < 0.01 were used to denote the significance of the other groups compared with the corresponding control group (B). ++ p < 0.01 were used to denote the significance of other groups compared with the corresponding For group. $ p < 0.05 was used to denote the significance of other groups compared with the cell+For+Butox+AS group. Independent sample t test was performed, * p < 0.05 and # p < 0.01 were used to denote the significance of the stress group compared with the corresponding control group (E and F).
Ijms 22 01478 g008
Figure 9. The antioxidative levels and relative protein levels and the mediating role of FOXO1 in p-NF-κB p65 and β2-AR. Restraint stress caused disorder in the endocrine system, leading to a significant increase in levels of the oxidative stress-related factors FOXO and β2-AR and suggesting a cascade of oxidative stress in pregnant mothers under oxidative stress. β2-AR affected the activity of FOXO1 while inhibiting the activity of p-NF-κB p65 and then inhibited the target gene of p-NF-κB p65. FOXO1 may play an important mediating role between β2-AR and NF-κB p65. The upward arrow represents an increase, while the downward arrow represents a decrease.
Ijms 22 01478 g009
Publisher’s Note: MDPI stays neutral with regard to jurisdictional claims in published maps and institutional affiliations.

