Article

Therapeutic Potential of Mesenchymal Stem Cells in a Pre-Clinical Model of Diabetic Kidney Disease and Obesity

by
Christian Sávio-Silva
1,
Poliana E. Soinski-Sousa
1,
Antônio Simplício-Filho
1,
Rosana M. C. Bastos
1,
Stephany Beyerstedt
1 and
Érika Bevilaqua Rangel
1,2,*
1
Hospital Israelita Albert Einstein, São Paulo 05652-900, Brazil
2
Nephrology Division, Universidade Federal de São Paulo-Escola Paulista de Medicina, São Paulo 04023-900, Brazil
*
Author to whom correspondence should be addressed.
Int. J. Mol. Sci. 2021, 22(4), 1546; https://0-doi-org.brum.beds.ac.uk/10.3390/ijms22041546
Submission received: 5 November 2020 / Revised: 12 December 2020 / Accepted: 14 December 2020 / Published: 4 February 2021
(This article belongs to the Special Issue Molecular Mechanisms Involved in Diabetic Nephropathy)

Abstract

:
Diabetic kidney disease (DKD) is a worldwide microvascular complication of type 2 diabetes mellitus (T2DM). From several pathological mechanisms involved in T2DM-DKD, we focused on mitochondria damage induced by hyperglycemia-driven reactive species oxygen (ROS) accumulation and verified whether mesenchymal stem cells (MSCs) anti-oxidative, anti-apoptotic, autophagy modulation, and pro-mitochondria homeostasis therapeutic potential curtailed T2DM-DKD progression. For that purpose, we grew immortalized glomerular mesangial cells (GMCs) in hyper glucose media containing hydrogen peroxide. MSCs prevented these cells from apoptosis-induced cell death, ROS accumulation, and mitochondria membrane potential impairment. Additionally, MSCs recovered GMCs’ biogenesis and mitophagy-related gene expression that were downregulated by stress media. In BTBRob/ob mice, a robust model of T2DM-DKD and obesity, MSC therapy (1 × 10⁶ cells, two doses 4-weeks apart, intra-peritoneal route) led to functional and structural kidney improvement in a time-dependent manner. Therefore, MSC-treated animals exhibited lower levels of urinary albumin-to-creatinine ratio, less mesangial expansion, higher number of podocytes, up-regulation of mitochondria-related survival genes, a decrease in autophagy hyper-activation, and a potential decrease in cleaved-caspase 3 expression. Collectively, these novel findings have important implications for the advancement of cell therapy and provide insights into cellular and molecular mechanisms of MSC-based therapy in T2DM-DKD setting.

1. Introduction

Diabetes mellitus (DM) is a globally pandemic metabolic syndrome (prevalence of 9.3%, corresponding to 463 million adults aged 20–79 years, in 2019), with increasing annual worldwide prevalence at 10.9% (700 million) by 2045 [1]. Highly associated with metabolic diseases and a major risk factor for type 2 DM (T2DM), obesity has also reached pandemic levels in the last decades and contributes to aggravating the overall scenario [2]. T2DM (90% of all cases of DM) is a multifactorial disease, mainly characterized by hyperglycemia and insulin resistance, and ultimately to insulin secretion impairment. The well-established gold standard protocol to treat people affected by T2DM is strict glycemic control associated with lifestyle changes, as a risk reduction strategy [3]. However, uncontrolled and persistent hyperglycemia overwhelms metabolic pathways, leading to mesangial cell hypertrophy and proliferation, glomerular basement membrane thickening, podocytopathy, endothelial dysfunction, chronic inflammation, autophagy dysregulation, fibrosis, and oxidative stress signaling activation, triggering pathophysiological complications involved in diabetic kidney disease (DKD) progression [3,4].
DKD, one of the main DM microvascular complications, affects 30–40% of people with DM independently of treatment [4]. Besides increasing cardiovascular disease risk, DKD is the main cause of end stage kidney disease (ESKD) despite any conventional therapy being applied, which means time-dependent loss of kidney function and obligated substitutive intervention, including dialysis or kidney transplantation [5]. Essentially, DKD is a chronic and progressive condition, characterized by a progressive decrease in glomerular filtration rate with persistent and elevated proteinuria, which are associated with structural kidney damage [6].
Mitochondria are firstly and especially affected by hyperglycemia-driven reactive oxygen species (ROS) accumulation and redox disturbed signaling, being classified as one of the major factors leading to DM pathophysiology hallmarks [7]. Damaged mitochondria respond to stress by two mechanisms: a) molecular; synthesizing antioxidant enzymes and b) morphological; orchestrating the processes of biogenesis, mitophagy, fusion, fission, and motility [8]. Persistent stress overcomes mitochondria adaptation responses, leading to damage and dysfunction [9]. Dysfunctional mitochondria itself causes excessive ROS production, which affects remaining healthy mitochondria segments and possibly triggers a feedback-based vicious cycle of increasing damage, eventually leading to cell energy collapse [10]. As an alternative to clean up the dysfunctional mitochondria fragments and avoid energetic fail, mitophagy is a key player in preventing cell collapse and death induction, possibly as an important therapeutic target [11].
In order to upgrade DM-DKD treatment, mesenchymal stem cells (MSCs) have great reparative potential as a complement therapy to gold standard protocol [12]. Substantially, MSCs have demonstrated anti-oxidative and anti-apoptotic effects [13], through their secretome and mitochondria transfer to neighboring in-contact damaged cells [12]. MSCs promote anti-oxidant enzymes expression, decrease ROS production, and contribute to mitochondrial repair [14,15] and cell death inhibition [16]. In that way, we aimed to apply MSCs in a T2DM-DKD and obesity pre-clinical model using leptin-deficient BTBRob/ob (black and tan, brachyuric) mice, and verify their therapeutic potential for inhibiting oxidative stress and cell death over induction, as well as the contribution towards halting DKD progression.

2. Results

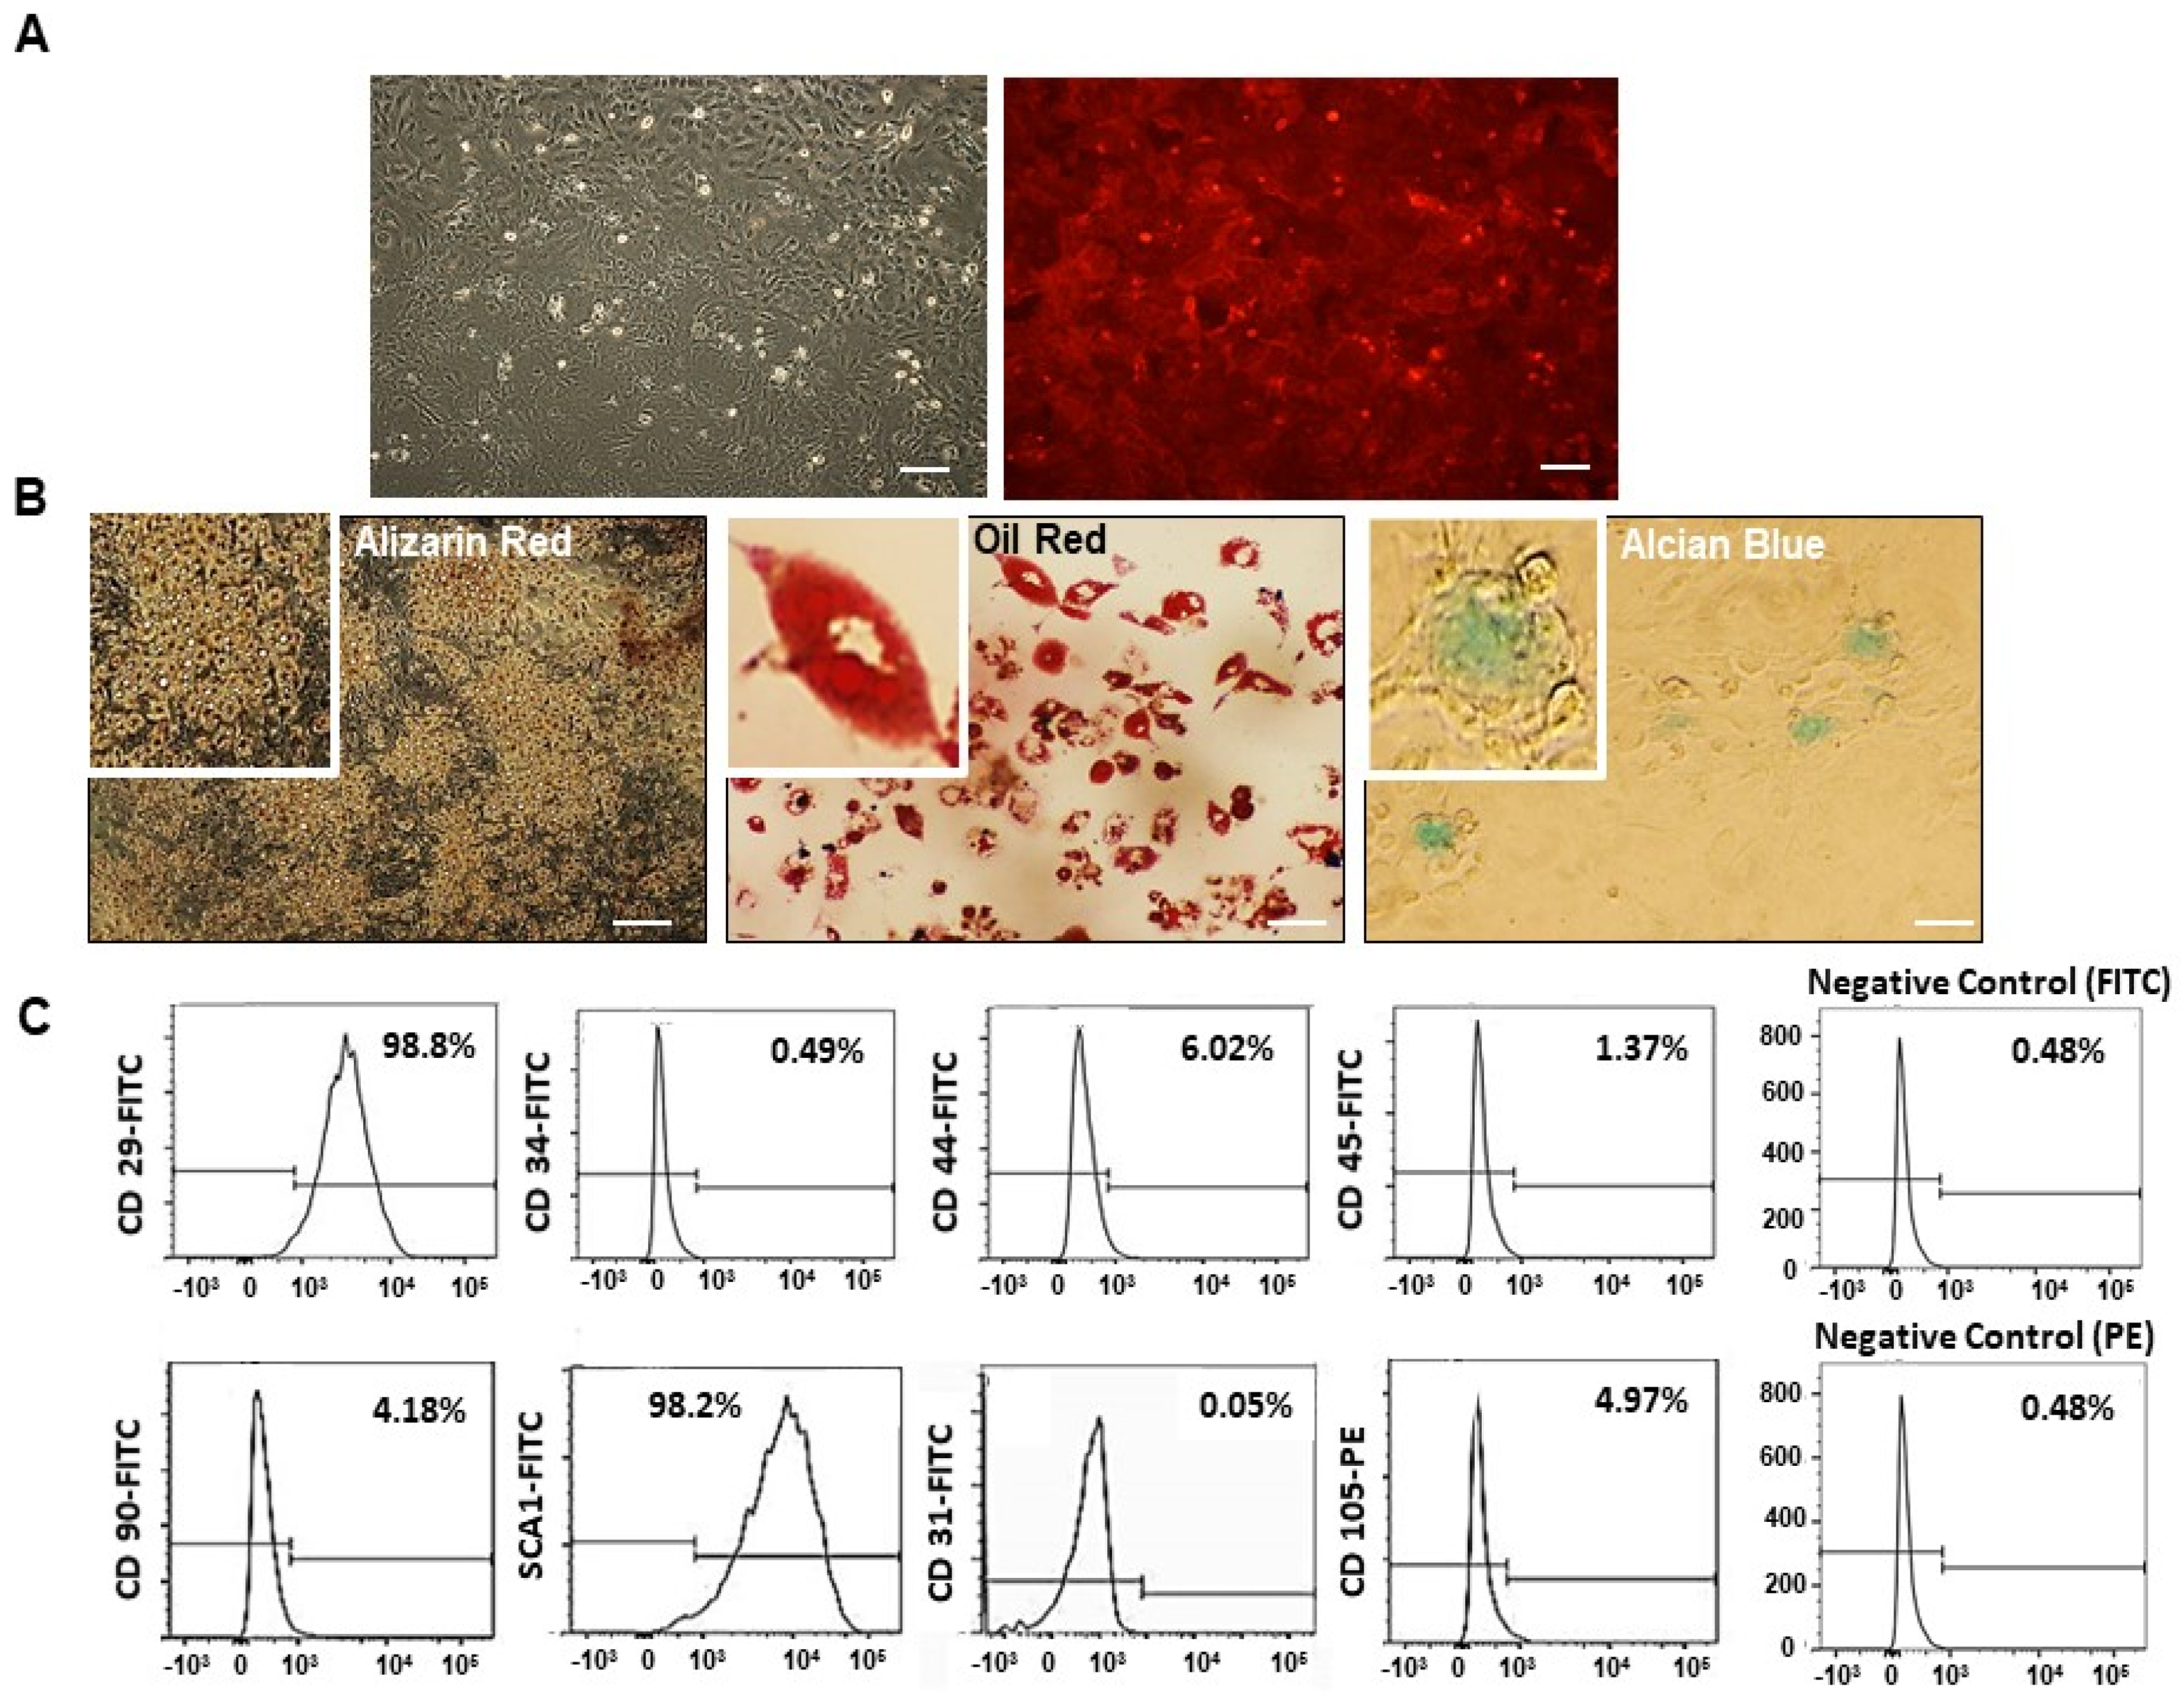
2.1. Mesenchymal Stem Cell (MSC) Characterization

We have successfully isolated and purified MSCs obtained from bone marrow (BM) of male mTmG mice. We characterized these cells through analysis of RFP+ expression maintenance on cell membranes, according to serial cell culture passages (Figure 1A); capacity of multi-differentiation capacity into osteogenic, adipogenic, and chondrogenic lineages (Figure 1B); and immunophenotyping analysis, confirming the expression of stem cell antigen markers and negative expression of hematopoietic lineage markers (Figure 1C).

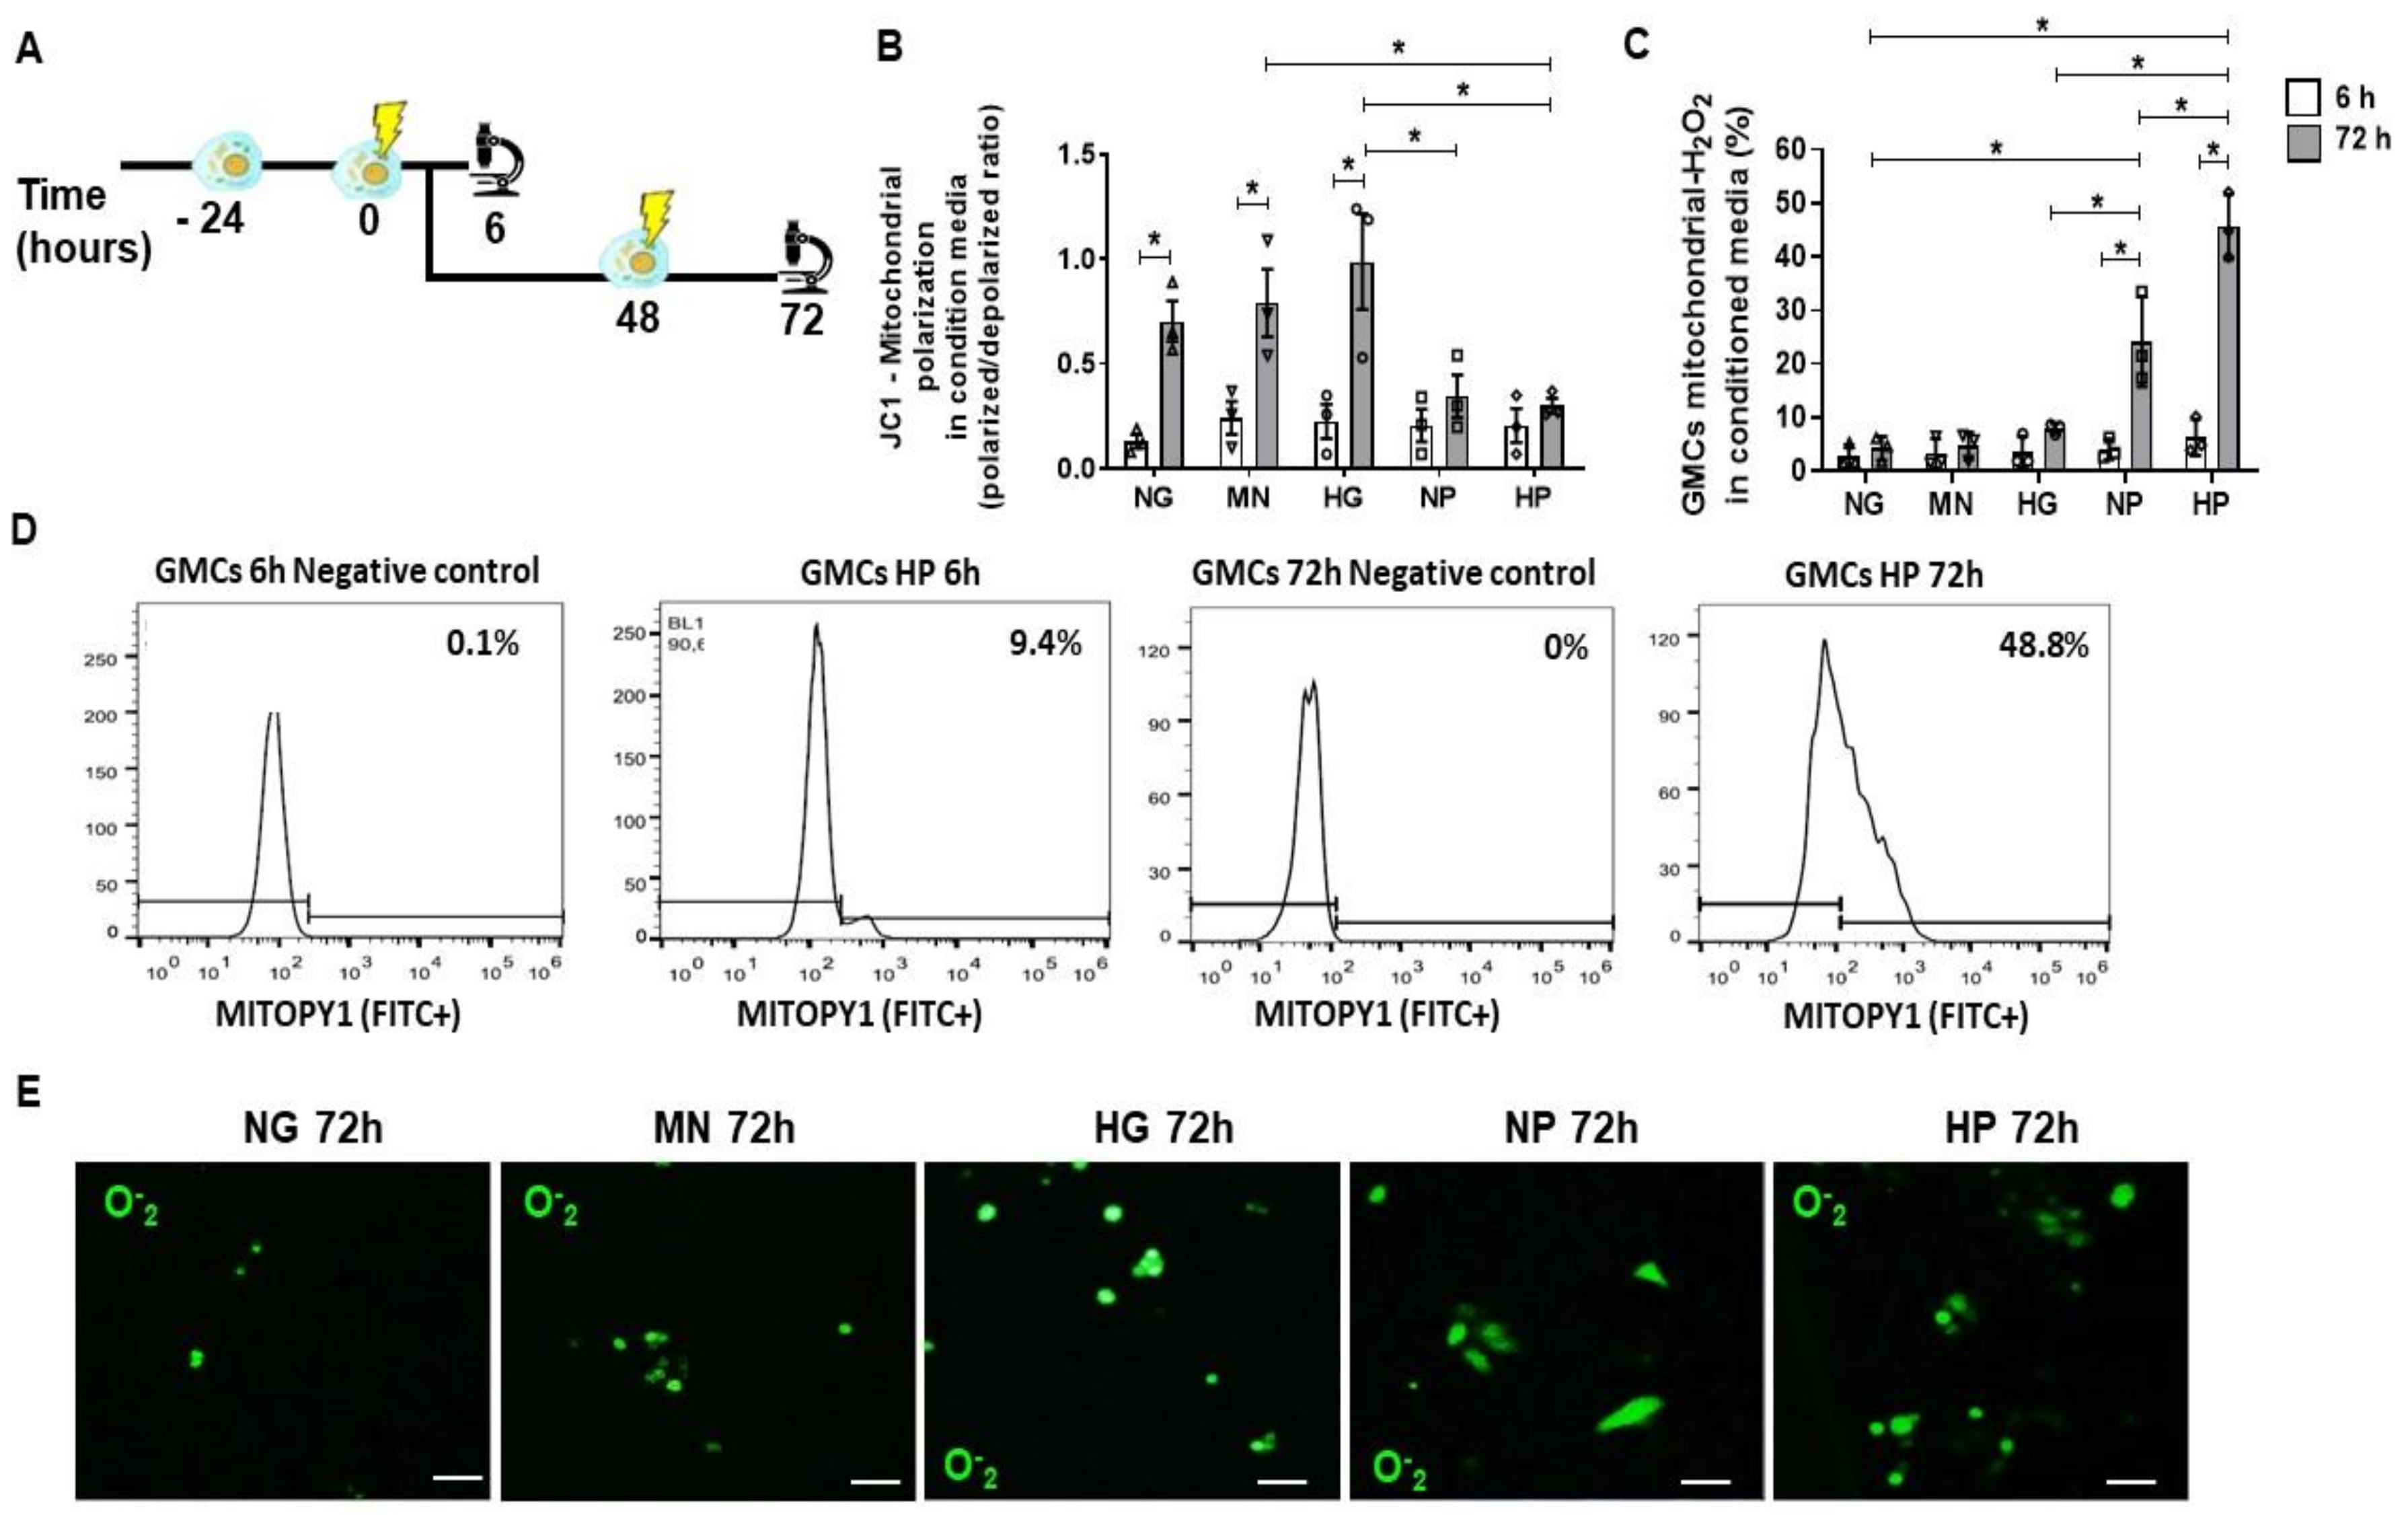
2.2. Mitochondrial Accumulation of H2O2 in Glomerular Mesangial Cells (GMCs) Following Stress Media Conditioning

We assessed the oxidative stress impact of the conditioning media on GMCs and GMCs’ mitochondria after 6 h and 72 h time-points. In the 6 h time-point, we aimed to evaluate the acute stress, while in the 72 h time-point, when the cells were exposed twice to the stress media, a chronic scenario associated with a repeated insult was mimicked. In Figure 2A, we described the schemes of these cellular experiments. Hyper glucose (HG) media resulted in an inducing effect, causing an increase in the mitochondrial polarization ratio after 72 h treatment, which indicates a possible higher demand of mitochondria working force (p < 0.05). On the other hand, NP (normal glucose + hydrogen peroxide) and HP (hyper glucose + hydrogen peroxide) media had a halting effect on mitochondria polarization throughout the 72 h culture evaluation in this mitochondrial function parameter, evidencing a possible damage-dependent loss of function (p < 0.05) (Figure 2B). GMCs had severe H2O2 accumulation into mitochondria after NP and HP 72 h-conditioning, illustrating a significant oxidative stress scenario (p < 0.05) (Figure 2C,D). As expected, HP conditioning is the worst scenario when compared to other groups (p < 0.05), indicating an additive effect of hyper glucose and H2O2. Additionally, NP and HP stress-conditioning caused an elevated O2 accumulation in GMCs’ cytoplasms in comparison to control groups (Figure 2E). Mannitol was used for osmolarity control (MN), whereas normal glucose (NG) was the control group.

2.3. Anti-Oxidative Effect of MSCs Co-Culture on GMCs Conditioned with Stress Media

To examine the anti-oxidative potential of MSC treatment on GMCs, we assessed the mitochondrial ROS accumulation after growing these cells with NP and HP media. In Figure 3A, we described the schemes of these cellular experiments with co-culture. Importantly, MSC co-culture, as a 24 h-treatment, was able to inhibit the H2O2 mitochondrial accumulation after 72 h conditioning, evidencing a notable anti-oxidative capacity (p < 0.05) (Figure 3B,C).

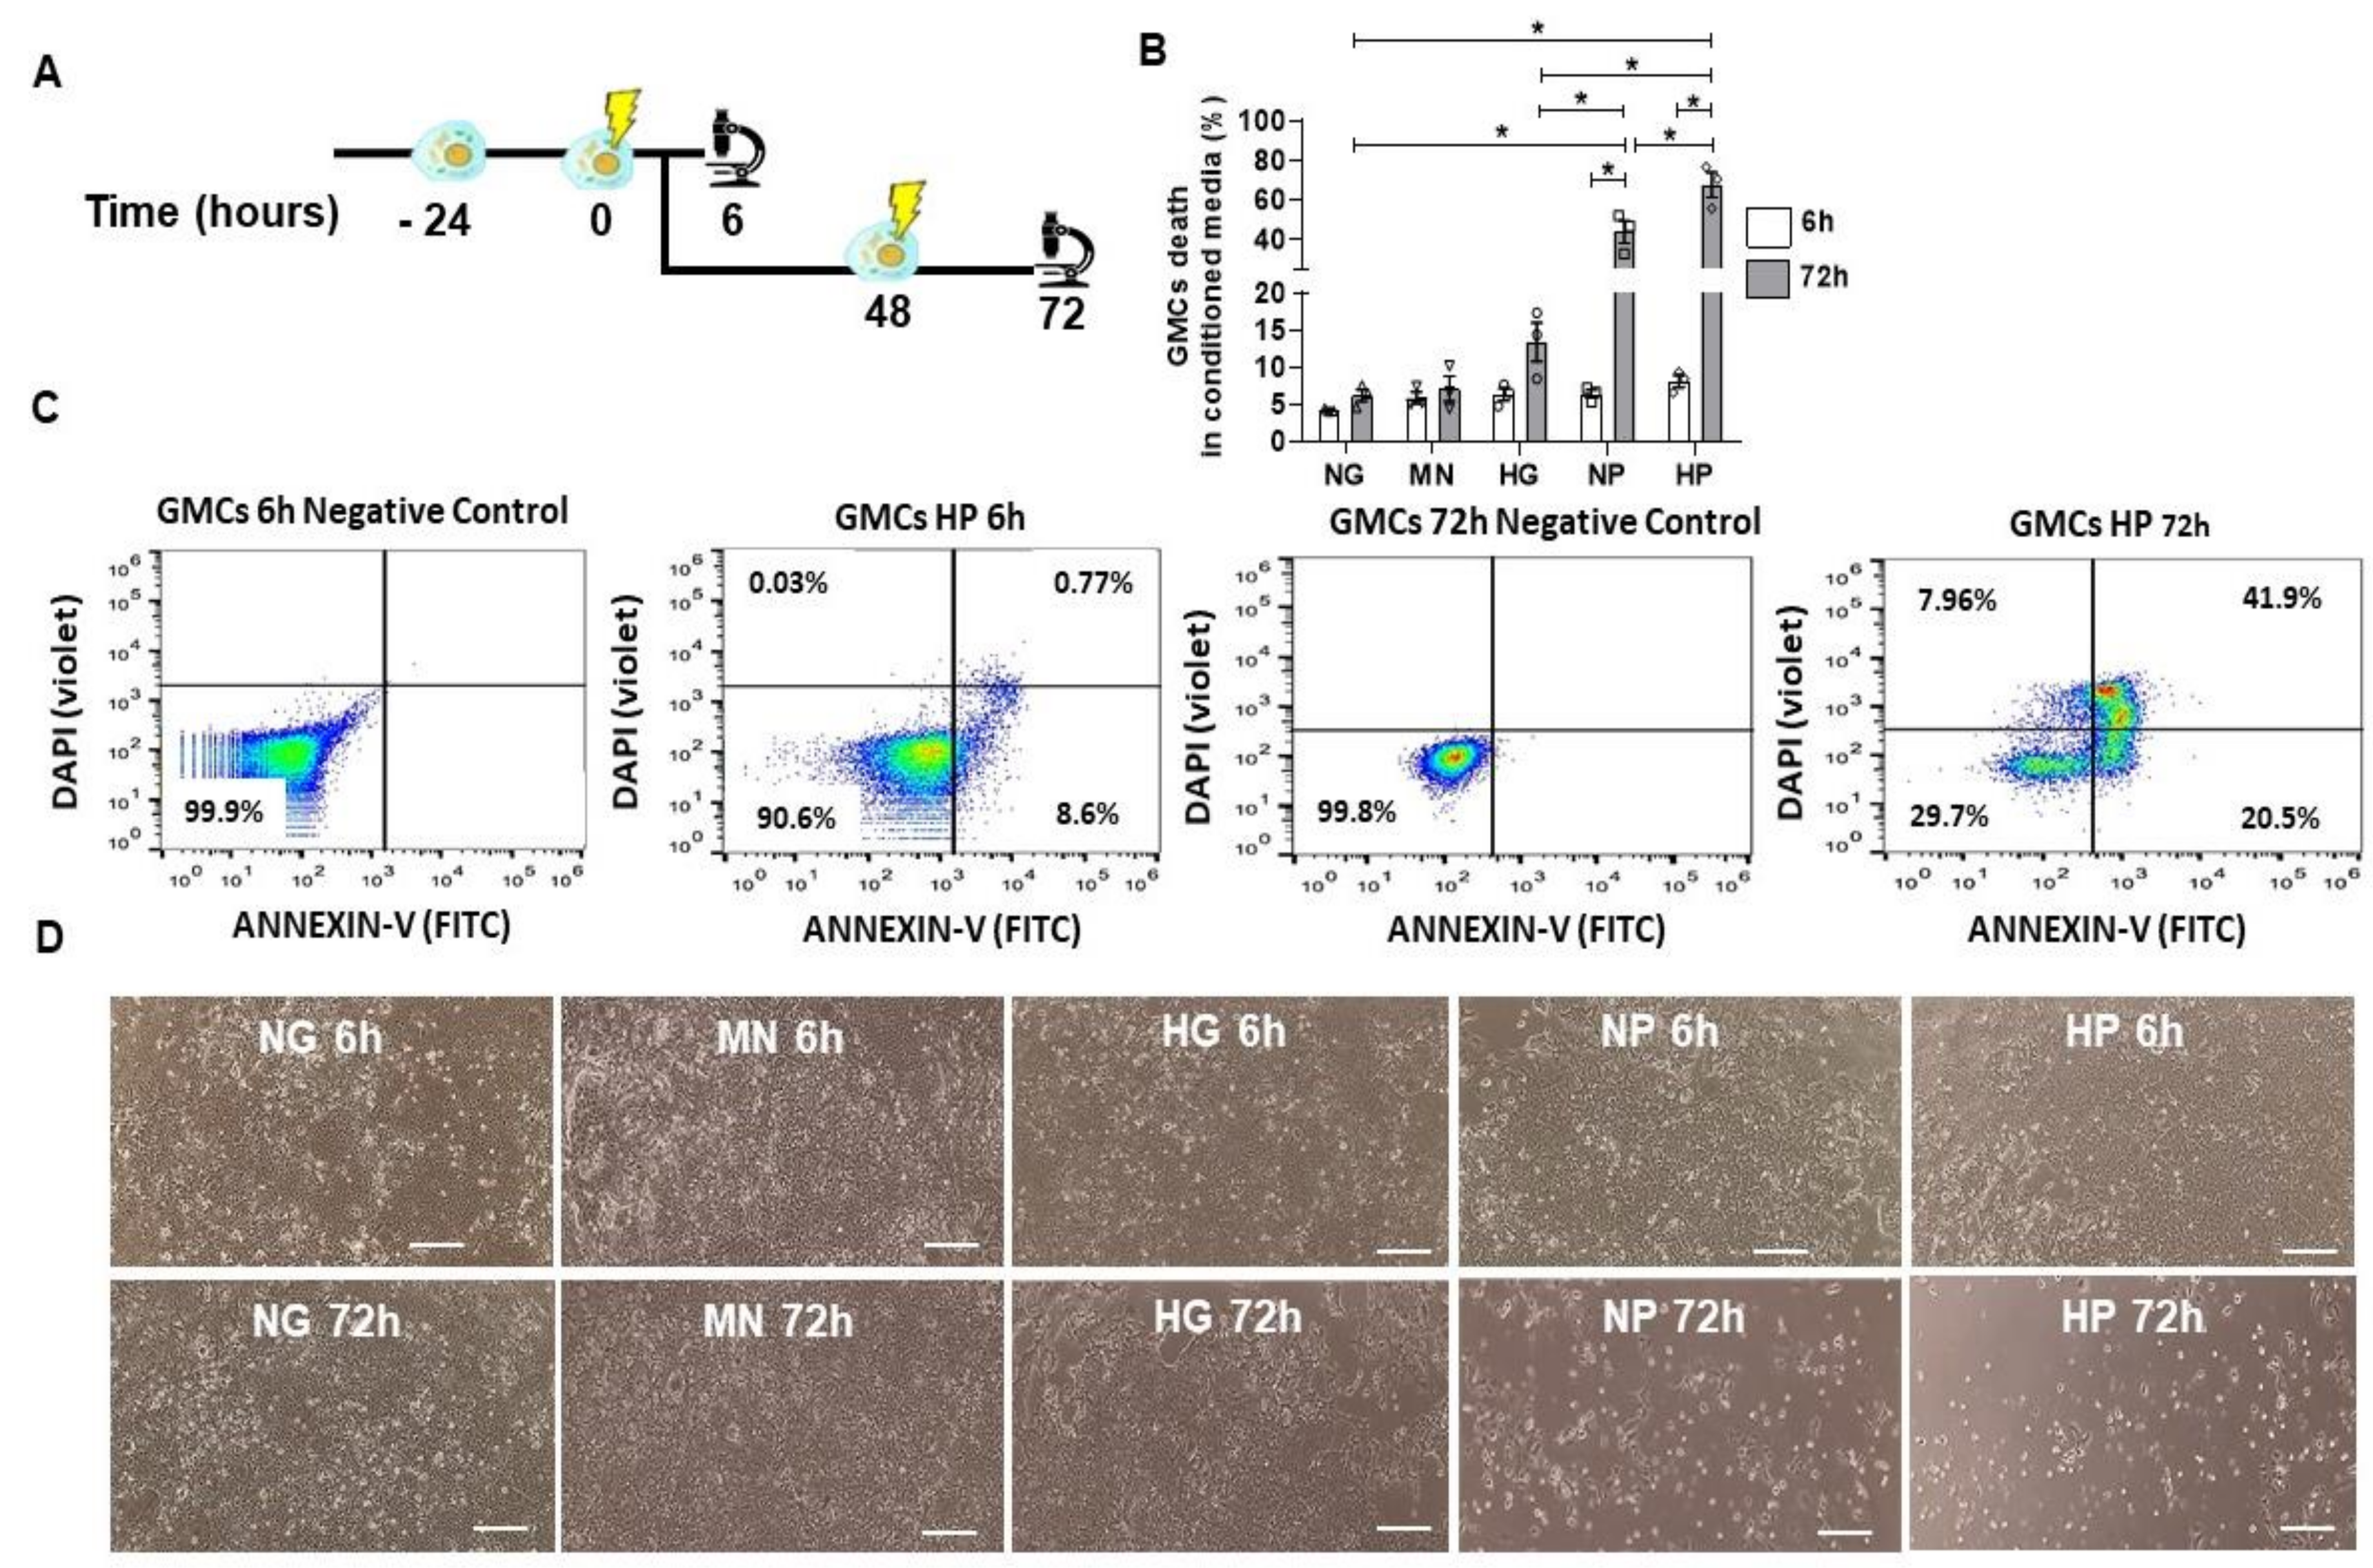
2.4. GMCs Death Induction after Stress-Conditioning Media

Next, we verified the impact of stress-conditioning media on cell death. In Figure 4A, we described the schemes of the cellular experiments. NP and HP markedly induced cell death (p < 0.05) in GMCs after 72 h-conditioning (Figure 4B). As expected, HP conditioning is the worst scenario when compared to other groups (p < 0.05), indicating an additive effect of hyper glucose and H2O2. For flow cytometry analysis, we used Annexin-V and DAPI to assess cell death for apoptosis and early necrosis assessment, respectively (Figure 4C). NP and HP media caused severe disturbances in GMCs’ morphology and growth after 72 h-conditioning (Figure 4D), inhibiting plate occupancy and negatively impacting cell shape by reducing cytoplasm and causing loss of fibroblast-like conformation. In the same time-point, HG-conditioned GMCs had similar alterations, but to less extent, such as disturbed growth on culture by cell stress induction and mild cell death increase.

2.5. Pro-Survival and Protective Effect of MSCs Co-Culture on Stress-Conditioned GMCs

To verify the anti-cell death potential of MSC treatment on GMCs, we assessed the apoptosis (Annexin) and early necrosis (DAPI) after growing these cells with NP and HP media. In Figure 5A, we described the schemes of these cellular experiments with co-culture. Importantly, MSC co-culture, as a 72 h-treatment, was able to decrease cell death in NP and HP media (p < 0.05) (Figure 5B–D), highlighting notable therapeutic potential of MSCs.

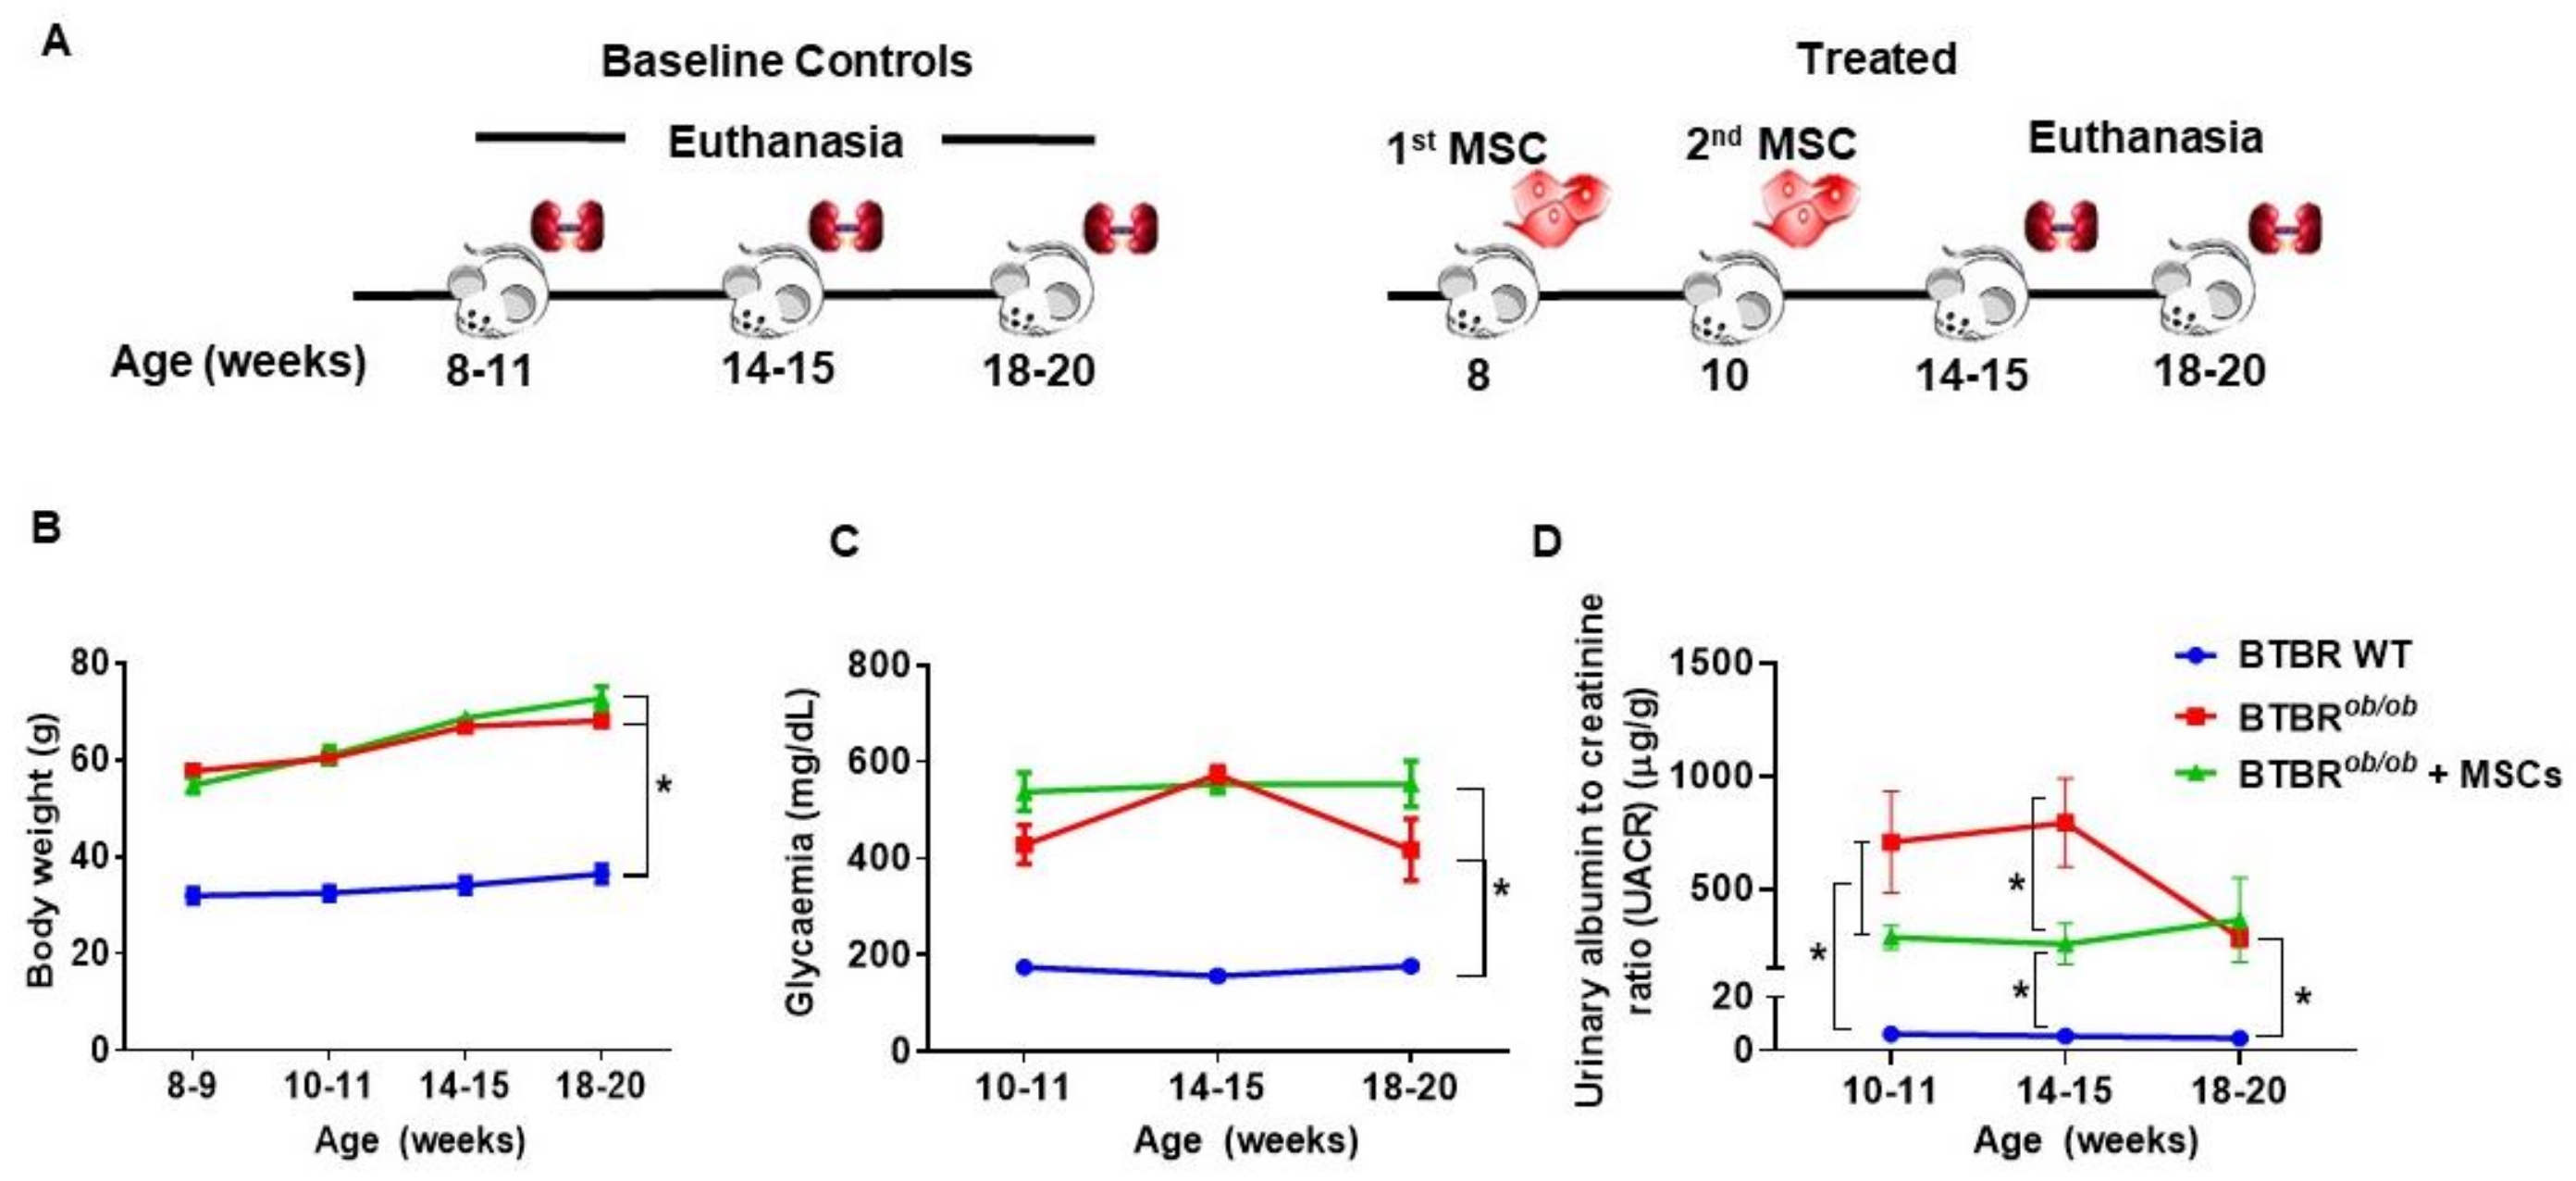
2.6. Metabolic and Renal Functional Parameters in BTBRob/ob Control and MSC-Treated BTBRob/ob Mice

To further substantiate the therapeutic potential of MSC on DKD progression, we injected these cells into BTBRob/ob mice at two time-points (8 weeks and 10 weeks). In Figure 6A, we illustrated the experimental protocol throughout the time. There were no evidences of MSCs’ effect in BTBRob/ob mice’s natural obesity (Figure 6B) and glucose control (Figure 6C), as an impact on time-dependent body weight gain and hyperglycemia (p > 0.05), yet a trend towards lower glycemic levels at 18–20 weeks after MSC treatment was observed. To note, MSCs significantly reduced urine albumin-to-creatinine ratio (UACR) in MSC-treated BTBRob/ob mice, showing an important renoprotective effect preventing the elevated albuminuria present in 14 week-old BTBRob/ob mice (p < 0.05) (Figure 6D).

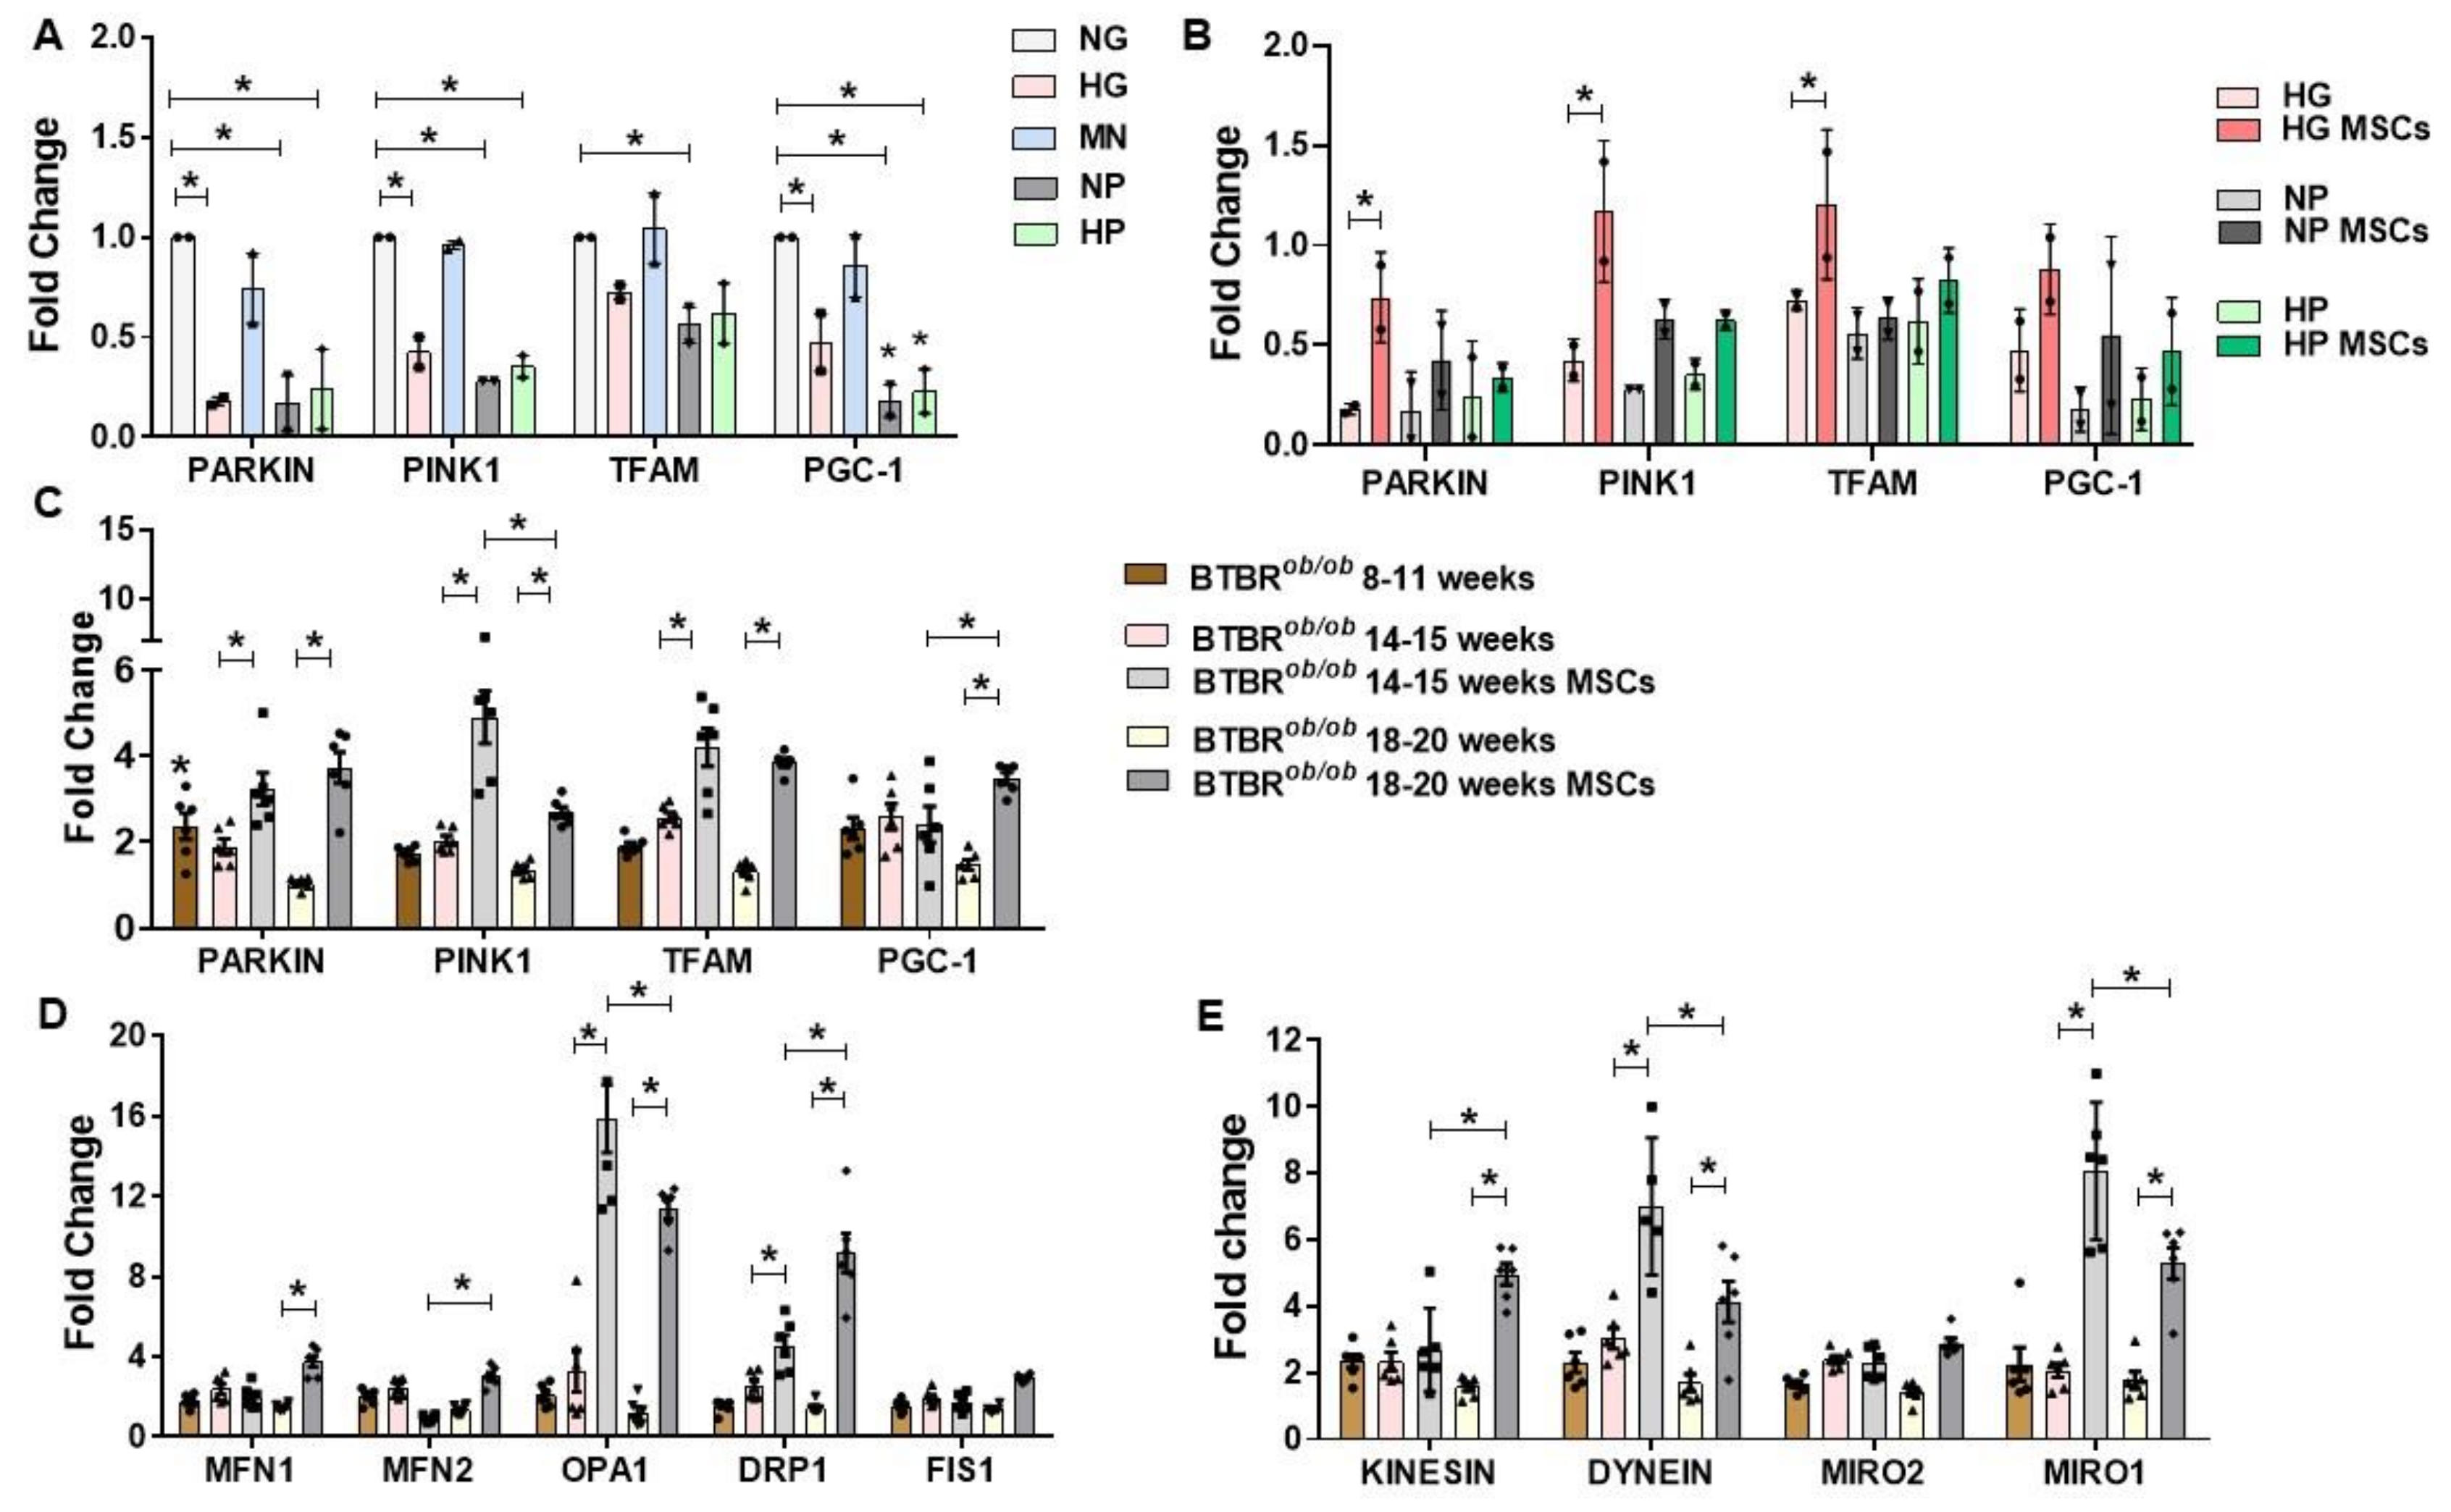
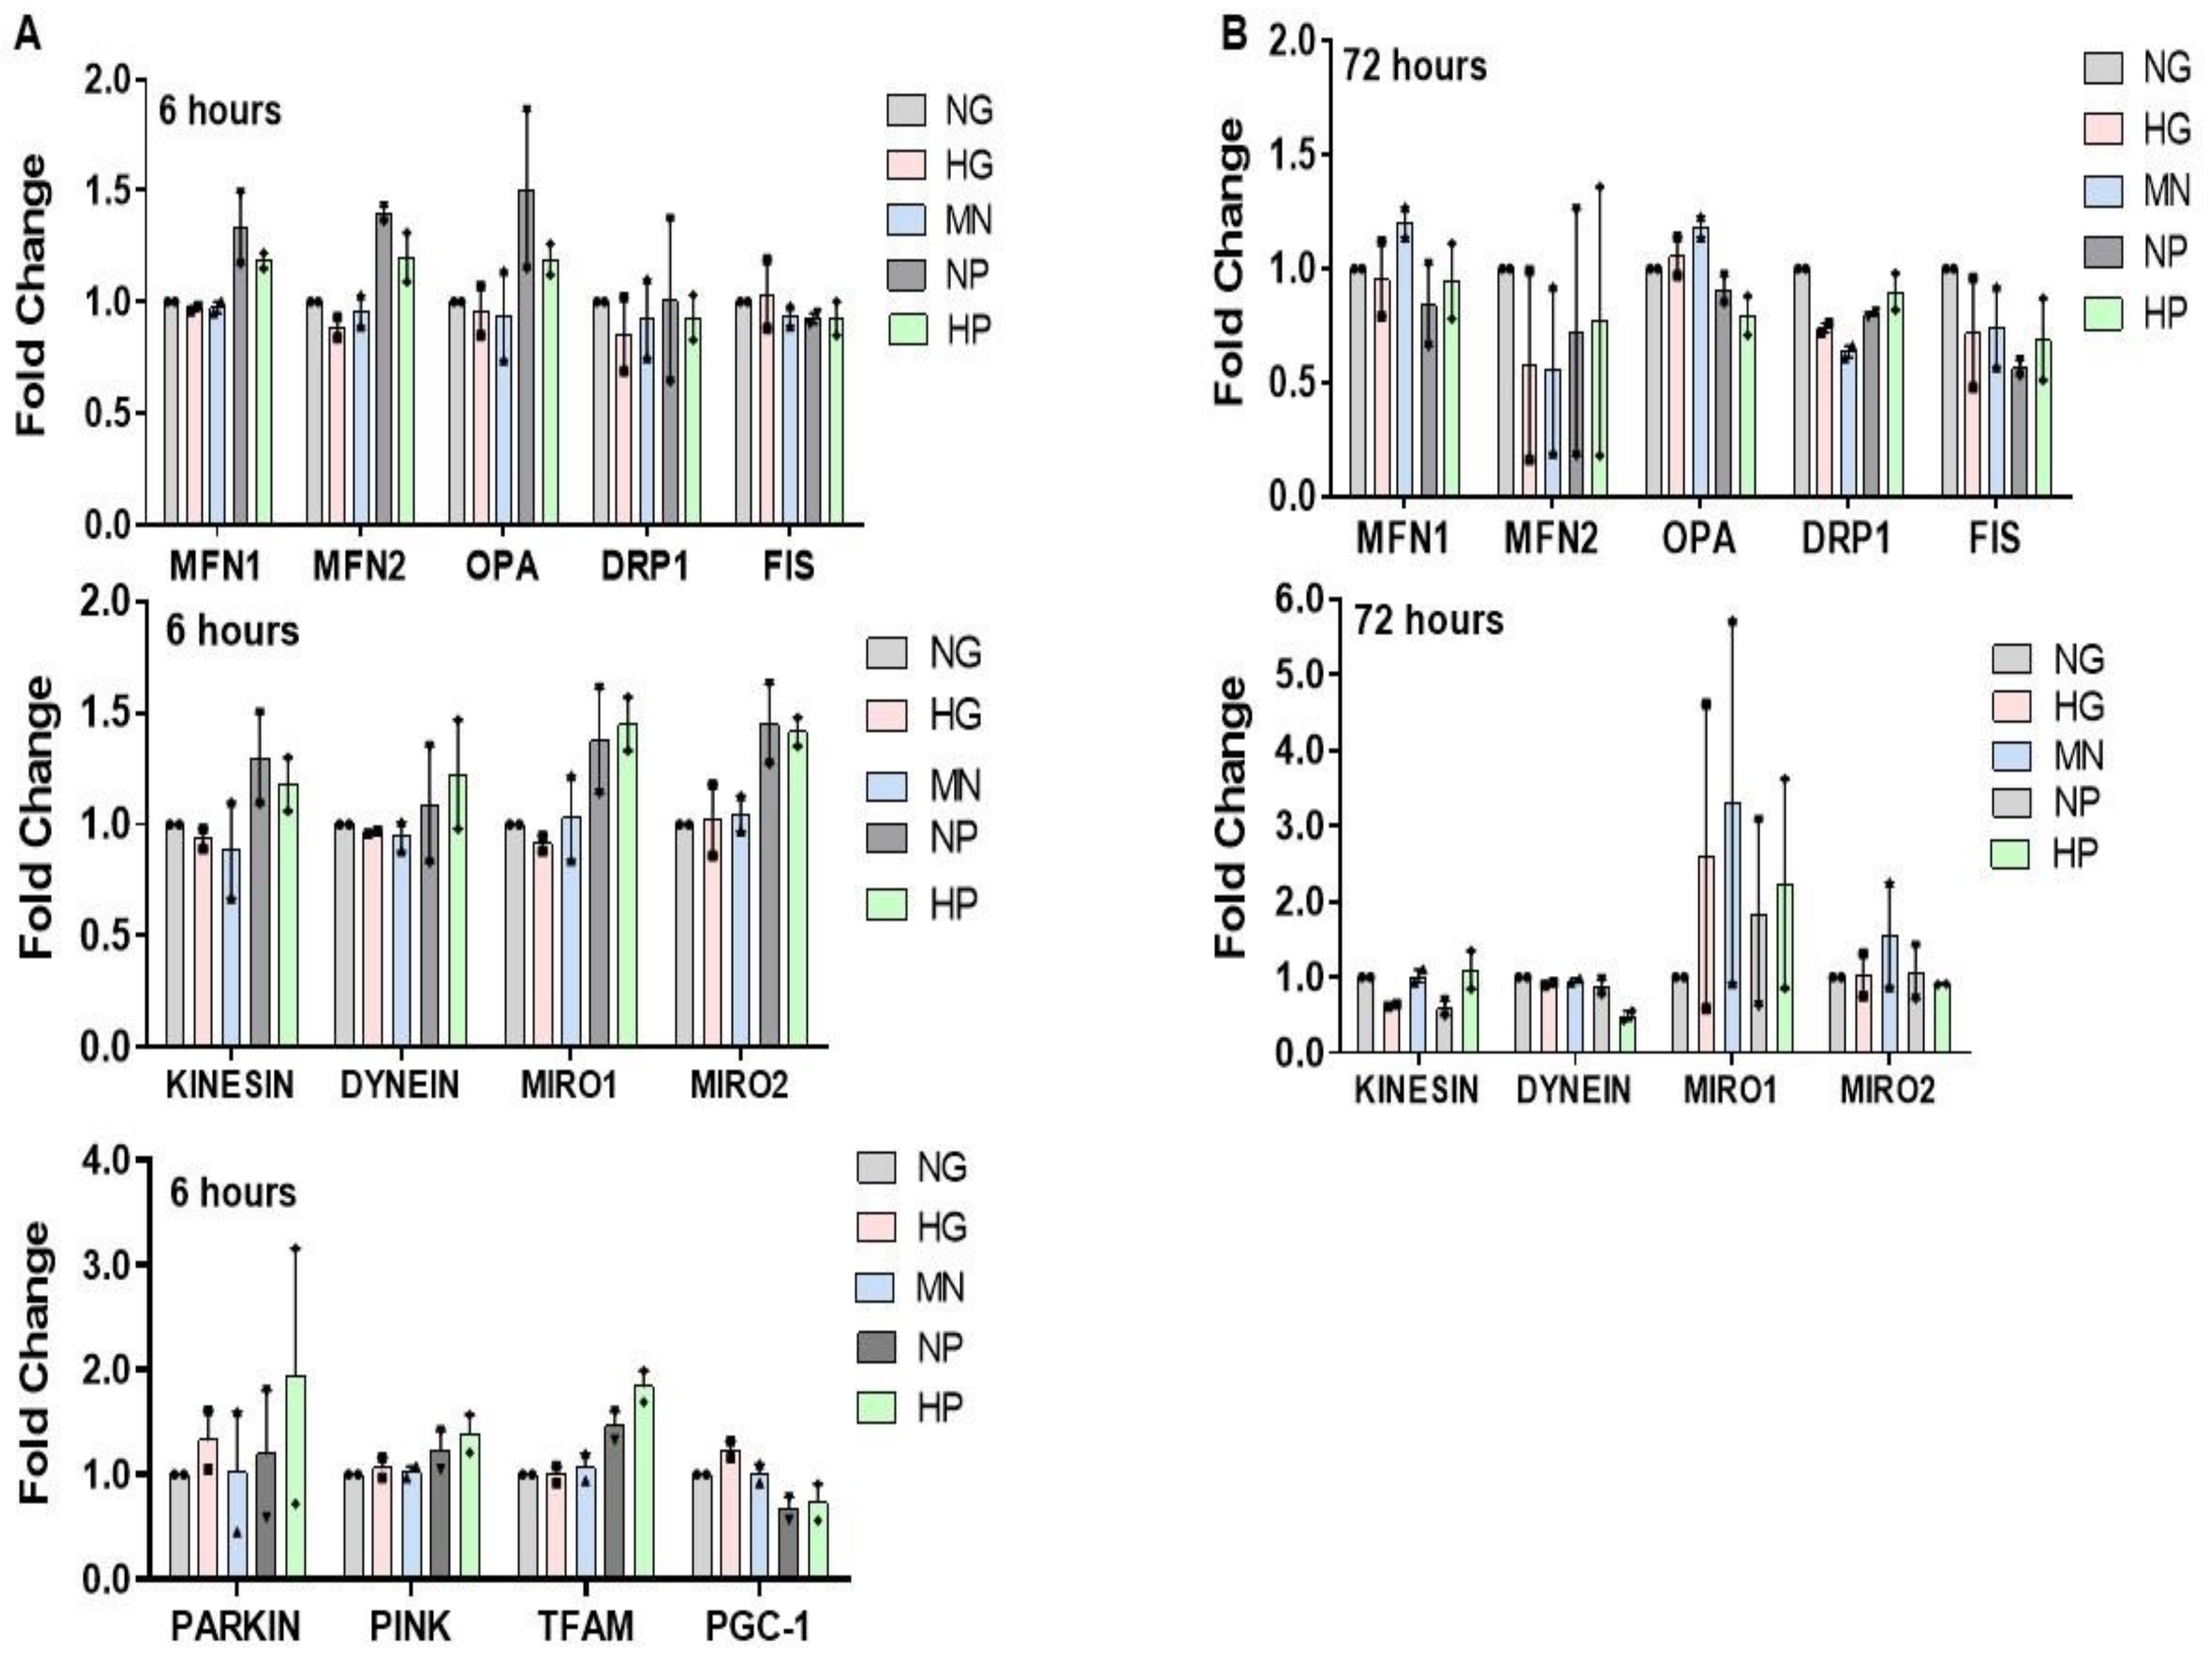
2.7. RNA Expression of Mitochondria Quality Control Program (MQCP)-Related Genes in GMCs and in BTBRob/ob Mice Kidney Cortexes

Next, we hypothesized that MSC might modulate MQCP in DKD setting. Furthermore, 72 h-conditioned GMCs had inhibited relative expression of biogenesis and mitophagy related-genes in HG, NP, and HP media (p < 0.05) (Figure 7A). At the earlier time-point (6 h), no differences were noticed in gene expression in accordance to cell culture media (Figure A1A). Additionally, there was no difference in gene expression in 72 h-GMCs processes of MQCP fusion, fission, and motility (Figure A1B). MSC treatment preserved mitophagy-related genes in GMCs conditioned to HG in the 72 h scenario (p < 0.05), but not in NP and HP conditioning (Figure 7B).
As DKD progressed in mice, there was a lower expression of MQCP-related gene expression for almost every marker evaluated in older BTBRob/ob mice (14 and 20 weeks old) compared to younger BTBRob/ob mice (10–11 weeks old) (p < 0.05) (Figure 7C–E). MSC-treated BTBRob/ob mice (14–15 and 18–20 weeks old) had notably increased change in expression of almost every MQCP-related gene evaluated, indicating a stimulating effect of MSCs therapy on the mitochondrial molecular pathways in mice kidneys and a possible MQCP restoration in DKD scenario (p < 0.05) (Figure 7C–E).

2.8. MSCs Preserve BTBRob/ob Kidneys from Mesangial Expansion and Podocyte Loss

We further looked into the therapeutic potential of MSC in BTBRob/ob mice. Therefore, MSC-treated mice had a significantly lower mesangial matrix deposition at 14–15 weeks of age, reaching 14–15 week-old BTBR (wild-type) WT levels (p < 0.05) (Figure 8A). This protective effect was not sustained until 18–20 weeks of age, indicating a time-dependent effect of MSC therapy. A similar outcome was obtained with podocyte/glomeruli maintenance. MSCs preserved podocyte cell loss of BTBRob/ob mice at 14–15 weeks of age (p < 0.05). This effect was not sustained until 18–20 weeks of age. BTBRob/ob mice had lower podocyte/glomeruli numbers in comparison to BTBR WT at every age investigated (p < 0.05), demonstrating the hallmark of podocyte loss during DKD progression (Figure 8B). Importantly, the findings of curtailed mesangial expansion and preservation of podocyte numbers in BTBRob/ob mice have important therapeutic implications and may explain the lower values of UACR, as previously documented.

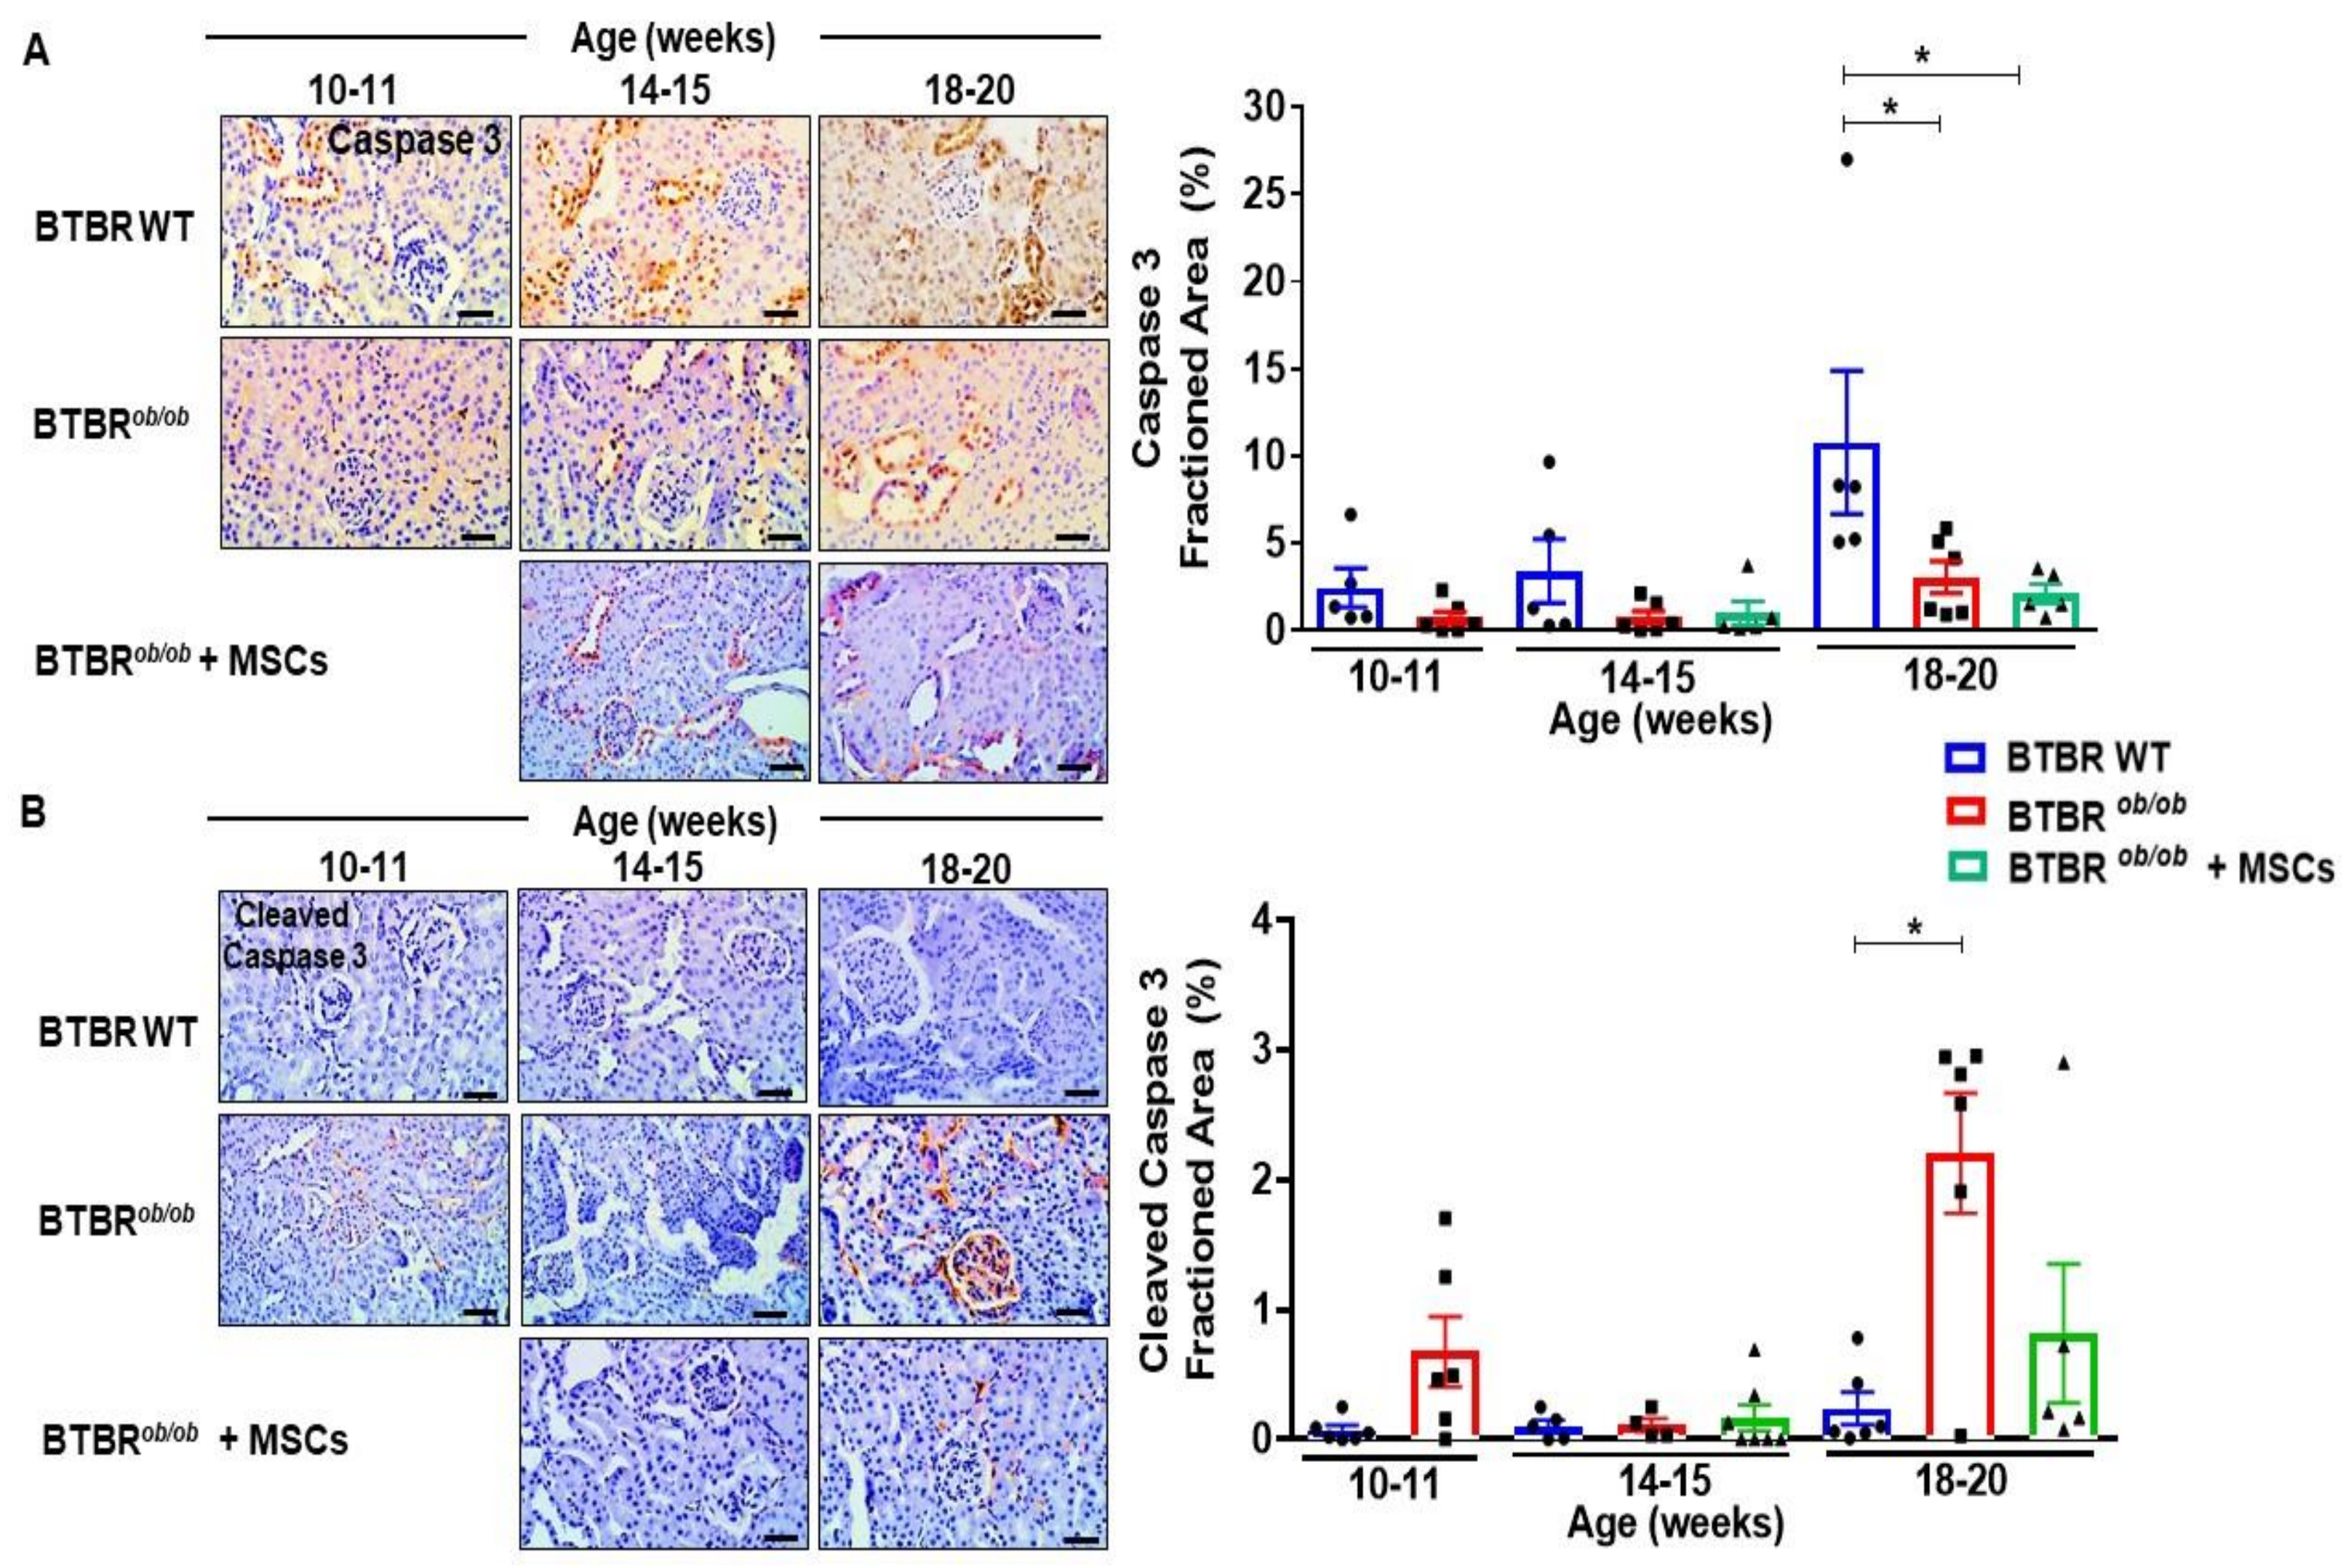
2.9. MSCs Potentially Suppress Caspase-3 Dependent Cell Death over Induction in BTBRob/ob Mice Kidney

To test whether the beneficial outcome of MSCs was also attributed to a decrease in apoptotic cell death, we verified the caspase 3 signaling pathway in kidney cortex sections of BTBRob/ob and BTBR wild type mice. Despite caspase 3 induction in 20 week-old BTBR WT mice, when compared to BTBRob/ob (p < 0.05) (Figure 9A), active cleaved-caspase 3 was up-regulated as DKD progressed in BTBRob/ob mice (Figure 9B), indicating activation of this cell death signaling pathway. Therefore, MSC therapy led to a potential decrease in cleaved-caspase 3 expression in 20 week-old BTBRob/ob mice (Figure 9B).

2.10. MSCs Therapy Reduces Renal LC3 over Expression and Potentially Diminishes Renal Lipid Peroxidation during DKD Progression

Next, we investigated autophagy signaling pathways during DKD progression. Autophagy marker microtubule-associated protein light chain 3 (LC3) is used to assess autophagy activity and has two isoforms. LC3-I is converted to LC3-II and then to autophagic vesicle. To note, BTBRob/ob mice had increased LC3 protein expression in kidney sections by 20 weeks of age (p < 0.05), indicating that autophagy increased over time (Figure 10A). We pursued further investigation of LC3 expression in MSC-treated BTBRob/ob mice and found lower LC3 expression values in 14–15 week-old treated mice (p < 0.05), pointing out a temporary protective effect on suppressing the superlative time-dependent autophagy induction in consequence of DKD progression in these animals, as this effect did not persist until 18–20 weeks of age (Figure 10A). BTBRob/ob mice had higher LC3 expression in comparison to BTBR WT mice at every age evaluated (p < 0.05).
Finally, we investigated the 4-HNE lipid peroxidation marker as a consequential effect of HG-driven oxidative stress in BTBRob/ob kidney. Lipid peroxidation was potentially increased in 14–15 and 1–20 week-old BTBRob/ob mice in comparison to 14–15 and 18–20 week-old BTBR WT mice. However, MSC therapy did not curtail oxidative stress in 14–15 and 18–20 week-old BTBRob/ob mice with DKD (Figure 10B).

3. Discussion

To our knowledge, this is the first study applying MSCs therapy to BTBRob/ob mice, which is the most robust T2DM and DKD pre-clinical model [17]. The present study sought to provide direct evidence of MSCs as a therapeutic intervention to halt the progression of DKD. Our main findings were the anti-apoptotic, autophagy modulation, and anti-oxidative effects of MSCs on GMCs, associated with the upregulation of genes related to mitochondrial biogenesis and mitophagy. In vivo, MSC-treated BTBRob/ob mice were prevented from elevated albuminuria, had diminished mesangial expansion, and had preserved numbers of podocytes. Additionally, MSCs upregulated MQCP related genes in treated BTBRob/ob mice and preserved kidney from LC3-mediated autophagy overexpression.
Currently, DKD natural history has been changed by advances in pharmacological tools, especially due to sodium-glucose cotransporter-2 (SGLT2) inhibition by gliflozins addition to the standard treatment [18]. Specifically, gliflozins preserve kidney function through hemodynamic reestablishment, preventing hyperfiltration and restoration of tubule-glomerular feedback [19]. However, the association of pharmacological interventions with improvements in the life style (diet, exercise, weight control, and quitting smoking) is able to slow disease progression, yet not recovering either lost tissue, function, or both [18]. That is the fundamental gap which MSCs treatment is able to fulfill, presenting a cumulative body of evidences showing safe and effective renoprotective applications [12,20], even though there is methodological variability in research studies, which makes data comprehension about the underlying mechanisms difficult [21].
We successfully applied allogeneic BM-MSC therapy to GMC culture and BTBRob/ob mice, a robust and severe T2DM and DKD animal model that mimics key features of advanced human DKD. We have properly extracted, purified, characterized, and safely administered MSCs to both in vitro and in vivo experimental design. In our study, there was a damaging effect of the conditioning associated with the chronicity (6–72 h) of stress-media (HG, NP, and HP) on GMCs. Specifically, HP medium exhibited the most negative impacts, showing an additive association of HG and H2O2 action in comparison to HG and NP media. Increased glucose influx (HG) leads to higher NADH and FADH2 synthesis and persistently increases mitochondrial membrane potential and causes disturbance to the electron transport chain (ETC), consequently increasing electron leakage that culminates in higher superoxide (O2) and H2O2 radicals production [22,23]. That oxidative scenario due to DM-induced metabolite changes explains our findings regarding GMCs’ mitochondrial membrane alterations in association with O2-H2O2 accumulation and cell death induction. Accumulated O2-H2O2 causes mitochondrial disturbance through redox balance alterations in ETC, culminating in energy failure and inducing cell death [24]. Physiologically, cells sustain a stable mitochondrial membrane potential, with a tight control mechanism of ROS concentration [23], yet transient alterations are common and not injurious during adaptation to environmental changes [25]. Sustained H2O2 and O2 accumulation is deleterious to the mitochondrial homeostasis, overcoming stress response and adaptation processes like mitophagy, eventually leading to cell death [9]. Correspondingly, we evidenced a diminished fold change expression of genes related to both mitophagy and biogenesis in GMCs facing persistent HG, NP, and HP conditioning. On the other hand, MSC-treated GMCs were successfully preserved from cell death over induction by stress media conditioning, especially and more notably in relation to the prolonged and accumulated effect of the HP medium. On the other hand, MSCs have been well described as effective anti-apoptosis and anti-necrosis therapeutic tools in oxidative stress and hyperglycemic scenarios of DKD [26,27]. According to our results, MSCs are reported to respond more effectively towards repair when challenged or primed in a stress condition, triggering mechanisms that culminate in a more reparative secretome composition [28]. Additionally, injured cells release mitochondria or mitochondria fragments into the extracellular microenvironment as a damage signal, these mitochondria are then engulfed by neighboring MSCs. Internalized exogenous mitochondria elicit MSCs’ anti-apoptotic response in association with increased biogenesis and mitochondria donation to the damaged cells, culminating in an anti-oxidative effect as well [29]. Likewise, we have also found MSCs efficiently inhibiting H2O2 accumulation in GMCs, preventing them from oxidative damage and mitochondria dysfunction. Complementing that point, our results showed that MSC-treated GMCs recovered the expression of genes related to biogenesis and mitophagy processes. Importantly, MSCs have reported renoprotective effects through biogenesis enhancing in damaged tubular epithelial cells [30].
Regarding BTBRob/ob mice, we decided to adopt fresh thawed cells administration, intraperitoneal route, and allogeneic transplantation as a way to simulate a more susceptible method to be translated for clinical application. As reviewed elsewhere, the MSC administration route is an essential factor impacting the reparative effects [31]. Regularly, MSCs are administered through the intravenous route, which produces a significant renoprotective effect by reducing serum creatinine, though being less effective in comparison to the arterial delivery route [31]. Besides, intravenous injection usually leads to MSCs being trapped in the pulmonary microvasculature, reducing the homing to damaged organs [32]. Intraperitoneal administration is a safe and effective method to apply MSCs therapy, already demonstrated by renoprotective results facing kidney injury, with anti-apoptotic, anti-inflammatory [33], and anti-oxidative effects associated with better renal function outcome [34]. The intraperitoneal route allows infused MSCs to migrate and get systemically distributed, including kidney homing in on renal damage scenarios [33]. We obtained promising results of MSC therapy effects in the T2DM-DKD pre-clinical model using BTBRob/ob mice. We observed an important time-dependent effect relative to T2DM and DKD injury. Nevertheless, we evidenced a protective effect of MSC therapy on BTBRob/ob mice. First and most relevant, MSC therapy was renoprotective, suppressing the elevated albuminuria naturally seen in DKD progression. Secretome from MSCs can drive pro-survival cascade events, inhibiting cell damage through repair pathways and avoiding cell death induction [35]. Additionally, damaged kidney signaling, through chemokines and stress molecules, exerts an attraction on MSCs homing and drives them directly to the renal region, promoting a temporary engraftment [36]. The mentioned engraftment allows direct MSC-kidney cells contact and communication, favoring mitochondria transferring from one to another [37]. MSCs mitochondria transfer is one of the main repair mechanisms that underlies the anti-oxidative and anti-apoptotic effects [37,38]. Evidences confirm the renoprotective effect of MSCs on DKD, demonstrated as kidney preservation in pre-clinical T1DM and T2DM models after systemic administration of MSCs or MSC-conditioned media, reflecting in lower proteinuria rate [26]. On the other hand, MSC administration could not change the body weight gain and hyperglycemic profile of BTBRob/ob mice, yet there was a trend towards lower levels of glycemia in BTBRob/ob mice at 18–20 weeks. It is important to note that we tested MSCs therapy administered systemically and without any complementary intervention against the severe hyperglycemic and obesity condition of our animal model, what brings great challenges to be overcome but also highlights the obtained effects. Increasing the frequency of MSCs administration over time or an earlier intervention would possibly cause a more prominent and sustained response. Nonetheless, there are compelling evidences of hypoglycemic MSC-therapy effect in T1DM and T2DM pre-clinical models [39,40]. Certainly, an association of MSCs with a gold standard pharmaceutical therapy, such as SGLT2 inhibitors, would bring major upgrades to these effects on hyperglycemia and body weight, besides the expected greater kidney improvement [18]. Therefore, more studies are further warranted to confirm the dose and frequency of MSCs administration to control glucose levels. Another important factor in this investigation scenario is the engineered-MSCs, aiming to boost cell reparative efficiency in association with more resilience in HG and oxidative stress microenvironment.
Classically, DKD causes several time-dependent histological alterations in kidney tissue. The mesangial expansion, one of the DKD pathophysiology hallmarks, was increased in BTBRob/ob mice, indicated by periodic acid-Schiff (PAS) accumulation in the mesangium, whereas MSC-treated BTBRob/ob mice had a decrease in PAS staining. MSCs are effective at reducing mesangial expansion through secretome factors, mainly through induction of VEGF expression, in diabetic pre-clinical models [26]. GMCs are responsible for the extracellular mesangial matrix synthesis and suffer cell cycle progression arrestment under hyperglycemic stress, eliciting extracellular matrix overproduction and cell exhaustion, which contributes to mesangial expansion [41]. Furthermore, related to glomeruli structure and function in DKD, we evaluated podocytes maintenance in BTBRob/ob mice. As expected, there was a podocyte/glomerulus ratio decrease in consequence of DKD in BTBRob/ob mice. MSC-treated mice exhibited increased podocyte/glomerulus in comparison to not treated animals. Podocytes preservation is an important and potential reason underlying the curtailed albuminuria observed in MSC-treated mice that could be obtained through cell death inhibition processes [42]. Podocytes could also be protected from HG damage and death induction by mitochondrial homeostasis recovery through biogenesis and mitophagy promotion [43].
In relation to mitochondrial molecular pathways, we evidenced alterations in the expression of MQCP related-genes by stress-media conditioning and DKD pathophysiological alterations. Our results document an inhibitory impact of HG, NP, and HP media on biogenesis and mitophagy-related genes expression. Despite the limitation that we have not investigated protein expression of these MQCP molecular targets, MSCs were reported to induce and recover the mitigated mitophagy PINK1 protein expression in cells conditioned to HG media [44]. Furthermore, the same promoting effect was observed in MSC-treated endothelial cells, which had recovered PGC-1α protein expression from previous HG-mediated downregulation [45]. Those evidences indicate that modulation of MQCP gene expression can be directly associated with protein expression changes as well, following MSC therapy. In a stress and damage scenario, both mitochondrial processes are essential for the proper adaptation aimed at cell reestablishment. Disturbances in the tightly regulated process of mitophagy and biogenesis balance aggravate cell injury facing hyperglycemia and oxidative stress [46]. The investigation of anti-oxidative therapy is one of the most applied strategies to overcome redox imbalance, but the literature is filled with controversies about this approach due to the excessive and broad anti-oxidative action, which culminates in the reductive stress [47]. Reestablishment of redox balance implies preservation of the physiological and naturally produced ROS, intrinsically involved in cell signaling processes, instead of oxidative-agents ablation [48]. MSC therapy has the great potential to restitute redox state through mitochondrial modulation and anti-oxidative effects [49]. Our results indicated that MSCs induced the recovery of mitophagy-related genes PINK1 and PARKIN expressions, in addition to inducing the expression of TFAM, a gene related to the biogenesis process, which has important biological implications. Mitophagy activation is a pro-survival mechanism that removes dysfunctional mitochondria debris that can, in association with the sustained formation of novel mitochondrial structure through biogenesis, renew mitochondrial networks [50].
In relation to BTBRob/ob mice kidney cortexes, the expression of MQCP related-genes had an initial compensatory upregulation effect at 10 week-old, yet decreasing in a time-dependent manner until the 20 week-age. This effect was detected in all genes evaluated. Thus, MSC-treated mice had a marked gene up-regulation of PARKIN and PINK (mitophagy); MFN1 and OPA1 (outer and inner mitochondrial membrane fusion, respectively); DRP1 (mitochondrial membrane fission); KINESIN and DYNEIN (intracellular mitochondrial motility), and MIRO1 (mitochondrial transfer to neighbor cells). Therefore, that finding could be explained by mitochondrial matrix remodeling induction orchestrated by MSCs’ secretome and mitochondrial effects. MSCs have been shown to promote MQCP-related genes, inducing mitophagy [44] and biogenesis [15] in the diabetic setting. Moreover, MSCs can prevent mitochondria fragmentation, which represents one of the described consequences of HG and oxidative stress milieu impact [51], and ultimately inducing the fusion process [49]. Conversely, MSCs have demonstrated effects on fission stimulation through DRP1 gene expression [52], which is equally important for mitophagy and cell hemostasis. Of importance, these MQCP processes should be analyzed in a coordinated fashion, as they are interdependent.
Additionally, in relation to kidney tissue apoptosis and autophagy process, our results documented a potential suppressing effect of MSC treatment on the over activation of kidney cell death, as reduced cleaved caspase-3 protein expression, which were over activated in the later DKD stage of 20 week-old BTBRob/ob mice. Of note, the induced caspase-3 protein in BTBR wild type mice was not followed by actual cell death pathway activation through caspase-3 cleavage, demonstrating a basal maintenance of this pathway signaling, though only activated when there was substantial DKD-driven stress and damage. There are compelling evidences demonstrating MSCs as an efficient intervention to diminish cell death in kidney tissue facing DKD, culminating in podocyte maintenance [42], and also downregulating the over induction of the autophagy pathway [53]. In addition to those results, we showed a suppressed LC3 overexpression in MSC-treated BTBRob/ob mice at 14–15 weeks old. These attainable curtailing effects of MSCs on tissue over induced recycling and removal of damaged sections can result in decreasing structural damage and in amelioration of functional parameters, while fostering biogenesis pathways, as mitochondria renewal [30]. Autophagy is an intracellular degradation system that maintains intracellular homeostasis by removing damaged proteins and organelles, yet that biological process has a double-edged sword effect in the DKD setting. Therefore, autophagy downregulation has been clinically evidenced during the first stages of DKD due to HG-driven mTORC1 (mammalian target of rapamycin complex 1) induction in podocytes [54]. Obesity itself is also reported as a suppressor of autophagy through mTORC1 activation in proximal tubules [55]. Mechanistically, hyperactivation of mTORC1 induces endoplasmic reticulum stress and epithelial-mesenchymal transition phenotype in podocytes, mesangial expansion, and glomerular membrane basal thickening, so that rapamycin treatment or podocyte-specific knockout for Raptor, an essential component of mTORC1, protects the progression of early stages of DKD [54,56]. Therefore, improper mTORC1 activation in podocytes under diabetic conditions is crucial for podocyte injury and the genesis of proteinuria and may also cause dysfunction of other glomerular cells and tubular cells. Nonetheless, chronic inhibition of mTORC1 promotes imbalance of the mTOR signaling pathway and may aggravate glomerular and tubular lesions [54]. Additionally, persistent oxidative stress can eventually trigger a compensatory effect of kidney tissue in response to excessive ROS signaling, stimulating autophagy independently of mTORC1 [57]. The highly expressed autophagy in later stages, as we have observed in 20 week-old BTBRob/ob mice, may lead to tissue loss of function and contribute to disease pathology. Therefore, autophagy has a complex relation with disease physiopathology and timing along disease progression, making it challenging to assess whether it should be up- or downregulated to promote repair [58].
Regarding the HG-driven persistent oxidative stress, MSC failed to reduce lipid peroxidation (4-HNE) in BTBRob/ob mice. As a consequence of DKD progression, BTBRob/ob mice have accumulation of ROS in kidney tissue as superoxide radicals and increased lipid peroxidation [59]. HG is associated with increased oxidative stress caused by over-production of NADH and ROS, which led to inhibition of glucose metabolism via glycolysis and tricarboxylic cycle [60]. Consequently, alternative glucose metabolic pathways, including polyol and hexosamine biosynthetic pathways, are activated and increase ROS production, thus completing the vicious circle of cellular oxidative stress. There is an increasing body of evidence showing the potential of MSCs as an effective anti-oxidative therapeutic tool against DKD progression [61,62]. However, our diabetic and obese mice exhibited severe hyperglycemia throughout the study, which could have abrogated MSC therapeutic potential in reducing oxidative stress. Importantly, MSC efficiency may be affected by other factors, such as the number of infusions, route of delivery, homing capacity, microenvironment, and the severity of the condition [62]. Therefore, MSCs systemically (intravenous) administrated have been clinically effective in reducing insulin intake of T2DM patients, with limited duration though [63], which could be explained by host factors, such as chronic hyperglycemia, sustained oxidative stress and inflammation, and by MSC properties, including being trapped in the lungs, lower levels of proliferation and migration, and higher rates of apoptosis and senescence in DM setting [62]. We performed MSC therapy without glycemic control by medicaments, therefore challenging cells to endure and survive in a highly glycotoxic microenvironment. In accordance with these observations, MSCs themselves may have been affected by HG. Regarding the hampering effects of DM on MSCs, HG is reported to foster oxidative stress, apoptosis, senescence, autophagy dysregulation, and mitochondrial damage in these cells [60]. Therefore, sustained HG in BTBRob/ob mice diminishes MSCs’ effects in the in vivo scenario, as our results showed. On the other hand, the obtained positive results are highlighted in consequence of the harsh conditions implied by the exacerbated HG environment, indicating the therapeutic potential of MSCs against DM and DKD progression. In that way, further studies with MSC administration associated with glycemic control in the BTBRob/ob mice will significantly improve the metabolic and renal therapeutic effects, halting DKD progression and more precisely simulating clinical translational application. Furthermore, it will be a great opportunity to investigate MSCs’ reparative mechanisms in a glucose-controlled setting, which can protect administered cells and enhance their therapeutic effectiveness [64].

4. Materials and Methods

4.1. Immortalized Glomerular Mesangial Cells (GMCs)

Mouse immortalized GMCs (SV40 MES 13, CRL-1927—ATCC, Gaitherburg, MD, USA), were cultured in Dulbecco’s Modified Eagle Medium (DMEM/F12) (Invitrogen, Carlsbad, CA, USA) supplemented with 5% fetal bovine serum (FBS, #F063—Cultilab, Campinas, SP, Brazil) and 1% penicillin/streptomycin (PS; #15140122—Gibco, Thermo Fisher Scientific, San Diego, CA, USA). Cells were split when they reached ~90% confluence. The medium was changed every other day. All cells were cultured at 37 °C in 98% humidified air containing 5% CO2.
For experimental conditioning, GMCs were cultured for 6 h and 72 h in DMEM 0.5% FBS (#F063—Cultilab, Campinas, SP, Brazil) supplemented with: (a) 1 g/L glucose (normal glucose—NG); (b) 5.4 g/L glucose (hyper glucose—HG); (c) 1 g/L glucose and 5.46 g/L mannitol (osmolarity control—MN); (d) 1 g/L glucose and 1 µL/mL H2O2 0.03% v/v (normal glucose + hydrogen peroxide—NP); (e) 5.4 g/L glucose and 1 µL/mL H2O2 0.03% v/v (hyper glucose + hydrogen peroxide—HP). Culture media were changed after 48 h.

4.2. Mesenchymal Stem Cells (MSCs)

MSCs were obtained from male 6–8 week old mT/mG mice (#007576; JAX Laboratories, Bar Harbor, ME, USA). These cells were extracted from femoral/tibial bone marrow (BM) flush, followed by purification in culture through passages in DMEM/F12 1:1 Ham (Invitrogen, Carlsbad, CA, USA) supplemented with 20% FBS (#F063—Cultilab, Campinas, SP, Brazil) and 1% PS (#15140122—Gibco, Thermo Fisher Scientific, San Diego, CA USA). BM-MSCs were characterized by fibroblast-like morphology and adherence to plastic in standard culture conditions, flow cytometry (Attune NxT Flow Cytometer—Thermo Fisher Scientific) immunophenotyping (CD29—# 11-0291-82; CD31—#11-0311-82; CD34—#11-0341-82; CD44—#11-0441-82; CD45—#11-0451-82; CD90—#11-0902-82; CD105—# MA1-80943; SCA-1—#11-5981-8; eBioscience, Thermo Fisher Scientific, San Diego, CA, USA) and multidifferentiation assay (chondrogenic, adipogenic and osteogenic lineages), as documented elsewhere [60,65,66,67]. MSCs are characterized by the expression of the surface molecules CD29, CD44, C90, CD105, and SCA-1 in the absence of CD34 and C45 (hematopoietic stem cell markers) and CD31 (endothelial cells marker).
After GMC conditioning in experimental media (NG, MN, HG, NP, and HP), MSCs were added to cell plates and both cell types were directly co-cultured for 24 h, following 1 MSCs:5 GMCs proportion, in DMEM/F12 medium (Invitrogen, Carlsbad, CA, USA) supplemented with 0.5% FBS (#F063—Cultilab, Campinas, SP, Brazil) and 1% PS (#15140122—Gibco, Thermo Fisher Scientific, San Diego, CA USA).
For conditioning experiments, we used 0.5% FBS in order to avoid GMC overgrowth and cell layer folding up. Therefore, these cells did not come off the plate.

4.3. BTBRob/ob Mice

Male mice BTBR.Cg-Lepob/WiscJ (referred as BTBRob/ob; #004824-JAX Laboratories, Bar Harbor, ME, USA), homozygous for leptin gene knockout. BTBRob/ob is a reversible model for T2DM and DKD, characterized by hyperphagy, early development of obesity, insulin resistance, and hyperglycemia (6th week of age), followed by DKD establishment with time-dependent proteinuria (8th week of age), resembling human DKD alterations [17]. We evaluated BTBR WT mice as the healthy control, comparing them with BTBRob/ob at different ages (10–11, 14–15, and 18–20 weeks old). Mice were housed in collective cages, with free access to regular chow (Nuvilab CR-1 irradiated, Quimtia S/A, Brazil) and tap water ad libitum, maintained in a temperature-controlled environment (23 °C) on a 12-h light/dark cycle. All experiments were performed in accordance with relevant guidelines and regulations defined by AAALAC. The respective Institutional Animal Care and Use Committees of Hospital Israelita Albert Einstein approved all procedures involving animals (15 December 2017) and the study was registered on the Jewish Institute of Research and Education, Hospital Israelita Albert Einstein, São Paulo, SP, Brazil (No. 3125-17).

4.4. MSCs Administration

Rapidly thawed MSC vials were evaluated in terms of cell viability by trypan blue staining (accepted if >90%). BTBRob/ob mice received BM-MSC injections, containing 1 × 10⁶ cells/each in warm saline, at the 8th and 10th weeks of age, through intraperitoneal route. We evaluated MSC therapy effects on BTBRob/ob mice after 4 weeks (14–15 weeks old) and after 8–10 weeks (18–20 week-old mice) of cell injections.

4.5. Cell Death

Cell death induction in GMCs was evaluated by Annexin-V (FITC+; #V13241—Thermo Fisher Scientific, Waltham, MA, USA), propidium iodide (PE+; #V13241—Thermo Fisher Scientific, Waltham, MA, USA) and DAPI (Violet+; #62248—Thermo Fisher Scientific, Waltham, MA, USA) staining by flow cytometry (Attune NxT cytometer, Invitrogen; FlowJo software, BD Biosciences). All experiments were done three times in triplicate and the mean of each experiment was calculated.

4.6. Mitochondrial-H2O2

For quantification (%) of GMCs with H2O2 accumulated specifically in mitochondria we used MitoPY1 (FITC+; #SML0734—Sigma-Aldrich, St. Louis, MO, USA) by flow cytometry (Attune NxT cytometer, Invitrogen; FlowJo software, BD Biosciences). All experiments were done three times in triplicate and the mean of each experiment was calculated.

4.7. Mitochondrial Membrane Polarization

Polarized/depolarized mitochondria ratio in GMCs was evaluated by MitoProbe JC1 (#M34152—Thermo Fisher Scientific, Waltham, MA, USA) by flow cytometry (Attune NxT cytometer, Invitrogen and FlowJo software, BD Biosciences). Functional (polarized) mitochondria attract and aggregate JC1 probe, which shifts fluorescence emission from 530 nm (diffused probe—FITC+) to 590 nm (oligomerized probe—PE+). Results were expressed as PE+/FITC+ ratio. All experiments were done three times in triplicate and the mean of each experiment was calculated.

4.8. Mitochondrial Quality Control Program (MQCP) Targets

RNA was extracted from BTBRob/ob mice kidney cortexes and GMCs (RNeasy mini kit; #74106—QIAGEN, Hilden, Germany), quantified (10 ng/µL; NanoDrop, Thermo Fisher Scientific) and used to synthesize cDNA (High-Capacity cDNA Reverse Transcription Kit; #4368814—Applied Biosystems, Waltham, MA, USA).
qPCR reaction (TaqMan Gene Expression Master Mix; #4369542—Applied Biosystems, Waltham, MO, USA) was performed using QuantStudio 6 Flex Real-Time PCR System (Applied Biosystems). GUSB was selected as the endogenous housekeeping gene (#Mm01197698_m1, Taqman Endogenous Control—Applied Biosystems, Waltham, MA, USA) and fold change was calculated as relative gene expression of mitochondrial quality control program targets: PGC1α and TFAM for biogenesis; PARKIN and PINK1 for mitophagy; DRP1 and FIS1 for fission; MFN1/2 and OPA1 for fusion; and MIRO1, MIRO2, DYNEIN and KINESIN for motility analysis. Absolute number of transcripts was calculated by 2ΔΔCt method. Genes of BTBRob/ob mice were normalized to BTBR WT mice.

4.9. Metabolic and Renal Functional Analysis

Blood collection was performed at baseline, week 4 and week 8 post-MSC injections for fasting glucose measurement (Accu-Chek, Performa, São Paulo, SP, Brazil). Urine was collected at baseline, week 4 and week 8 post-MSC injections using a metabolic cage; albuminuria was measured by ELISA (Mouse Albumin ELISA Kit; #ab207620—Abcam, Cambridge, MA, USA). Albumin levels were normalized to urine creatinine, quantified by biochemistry (#1010—Creatinine K Vet, Labtest, Lagoa Santa, MG, Brazil) using Cobas Mira Plus (Roche). Results were expressed as urine albumin-to-creatinine ratio (UACR; g/mg). BTBRob/ob mice were weighed twice every week.

4.10. Mesangial Expansion

BTBRob/ob and wild type kidney sections (paraffin-fixed, 3–4 µm thick) were stained with periodic acid-Schiff (PAS) trichrome staining in each experimental group. Sections were then analyzed by light microscopy (magnification, 40×). A quantitative analysis of mesangial expansion was performed. The increase in mesangial matrix was determined by the presence of PAS-positive area in the mesangium, and was expressed as a percentage. The glomerular area (μm2) was also traced along the outline of capillary loops using CellSens software (Olympus) in 30 randomly selected glomeruli in each animal.

4.11. Immunohistochemistry (IHC) Analysis

BTBRob/ob and wild type mice kidneys were fixed with formalin (10%) and sectioned at 3–4 µm thick. IHC reaction was performed with EnVision FLEX High pH kit (#K8000—DAKO, Carpinteria, CA, USA). Scoring for WT-1+ cells was carried out by counting the number of positive nuclei in 25 glomeruli randomly chosen in kidney cortexes and outer medulla sections using 10× magnification and after applying a rabbit polyclonal WT-1 antibody (anti-WT1; #sc-192—Santa Cruz, Dallas, TX, USA). Data from all fields and all kidneys were pooled to obtain the number of WT-1+ podocytes per glomerular cross-section. For autophagy induction, quantification of LC3 (anti-LC3; #4445S—Cell Signaling, Danvers, MA, USA) was performed analyzing cortex and medulla regions. For apoptosis pathway analysis, we evaluated caspase-3 and cleaved caspase-3 (#9662; #9661—Cell Signaling, Danvers, MA, USA) protein activation. Oxidative stress was measured by 4-HNE staining (anti-4-hydroxynonenal polyclonal antibody; #ab46545—Abcam, Cambridge, MA, USA) in kidney sections. The intensity of staining was determined using the optical density function of CellSens software (Olympus). Tissue sections were counter-stained with Mayer’s hemalum.

4.12. Statistical Analysis

Results are expressed as mean ± SEM. Statistical analysis was performed following normality test by Shapiro–Wilk. In case of normal distribution, ANOVA one-way was performed, followed by post-test of Brown Forsythe and Welch. Two-way ANOVA was applied to repeated measures analysis, followed by Holm–Sidak post-test for multiple comparisons; or Fisher (least significant difference) LSD post-test, in order to obtain statistical power when facing sample variability. In case of non-normal distribution, we applied Kruskall–Wallis or multiple t-test with Holm–Sidak post-test for multiple comparisons. For qRT PCR analysis of MQCP-genes expression in GMC samples, we performed two-way ANOVA analysis or Kruskall–Wallis test with Holm–Sidak post-test, using n = 2 per group. All tests were performed using GraphPad Prism (GraphPad Software, San Diego, CA, USA). A p-value < 0.05 was considered statistically significant.

5. Conclusions

Here, our study documented the progressive deleterious effects of HG and the related oxidative stress in DKD in both pre-clinical and in vitro models. We have efficiently applied MSC therapy with safety and efficacy for suppressing DKD-induced damage. Our findings have important therapeutic implications, providing insights into cellular and molecular mechanisms of MSC-based therapy in a DKD setting.

Author Contributions

Conceptualization, C.S.-S. and É.B.R.; data curation, C.S.-S., P.E.S.-S., A.S.-F., R.M.C.B. and S.B.; formal analysis, C.S.-S., P.E.S.-S. and A.S.-F.; funding acquisition, É.B.R.; investigation, C.S.-S., P.E.S.-S., A.S.-F., S.B., R.M.C.B. and É.B.R.; project administration, C.S.-S. and É.B.R.; validation, C.S.-S. and É.B.R.; writing—original draft, C.S.-S. and É.B.R.; writing—review and editing, C.S.-S. and É.B.R. All authors have read and agreed to the published version of the manuscript.

Funding

This work was supported by a masters research fellowship grant (no. 2017/18072-9) from FAPESP (Fundação de Amparo à Pesquisa do Estado de São Paulo/ São Paulo Research Foundation) to C.S.S., and a scientific initiation research fellowship grant (no. 2018/24562-1) from FAPESP (Fundação de Amparo à Pesquisa do Estado de São Paulo/São Paulo Research Foundation) to P.E.S.S. This work was also supported by grants from FAPESP (Fundação de Amparo à Pesquisa do Estado de São Paulo/São Paulo Research Foundation; no. 2017/23195-2) and EFSD (European Foundation for the Study of Diabetes) to E.B.R.

Conflicts of Interest

The authors declare no conflict of interest.

Appendix A

Figure A1. MQCP-genes expression in 6h-GMCs stress-conditioned. (A) GMCs stress-conditioned to media during 6h time-point. There was no statistical difference in MQCP-genes expression comparing groups for biogenesis (PGC-1, TFAM), mitophagy (PARKIN, PINK), fusion (MFN1, MFN2, OPA), fission (DRP1, FIS) and motility (KINESIN, DYNEIN, MIRO1, MIRO2) processes (p > 0.05; n = 2). (B) GMCs stress-conditioned to media during 72h time-point. There was no statistical difference in MQCP-genes expression comparing groups for fusion (MFN1, MFN2, OPA), fission (DRP1, FIS) and motility (KINESIN, DYNEIN, MIRO1, MIRO2) processes (p > 0.05; n = 2).
Ijms 22 01546 g0a1

References

  1. Saeedi, P.; Petersohn, I.; Salpea, P.; Malanda, B.; Karuranga, S.; Unwin, N.; Colagiuri, S.; Guariguata, L.; Motala, A.A.; Ogurtsova, K. Global and regional diabetes prevalence estimates for 2019 and projections for 2030 and 2045: Results from the International Diabetes Federation Diabetes Atlas. Diabetes Res. Clin. Pract. 2019, 157, 107843. [Google Scholar] [CrossRef] [Green Version]
  2. Blüher, M. Obesity: Global epidemiology and pathogenesis. Nat. Rev. Endocrinol. 2019, 15, 288. [Google Scholar] [CrossRef]
  3. DeFronzo, R.A.; Ferrannini, E.; Groop, L.; Henry, R.R.; Herman, W.H.; Holst, J.J.; Hu, F.B.; Kahn, C.R.; Raz, I.; Shulman, G.I. Type 2 diabetes mellitus. Nat. Rev. Dis. Primers 2015, 1, 1–22. [Google Scholar] [CrossRef]
  4. Thomas, M.C.; Brownlee, M.; Susztak, K.; Sharma, K.; Jandeleit-Dahm, K.A.; Zoungas, S.; Rossing, P.; Groop, P.-H.; Cooper, M.E. Diabetic kidney disease. Nat. Rev. Dis. Primers 2015, 1, 1–20. [Google Scholar] [CrossRef]
  5. Anders, H.-J.; Huber, T.B.; Isermann, B.; Schiffer, M. CKD in diabetes: Diabetic kidney disease versus nondiabetic kidney disease. Nat. Rev. Nephrol. 2018, 14, 361. [Google Scholar] [CrossRef]
  6. Alicic, R.Z.; Rooney, M.T.; Tuttle, K.R. Diabetic Kidney Disease: Challenges, Progress, and Possibilities. Clin. J. Am. Soc. Nephrol 2017, 12, 2032–2045. [Google Scholar] [CrossRef]
  7. Teodoro, J.S.; Gomes, A.P.; Varela, A.T.; Duarte, F.V.; Rolo, A.P.; Palmeira, C.M. Uncovering the beginning of diabetes: The cellular redox status and oxidative stress as starting players in hyperglycemic damage. Mol. Cell. Biochem. 2013, 376, 103–110. [Google Scholar] [CrossRef]
  8. Ashrafi, G.; Schwarz, T. The pathways of mitophagy for quality control and clearance of mitochondria. Cell Death Differ. 2013, 20, 31–42. [Google Scholar] [CrossRef] [Green Version]
  9. Lindblom, R.; Higgins, G.; Coughlan, M.; de Haan, J.B. Targeting mitochondria and reactive oxygen species-driven pathogenesis in diabetic nephropathy. Rev. Diabet. Stud. Rds 2015, 12, 134. [Google Scholar] [CrossRef] [Green Version]
  10. Bhargava, P.; Schnellmann, R.G. Mitochondrial energetics in the kidney. Nat. Rev. Nephrol. 2017, 13, 629. [Google Scholar] [CrossRef]
  11. Ding, W.-X.; Yin, X.-M. Mitophagy: Mechanisms, pathophysiological roles, and analysis. Biol. Chem. 2012, 393, 547–564. [Google Scholar] [CrossRef] [Green Version]
  12. Bochon, B.; Kozubska, M.; Surygała, G.; Witkowska, A.; Kuźniewicz, R.; Grzeszczak, W.; Wystrychowski, G. Mesenchymal Stem Cells—Potential Applications in Kidney Diseases. Int. J. Mol. Sci. 2019, 20, 2462. [Google Scholar] [CrossRef] [Green Version]
  13. Peired, A.J.; Sisti, A.; Romagnani, P. Mesenchymal stem cell-based therapy for kidney disease: A review of clinical evidence. Stem Cells Int. 2016, 2016, 4798639. [Google Scholar] [CrossRef] [Green Version]
  14. Lv, S.; Cheng, J.; Sun, A.; Li, J.; Wang, W.; Guan, G.; Liu, G.; Su, M. Mesenchymal stem cells transplantation ameliorates glomerular injury in streptozotocin-induced diabetic nephropathy in rats via inhibiting oxidative stress. Diabetes Res. Clin. Pract. 2014, 104, 143–154. [Google Scholar] [CrossRef]
  15. Lee, S.E.; Jang, J.E.; Kim, H.S.; Jung, M.K.; Ko, M.S.; Kim, M.-O.; Park, H.S.; Oh, W.; Choi, S.J.; Jin, H.J. Mesenchymal stem cells prevent the progression of diabetic nephropathy by improving mitochondrial function in tubular epithelial cells. Exp. Mol. Med. 2019, 51, 1–14. [Google Scholar] [CrossRef] [Green Version]
  16. Torres Crigna, A.; Daniele, C.; Gamez, C.; Medina Balbuena, S.; Pastene, D.O.; Nardozi, D.; Brenna, C.; Yard, B.; Gretz, N.; Bieback, K. Stem/stromal cells for treatment of kidney injuries with focus on preclinical models. Front. Med. 2018, 5, 179. [Google Scholar] [CrossRef]
  17. Hudkins, K.L.; Pichaiwong, W.; Wietecha, T.; Kowalewska, J.; Banas, M.C.; Spencer, M.W.; Muhlfeld, A.; Koelling, M.; Pippin, J.W.; Shankland, S.J.; et al. BTBR Ob/Ob mutant mice model progressive diabetic nephropathy. J. Am. Soc. Nephrol. JASN 2010, 21, 1533–1542. [Google Scholar] [CrossRef] [Green Version]
  18. Wanner, C.; Inzucchi, S.E.; Lachin, J.M.; Fitchett, D.; von Eynatten, M.; Mattheus, M.; Johansen, O.E.; Woerle, H.J.; Broedl, U.C.; Zinman, B. Empagliflozin and progression of kidney disease in type 2 diabetes. N. Engl. J. Med. 2016, 375, 323–334. [Google Scholar] [CrossRef]
  19. Thomson, S.C.; Vallon, V. Renal Effects of Sodium-Glucose Co-Transporter Inhibitors. Am. J. Med. 2019, 132, S30–S38.e4. [Google Scholar] [CrossRef] [Green Version]
  20. Rota, C.; Morigi, M.; Imberti, B. Stem Cell Therapies in Kidney Diseases: Progress and Challenges. Int. J. Mol. Sci. 2019, 20, 2790. [Google Scholar] [CrossRef] [Green Version]
  21. Phinney, D.G.; Galipeau, J. Manufacturing mesenchymal stromal cells for clinical applications: A survey of Good Manufacturing Practices at US academic centers. Cytotherapy 2019, 21, 782–792. [Google Scholar] [CrossRef] [PubMed]
  22. Brown, G.C.; Murphy, M.P.; Jastroch, M.; Divakaruni, A.S.; Mookerjee, S.; Treberg, J.R.; Brand, M.D. Mitochondrial proton and electron leaks. Essays Biochem. 2010, 47, 53–67. [Google Scholar] [CrossRef] [Green Version]
  23. Brand, M.D. Mitochondrial generation of superoxide and hydrogen peroxide as the source of mitochondrial redox signaling. Free Radic. Biol. Med. 2016, 100, 14–31. [Google Scholar] [CrossRef] [PubMed]
  24. Brand, M.D.; Goncalves, R.L.; Orr, A.L.; Vargas, L.; Gerencser, A.A.; Jensen, M.B.; Wang, Y.T.; Melov, S.; Turk, C.N.; Matzen, J.T. Suppressors of superoxide-H2O2 production at site IQ of mitochondrial complex I protect against stem cell hyperplasia and ischemia-reperfusion injury. Cell Metab. 2016, 24, 582–592. [Google Scholar] [CrossRef] [Green Version]
  25. Yaniv, Y.; Juhaszova, M.; Nuss, H.B.; Wang, S.; Zorov, D.B.; Lakatta, E.G.; Sollott, S.J. Matching ATP supply and demand in mammalian heart: In vivo, in vitro and in silico perspectives. Ann. N. Y. Acad. Sci. 2010, 1188, 133. [Google Scholar] [CrossRef] [Green Version]
  26. Nagaishi, K.; Mizue, Y.; Chikenji, T.; Otani, M.; Nakano, M.; Konari, N.; Fujimiya, M. Mesenchymal stem cell therapy ameliorates diabetic nephropathy via the paracrine effect of renal trophic factors including exosomes. Sci. Rep. 2016, 6, 1–16. [Google Scholar] [CrossRef] [PubMed]
  27. Tsuji, K.; Kitamura, S.; Wada, J. Immunomodulatory and regenerative effects of mesenchymal stem cell-derived extracellular vesicles in renal diseases. Int. J. Mol. Sci. 2020, 21, 756. [Google Scholar] [CrossRef] [PubMed] [Green Version]
  28. Chen, H.; Min, X.-H.; Wang, Q.-Y.; Leung, F.W.; Shi, L.; Zhou, Y.; Yu, T.; Wang, C.-M.; An, G.; Sha, W.-H. Pre-activation of mesenchymal stem cells with TNF-α, IL-1β and nitric oxide enhances its paracrine effects on radiation-induced intestinal injury. Sci. Rep. 2015, 5, 8718. [Google Scholar] [PubMed] [Green Version]
  29. Mahrouf-Yorgov, M.; Augeul, L.; Da Silva, C.C.; Jourdan, M.; Rigolet, M.; Manin, S.; Ferrera, R.; Ovize, M.; Henry, A.; Guguin, A. Mesenchymal stem cells sense mitochondria released from damaged cells as danger signals to activate their rescue properties. Cell Death Differ. 2017, 24, 1224–1238. [Google Scholar] [CrossRef] [Green Version]
  30. Perico, L.; Morigi, M.; Rota, C.; Breno, M.; Mele, C.; Noris, M.; Introna, M.; Capelli, C.; Longaretti, L.; Rottoli, D. Human mesenchymal stromal cells transplanted into mice stimulate renal tubular cells and enhance mitochondrial function. Nat. Commun. 2017, 8, 1–17. [Google Scholar] [CrossRef]
  31. Wang, Y.; He, J.; Pei, X.; Zhao, W. Systematic review and meta-analysis of mesenchymal stem/stromal cells therapy for impaired renal function in small animal models. Nephrology 2013, 18, 201–208. [Google Scholar] [CrossRef]
  32. Fischer, U.M.; Harting, M.T.; Jimenez, F.; Monzon-Posadas, W.O.; Xue, H.; Savitz, S.I.; Laine, G.A.; Cox, C.S. Pulmonary Passage is a Major Obstacle for Intravenous Stem Cell Delivery: The Pulmonary First-Pass Effect. Stem Cells Dev. 2008, 18, 683–692. [Google Scholar] [CrossRef]
  33. Eliopoulos, N.; Zhao, J.; Bouchentouf, M.; Forner, K.; Birman, E.; Yuan, S.; Boivin, M.-N.; Martineau, D. Human marrow-derived mesenchymal stromal cells decrease cisplatin renotoxicity in vitro and in vivo and enhance survival of mice post-intraperitoneal injection. Am. J. Physiol. Ren. Physiol. 2010, 299, F1288–F1298. [Google Scholar] [CrossRef] [Green Version]
  34. Rodrigues, C.E.; Capcha, J.M.C.; de Bragança, A.C.; Sanches, T.R.; Gouveia, P.Q.; de Oliveira, P.A.F.; Malheiros, D.M.A.C.; Volpini, R.A.; Santinho, M.A.R.; Santana, B.A.A.; et al. Human umbilical cord-derived mesenchymal stromal cells protect against premature renal senescence resulting from oxidative stress in rats with acute kidney injury. Stem Cell Res. Ther. 2017, 8, 19. [Google Scholar] [CrossRef] [Green Version]
  35. Eleuteri, S.; Fierabracci, A. Insights into the secretome of mesenchymal stem cells and its potential applications. Int. J. Mol. Sci. 2019, 20, 4597. [Google Scholar] [CrossRef] [Green Version]
  36. Zachar, L.; Bačenková, D.; Rosocha, J. Activation, homing, and role of the mesenchymal stem cells in the inflammatory environment. J. Inflamm. Res. 2016, 9, 231. [Google Scholar] [CrossRef] [Green Version]
  37. Ahmad, T.; Mukherjee, S.; Pattnaik, B.; Kumar, M.; Singh, S.; Rehman, R.; Tiwari, B.K.; Jha, K.A.; Barhanpurkar, A.P.; Wani, M.R. Miro1 regulates intercellular mitochondrial transport & enhances mesenchymal stem cell rescue efficacy. EMBO J. 2014, 33, 994–1010. [Google Scholar]
  38. Konari, N.; Nagaishi, K.; Kikuchi, S.; Fujimiya, M. Mitochondria transfer from mesenchymal stem cells structurally and functionally repairs renal proximal tubular epithelial cells in diabetic nephropathy in vivo. Sci. Rep. 2019, 9, 1–14. [Google Scholar] [CrossRef] [Green Version]
  39. Ezquer, F.E.; Ezquer, M.E.; Parrau, D.B.; Carpio, D.; Yañez, A.J.; Conget, P.A. Systemic administration of multipotent mesenchymal stromal cells reverts hyperglycemia and prevents nephropathy in type 1 diabetic mice. Biol. Blood Marrow Transplant. 2008, 14, 631–640. [Google Scholar]
  40. Si, Y.; Zhao, Y.; Hao, H.; Liu, J.; Guo, Y.; Mu, Y.; Shen, J.; Cheng, Y.; Fu, X.; Han, W. Infusion of mesenchymal stem cells ameliorates hyperglycemia in type 2 diabetic rats: Identification of a novel role in improving insulin sensitivity. Diabetes 2012, 61, 1616–1625. [Google Scholar] [CrossRef] [Green Version]
  41. Kriz, W.; Löwen, J.; Federico, G.; van den Born, J.; Gröne, E.; Gröne, H.J. Accumulation of worn-out GBM material substantially contributes to mesangial matrix expansion in diabetic nephropathy. Am. J. Physiol. Ren. Physiol. 2017, 312, F1101–F1111. [Google Scholar] [CrossRef] [Green Version]
  42. Li, D.; Wang, N.; Zhang, L.; Hanyu, Z.; Xueyuan, B.; Fu, B.; Shaoyuan, C.; Zhang, W.; Xuefeng, S.; Li, R. Mesenchymal stem cells protect podocytes from apoptosis induced by high glucose via secretion of epithelial growth factor. Stem Cell Res. Ther. 2013, 4, 103. [Google Scholar] [CrossRef] [Green Version]
  43. Zhou, D.; Zhou, M.; Wang, Z.; Fu, Y.; Jia, M.; Wang, X.; Liu, M.; Zhang, Y.; Sun, Y.; Lu, Y. PGRN acts as a novel regulator of mitochondrial homeostasis by facilitating mitophagy and mitochondrial biogenesis to prevent podocyte injury in diabetic nephropathy. Cell Death Dis. 2019, 10, 1–16. [Google Scholar] [CrossRef] [Green Version]
  44. Zhu, W.; Yuan, Y.; Liao, G.; Li, L.; Liu, J.; Chen, Y.; Zhang, J.; Cheng, J.; Lu, Y. Mesenchymal stem cells ameliorate hyperglycemia-induced endothelial injury through modulation of mitophagy. Cell Death Dis. 2018, 9, 1–17. [Google Scholar] [CrossRef]
  45. Yuan, Y.; Shi, M.; Li, L.; Liu, J.; Chen, B.; Chen, Y.; An, X.; Liu, S.; Luo, R.; Long, D. Mesenchymal stem cell-conditioned media ameliorate diabetic endothelial dysfunction by improving mitochondrial bioenergetics via the Sirt1/AMPK/PGC-1α pathway. Clin. Sci. 2016, 130, 2181–2198. [Google Scholar] [CrossRef]
  46. Ploumi, C.; Daskalaki, I.; Tavernarakis, N. Mitochondrial biogenesis and clearance: A balancing act. FEBS J. 2017, 284, 183–195. [Google Scholar] [CrossRef]
  47. Kornienko, J.S.; Smirnova, I.; Pugovkina, N.; Ivanova, J.S.; Shilina, M.; Grinchuk, T.; Shatrova, A.; Aksenov, N.; Zenin, V.; Nikolsky, N. High doses of synthetic antioxidants induce premature senescence in cultivated mesenchymal stem cells. Sci. Rep. 2019, 9, 1–13. [Google Scholar] [CrossRef] [Green Version]
  48. Finkel, T. Signal transduction by reactive oxygen species. J. Cell Biol. 2011, 194, 7–15. [Google Scholar] [CrossRef] [Green Version]
  49. Newell, C.; Sabouny, R.; Hittel, D.; Shutt, T.E.; Khan, A.; Klein, M.S.; Shearer, J. Mesenchymal stem cells shift mitochondrial dynamics and enhance oxidative phosphorylation in recipient cells. Front. Physiol. 2018, 9, 1572. [Google Scholar] [CrossRef]
  50. Nguyen, T.N.; Padman, B.S.; Lazarou, M. Deciphering the molecular signals of PINK1/Parkin mitophagy. Trends Cell Biol. 2016, 26, 733–744. [Google Scholar] [CrossRef]
  51. Rovira-Llopis, S.; Bañuls, C.; Diaz-Morales, N.; Hernandez-Mijares, A.; Rocha, M.; Victor, V.M. Mitochondrial dynamics in type 2 diabetes: Pathophysiological implications. Redox Biol. 2017, 11, 637–645. [Google Scholar] [CrossRef] [PubMed]
  52. Cai, J.; Wang, J.; Huang, Y.; Wu, H.; Xia, T.; Xiao, J.; Chen, X.; Li, H.; Qiu, Y.; Wang, Y. ERK/Drp1-dependent mitochondrial fission is involved in the MSC-induced drug resistance of T-cell acute lymphoblastic leukemia cells. Cell Death Dis. 2016, 7, e2459. [Google Scholar] [CrossRef] [PubMed]
  53. Sun, J.; Lv, J.; Zhang, W.; Li, L.; Lv, J.; Geng, Y.; Yin, A. Combination with miR-124a improves the protective action of BMSCs in rescuing injured rat podocytes from abnormal apoptosis and autophagy. J. Cell. Biochem. 2018, 119, 7166. [Google Scholar] [CrossRef] [PubMed]
  54. Gödel, M.; Hartleben, B.; Herbach, N.; Liu, S.; Zschiedrich, S.; Lu, S.; Debreczeni-Mór, A.; Lindenmeyer, M.T.; Rastaldi, M.-P.; Hartleben, G. Role of mTOR in podocyte function and diabetic nephropathy in humans and mice. J. Clin. Investig. 2011, 121, 2197–2209. [Google Scholar] [CrossRef] [Green Version]
  55. Yamahara, K.; Kume, S.; Koya, D.; Tanaka, Y.; Morita, Y.; Chin-Kanasaki, M.; Araki, H.; Isshiki, K.; Araki, S.-i.; Haneda, M. Obesity-mediated autophagy insufficiency exacerbates proteinuria-induced tubulointerstitial lesions. J. Am. Soc. Nephrol. 2013, 24, 1769–1781. [Google Scholar] [CrossRef] [Green Version]
  56. Inoki, K.; Mori, H.; Wang, J.; Suzuki, T.; Hong, S.; Yoshida, S.; Blattner, S.M.; Ikenoue, T.; Rüegg, M.A.; Hall, M.N. mTORC1 activation in podocytes is a critical step in the development of diabetic nephropathy in mice. J. Clin. Investig. 2011, 121, 2181–2196. [Google Scholar] [CrossRef] [Green Version]
  57. Ding, Y.; Choi, M.E. Autophagy in diabetic nephropathy. J. Endocrinol. 2015, 224, R15. [Google Scholar] [CrossRef] [Green Version]
  58. Sridhar, S.; Botbol, Y.; Macian, F.; Cuervo, A.M. Autophagy and disease: Always two sides to a problem. J. Pathol. 2012, 226, 255–273. [Google Scholar] [CrossRef] [Green Version]
  59. Pichaiwong, W.; Hudkins, K.L.; Wietecha, T.; Nguyen, T.Q.; Tachaudomdach, C.; Li, W.; Askari, B.; Kobayashi, T.; O’Brien, K.D.; Pippin, J.W. Reversibility of structural and functional damage in a model of advanced diabetic nephropathy. J. Am. Soc. Nephrol. 2013, 24, 1088–1102. [Google Scholar] [CrossRef] [Green Version]
  60. Grohová, A.; Dáňová, K.; Špíšek, R.; Palová-Jelínková, L. Cell based therapy for type 1 diabetes: Should we take hyperglycemia into account? Front. Immunol. 2019, 10, 79. [Google Scholar] [CrossRef] [Green Version]
  61. Paulini, J.; Higuti, E.; Bastos, R.; Gomes, S.A.; Rangel, E.B. Mesenchymal stem cells as therapeutic candidates for halting the progression of diabetic nephropathy. Stem Cells Int. 2016, 2016, 9521629. [Google Scholar] [CrossRef] [PubMed] [Green Version]
  62. Sávio-Silva, C.; Beyerstedt, S.; Soinski-Sousa, P.E.; Casaro, E.B.; Balby-Rocha, M.T.A.; Simplício-Filho, A.; Alves-Silva, J.; Rangel, É.B. Mesenchymal Stem Cell Therapy for Diabetic Kidney Disease: A Review of the Studies Using Syngeneic, Autologous, Allogeneic, and Xenogeneic Cells. Stem Cells Int. 2020. [Google Scholar] [CrossRef]
  63. Cho, J.; D’Antuono, M.; Glicksman, M.; Wang, J.; Jonklaas, J. A review of clinical trials: Mesenchymal stem cell transplant therapy in type 1 and type 2 diabetes mellitus. Am. J. Stem Cells 2018, 7, 82. [Google Scholar] [PubMed]
  64. Miroshnichenko, S.; Usynin, I.; Dudarev, A.; Nimaev, V.; Solovieva, A. Apolipoprotein AI Supports MSCs Survival under Stress Conditions. Int. J. Mol. Sci. 2020, 21, 4062. [Google Scholar] [CrossRef]
  65. Ooi, Y.Y.; Rahmat, Z.A.; Jose, S.; Ramasamy, R.; Vidyadaran, S. Immunophenotype and differentiation capacity of bone marrow-derived mesenchymal stem cells from CBA/Ca, ICR and Balb/c mice. World J. Stem Cells 2013, 5, 34–42. [Google Scholar] [CrossRef]
  66. Rangel, E.B.; Gomes, S.A.; Dulce, R.A.; Premer, C.; Rodrigues, C.O.; Kanashiro-Takeuchi, R.M.; Oskouei, B.; Carvalho, D.A.; Ruiz, P.; Reiser, J.; et al. C-Kit+ Cells Isolated from Developing Kidneys Are a Novel Population of Stem Cells with Regenerative Potential. Stem Cells 2013, 31, 1644–1656. [Google Scholar] [CrossRef] [Green Version]
  67. Dominici, M.; Le Blanc, K.; Mueller, I.; Slaper-Cortenbach, I.; Marini, F.C.; Krause, D.S.; Deans, R.J.; Keating, A.; Prockop, D.J.; Horwitz, E.M. Minimal Criteria for defiing multipotent mesenchymal stromal cells. The International Society for Cellular Therapy position statement. Cytotherpay 2006, 8, 315–317. [Google Scholar] [CrossRef]
Figure 1. Characterization of bone marrow-derived mesenchymal stem cells (MSC) isolated from mTmG mice. (A) Plastic adherent cells were ex vivo expanded until passage 10, maintaining red fluorescent (RFP) expression throughout. (B) MSCs differentiated into osteogenic (alizarin red staining), adipogenic (oil red staining), and chondrogenic (alcian blue staining) lineages. Scale bars represent 200 µm. (C) Flow cytometry analysis for immunophenotyping showed that MSCs, in passages 7–8, were positive for CD 29 (98.8%), SCA-1 (98.2%), CD 44 (6.02%), CD 90 (4.18%), and CD 105 (4.97%), and negative for CD34 (0.49%), CD 45 (1.37%), and CD 31 (0.05%).
Ijms 22 01546 g001
Figure 2. Oxidative stress in GMCs at mitochondrial level after stress-conditioning. (A) Scheme of the cellular experiments for GMC conditioning with stress-conditioning media at different time-points (6 h and 72 h). (B) Flow cytometry analysis for mitochondria polarization ratio in stress-conditioned glomerular mesangial cells (GMCs) after different time points (6 h and 72 h; polarized/depolarized ratio). Hyper glucose (HG) caused hyperpolarization of GMCs mitochondria in comparison with normal glucose (NP) and hyper glucose + hydrogen peroxide (HP) conditioning, which caused a depolarization in comparison to control media (* p < 0.05). (C) Flow cytometry analysis of hydrogen peroxide (H2O2) accumulated specifically into GMC-mitochondria (FITC+) after stress-conditioning media. NP and HP 72 h-conditioning caused expressive H2O2 accumulation in GMCs mitochondria (* p < 0.05). Groups were compared with each other intra and inter each time-point (6 h and 72 h). (D) Flow cytometry gating and negative control for mitochondrial-H2O2 accumulation in GMCs conditioned for 6 and 72 h in HP medium. (E) Superoxide (O2) accumulation in GMCs after 72 h in stress-conditioning media in NP and HP, as demonstrated by confocal microscopy (FITC+). Scale bars represent 200 µm. Specific accumulation of H2O2 in mitochondria (FITC+), mitochondria polarization ratio (polarized-RFP+/depolarized-FITC+) and superoxide anion cell-accumulation (FITC+) in GMCs conditioned to stress media (normal glucose—NG, mannitol—MN, hyper glucose—HG, normal glucose + hydrogen peroxide—NP, hyper glucose + hydrogen peroxide—HP) during 6 h and 72 h time-points. Error bars represent mean ± SEM; n = 3. * p < 0.05.
Ijms 22 01546 g002
Figure 3. Anti-oxidative effect of MSCs co-culture on GMCs conditioned with stress media. (A) Scheme of the cellular experiments for GMCs conditioning with stress-conditioning media at different time-points (6 h and 72 h) and the subsequent MSC co-culture 24 h-therapy. (B) Mitochondrial accumulation of H2O2 after 6 h and 72 h conditioning following MSCs co-culture 24h-therapy. NP and HP media had significantly diminished ROS accumulation in the 72 h time-point (* p < 0.05). (C) Flow cytometry gating and negative control for mitochondrial-H2O2 accumulation in GMCs conditioned for 6 h and 72 h in HP medium. Specific accumulation of H2O2 in mitochondria (FITC+) of GMCs conditioned to stress media after MSCs co-culture (normal glucose—NG, mannitol—MN, hyper glucose—HG, normal glucose + hydrogen peroxide—NP, hyper glucose + hydrogen peroxide—HP) during 6 h and 72 h time-points. Error bars represent mean ± SEM; n = 3, * p < 0.05.
Ijms 22 01546 g003
Figure 4. GMCs’ death induction after stress-conditioning at different time points. (A) Scheme of GMCs’ experiments for stress-conditioning at different time-points (6 h and 72 h). (B) Flow cytometry analysis of GMCs’ death after stress-media conditioning. NP and HP media caused an increase in cell death, in comparison to 6 h conditioning (* p < 0.05). (C) Flow cytometry gating and negative control for GMCs conditioned to HP media at 6 h and 72 h. (D) Light microscopy imaging of GMCs conditioned at 6 h and 72 h. NP and HP caused a visual morphology alteration, disturbing cell growth and culture plate occupancy after 72 h conditioning. Scale bars represent 200 µm. Cell death (Annexin-V+ and DAPI+) in GMCs conditioned to stress media (normal glucose—NG, mannitol—MN, hyper glucose—HG, normal glucose + hydrogen peroxide—NP, hyper glucose + hydrogen peroxide—HP) during 6 h and 72 h time-points. Error bars represent mean ± SEM; n = 3.
Ijms 22 01546 g004
Figure 5. Pro-survival effect of MSCs co-culture on stress-conditioned GMCs. (A) Scheme of the cellular experiments for GMC conditioning with stress media-conditioning at different time-points (6 h and 72 h) and the subsequent MSCs co-culture therapy (24 h). (B) Flow cytometry analysis of GMC death (%) after MSC co-culture at 6 h and 72 h time-points, respectively. MSCs co-culture diminished GMCs’ death (%) after 72 h stress-conditioning with NP and HP media (* p < 0.05). (C) Flow cytometry gating and negative control for GMCs conditioned to HP at 6 h and 72 h time-points, with Annexin-V and DAPI staining. (D) Confocal images of MSC co-culture with stress media-conditioning at different time-points (6 h and 72 h). Scale bars represent 50 µm. Cell death (FITC+ and DAPI+) in GMCs conditioned to stress media (normal glucose—NG, mannitol—MN, hyper glucose—HG, normal glucose + hydrogen peroxide—NP, hyper glucose + hydrogen peroxide—HP) during 6 h and 72 h time-points. Error bars represent mean ± SEM; n = 3.
Ijms 22 01546 g005
Figure 6. Metabolic and renal functional parameters in BTBRob/ob control and MSC-treated BTBRob/ob mice. (A) Schemes of the procedure. Blood and urine samples were collected at three time-points in accordance to animal age (8–11, 14–15, and 18–20 weeks old) for both BTBRob/ob control group and MSC-treated BTBRob/ob group. MSCs were injected in the 8th and 10th weeks of age and euthanasia was performed in the 18th–20th weeks of age. (B) Body weight gain in BTBRob/ob was not prevented by MSC treatment (p > 0.05). (C) Glycemia after 6 h-starvation did not decrease after MSC treatment (p > 0.05). (D) Urine-albumin-to-creatinine ratio (UACR) was significantly diminished in MSC-treated BTBRob/ob mice in the 14th week of age when compared to BTBRob/ob control mice (* p < 0.05). Error bars represent mean ± SEM; n = 6 animals.
Ijms 22 01546 g006
Figure 7. RNA expression of mitochondria quality control program (MQCP)-related genes in GMCs and in BTBRob/ob mice’s kidney cortexes. (A) GMCs cultured in stress-conditioning media (HG, NP, and HP) presented a down-regulation in PARKIN and PINK1 gene expression at 72 h, whereas PGC-1 expression was only inhibited in NP and HP at 72 h (* p < 0.05). (B) MSCs treatment recovered PARKIN, PINK1, and TFAM gene expression in GMCs after HG 72 h-conditioning (* p < 0.05). (C) PARKIN, PINK1, TFAM, and PGC-1 genes had decreased expression in 14–15 and 18–20 week-old BTBRob/ob mice kidney cortexes in comparison to 10–11 week-old mice. MSC treatment at 14–15 and 18–20 weeks of age upregulated PARKIN, PINK1, and TFAM (p < 0.05). PGC-1 was upregulated only in MSC-treated 18–20 week-old mice (* p < 0.05). (D) DRP1 and OPA1 had increased gene expression in 14–15 and 18–20 week-old MSC-treated BTBRob/ob mice kidney cortexes (p < 0.05). MFN1 only had increased gene expression in 18–20 week-old MSC-treated BTBRob/ob mice kidney cortexes (p < 0.05). (E) DYNEIN and MIRO1 had increased gene expression in 14–15 and 18–20 week-old MSC-treated BTBRob/ob mice kidney cortexes (* p < 0.05). KINESIN had only increased gene expression in 18–20 week-old MSC-treated BTBRob/ob mice (* p < 0.05). Our qRT PCR results (2ΔΔCt) were normalized to BTBR wild-type mice at each related age (10–11, 14–15, and 18–20 week-old). Error bars represent mean ± SEM. For GMCs qRT PCR assays, n = 2. For BTBR mice qRT PCR assays, n = 6.
Ijms 22 01546 g007
Figure 8. MSCs preserve BTBRob/ob kidneys from mesangial expansion and podocyte loss. (A) DKD promoted increased matrix deposition in mesangial compartment of BTBRob/ob mice at 14–15 weeks of age (* p < 0.05). MSC treatment curtailed mesangial expansion when 14–15 week-old MSC-treated BTBRob/ob mice were compared to 14–15 week-old BTBRob/ob mice (* p < 0.05). (B) Number of podocytes per glomerulus, verified by the immunohistochemistry staining for WT-1 protein, decreased as DKD progressed in BTBRob/ob mice when compared to BTBR WT (p < 0.05). MSC treatment showed a protective effect as podocyte maintenance leading to a higher number of WT-1+ cells in 14–15 week old MSC-treated BTBRob/ob mice in comparison to 14–15 week old BTBRob/ob mice (* p < 0.05). BTBR WT was not statistically different at 18–20 weeks. (*) indicates WT1+ cell. Scale bars represent 10 µm in (A and B). Error bars represent mean ± SEM. For periodic acid-Schiff (PAS) and WT-1 staining: n = 5–7 animals.
Ijms 22 01546 g008
Figure 9. MSCs potentially suppress caspase-3 dependent cell death over induction in BTBRob/ob mice kidney. (A) Caspase 3 protein was induced in 20-week old BTBR (wild-type) WT mice kidney in comparison to 14-week old BTBRob/ob (* p < 0.05). (B) Cleaved-caspase 3 overexpressed in 20-week old BTBRob/ob in comparison to every other group (* p < 0.05). Error bars represent mean ± SEM. For caspase-3 and cleaved caspase-3 staining: n = 5–6 animals. Scale bars represent 20 µm (A,B).
Ijms 22 01546 g009
Figure 10. MSC therapy reduces renal LC3 over expression and potentially diminishes renal lipid peroxidation during DKD progression. (A) Renal LC3 expression was increased in BTBRob/ob at any age compared to BTBR (wild-type) WT mice (* p < 0.05). MSC therapy was effective reducing LC3 over induction in 14–15 week-old BTBRob/ob mice (* p < 0.05). However, the effect did not persist until 18–20 weeks of age. (B) 4-HNE staining showed potential increased lipid peroxidation in 14–15 and 18–20 week-old BTBRob/ob mice, when compared to BTBR WT. However, MSCs therapy did not reduce oxidative stress in these animals. Error bars represent mean ± SEM. For LC3 and 4-HNE staining: n = 5–7 animals. Scale bars represent 20 µm (A and B).
Ijms 22 01546 g010
Publisher’s Note: MDPI stays neutral with regard to jurisdictional claims in published maps and institutional affiliations.

