
Potential Protection Effect of ER Homeostasis of N6-(2-Hydroxyethyl)adenosine Isolated from Cordyceps cicadae in Nonsteroidal Anti-Inflammatory Drug-Stimulated Human Proximal Tubular Cells

 , and
, and 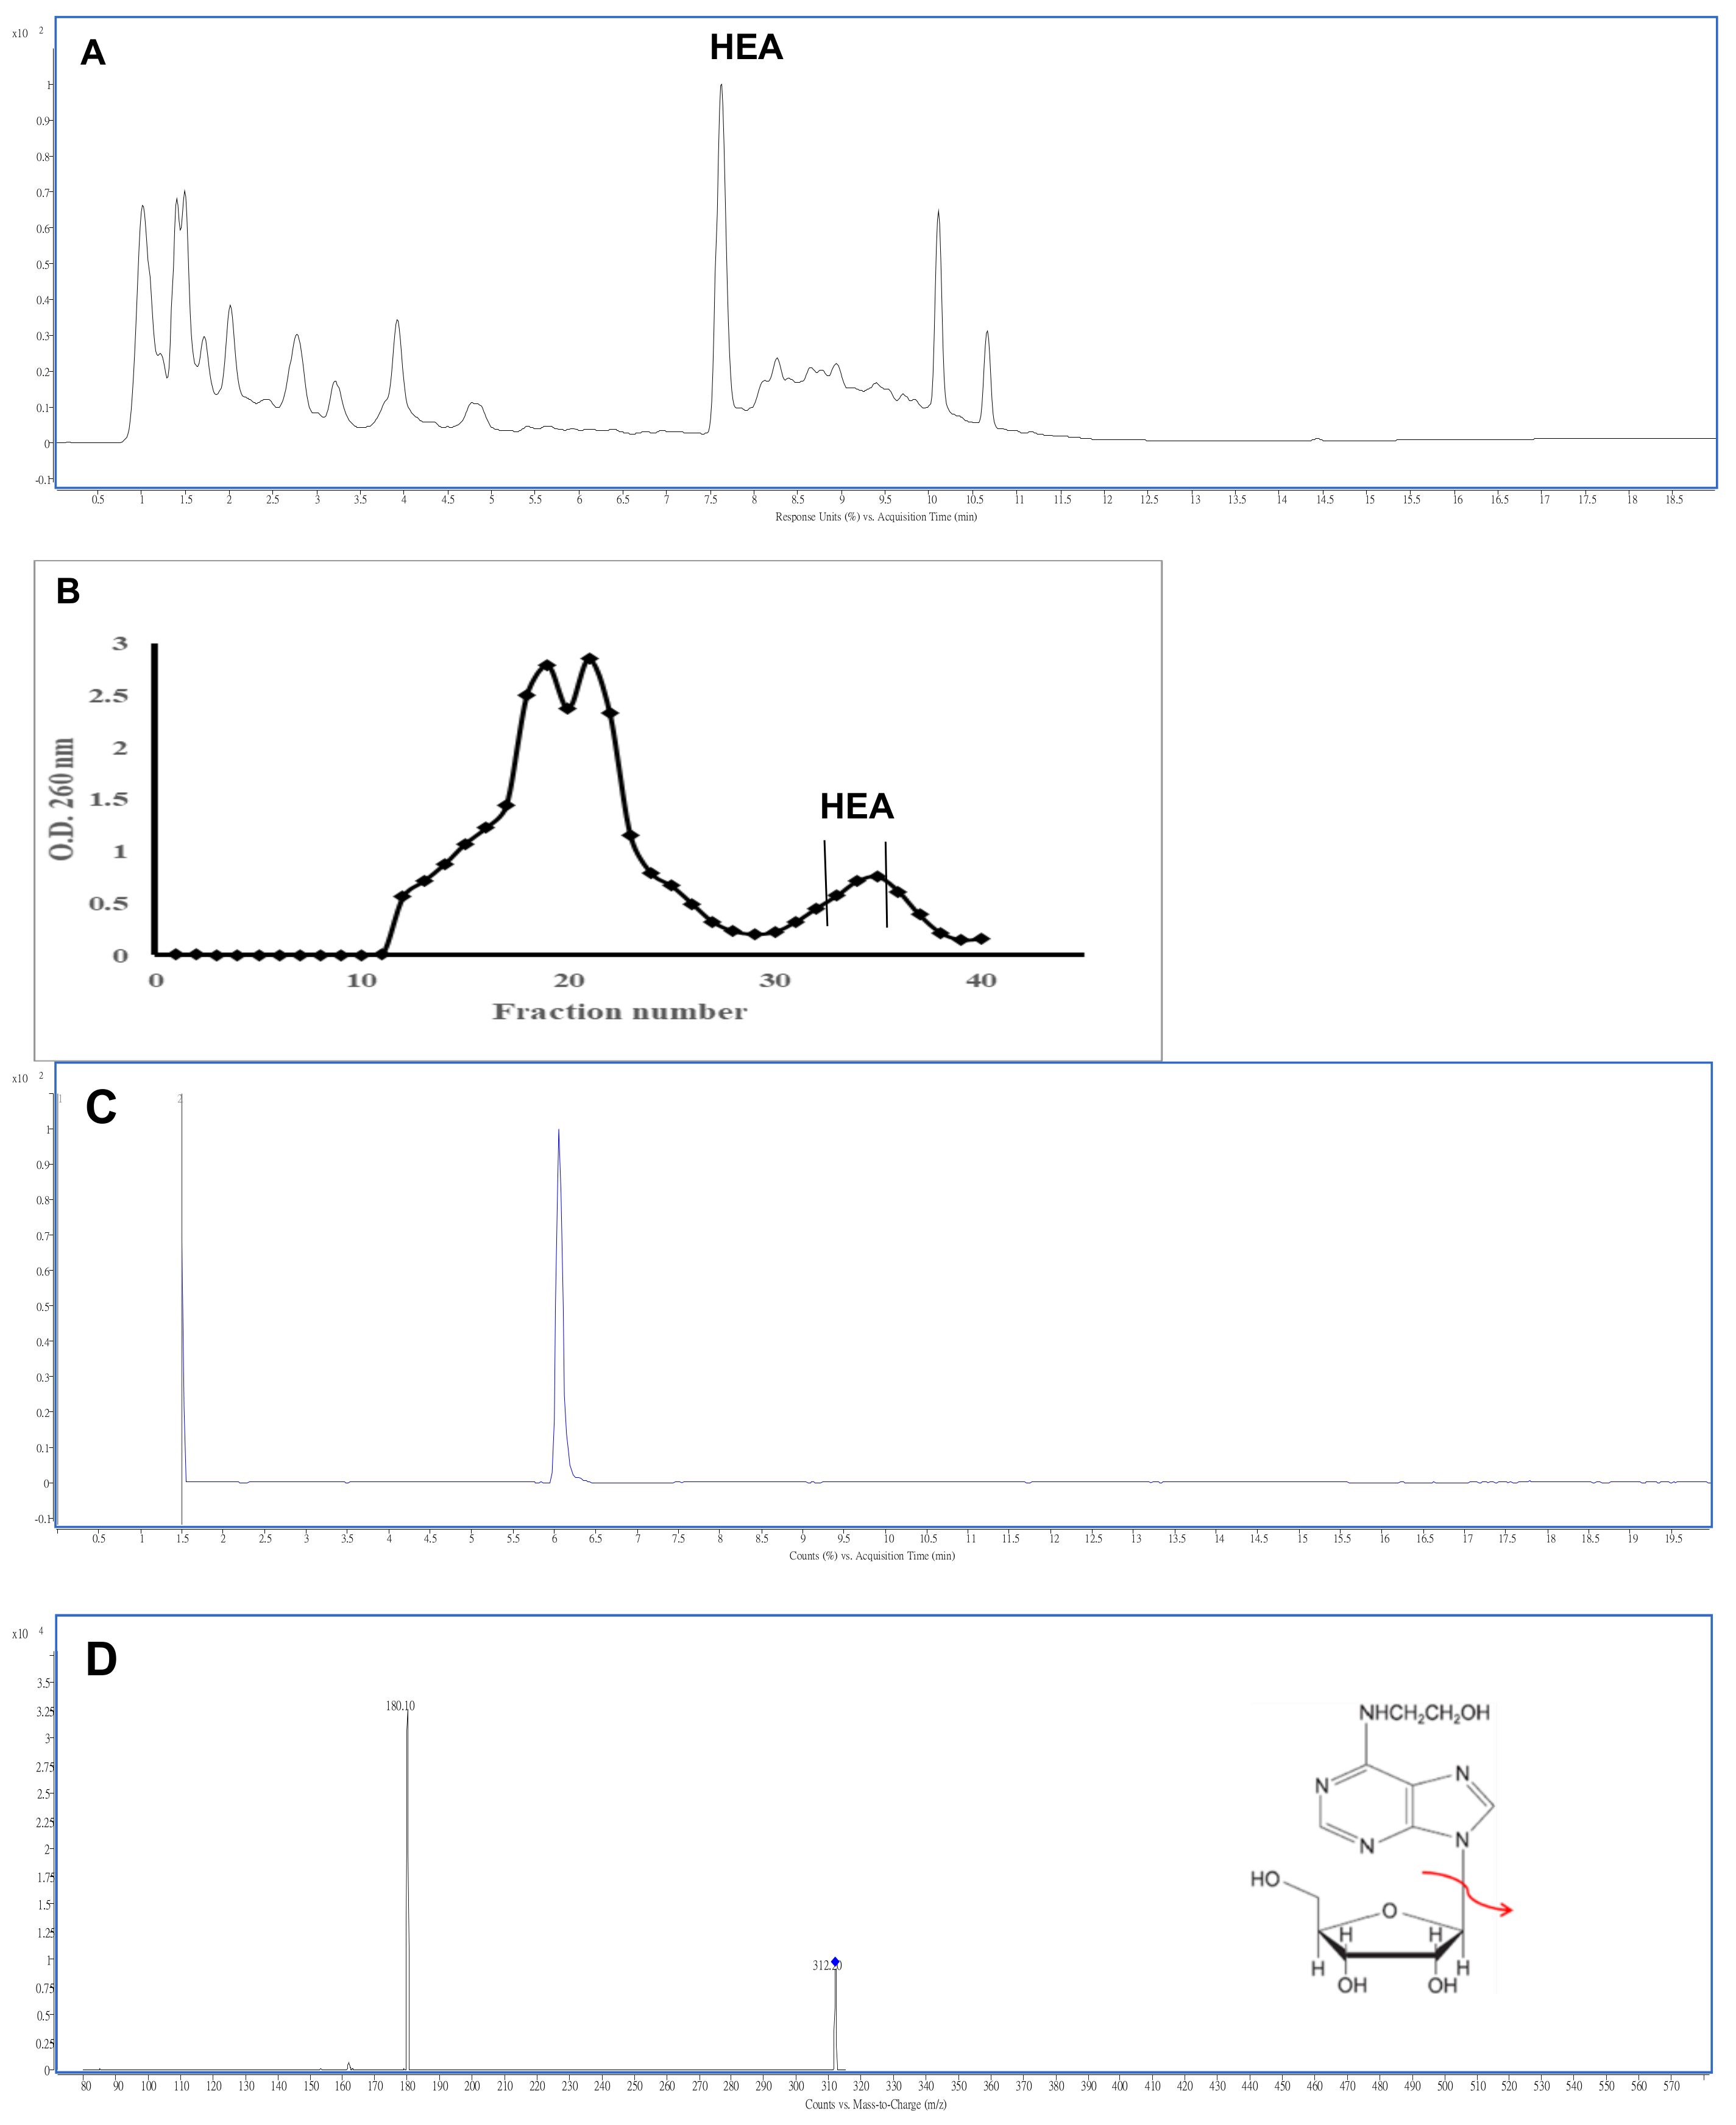
Abstract
:1. Introduction
2. Results
2.1. Isolation and Characterization of N6-(2-Hydroxyethyl)adenosine
2.2. The Cell Viability Test-MTT Assay
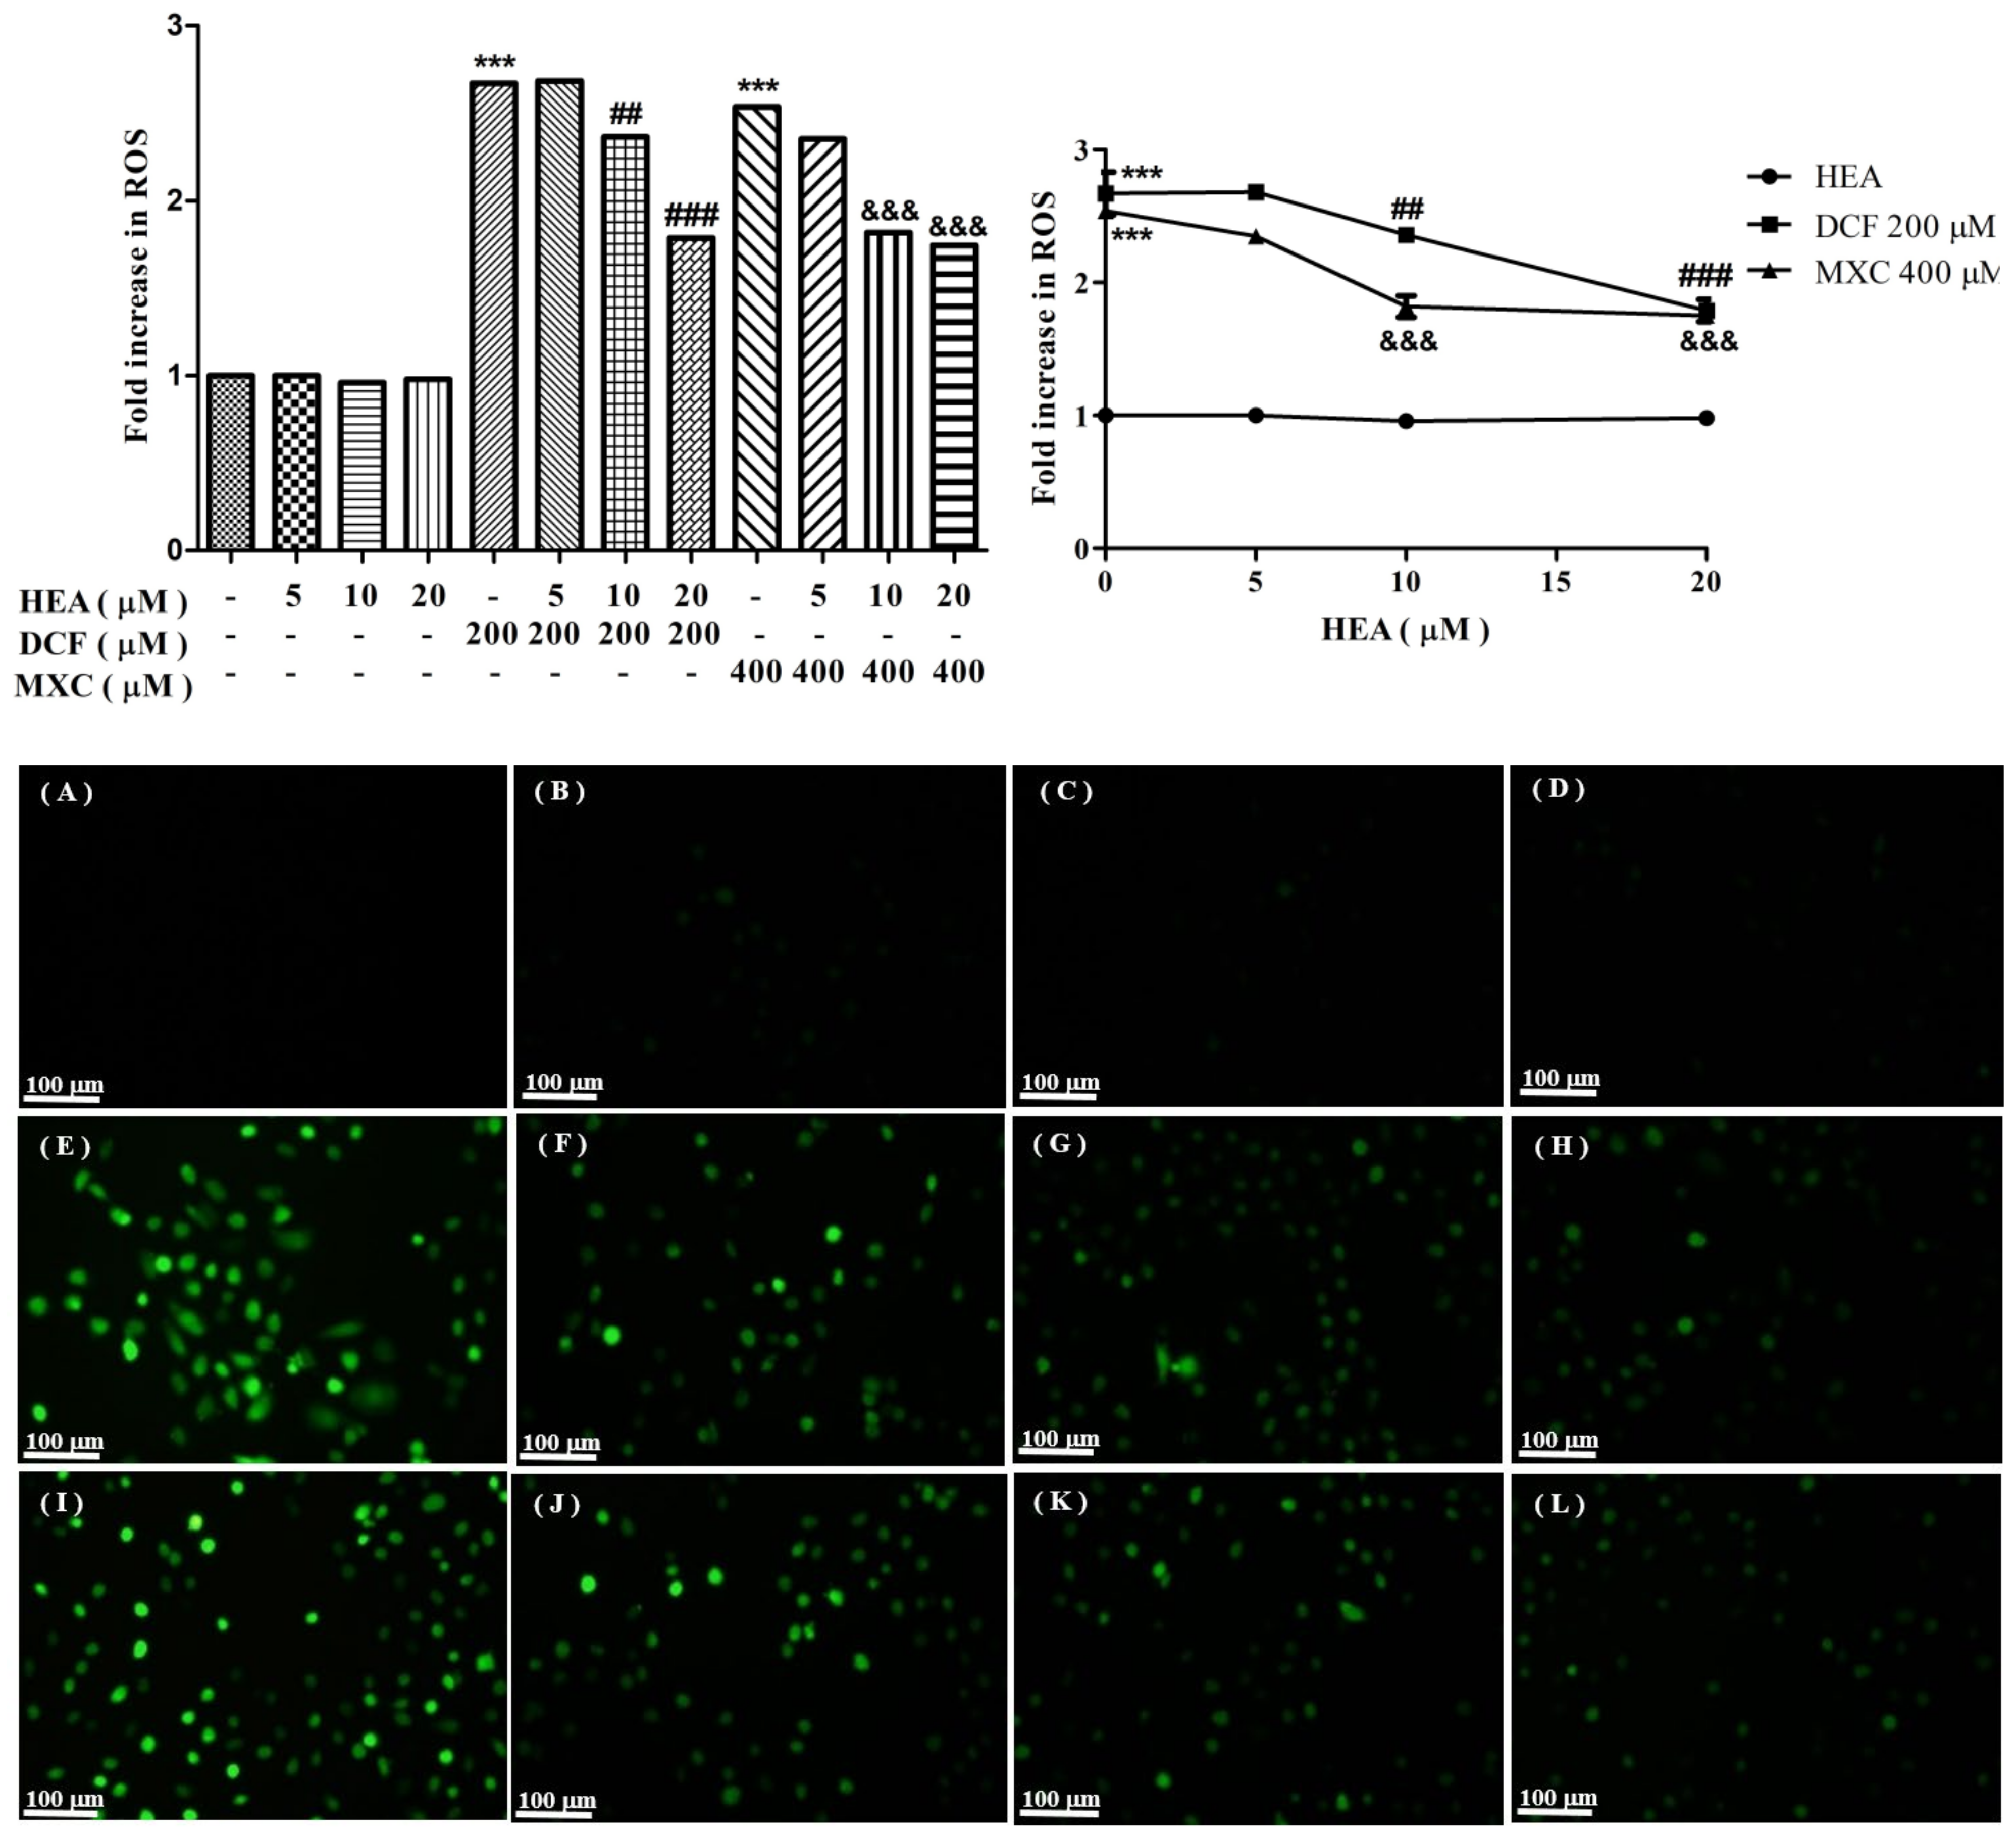
2.3. Production of Reactive Oxygen Species Affected by HEA, DCF, and MXC
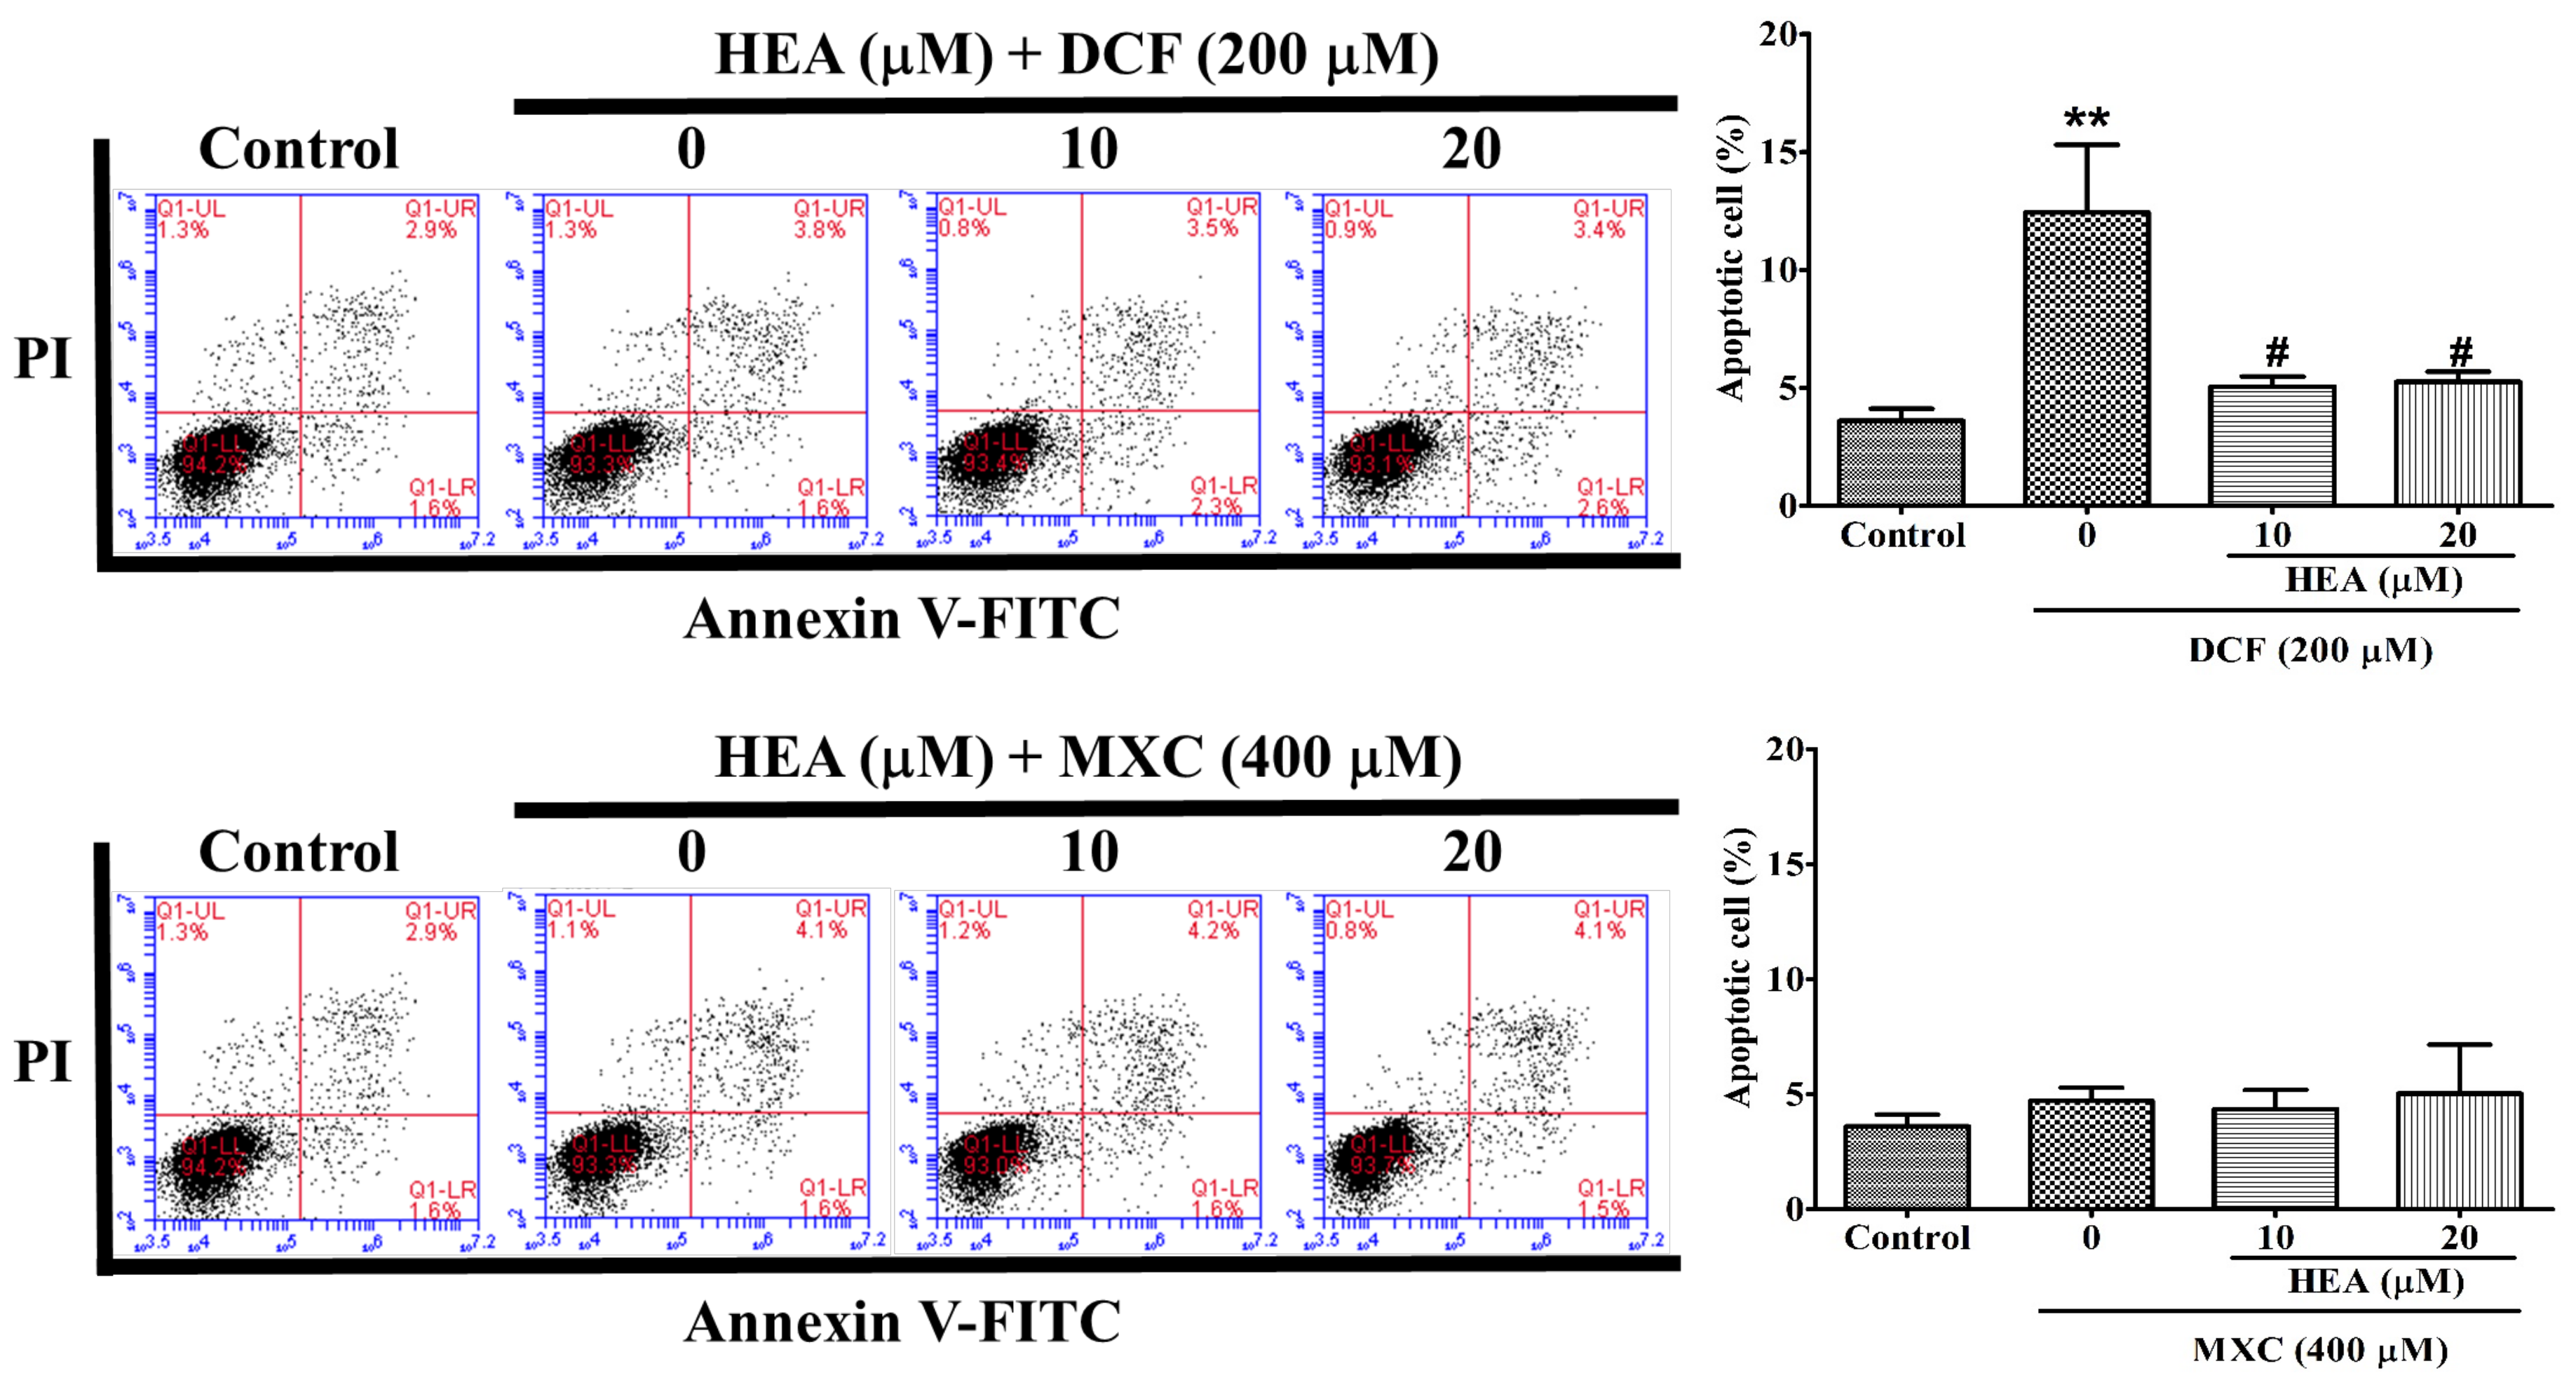
2.4. Cell Apoptosis Affected by HEA, DCF and MXC
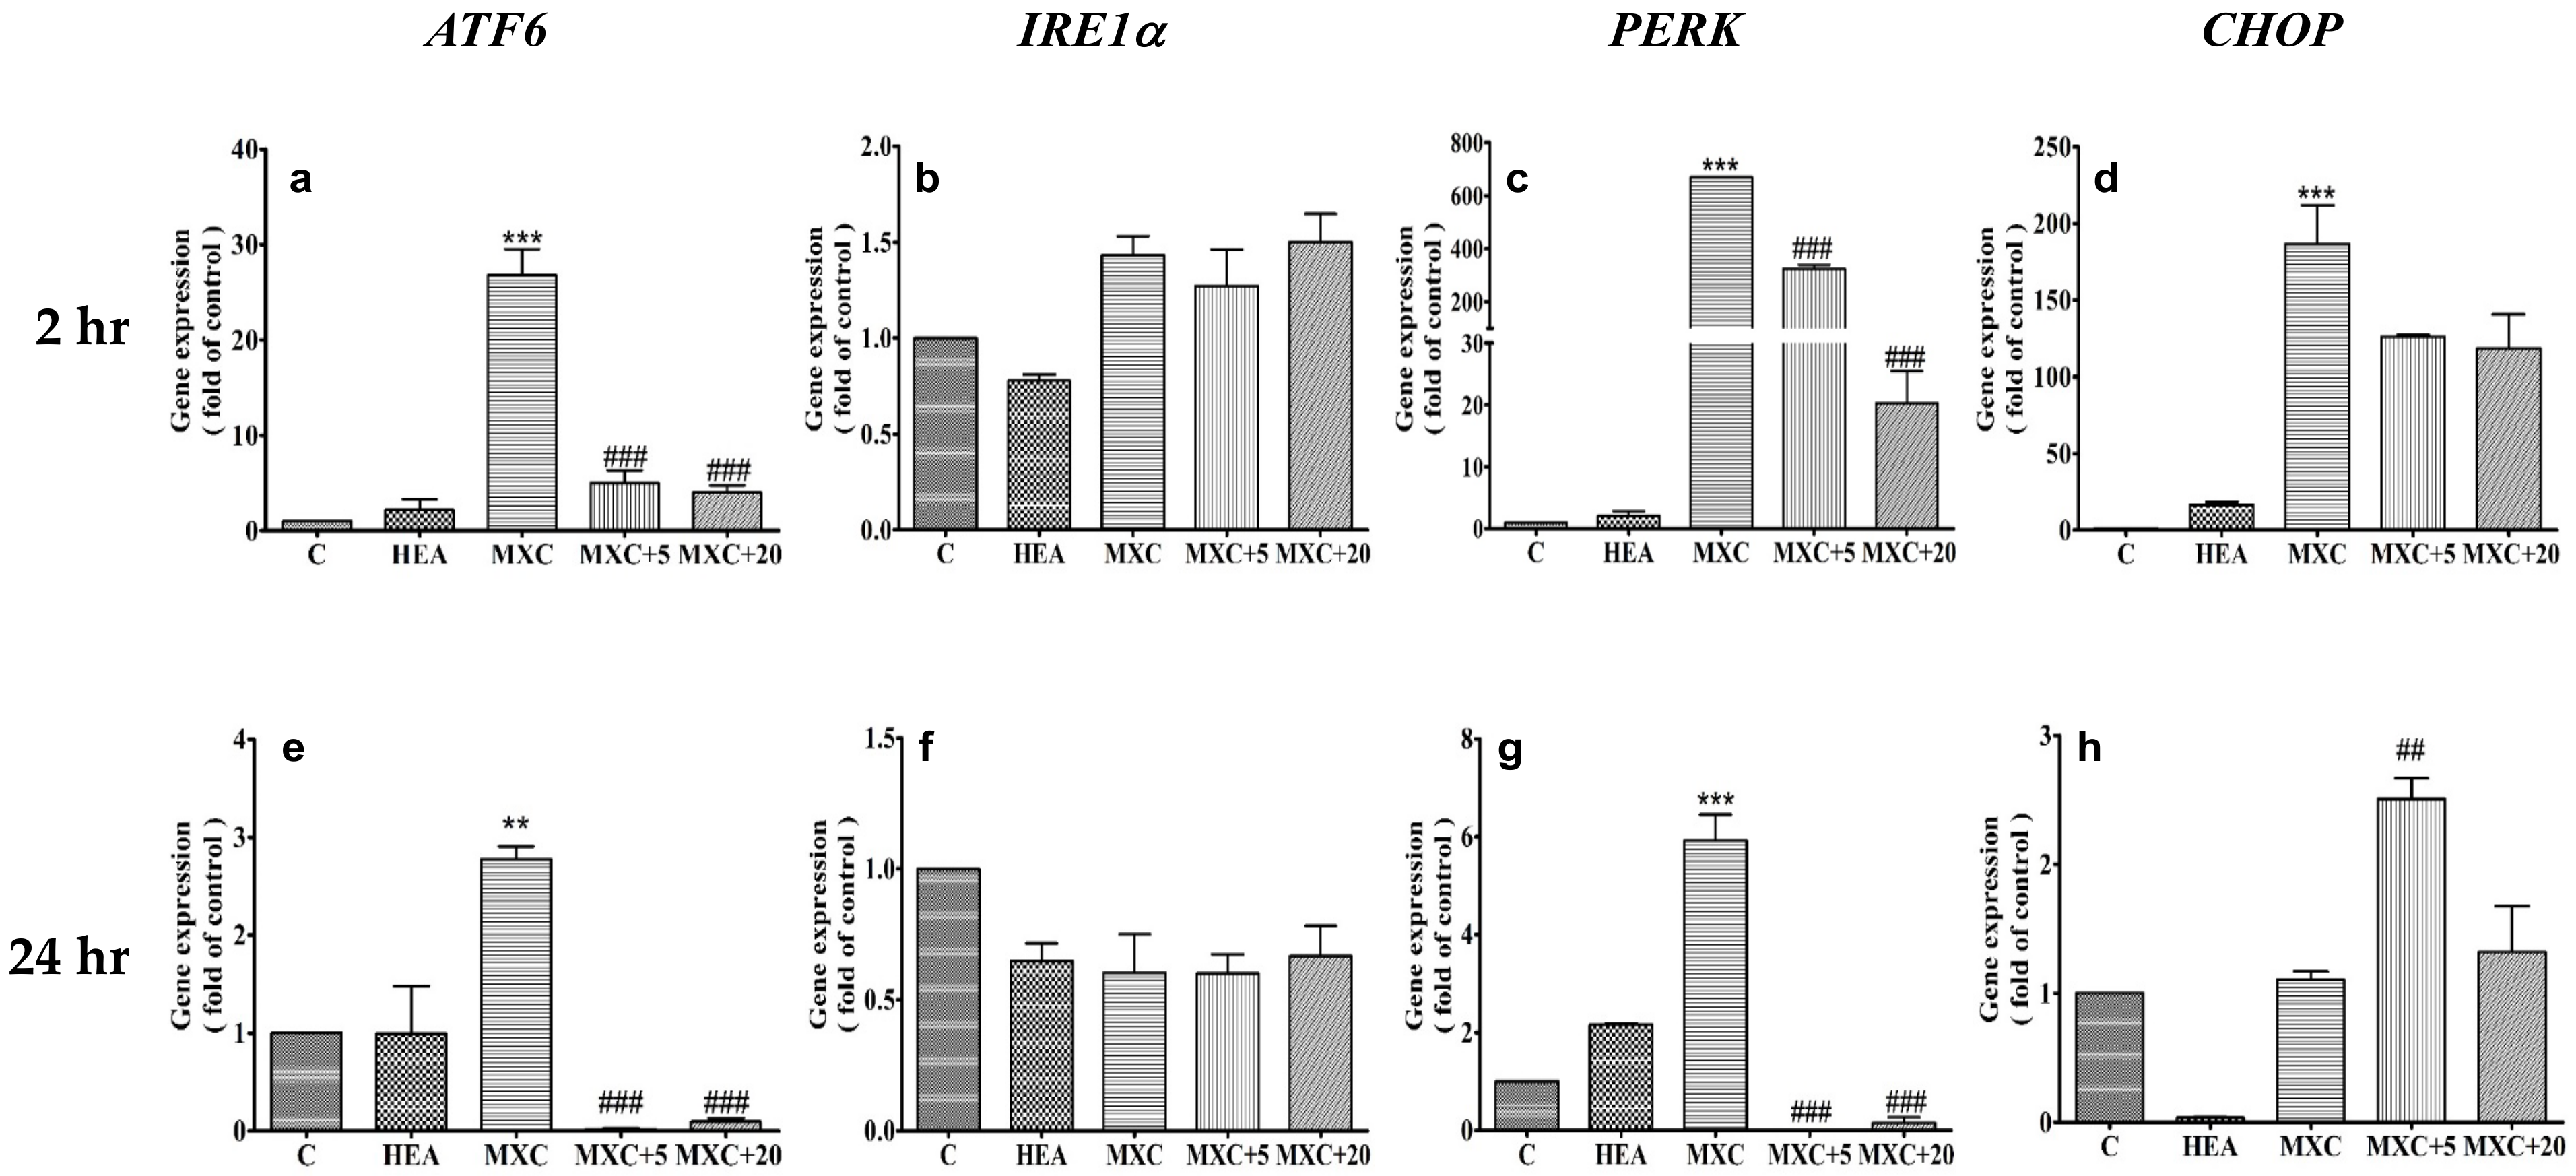
2.5. Effect of HEA on ER-Related Gene Expressions in HK–2 Cells Induced by DCF and MXC
2.6. Effect of HEA on DCF and MXC Induced the Intracellular GRP78 and CHOP Protein Expession in HK–2 Cell
3. Discussion
4. Materials and Methods
4.1. Chemicals and Antibodies
4.2. Sources of Cordyceps Cicadae (BCRC MU30106) and HK–2 Cell Line
4.3. Preparation of the Crude Mycelial Extract
4.4. Extraction and Purification of HEA
4.5. Analysis of HEA by HPLC and LC-MS/MS
4.6. Cell Culture
4.7. Cell Viability Test- MTT Assay
4.8. Assay for Reactive Oxygen Species
4.9. Analysis for Cell Apoptosis
4.10. Analysis for Gene Expression
4.10.1. Extraction of RNA from Cells
4.10.2. Reverse Transcription of RNA to cDNA
4.10.3. Quantitative Analysis of mRNA Levels
4.11. Western Blotting
4.12. Statistical Analysis
5. Conclusions
Supplementary Materials
Author Contributions
Funding
Institutional Review Board Statement
Informed Consent Statement
Acknowledgments
Conflicts of Interest
Abbreviations
| ATF6 | activating transcription factor 6 |
| BUN | blood urea nitrogen |
| CCM | Cordyceps cicadae mycelium |
| CHOP | C/EBP-homologous protein |
| COX | cyclooxygenase |
| DCF | diclofenac |
| DCFH-DA | 2′,7′-dichlorodihydrofluorescein diacetate |
| eIF2α | eukaryotic translation initiation factor 2α |
| ER | endoplasmic reticulum |
| GRP78 | 78-kDa glucose-regulated protein |
| HCC | hepatocellular carcinoma |
| HEA | N6-(2-hydroxyethyl)adenosine |
| IRE1α | Inositol-requiring transmembrane kinase/endoribonuclease 1α |
| MTT | 3-dimethylthiazol–2,5-diphenyltetrazolium bromide |
| MXC | meloxicam |
| NSAIDs | nonsteroidal antiinflammatory drugs |
| PERK | protein kinase RNA-like endoplasmic reticulum kinase |
| RIPA | Radio Immuno Precipitation Assay buffer |
| ROS | reactive oxygen species |
References
- Fattori, V.; Borghi, S.; Guazelli, C.F.S.; Giroldo, A.C.; Crespigio, J.; Bussmann, A.J.C.; Coelho-Silva, L.; Ludwig, N.G.; Mazzuco, T.; Casagrande, R.; et al. Vinpocetine reduces diclofenac-induced acute kidney injury through inhibition of oxidative stress, apoptosis, cytokine production, and NF-κB activation in mice. Pharmacol. Res. 2017, 120, 10–22. [Google Scholar] [CrossRef] [PubMed]
- Dinchuk, J.E.; Car, B.D.; Focht, R.J.; Johnston, J.J.; Jaffee, B.D.; Covington, M.B.; Contel, N.R.; Eng, V.M.; Collins, R.J.; Czerniak, P.M.; et al. Renal abnormalities and an altered inflammatory response in mice lacking cyclooxygenase II. Nature 1995, 378, 406–409. [Google Scholar] [CrossRef]
- Bush, T.M.; Shlotzhauer, T.L.; Imai, K. Nonsteroidal anti-inflammatory drugs. Proposed guidelines for monitoring toxicity. West. J. Med. 1991, 155, 39–42. [Google Scholar] [PubMed]
- Oates, J.A.; FitzGerald, G.A.; Branch, R.A.; Jackson, E.K.; Knapp, H.R.; Roberts, L.J., 2nd. Clinical implications of prostaglandin and thromboxane A2 formation (2). N. Engl. J. Med. 1988, 319, 761–767. [Google Scholar] [CrossRef] [PubMed]
- Oates, J.A.; FitzGerald, G.A.; Branch, R.A.; Jackson, E.K.; Knapp, H.R.; Roberts, L.J., 2nd. Clinical implications of prostaglandin and thromboxane A2 formation (1). N. Engl. J. Med. 1988, 319, 689–698. [Google Scholar] [CrossRef]
- Kim, S.; Joo, K.W. Electrolyte and acid-base disturbances associated with non-steroidal anti-Inflammatory drugs. Electrolyte Blood Press. 2007, 5, 116–125. [Google Scholar] [CrossRef]
- Harding, H.P.; Ron, D. Endoplasmic reticulum stress and the development of diabetes: A review. Diabetes 2002, 51, 455–461. [Google Scholar] [CrossRef] [Green Version]
- Foufelle, F.; Fromenty, B. Role of endoplasmic reticulum stress in drug-induced toxicity. A review. Pharmacol. Res. Perspect. 2016, 4, e00211. [Google Scholar] [CrossRef]
- Hickey, E.J.; Raje, R.R.; Reid, V.E.; Gross, S.M.; Ray, S.D. Diclofenac induced in vivo nephrotoxicity may involve oxidative stress-mediated massive genomic DNA fragmentation and apoptotic cell death. Free Radic. Biol. Med. 2001, 31, 139–152. [Google Scholar] [CrossRef]
- Burukoglu, D.; Baycu, C.; Taplamacioglu, F.; Sahin, E.; Bektur, E. Effects of nonsteroidal anti-inflammatory meloxicam on stomach, kidney, and liver of rats. Toxicol. Ind. Health 2016, 32, 980–986. [Google Scholar] [CrossRef]
- Andalib, S.; Naeini, A.M.; Garjani, A.; Asl, N.A.; Abdollahi, A. A comparative study pertaining to deleterious effects of diclofenac sodium and meloxicam on kidney tissue in rats. EXCLI J. 2011, 10, 149–154. [Google Scholar]
- Zhang, Q.; Olatunji, O.J.; Chen, H.; Tola, A.J.; Oluwaniyi, O.O. Evaluation of the anti-diabetic activity of polysaccharide from Cordyceps cicadae in experimental diabetic rats. Chem. Biodivers. 2018, 15, e1800219. [Google Scholar] [CrossRef]
- Zhu, Y.; Yu, X.; Ge, Q.; Li, J.; Wang, D.; Wei, Y.; Ouyang, Z. Antioxidant and anti-aging activities of polysaccharides from Cordyceps cicadae. Int. J. Biol. Macromol. 2020, 157, 394–400. [Google Scholar] [CrossRef] [PubMed]
- Meng, Z.; Kang, J.; Wen, T.-C.; Lei, B.; Hyde, K.D. Cordycepin and N6-(2-hydroxyethyl)-adenosine from Cordyceps pruinosa and their interaction with human serum albumin. PLoS ONE 2015, 10, e0121669. [Google Scholar] [CrossRef] [PubMed]
- Wang, X.; Qin, A.; Xiao, F.; Olatunji, O.J.; Zhang, S.; Pan, D.; Han, W.; Wang, D.; Ni, Y. N6-(2-hydroxyethyl)adenosine from Cordyceps cicadae protects against diabetic kidney disease via alleviation of oxidative stress and inflammation. J. Food Biochem. 2018, 43, e12727. [Google Scholar] [CrossRef] [PubMed]
- Zhu, R.; Zheng, R.; Deng, Y.; Chen, Y.; Zhang, S. Ergosterol peroxide from Cordyceps cicadae ameliorates TGF-β1-induced activation of kidney fibroblasts. Phytomedicine 2014, 21, 372–378. [Google Scholar] [CrossRef]
- Li, L.; Zhang, T.; Li, C.; Xie, L.; Li, N.; Hou, T.; Wang, Y.; Wang, B. Potential therapeutic effects of Cordyceps cicadae and Paecilomyces cicadae on adenine-induced chronic renal failure in rats and their phytochemical analysis. Drug Des. Dev. Ther. 2019, 13, 103–117. [Google Scholar] [CrossRef] [Green Version]
- Huang, Y.S.; Wang, X.; Feng, Z.; Cui, H.; Zhu, Z.; Xia, C.; Han, X.; Liu, W.J.; Liu, Y.N. Cordyceps cicadae prevents renal tubular epithelial cell apoptosis by regulating the SIRT1/p53 pathway in hypertensive renal injury. Evid. Based Complement. Alternat. Med. 2020, 1–13. [Google Scholar] [CrossRef]
- Yang, J.; Dong, H.; Wang, Y.; Jiang, Y.; Zhang, W.; Lu, Y.; Chen, Y.; Chen, L. Cordyceps cicadae polysaccharides ameliorated renal interstitial fibrosis in diabetic nephropathy rats by repressing inflammation and modulating gut microbiota dysbiosis. Int. J. Biol. Macromol. 2020, 163, 442–456. [Google Scholar] [CrossRef]
- Tsai, Y.-S.; Hsu, J.-H.; Lin, D.P.-C.; Chang, H.-H.; Chang, W.-J.; Chen, Y.-L.; Chen, C.-C. Safety assessment of HEA-enriched Cordyceps cicadae Mycelium: A randomized clinical trial. J. Am. Coll. Nutr. 2020, 1–6. [Google Scholar] [CrossRef]
- Latini, S.; Pedata, F. Adenosine in the central nervous system: Release mechanisms and extracellular concentrations. J. Neurochem. 2001, 79, 463–484. [Google Scholar] [CrossRef] [Green Version]
- Nakav, S.; Chaimovitz, C.; Sufaro, Y.; Lewis, E.C.; Shaked, G.; Czeiger, D.; Zlotnik, M.; Douvdevani, A. Anti-inflammatory preconditioning by agonists of adenosine A1 receptor. PLoS ONE 2008, 3, e2107. [Google Scholar] [CrossRef] [PubMed] [Green Version]
- Lu, M.-Y.; Chen, C.-C.; Li, L.-Y.; Lin, T.-W.; Kuo, C.-F. N6-(2-hydroxyethyl)adenosine in the medicinal mushroom Cordyceps cicadae attenuates lipopolysaccharide-stimulated pro-inflammatory responses by suppressing TLR4-mediated NF-κB signaling pathways. Nat. Prod. 2015, 78, 2452–2460. [Google Scholar] [CrossRef] [PubMed]
- Zhu, W.; Chai, Y.; Jin, Y.; Li, X.; Yu, X. Effects of antinocieptive compound from Ophiocordyceps sobolifera on the transcriptome and Adora1 etc. pain-related genes in gouty rats. Mygosystema 2017, 36, 48–59. [Google Scholar]
- Peng, X.; Chai, Y.; Zhu, B.; Jin, Y.; Li, X.; Yu, L. The protective effects of N6-(2-hydroxyethyl)-adenosine extracted from Ophiocordyceps sobolifera on renal ischemia reperfusion injury (IRI) in mice. Mygosystema 2015, 34, 311–320. [Google Scholar]
- Zheng, R.; Zhu, R.; Li, X.; Li, X.; Shen, L.; Chen, Y.; Zhong, Y.; Deng, Y. N6-(2-hydroxyethyl)adenosine from Cordyceps cicadae ameliorates renal interstitial fibrosis and prevents inflammation via TGF-β1/Smad and NF-κB signaling pathway. Front Physiol. 2018, 9, 1229. [Google Scholar] [CrossRef]
- Xie, H.; Li, X.; Yang, W.; Yu, L.; Jiang, X.; Chen, Y.; Shen, Z.; Li, C.; Gu, M.; Shi, L. N6-(2-hydroxyethyl)-adenosine induces apoptosis via ER stress and autophagy of gastric carcinoma cells in vitro and in vivo. Int. J. Mol. Sci. 2020, 21, 5815. [Google Scholar] [CrossRef]
- Koupenova, M.; Ravid, K. Adenosine, adenosine receptors and their role in glucose homeostasis and lipid metabolism. J. Cell Physiol. 2013, 8, 1703–1712. [Google Scholar] [CrossRef]
- Oyadomari, S.; Mori, M. Roles of CHOP/GADD153 in endoplasmic reticulum stress. Cell Death Differ. 2004, 11, 381–389. [Google Scholar] [CrossRef] [Green Version]
- Kim, I.; Xu, W.; Reed, J.C. Cell death and endoplasmic reticulum stress: Disease relevance and therapeutic opportunities. Nat. Rev. Drug Discov. 2008, 7, 1013–1030. [Google Scholar] [CrossRef]
- Nishitoh, H. CHOP is a multifunctional transcription factor in the ER stress response. J. Biochem. 2012, 151, 217–219. [Google Scholar] [CrossRef] [Green Version]
- Ng, L.E.; Halliwell, B.; Wong, K.P. Nephrotoxic cell death by diclofenac and meloxicam. Biochem. Biophys. Res. Commun. 2008, 369, 873–877. [Google Scholar] [CrossRef]
- Gan, T.J. Diclofenac: An update on its mechanism of action and safety profile. Curr. Med. Res. Opin. 2010, 26, 1715–1731. [Google Scholar] [CrossRef] [PubMed]
- Churchill, L.; Graham, A.G.; Shih, C.K.; Pauletti, D.; Farina, P.R.; Grob, P.M. Selective inhibition of human cyclo-oxygenase-2 by meloxicam. Inflammopharmacology 1996, 4, 125–135. [Google Scholar] [CrossRef]
- Premereur, N.; Vanden, B.C.; Roels, F. Cytochrome P-450-dependent H2O2 production demonstrated in vivo influence of phenobarbital and allylisopropylacetamide. FEBS Lett. 1986, 199, 19–22. [Google Scholar] [CrossRef]
- Davydov, D.R. Microsomal monooxygenase in apoptosis, another target for cytochrome c signaling? Trends Biochem. Sci. 2001, 26, 155–160. [Google Scholar] [CrossRef]
- Kim, H.-R.; Lee, G.-H.; Cho, E.Y.; Chae, S.-W.; Ahn, T.; Chae, H.-J. Bax inhibitor 1 regulates ER-stress-induced ROS accumulation through the regulation of cytochrome P450 2E1. J. Cell Sci. 2009, 122, 1126–1133. [Google Scholar] [CrossRef] [Green Version]
- Ghosh, R.; Alajbegovic, A.; Aldrin, V.; Gomes, A.V. NSAIDs and cardiovascular diseases: Role of reactive oxygen species. Oxid. Med. Cell. Longev. 2015, 1–25. [Google Scholar] [CrossRef] [Green Version]
- Digaleh, H.; Kiaei, M.; Khodagholi, F. Nrf2 and Nrf1 signaling and ER stress crosstalk: Implication for proteasomal degradation and autophagy. Cell Mol. Life Sci. 2013, 70, 4681–4694. [Google Scholar] [CrossRef]
- Hoyer-Hansen, M.; Jäättelä, M. Connecting endoplasmic reticulum stress to autophagy by unfolded protein response and calcium. Cell Death Differ. 2007, 14, 1576–1582. [Google Scholar] [CrossRef]
- Iurlaro, R.; Munoz-Pinedo, C. Cell death induced by endoplasmic reticulum stress. FEBS J. 2016, 283, 2640–2652. [Google Scholar] [CrossRef] [PubMed] [Green Version]
- Whitney, M.L.; Jefferson, L.S.; Kimball, S.R. ATF4 is necessary and sufficient for ER stress-induced upregulation of REDD1 expression. Biochem. Biophys. Res. Commun. 2009, 379, 451–455. [Google Scholar] [CrossRef] [PubMed] [Green Version]
- Dayer, J.M. Evidence for the biological modulation of IL-1 activity: The role of IL-1Ra. Clin. Exp. Rheumatol. 2002, 20, 14–20. [Google Scholar]
- Benosman, S.; Ravanan, P.; Correa, R.G.; Hou, Y.C.; Yu, M.; Gulen, M.F.; Li, X.; Thomas, J.; Cuddy, M.; Matsuzawa, Y.; et al. Interleukin-1 receptor-associated kinase-2 (IRAK2) is a critical mediator of endoplasmic reticulum (ER) stress signaling. PLoS ONE 2013, 8, e64256. [Google Scholar] [CrossRef] [Green Version]
- Deguine, J.; Barton, G.M. MyD88: A central player in innate immune signaling. F1000Prime Rep. 2014, 6, 97. [Google Scholar] [CrossRef]
- Li, Y.L.; Guo, F.K.; Wu, S.G. Effects of antisense IRAK-2 oligonucleotides on PGI2 release induced by IL-1 and TNF. Acta Pharmacol. Sin. 2000, 21, 646–648. [Google Scholar] [PubMed]
- Scholz, C.C.; Cavadas, M.A.S.; Tambuwala, M.M.; Hams, E.; Rodríguez, J.; von Kriegsheim, A.; Cotter, P.; Bruning, U.; Fallon, P.G.; Cheong, A.; et al. Regulation of IL-1β–induced NF-κB by hydroxylases links key hypoxic and inflammatory signaling pathways. Proc. Natl. Acad. Sci. USA 2013, 110, 18490–18495. [Google Scholar] [CrossRef] [Green Version]
- Keating, S.E.; Maloney, G.M.; Moran, E.M.; Bowie, A.G. IRAK-2 participates in multiple toll-like receptor signaling pathways to NFκB via activation of TRAF6 ubiquitination. J. Biol. Chem. 2007, 282, 33435–33443. [Google Scholar] [CrossRef] [PubMed] [Green Version]
- Yin, H.; Bai, J.Y.; Cheng, G.F. Effect of anti-inflammatory drugs on the NF-kappaB activation of HEK293 cells. Acta Pharmaceutica Sinica 2005, 40, 513–517. [Google Scholar] [PubMed]
- Hatano, E.; Bennett, B.L.; Manning, A.M.; Qian, T.; Lemasters, J.J.; Brenner, D.A. NF-kappaB stimulates inducible nitric oxide synthase to protect mouse hepatocytes from TNF-alpha- and Fas-mediated apoptosis. Gastroenterology 2001, 120, 1251–1262. [Google Scholar] [CrossRef] [PubMed]
- Du, Q.; Geller, D.A. Cross-regulation between Wnt and NF-κB signaling pathways. Immunopathol. Dis. Therap. 2010, 1, 155–181. [Google Scholar] [CrossRef]
- Mosmann, T. Rapid colorimetric assay for cellular growth and survival: Application to proliferation and cytotoxicity assays. J. Immunol. Methods 1983, 65, 55–63. [Google Scholar] [CrossRef]
- Chyau, C.-C.; Wang, H.-F.; Zhang, W.-J.; Chen, C.-C.; Huang, S.-H.; Chang, C.-C.; Peng, R.Y. Antrodan alleviates high-fat and high-fructose diet-induced fatty liver disease in C57BL/6 mice model via AMPK/Sirt1/SREBP-1c/PPARγ pathway. Int. J. Mol. Sci. 2020, 21, 360. [Google Scholar] [CrossRef] [PubMed] [Green Version]


Publisher’s Note: MDPI stays neutral with regard to jurisdictional claims in published maps and institutional affiliations. |
© 2021 by the authors. Licensee MDPI, Basel, Switzerland. This article is an open access article distributed under the terms and conditions of the Creative Commons Attribution (CC BY) license (http://creativecommons.org/licenses/by/4.0/).
Share and Cite
Chyau, C.-C.; Wu, H.-L.; Peng, C.-C.; Huang, S.-H.; Chen, C.-C.; Chen, C.-H.; Peng, R.Y. Potential Protection Effect of ER Homeostasis of N6-(2-Hydroxyethyl)adenosine Isolated from Cordyceps cicadae in Nonsteroidal Anti-Inflammatory Drug-Stimulated Human Proximal Tubular Cells. Int. J. Mol. Sci. 2021, 22, 1577. https://0-doi-org.brum.beds.ac.uk/10.3390/ijms22041577
Chyau C-C, Wu H-L, Peng C-C, Huang S-H, Chen C-C, Chen C-H, Peng RY. Potential Protection Effect of ER Homeostasis of N6-(2-Hydroxyethyl)adenosine Isolated from Cordyceps cicadae in Nonsteroidal Anti-Inflammatory Drug-Stimulated Human Proximal Tubular Cells. International Journal of Molecular Sciences. 2021; 22(4):1577. https://0-doi-org.brum.beds.ac.uk/10.3390/ijms22041577
Chicago/Turabian StyleChyau, Charng-Cherng, Huei-Lin Wu, Chiung-Chi Peng, Shiau-Huei Huang, Chin-Chu Chen, Cheng-Hsu Chen, and Robert Y. Peng. 2021. "Potential Protection Effect of ER Homeostasis of N6-(2-Hydroxyethyl)adenosine Isolated from Cordyceps cicadae in Nonsteroidal Anti-Inflammatory Drug-Stimulated Human Proximal Tubular Cells" International Journal of Molecular Sciences 22, no. 4: 1577. https://0-doi-org.brum.beds.ac.uk/10.3390/ijms22041577