
Energy Metabolites as Biomarkers in Ischemic and Dilated Cardiomyopathy

 , , , , , , ,
Abstract
:1. Introduction
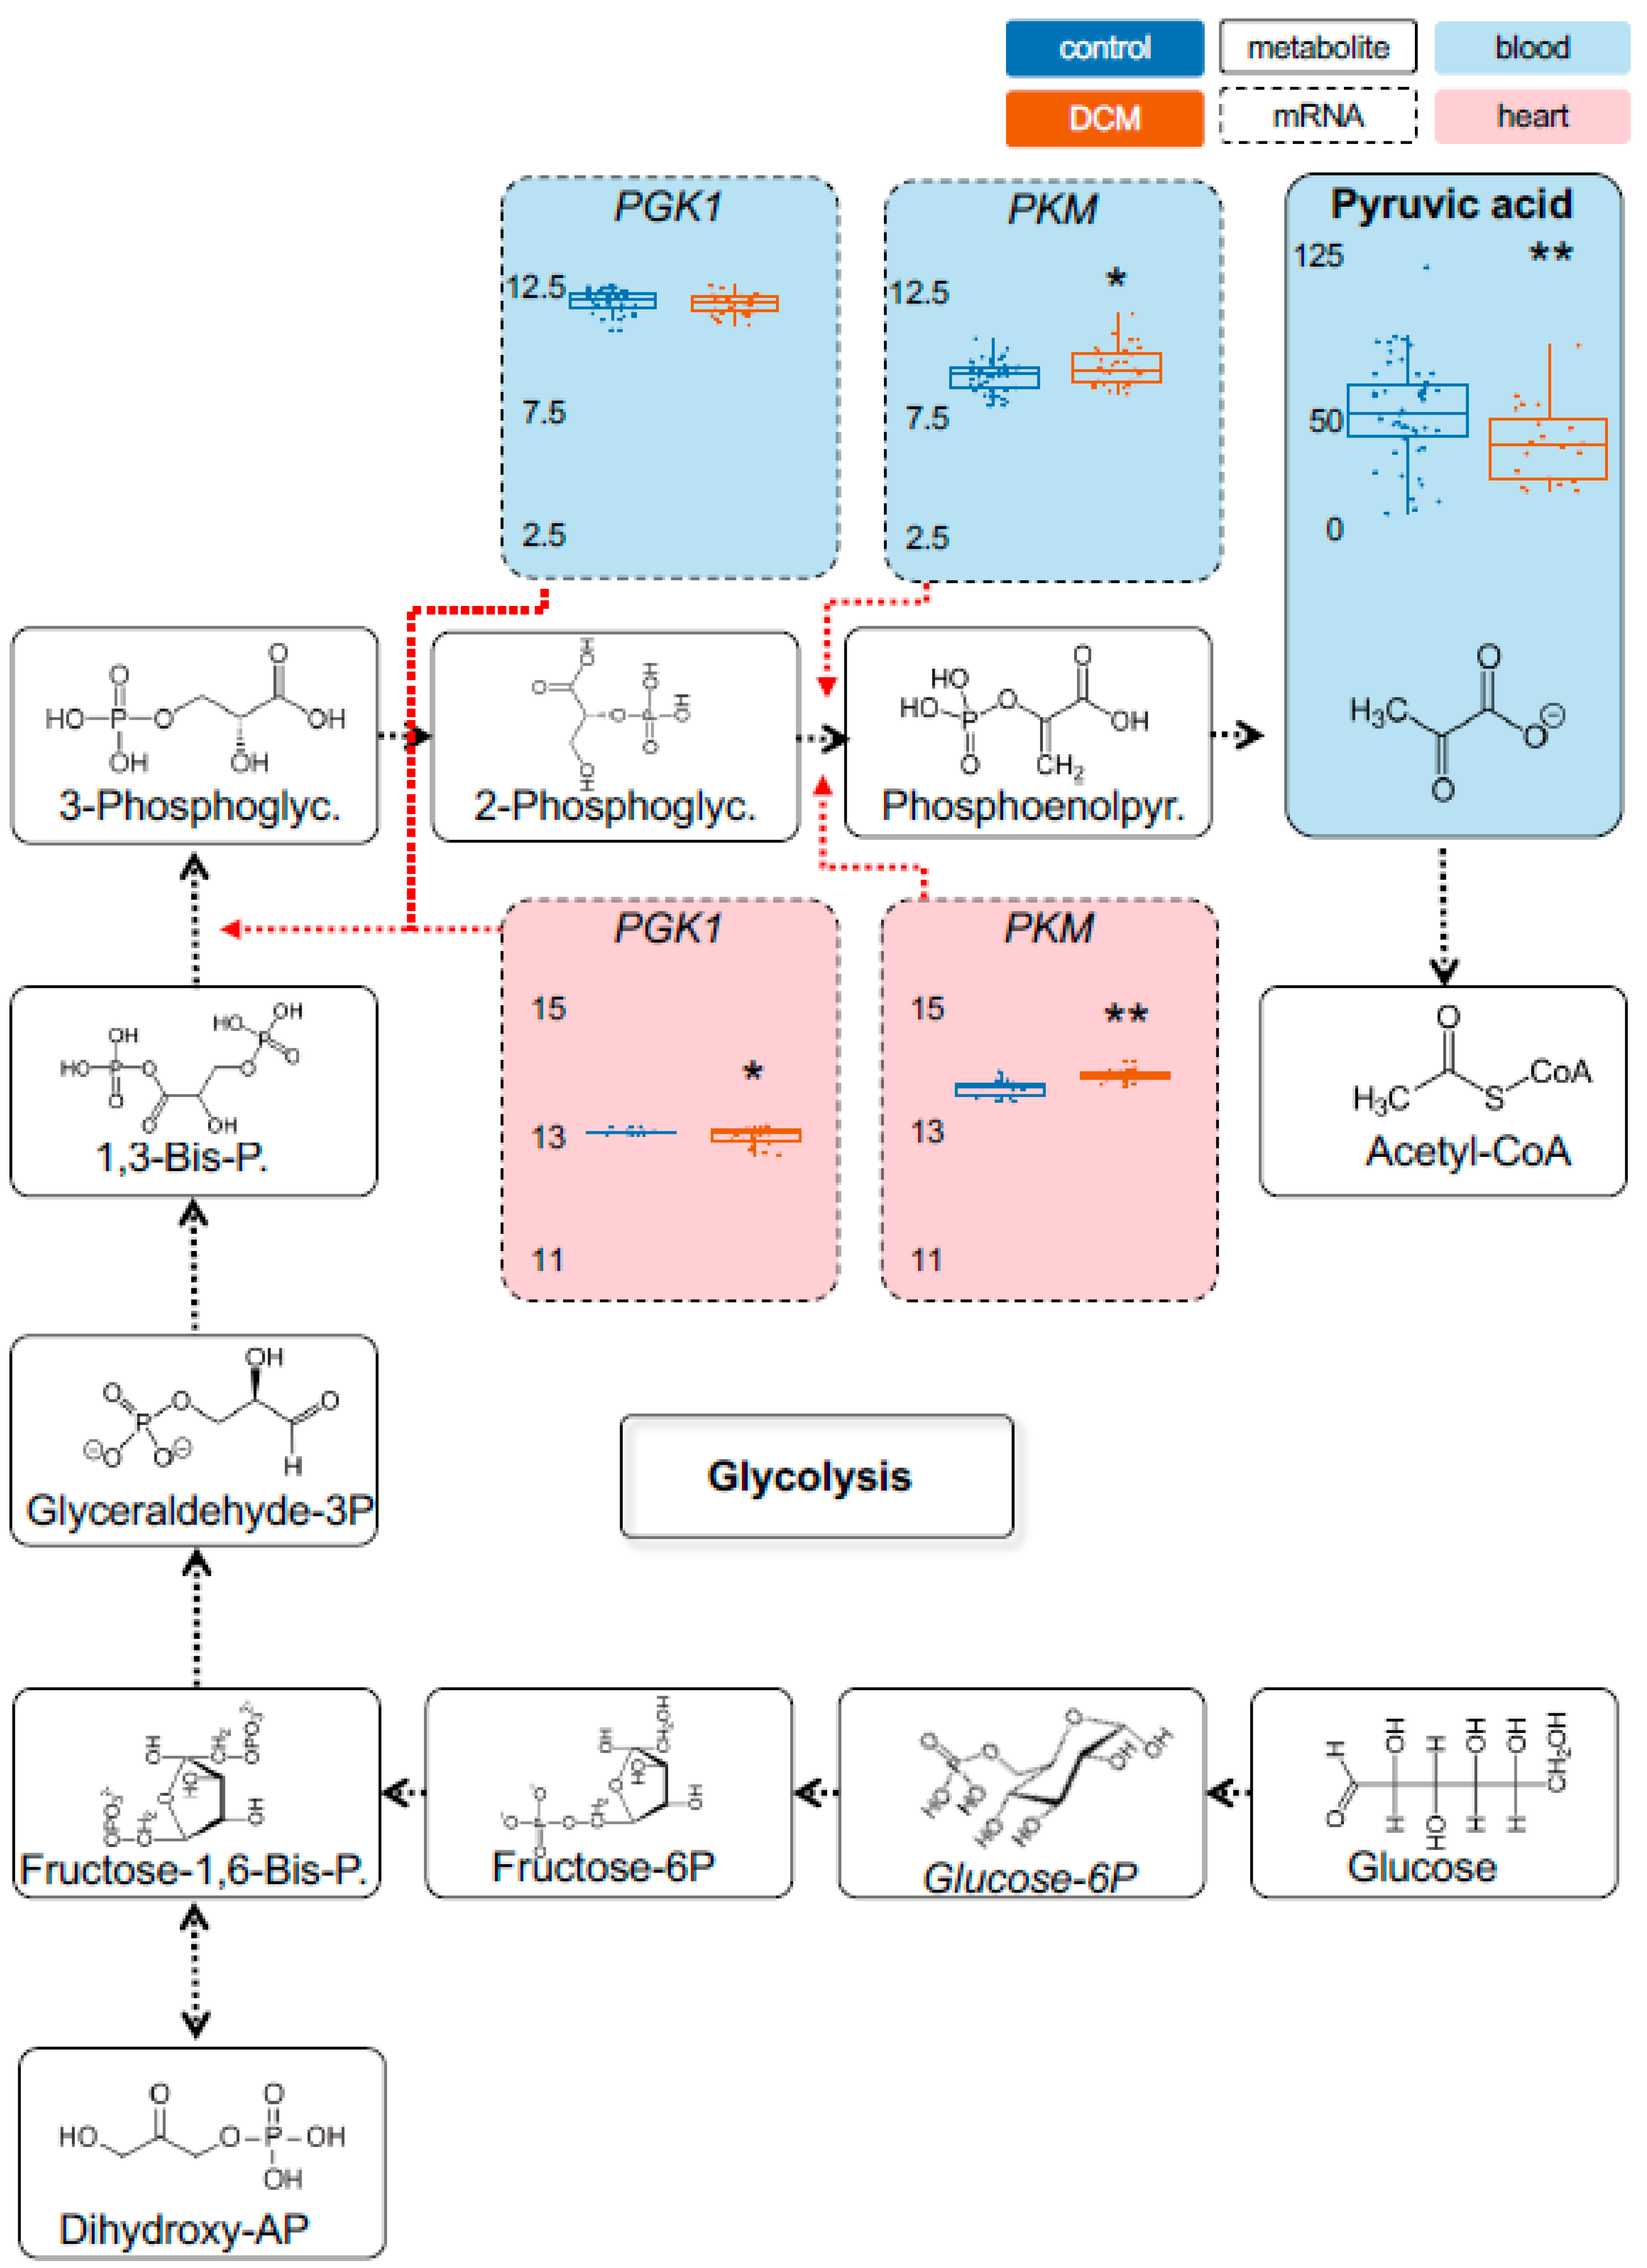
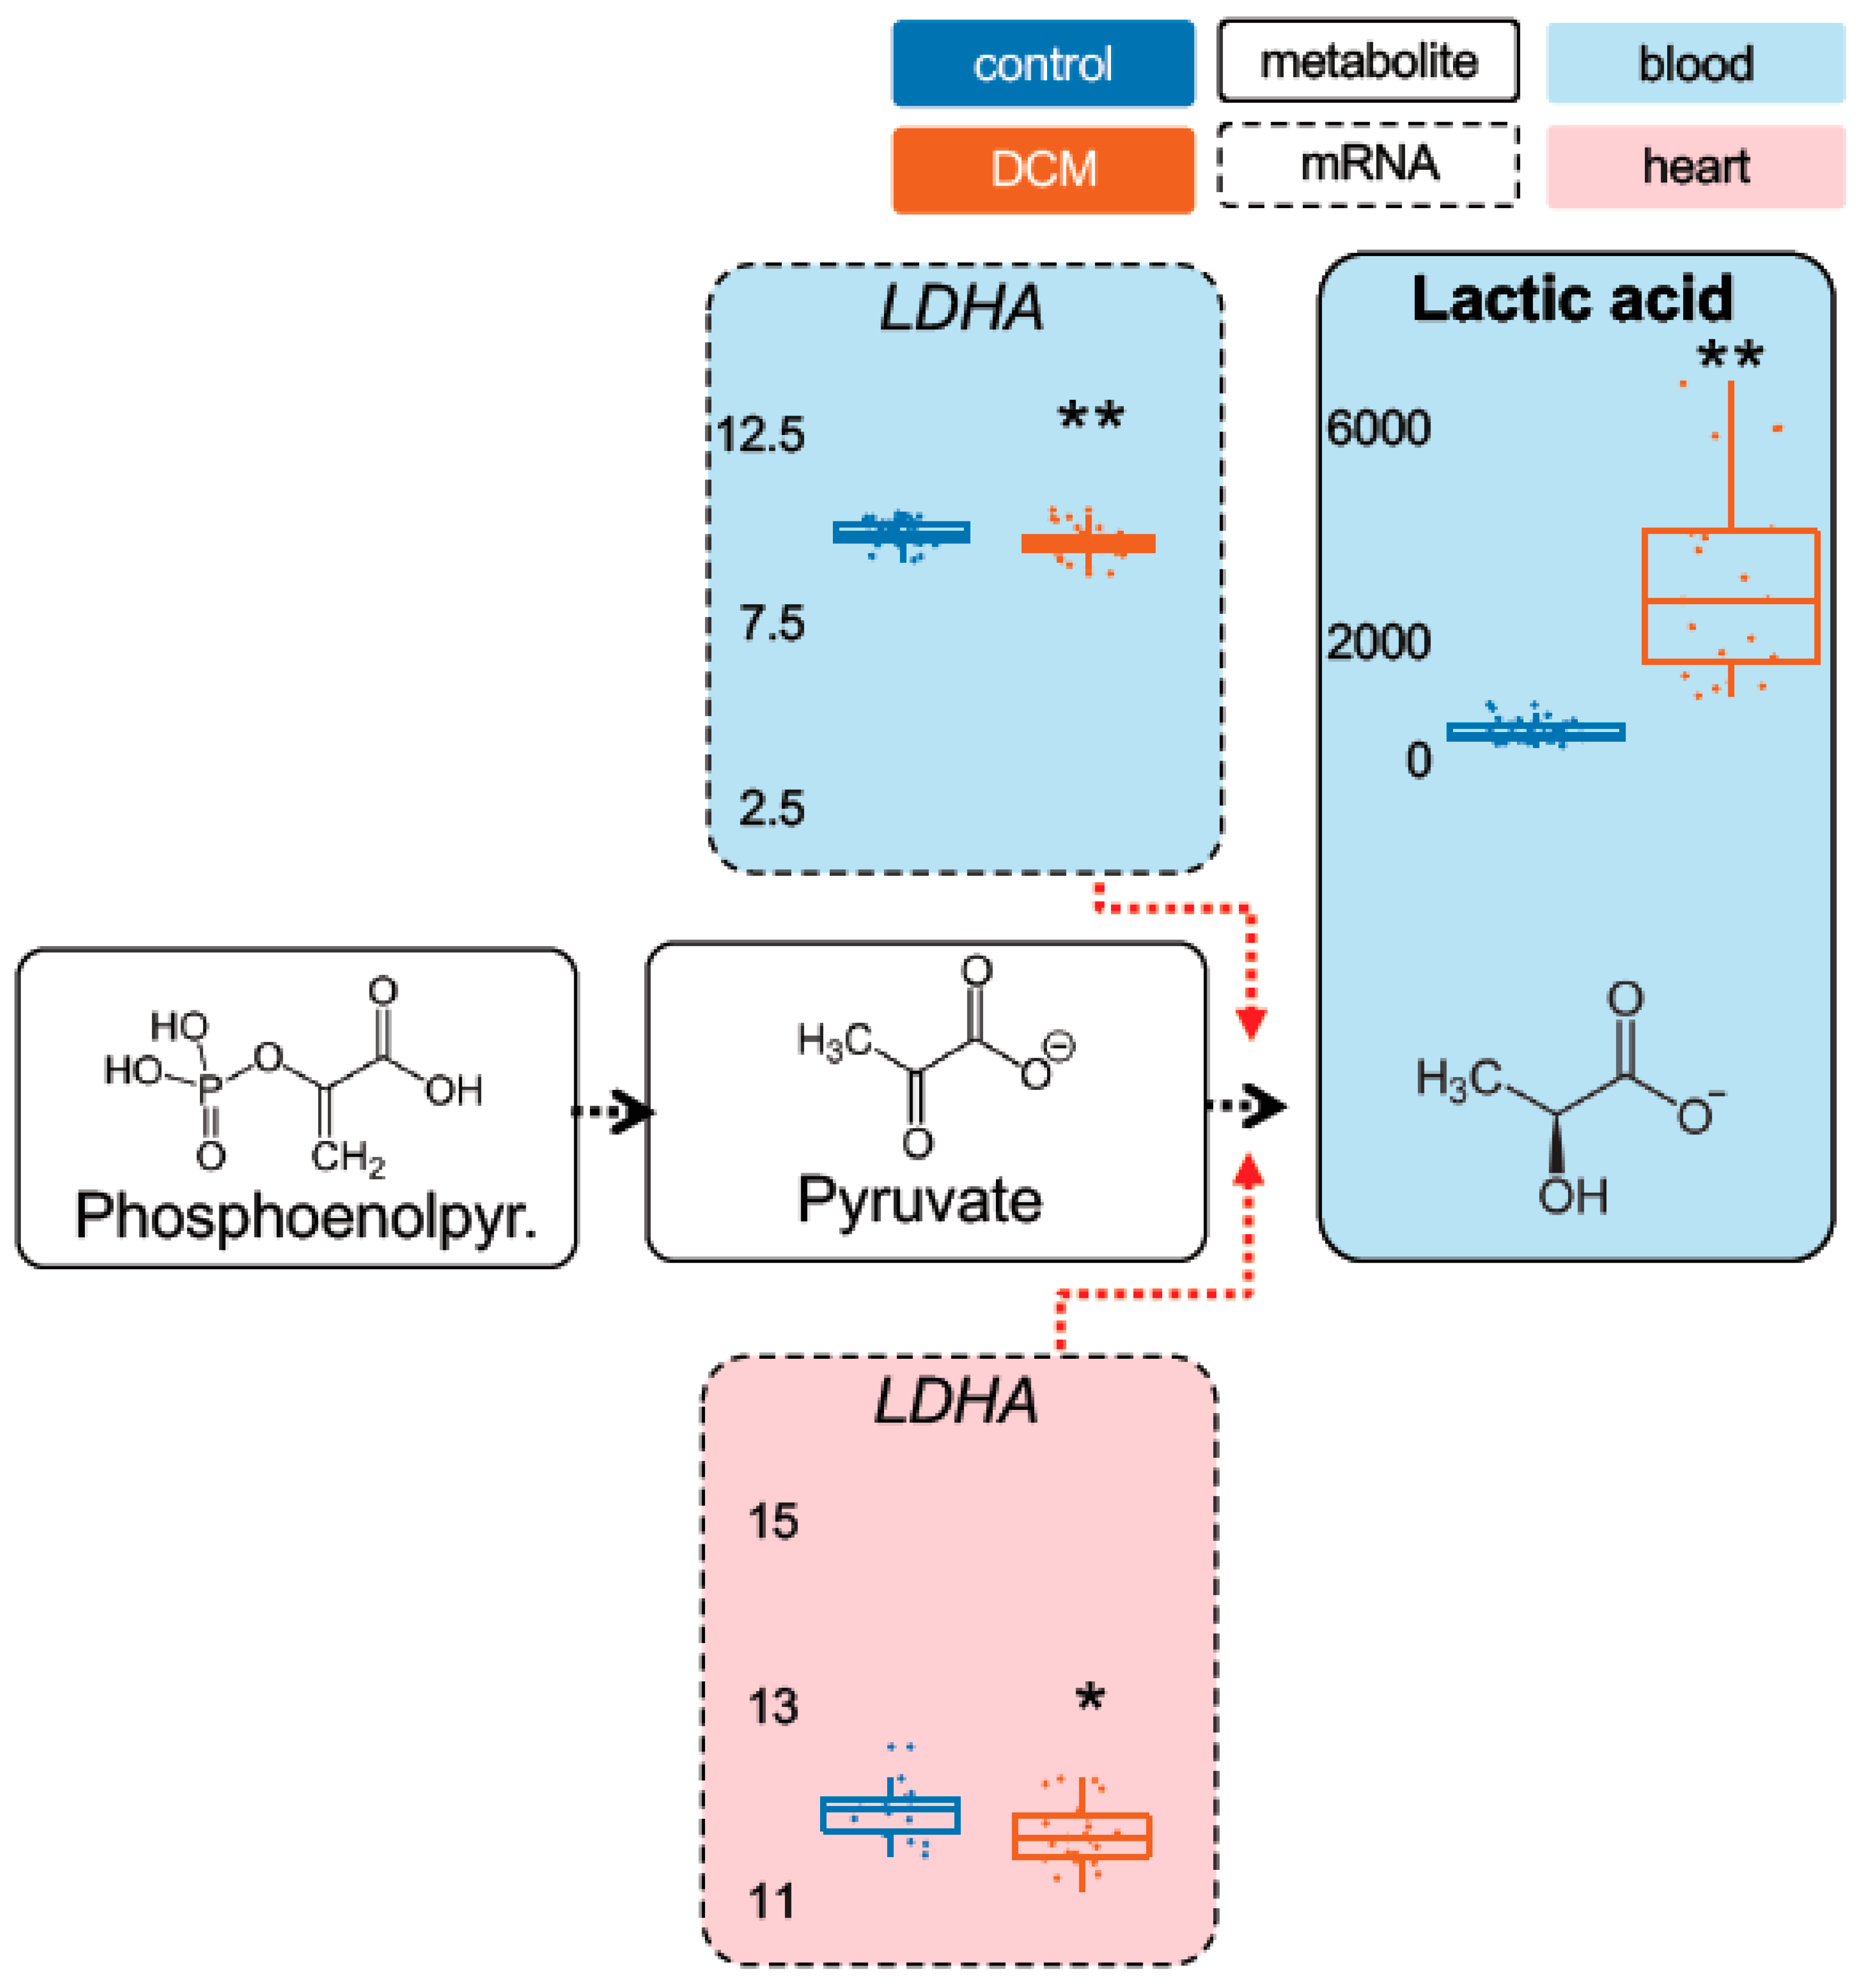
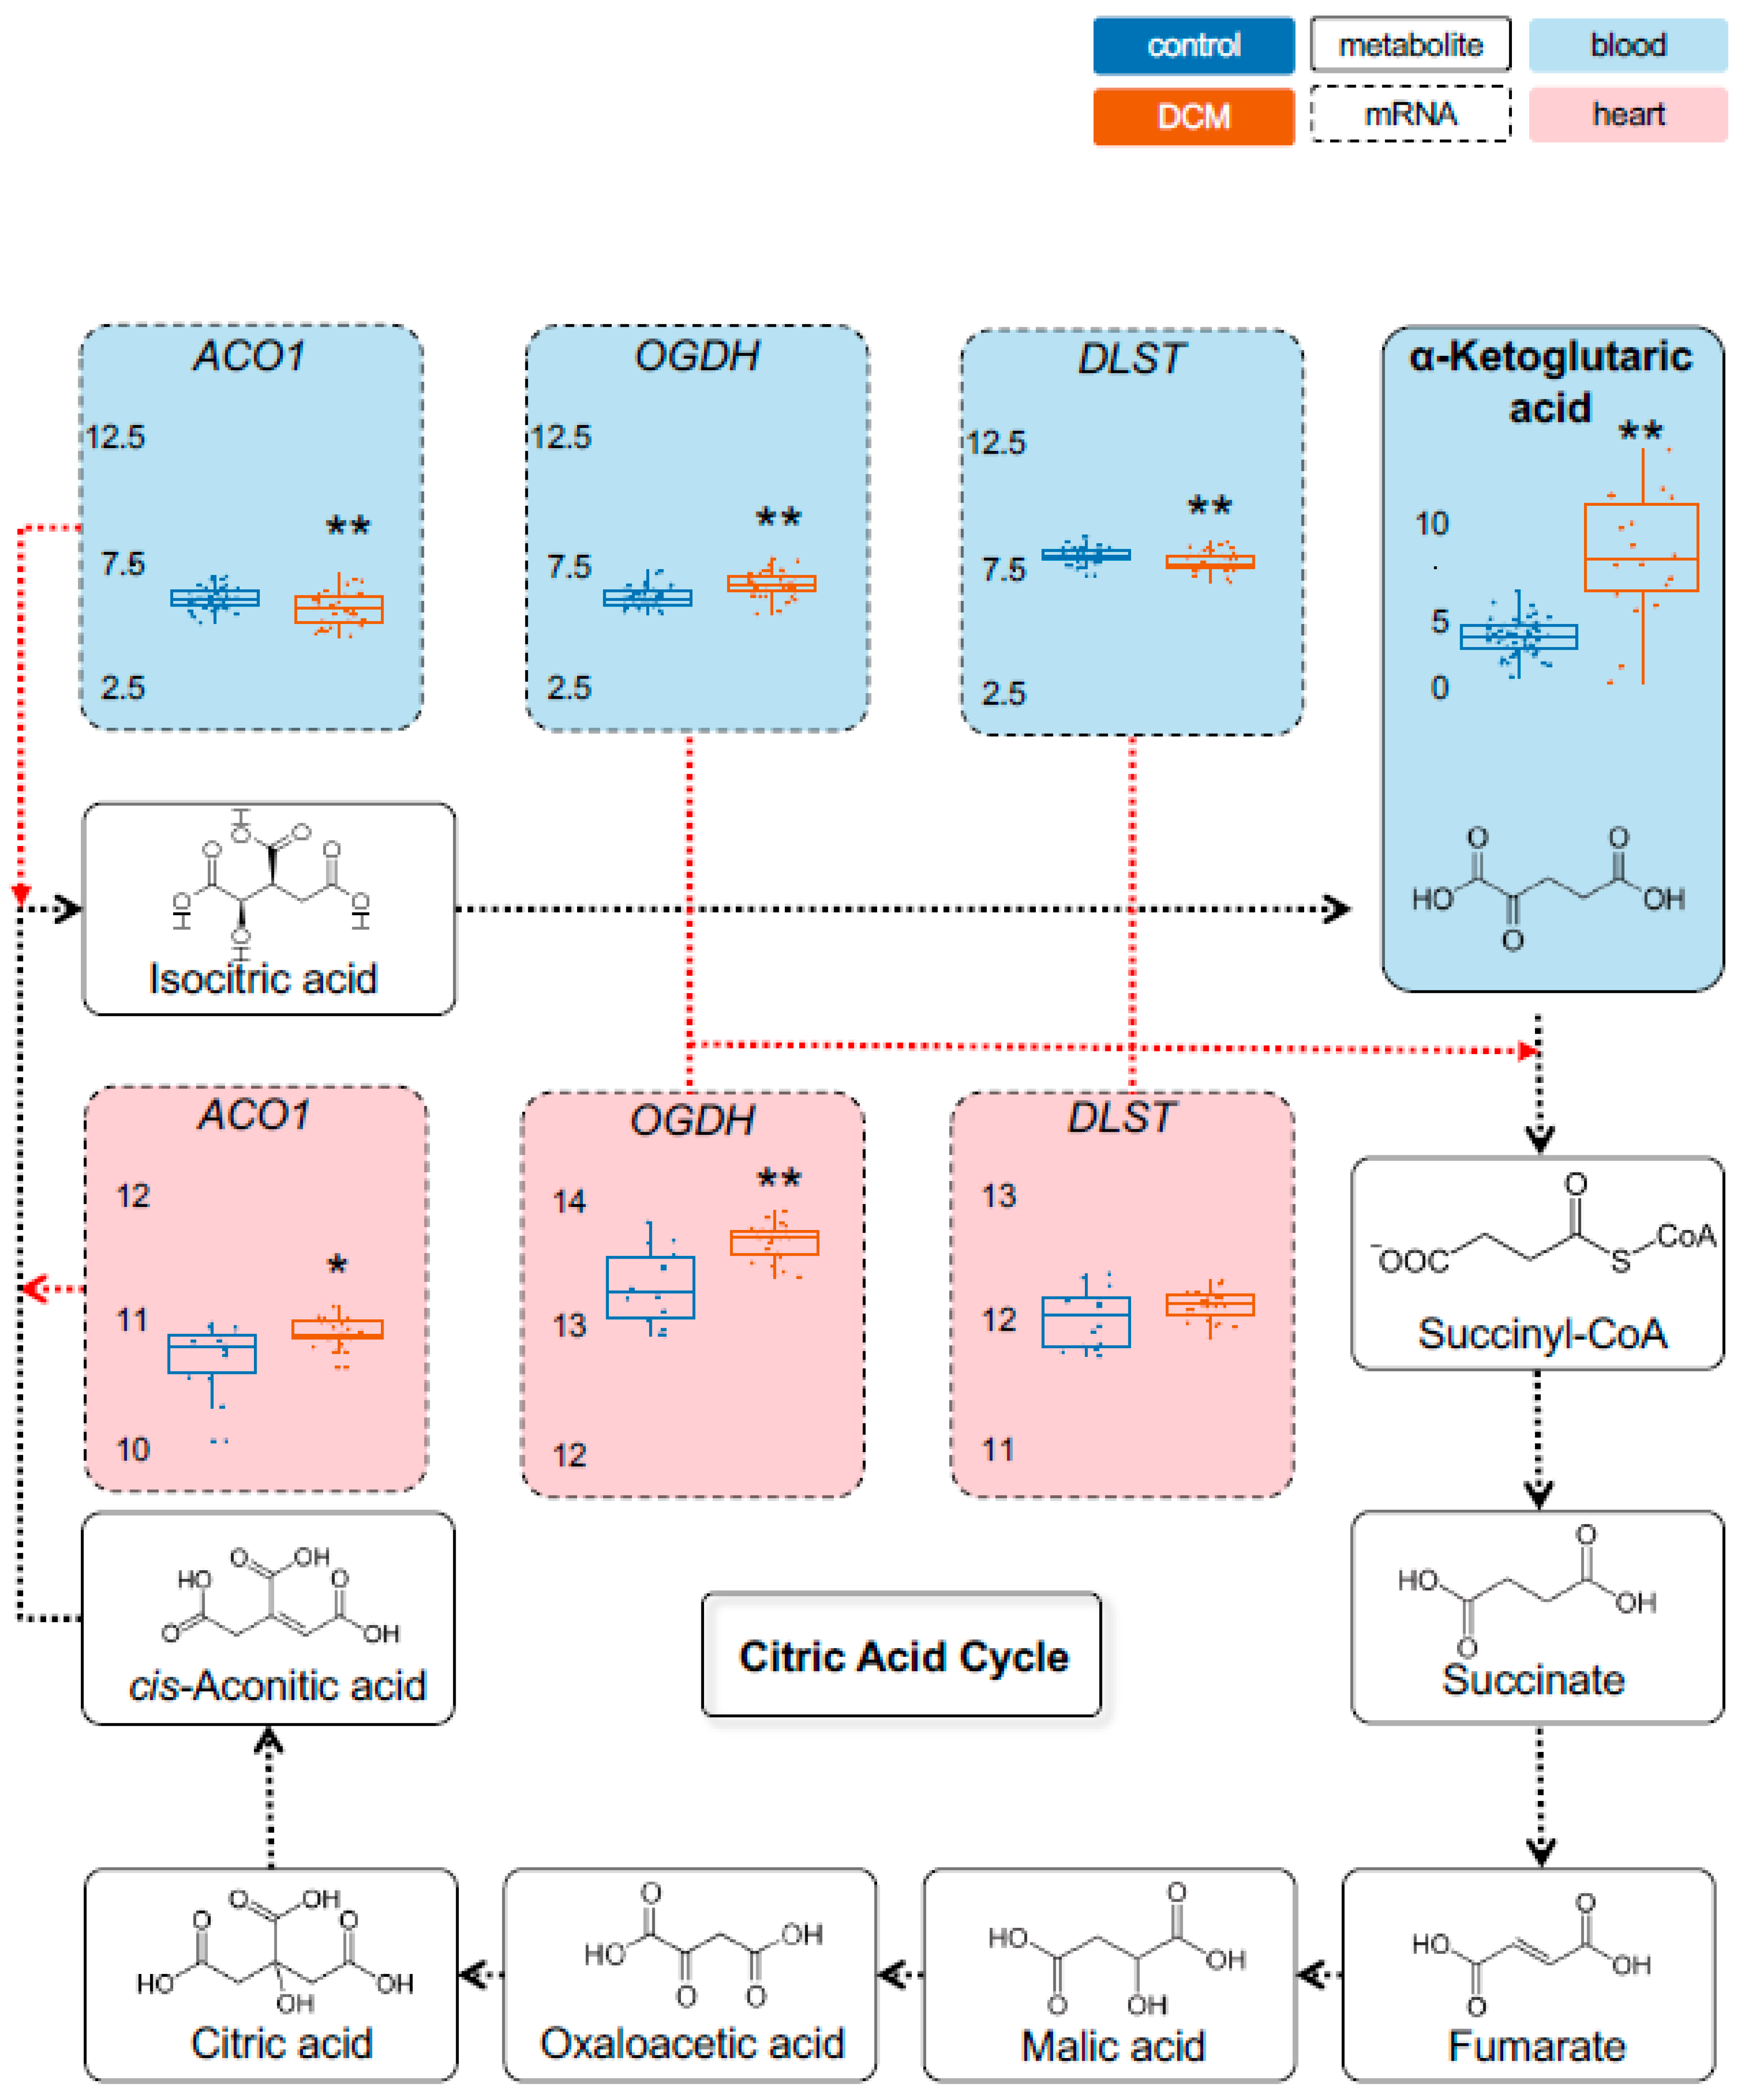
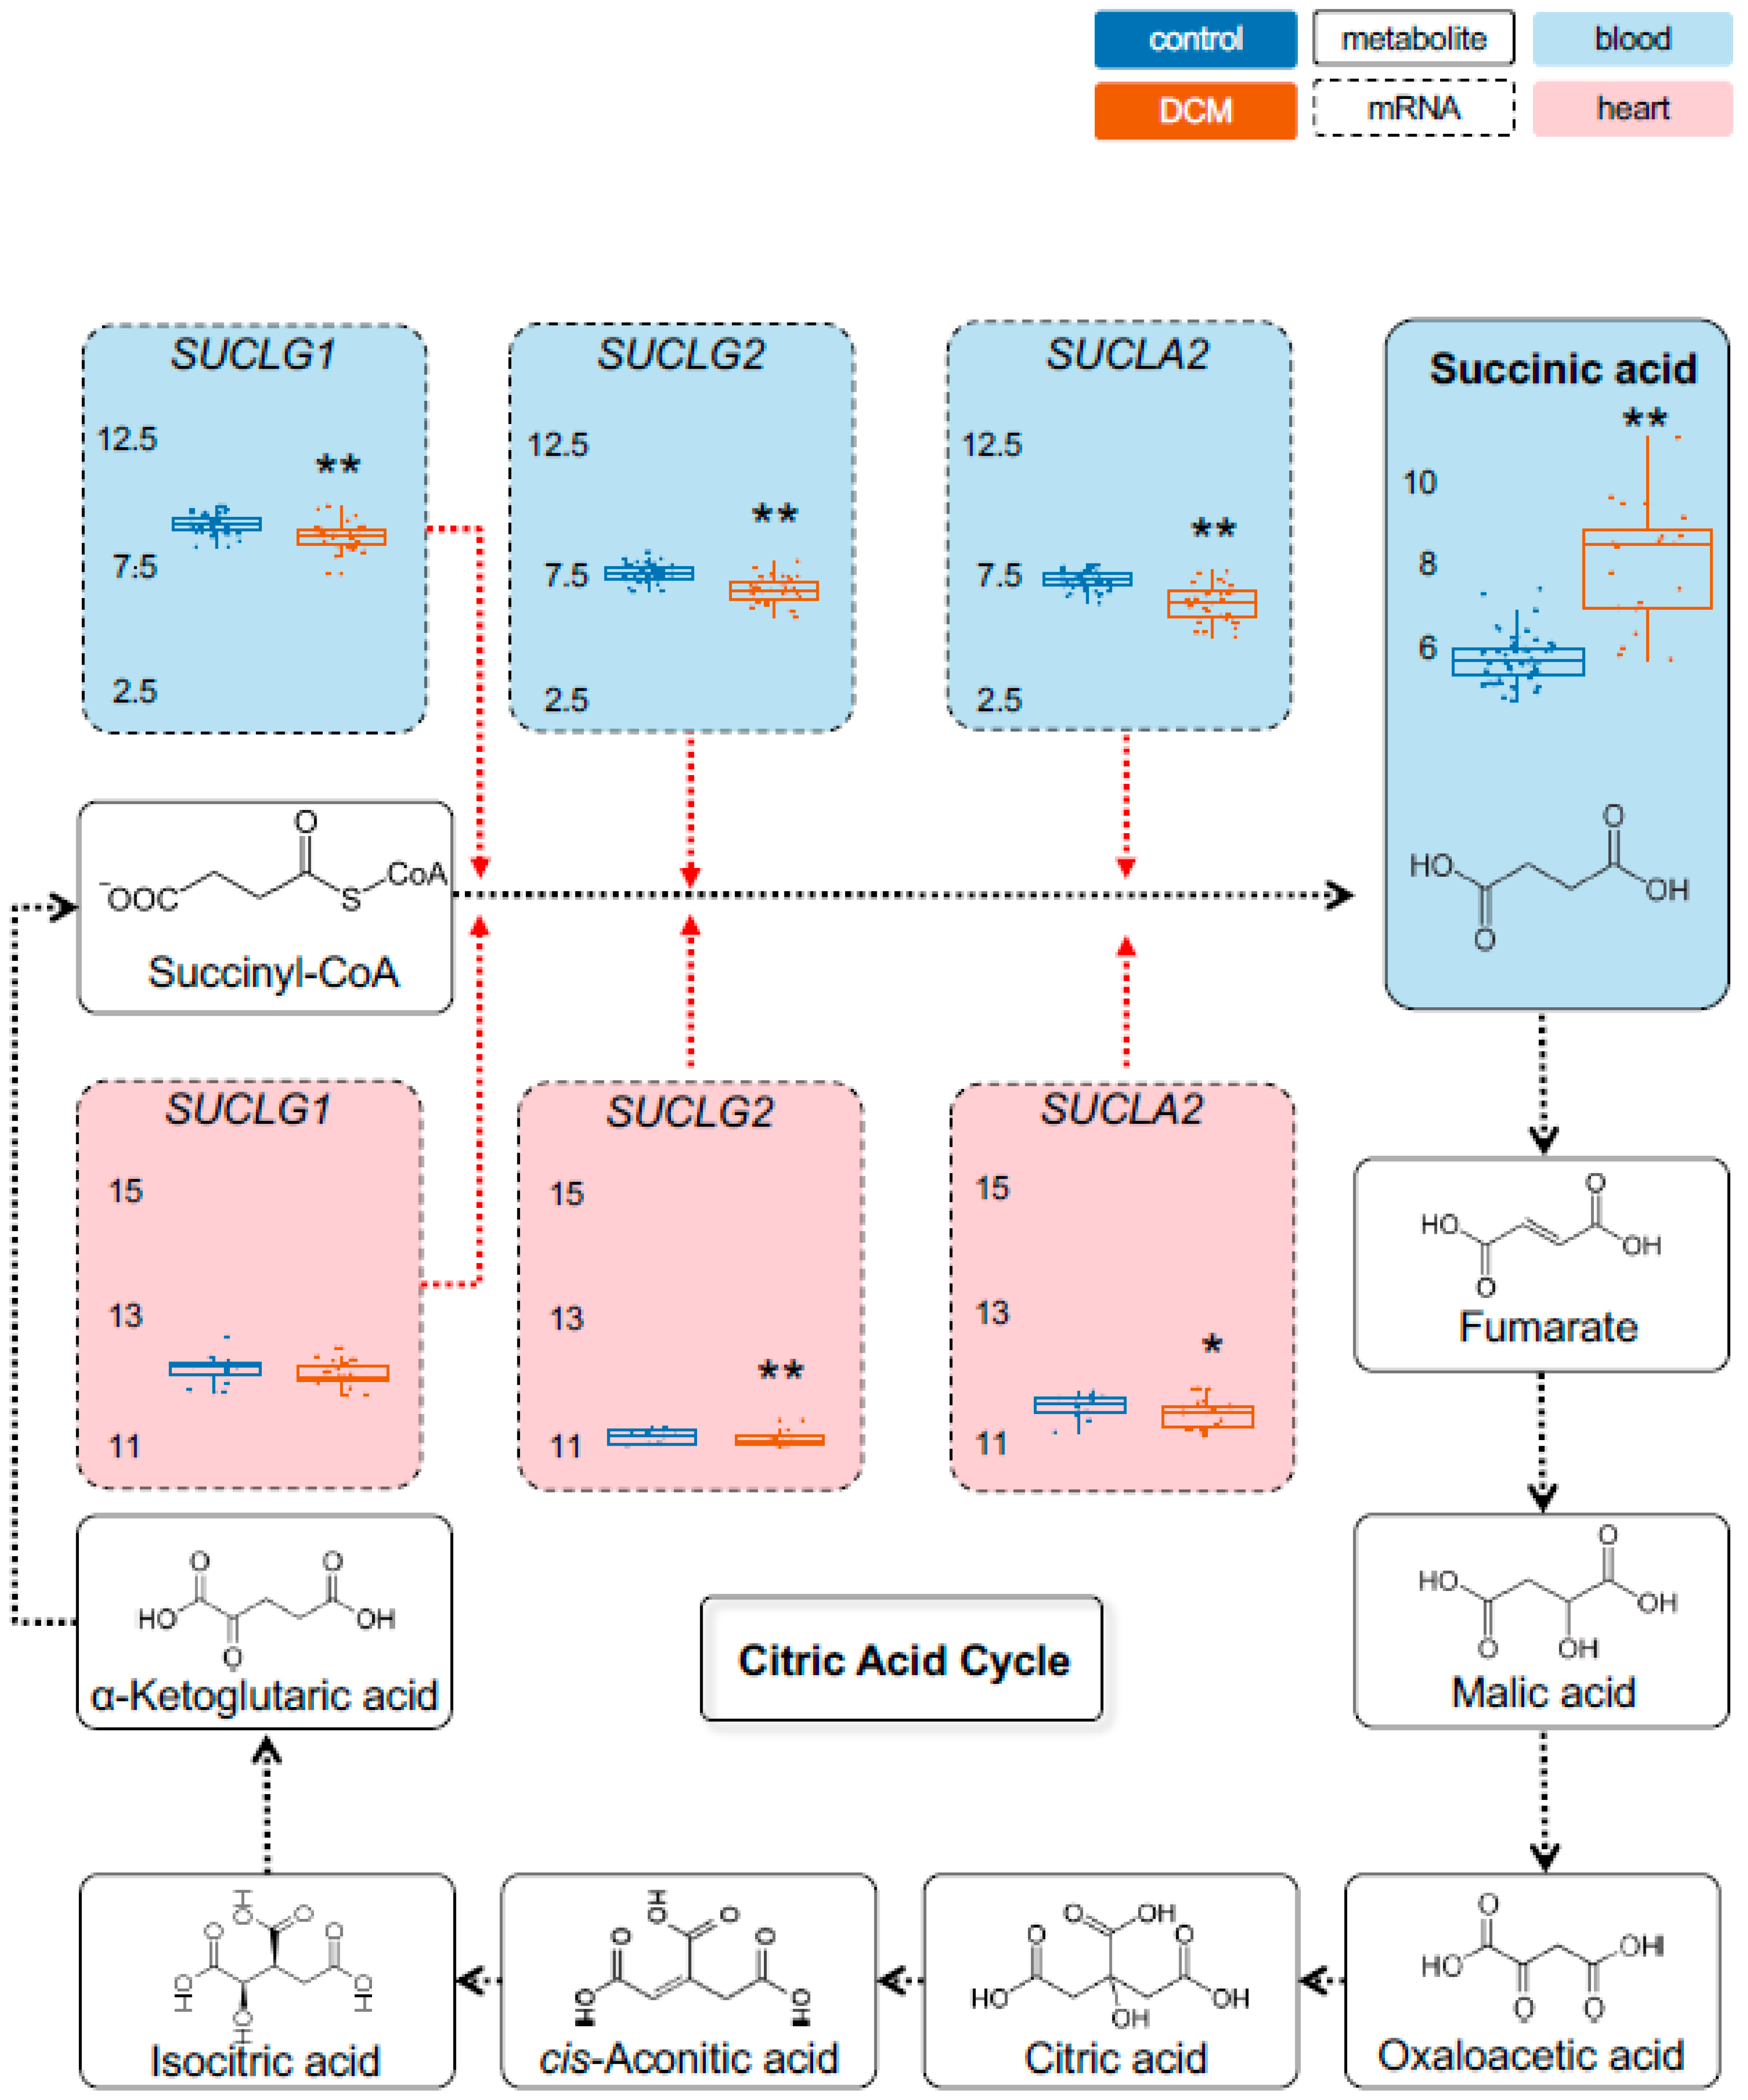
2. Results
2.1. Detection of Dysregulated Energy Metabolites
2.2. Myocardial Epigenetic Programs and mRNA Levels of Rate-Limiting Enzymes Are Associated with HF Metabolites
2.3. Validation of Metabolic Dysregulation for the Development of New Biomarkers
3. Discussion
4. Materials and Methods
4.1. Patient Enrolment and Study Design
4.2. Biomaterial Processing
4.3. Metabolomics Profiling
4.4. Transcriptome and Epigenome Analysis
4.5. Statistical Analysis
Supplementary Materials
Author Contributions
Funding
Institutional Review Board Statement
Informed Consent Statement
Data Availability Statement
Conflicts of Interest
References
- Bertero, E.; Maack, C. Metabolic remodelling in heart failure. Nat. Rev. Cardiol. 2018, 15, 457–470. [Google Scholar] [CrossRef] [PubMed]
- Ritterhoff, J.; Tian, R. Metabolism in cardiomyopathy: Every substrate matters. Cardiovasc. Res. 2017, 113, 411–421. [Google Scholar] [CrossRef] [Green Version]
- Coronel, R.; De Groot, J.R.; Van Lieshout, J.J. Defining heart failure. Cardiovasc. Res. 2001, 50, 419–422. [Google Scholar] [CrossRef] [Green Version]
- Tan, L.-B.; Williams, S.G.; Tan, D.K.H.; Cohen-Solal, A. So many definitions of heart failure: Are they all universally valid? A critical appraisal. Expert Rev. Cardiovasc. Ther. 2010, 8, 217–228. [Google Scholar] [CrossRef]
- Savarese, G.; Lund, L.H. Global Public Health Burden of Heart Failure. Card. Fail. Rev. 2017, 3, 7–11. [Google Scholar] [CrossRef]
- Neubauer, S. The failing heart—An engine out of fuel. N. Engl. J. Med. 2007, 356, 1140–1151. [Google Scholar] [CrossRef] [Green Version]
- Cheng, S.; Shah, S.H.; Corwin, E.J.; Fiehn, O.; Fitzgerald, R.L.; Gerszten, R.E.; Illig, T.; Rhee, E.P.; Srinivas, P.R.; Wang, T.J.; et al. Potential Impact and Study Considerations of Metabolomics in Cardiovascular Health and Disease: A Scientific Statement from the American Heart Association. Circ. Cardiovasc. Genet. 2017, 10, e000032. [Google Scholar] [CrossRef] [Green Version]
- Sansbury, B.E.; De Martino, A.M.; Xie, Z.; Brooks, A.C.; Brainard, R.E.; Watson, L.J.; DeFilippis, A.P.; Cummins, T.D.; Harbeson, M.A.; Brittian, K.R.; et al. Metabolomic analysis of pressure-overloaded and infarcted mouse hearts. Circ. Heart Fail. 2014, 7, 634–642. [Google Scholar] [CrossRef] [Green Version]
- Aubert, G.; Martin, O.J.; Horton, J.L.; Lai, L.; Vega, R.B.; Leone, T.C.; Koves, T.; Gardell, S.J.; Krüger, M.; Hoppel, C.L.; et al. The Failing Heart Relies on Ketone Bodies as a Fuel. Circulation 2016, 133, 698–705. [Google Scholar] [CrossRef]
- McGarrah, R.W.; Crown, S.B.; Zhang, G.-F.; Shah, S.H.; Newgard, C.B. Cardiovascular Metabolomics. Circ. Res. 2018, 122, 1238–1258. [Google Scholar] [CrossRef]
- Torella, D.; Ellison, G.M.; Torella, M.; Vicinanza, C.; Aquila, I.; Iaconetti, C.; Scalise, M.; Marino, F.; Henning, B.J.; Lewis, F.C.; et al. Carbonic Anhydrase Activation Is Associated with Worsened Pathological Remodeling in Human Ischemic Diabetic Cardiomyopathy. J. Am. Heart Assoc. 2014, 3, e000434. [Google Scholar] [CrossRef] [PubMed] [Green Version]
- Johnson, C.H.; Ivanisevic, J.; Siuzdak, G. Metabolomics: Beyond biomarkers and towards mechanisms. Nat. Rev. Mol. Cell Biol. 2016, 17, 451–459. [Google Scholar] [CrossRef] [PubMed] [Green Version]
- Azevedo, P.S.; Minicucci, M.F.; Santos, P.P.; Paiva, S.A.R.; Zornoff, L.A.M. Energy Metabolism in Cardiac Remodeling and Heart Failure. Cardiol. Rev. 2013, 21, 135–140. [Google Scholar] [CrossRef]
- Ingwall, J.S. Energy metabolism in heart failure and remodelling. Cardiovasc. Res. 2009, 81, 412–419. [Google Scholar] [CrossRef] [Green Version]
- Chouchani, E.T.; Pell, V.R.; Gaude, E.; Aksentijević, D.; Sundier, S.Y.; Robb, E.L.; Logan, A.; Nadtochiy, S.M.; Ord, E.N.; Smith, A.C.; et al. Ischaemic accumulation of succinate controls reperfusion injury through mitochondrial ROS. Nature 2014, 515, 431–435. [Google Scholar] [CrossRef] [Green Version]
- Zhang, J.; Wang, Y.T.; Miller, J.H.; Day, M.M.; Munger, J.C.; Brookes, P.S. Accumulation of Succinate in Cardiac Ischemia Primarily Occurs via Canonical Krebs Cycle Activity. Cell Rep. 2018, 23, 2617–2628. [Google Scholar] [CrossRef] [Green Version]
- Muller, O.J.; Heckmann, M.B.; Ding, L.; Rapti, K.; Rangrez, A.Y.; Gerken, T.; Christiansen, N.; Rennefahrt, U.E.E.; Witt, H.; Maldonado, S.G.; et al. Comprehensive plasma and tissue profiling reveals systemic metabolic alterations in cardiac hypertrophy and failure. Cardiovasc. Res. 2019, 115, 1296–1305. [Google Scholar] [CrossRef]
- Abel, E.D.; O’Shea, K.M.; Ramasamy, R. Insulin resistance: Metabolic mechanisms and consequences in the heart. Arterioscler. Thromb. Vasc. Biol. 2012, 32, 2068–2076. [Google Scholar] [CrossRef] [PubMed] [Green Version]
- Sasso, F.C.; Carbonara, O.; Nasti, R.; Marfella, R.; Esposito, K.; Rambaldi, P.; Mansi, L.; Salvatore, T.; Torella, R.; Cozzolino, D. Effects of insulin on left ventricular function during dynamic exercise in overweight and obese subjects. Eur. Heart J. 2005, 26, 1205–1212. [Google Scholar] [CrossRef]
- Knebel, B.; Strassburger, K.; Szendroedi, J.; Kotzka, J.; Scheer, M.; Nowotny, B.; Mussig, K.; Lehr, S.; Pacini, G.; Finner, H.; et al. Specific Metabolic Profiles and Their Relationship to Insulin Resistance in Recent-Onset Type 1 and Type 2 Diabetes. J. Clin. Endocrinol. Metab. 2016, 101, 2130–2140. [Google Scholar] [CrossRef] [PubMed]
- Richardson, P.; McKenna, W.; Bristow, M.; Maisch, B.; Mautner, B.; O’Connell, J.; Olsen, E.; Thiene, G.; Goodwin, J.; Gyarfas, I.; et al. Report of the 1995 World Health Organization/International Society and Federation of Cardiology Task Force on the Definition and Classification of cardiomyopathies. Circulation 1996, 93, 841–842. [Google Scholar] [PubMed]
- Meder, B.; Haas, J.; Sedaghat-Hamedani, F.; Kayvanpour, E.; Frese, K.; Lai, A.; Nietsch, R.; Scheiner, C.; Mester, S.; Bordalo, D.M.; et al. Epigenome-Wide Association Study Identifies Cardiac Gene Patterning and a Novel Class of Biomarkers for Heart Failure. Circulation 2017, 136, 1528–1544. [Google Scholar] [CrossRef]
- Astles, R.; Williams, C.P.; Sedor, F. Stability of plasma lactate in vitro in the presence of antiglycolytic agents. Clin. Chem. 1994, 40 Pt 1, 1327–1330. [Google Scholar] [CrossRef]
- Oddoze, C.; Lombard, E.; Portugal, H. Stability study of 81 analytes in human whole blood, in serum and in plasma. Clin. Biochem. 2012, 45, 464–469. [Google Scholar] [CrossRef]
- Dobin, A.; Davis, C.A.; Schlesinger, F.; Drenkow, J.; Zaleski, C.; Jha, S.; Batut, P.; Chaisson, M.; Gingeras, T.R. STAR: Ultrafast universal RNA-seq aligner. Bioinformatics 2013, 29, 15–21. [Google Scholar] [CrossRef] [PubMed]
- Liao, Y.; Smyth, G.K.; Shi, W. featureCounts: An efficient general purpose program for assigning sequence reads to genomic features. Bioinformatics 2014, 30, 923–930. [Google Scholar] [CrossRef] [Green Version]
- Love, M.I.; Huber, W.; Anders, S. Moderated estimation of fold change and dispersion for RNA-seq data with DESeq2. Genome Biol. 2014, 15, 550. [Google Scholar] [CrossRef] [Green Version]
- Simes, R.J. An improved Bonferroni procedure for multiple tests of significance. Biometrika 1986, 73, 751–754. [Google Scholar] [CrossRef]


| Characteristics | DCM (n = 82) | Control (n = 51) |
|---|---|---|
| Male gender, n (%) | 67 (82) | 40 (78) |
| Age at visit [years] (±SD) | 53.52 (±13.53) | 56.22 (±8.75) |
| BMI [kg/m2] (±SD) | 28.34 (±6.14) | 25.64 (±2.89) |
| NYHA [I–IV] (±SD) | 2.15 (±0.78) | 0 |
| LVEF (echo) [%](±SD) | 31.05 (±13.60) | 61.67 (±3.61) |
| eGFR [mL/min/1.73qm BSA] (±SD) | 87.48 (±21.62) | 90.54 (±11.08) |
| Smoking | ||
| yes n (%) | 18 (22) | 1 (2) |
| no n (%) | 41(20) | 46(90) |
| ex n (%) | 22 (27) | 4 (8) |
| Diabetes | 12 (15) | 0 (0) |
| Characteristics | DCM (n = 52) | ICM (n = 39) | Control (n = 57) |
|---|---|---|---|
| Male gender, n (%) | 34 (67) | 32 (82) | 33 (58) |
| Age at visit [years] (±SD) | 62.12 (±12.94) | 68.08 (±11.90) | 62.37 (11.47) |
| LVEF (echo) [%](±SD) | 28.03 (±11.91) | 37.70 (±21.06) | 58.25 (24.27) |
| Smoking | |||
| yes n (%) | 5 (11) | 8 (21) | 19 (11) |
| no n (%) | 31 (66) | 17(44) | 13 (23) |
| ex n (%) | 11 (23) | 14(36) | 33 (58) |
| Diabetes | 11 (23) | 13 (33) | 3 (5) |
Publisher’s Note: MDPI stays neutral with regard to jurisdictional claims in published maps and institutional affiliations. |
© 2021 by the authors. Licensee MDPI, Basel, Switzerland. This article is an open access article distributed under the terms and conditions of the Creative Commons Attribution (CC BY) license (http://creativecommons.org/licenses/by/4.0/).
Share and Cite
Haas, J.; Frese, K.S.; Sedaghat-Hamedani, F.; Kayvanpour, E.; Tappu, R.; Nietsch, R.; Tugrul, O.F.; Wisdom, M.; Dietrich, C.; Amr, A.; et al. Energy Metabolites as Biomarkers in Ischemic and Dilated Cardiomyopathy. Int. J. Mol. Sci. 2021, 22, 1999. https://0-doi-org.brum.beds.ac.uk/10.3390/ijms22041999
Haas J, Frese KS, Sedaghat-Hamedani F, Kayvanpour E, Tappu R, Nietsch R, Tugrul OF, Wisdom M, Dietrich C, Amr A, et al. Energy Metabolites as Biomarkers in Ischemic and Dilated Cardiomyopathy. International Journal of Molecular Sciences. 2021; 22(4):1999. https://0-doi-org.brum.beds.ac.uk/10.3390/ijms22041999
Chicago/Turabian StyleHaas, Jan, Karen S. Frese, Farbod Sedaghat-Hamedani, Elham Kayvanpour, Rewati Tappu, Rouven Nietsch, Oguz Firat Tugrul, Michael Wisdom, Carsten Dietrich, Ali Amr, and et al. 2021. "Energy Metabolites as Biomarkers in Ischemic and Dilated Cardiomyopathy" International Journal of Molecular Sciences 22, no. 4: 1999. https://0-doi-org.brum.beds.ac.uk/10.3390/ijms22041999