
Leber Congenital Amaurosis Due to GUCY2D Mutations: Longitudinal Analysis of Retinal Structure and Visual Function


 , , and
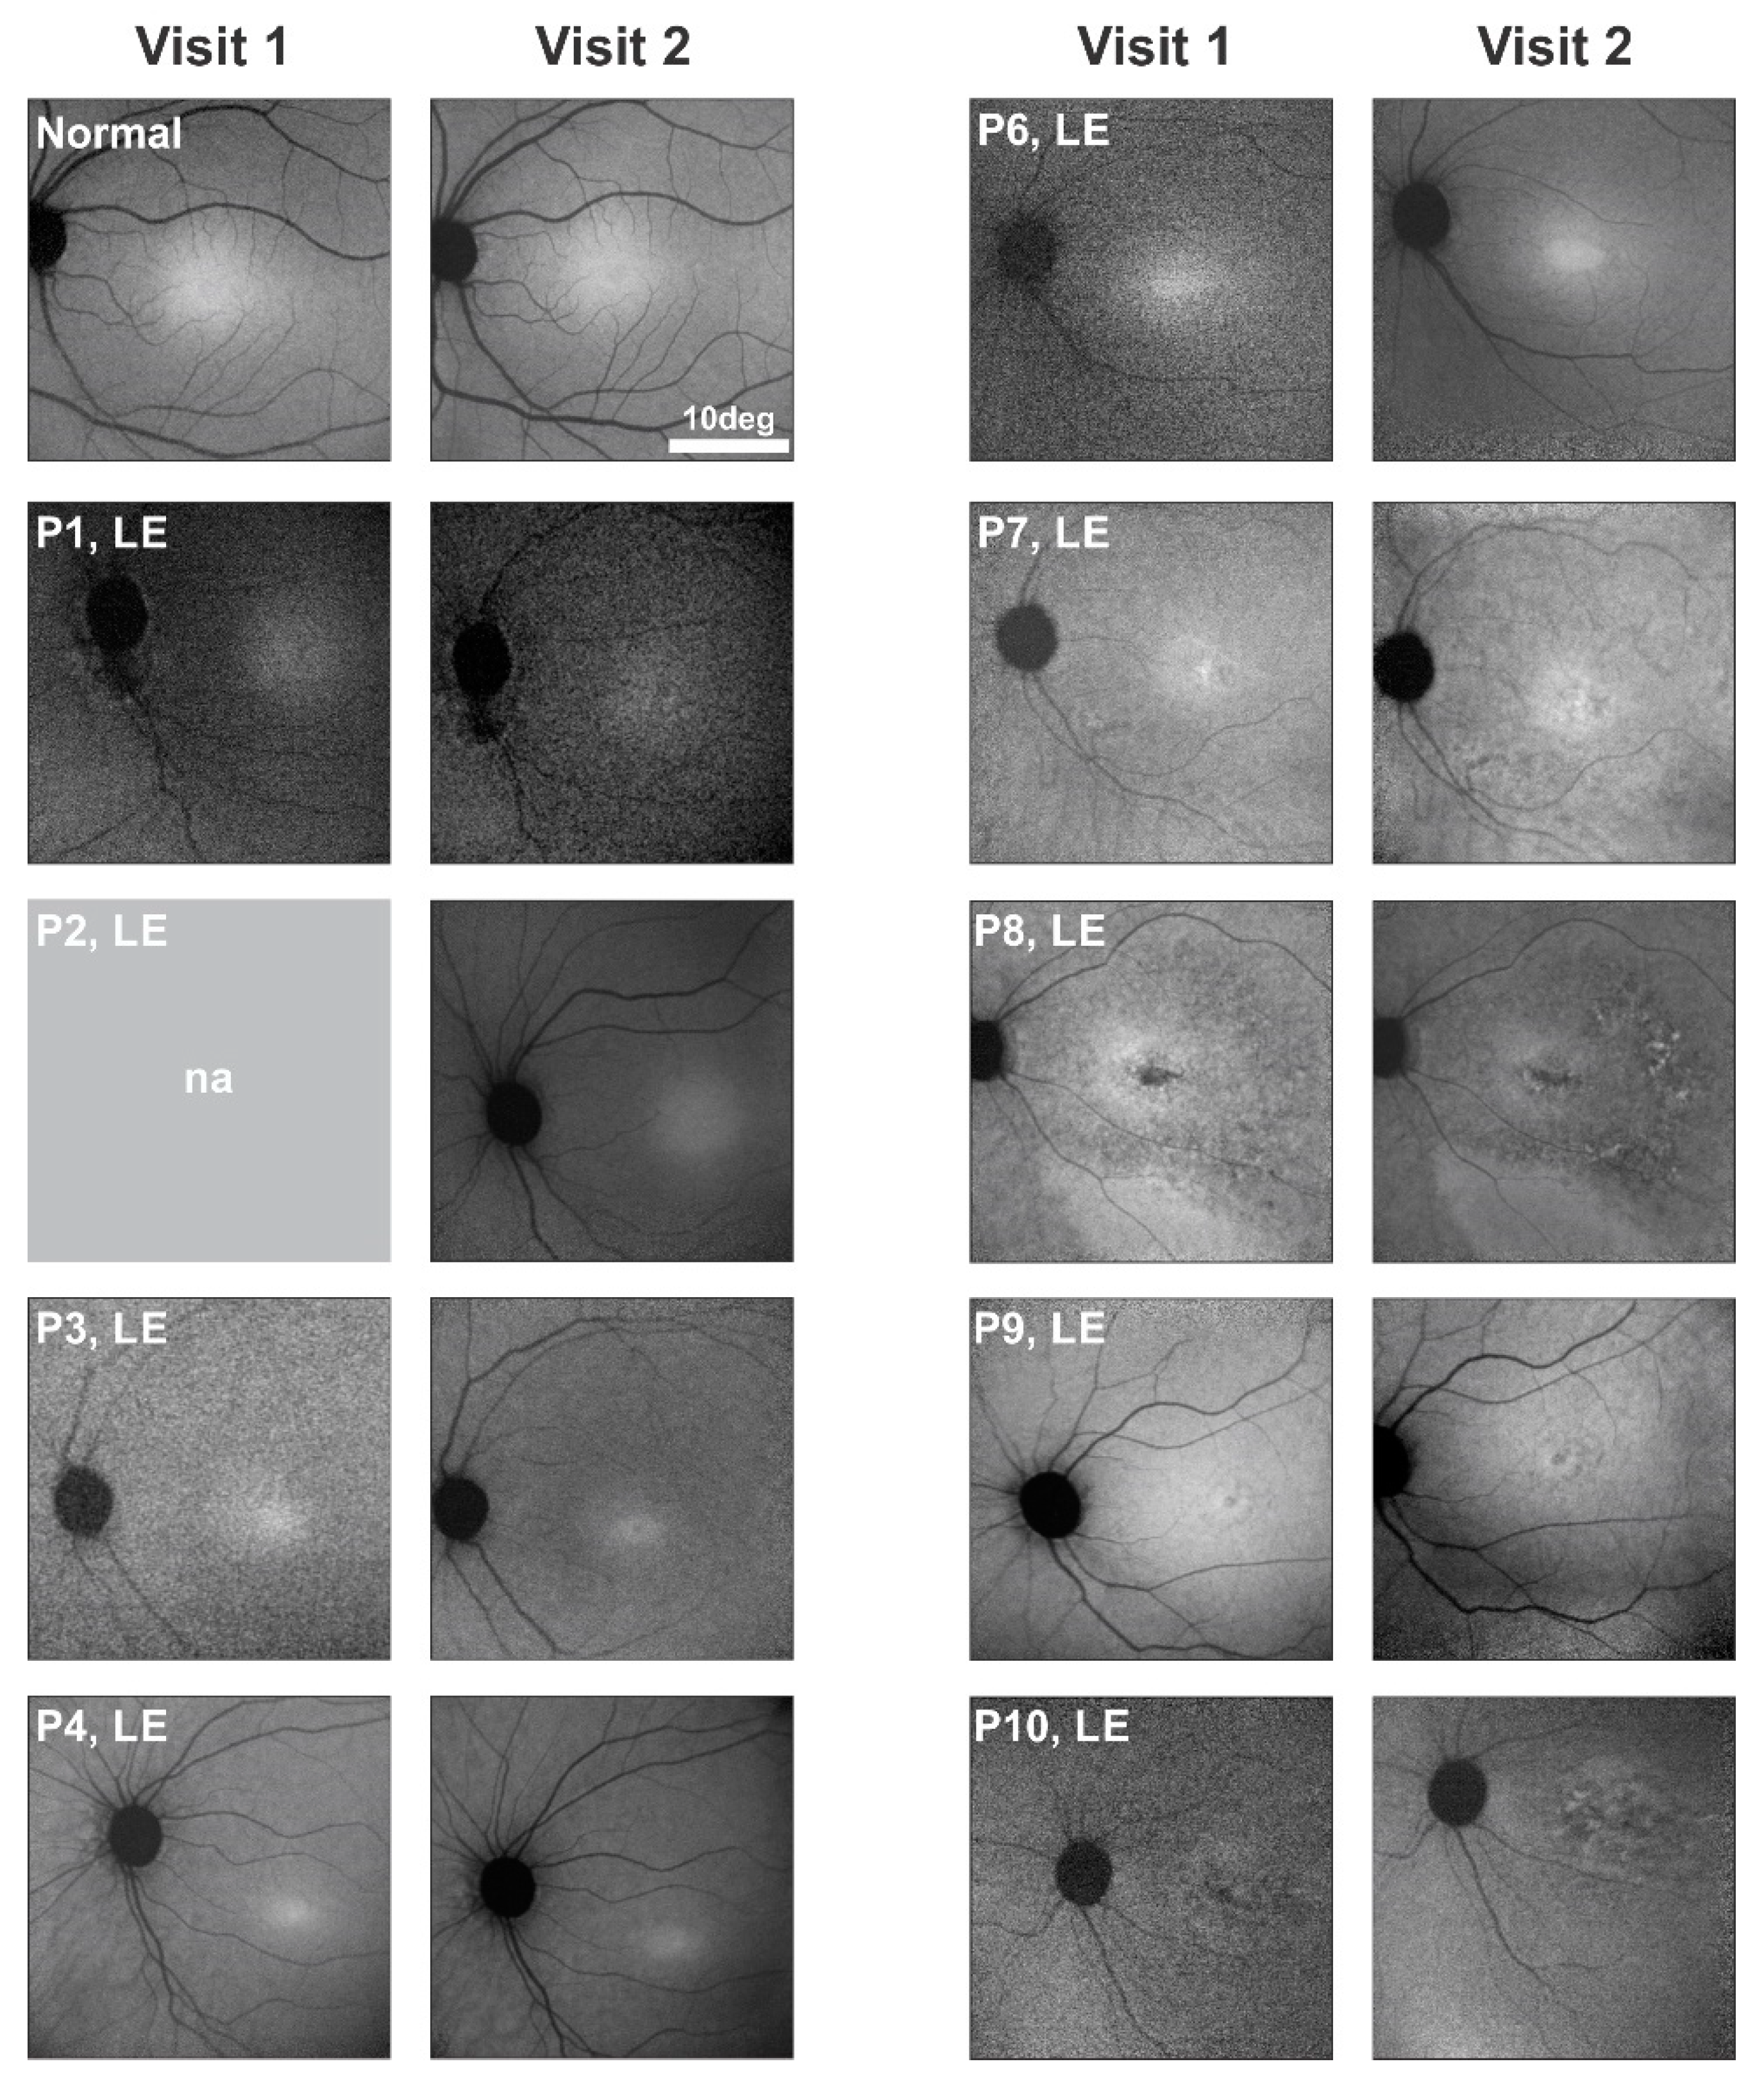
Abstract
:1. Introduction
2. Results and Discussion
2.1. Study Population with GUCY2D-LCA
2.2. Serial En Face Near-Infrared Autofluorescence Imaging in GUCY2D-LCA
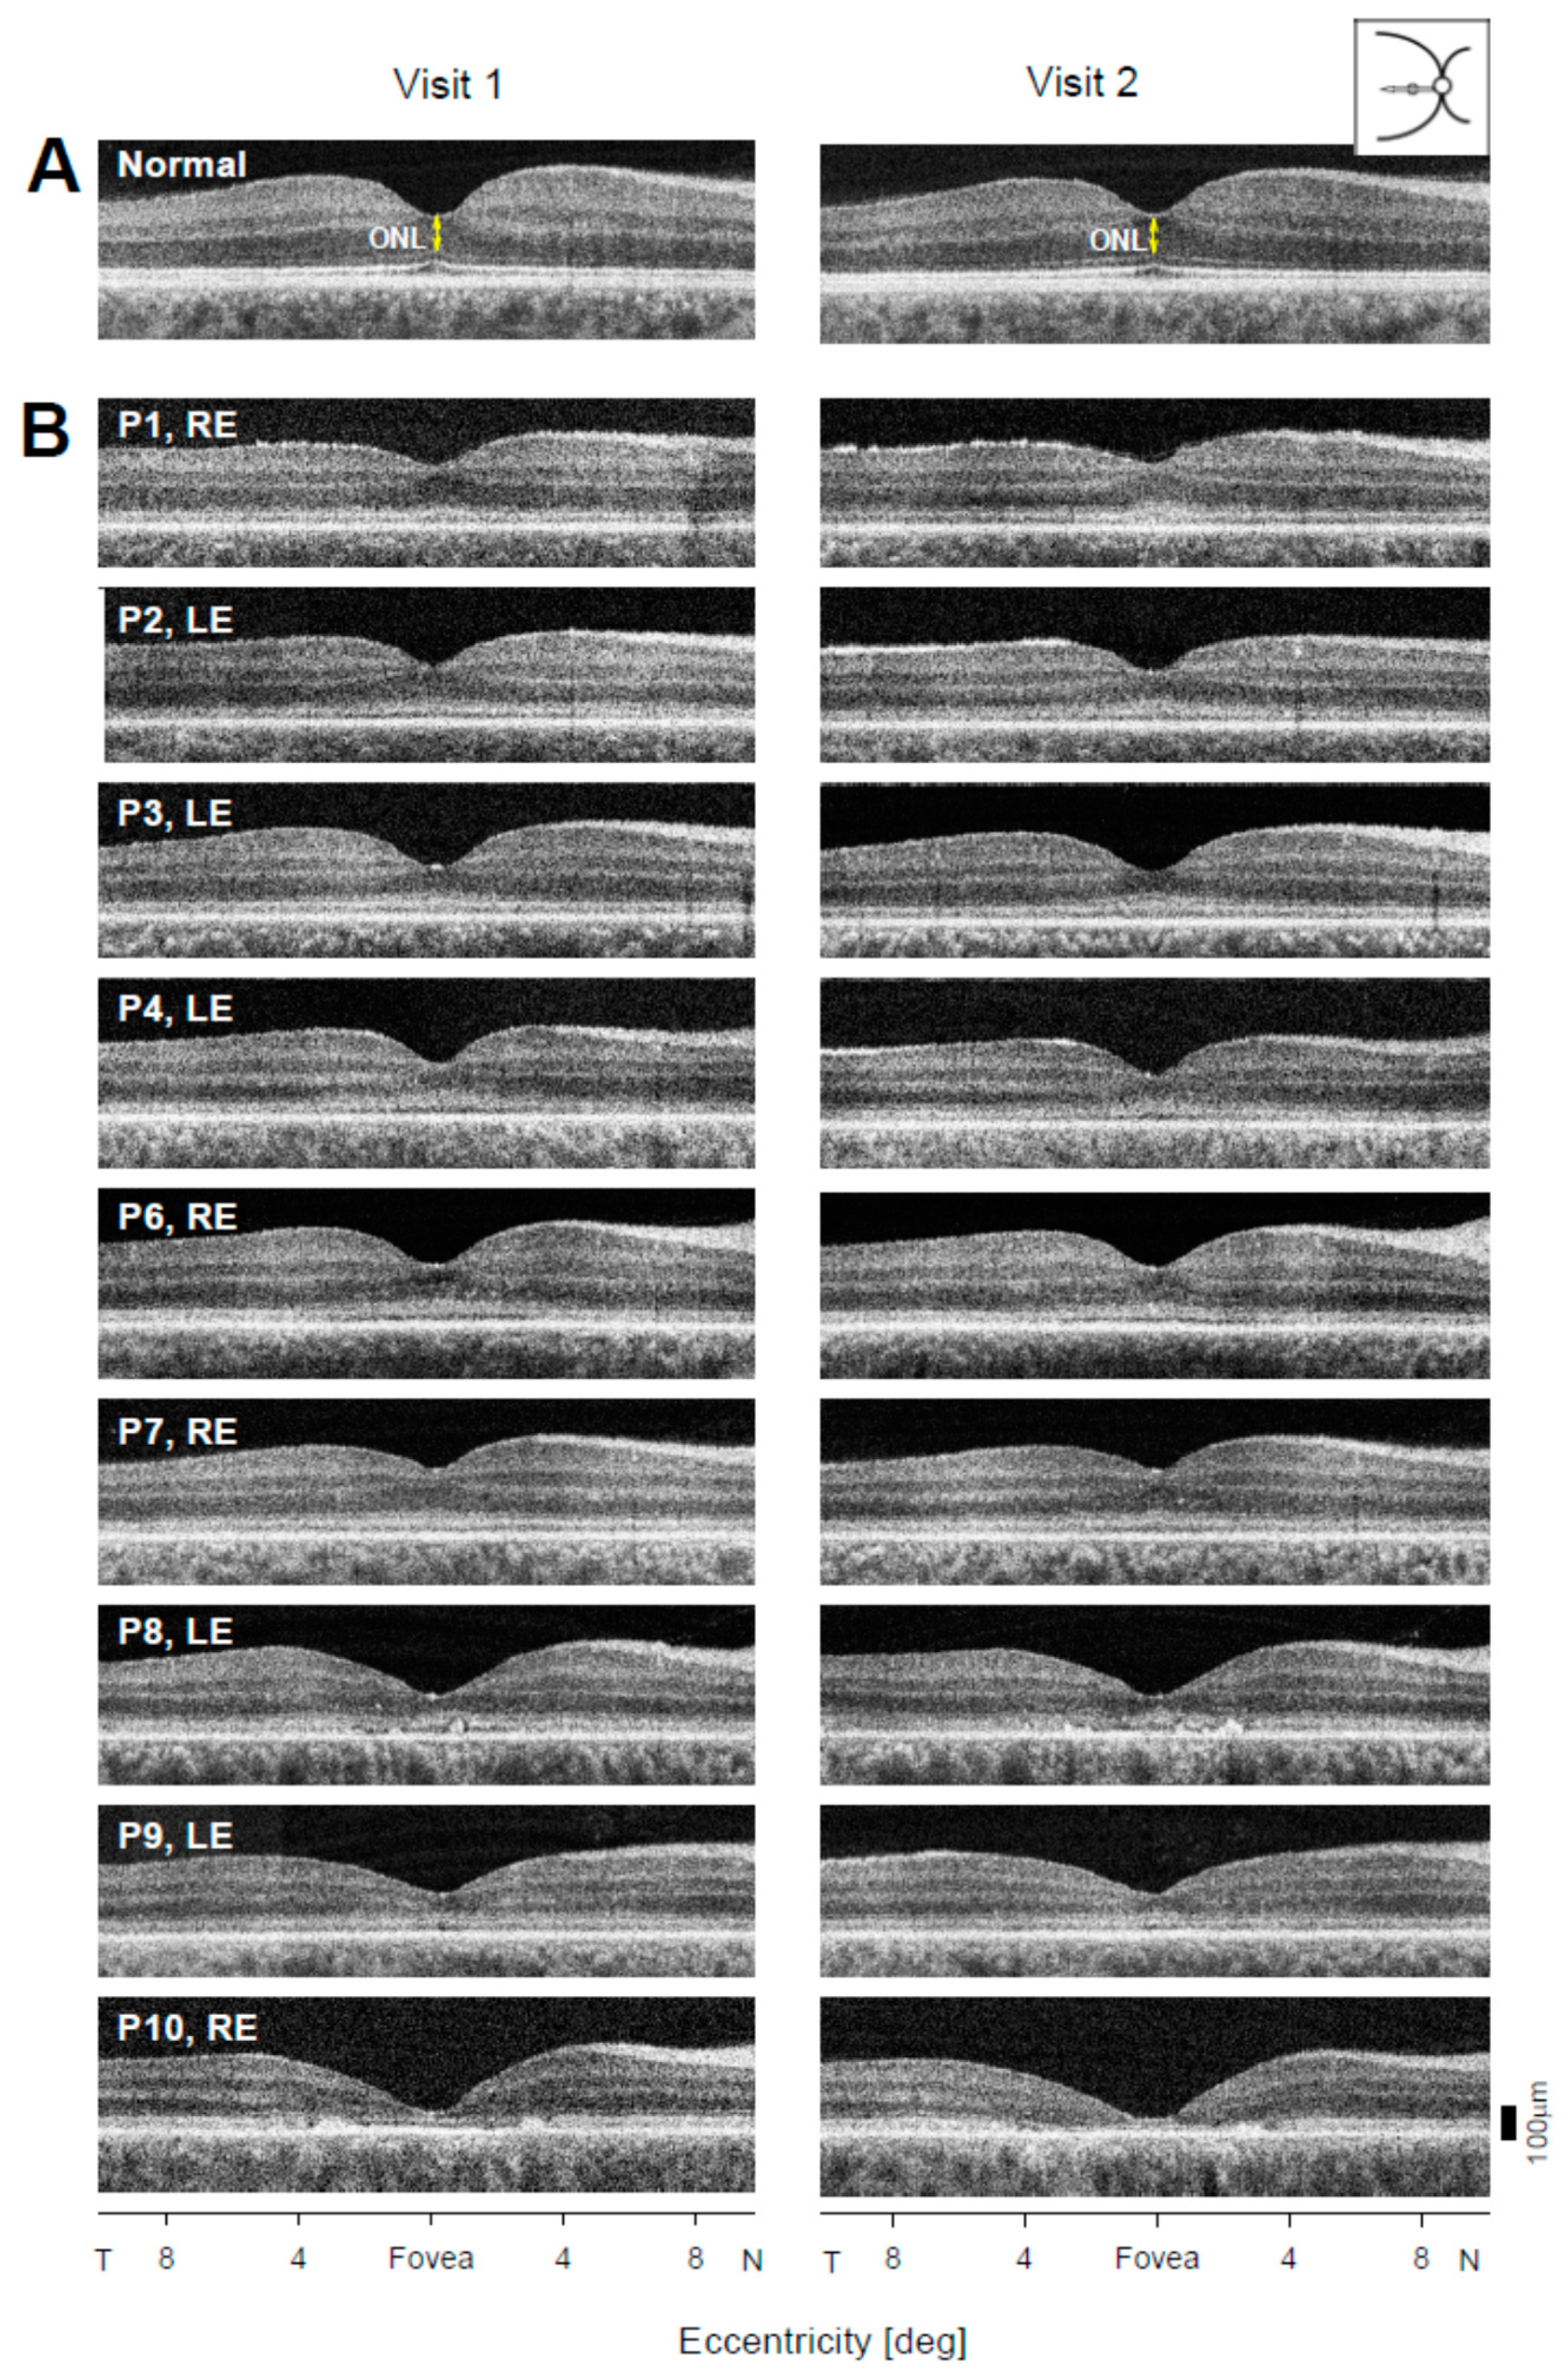
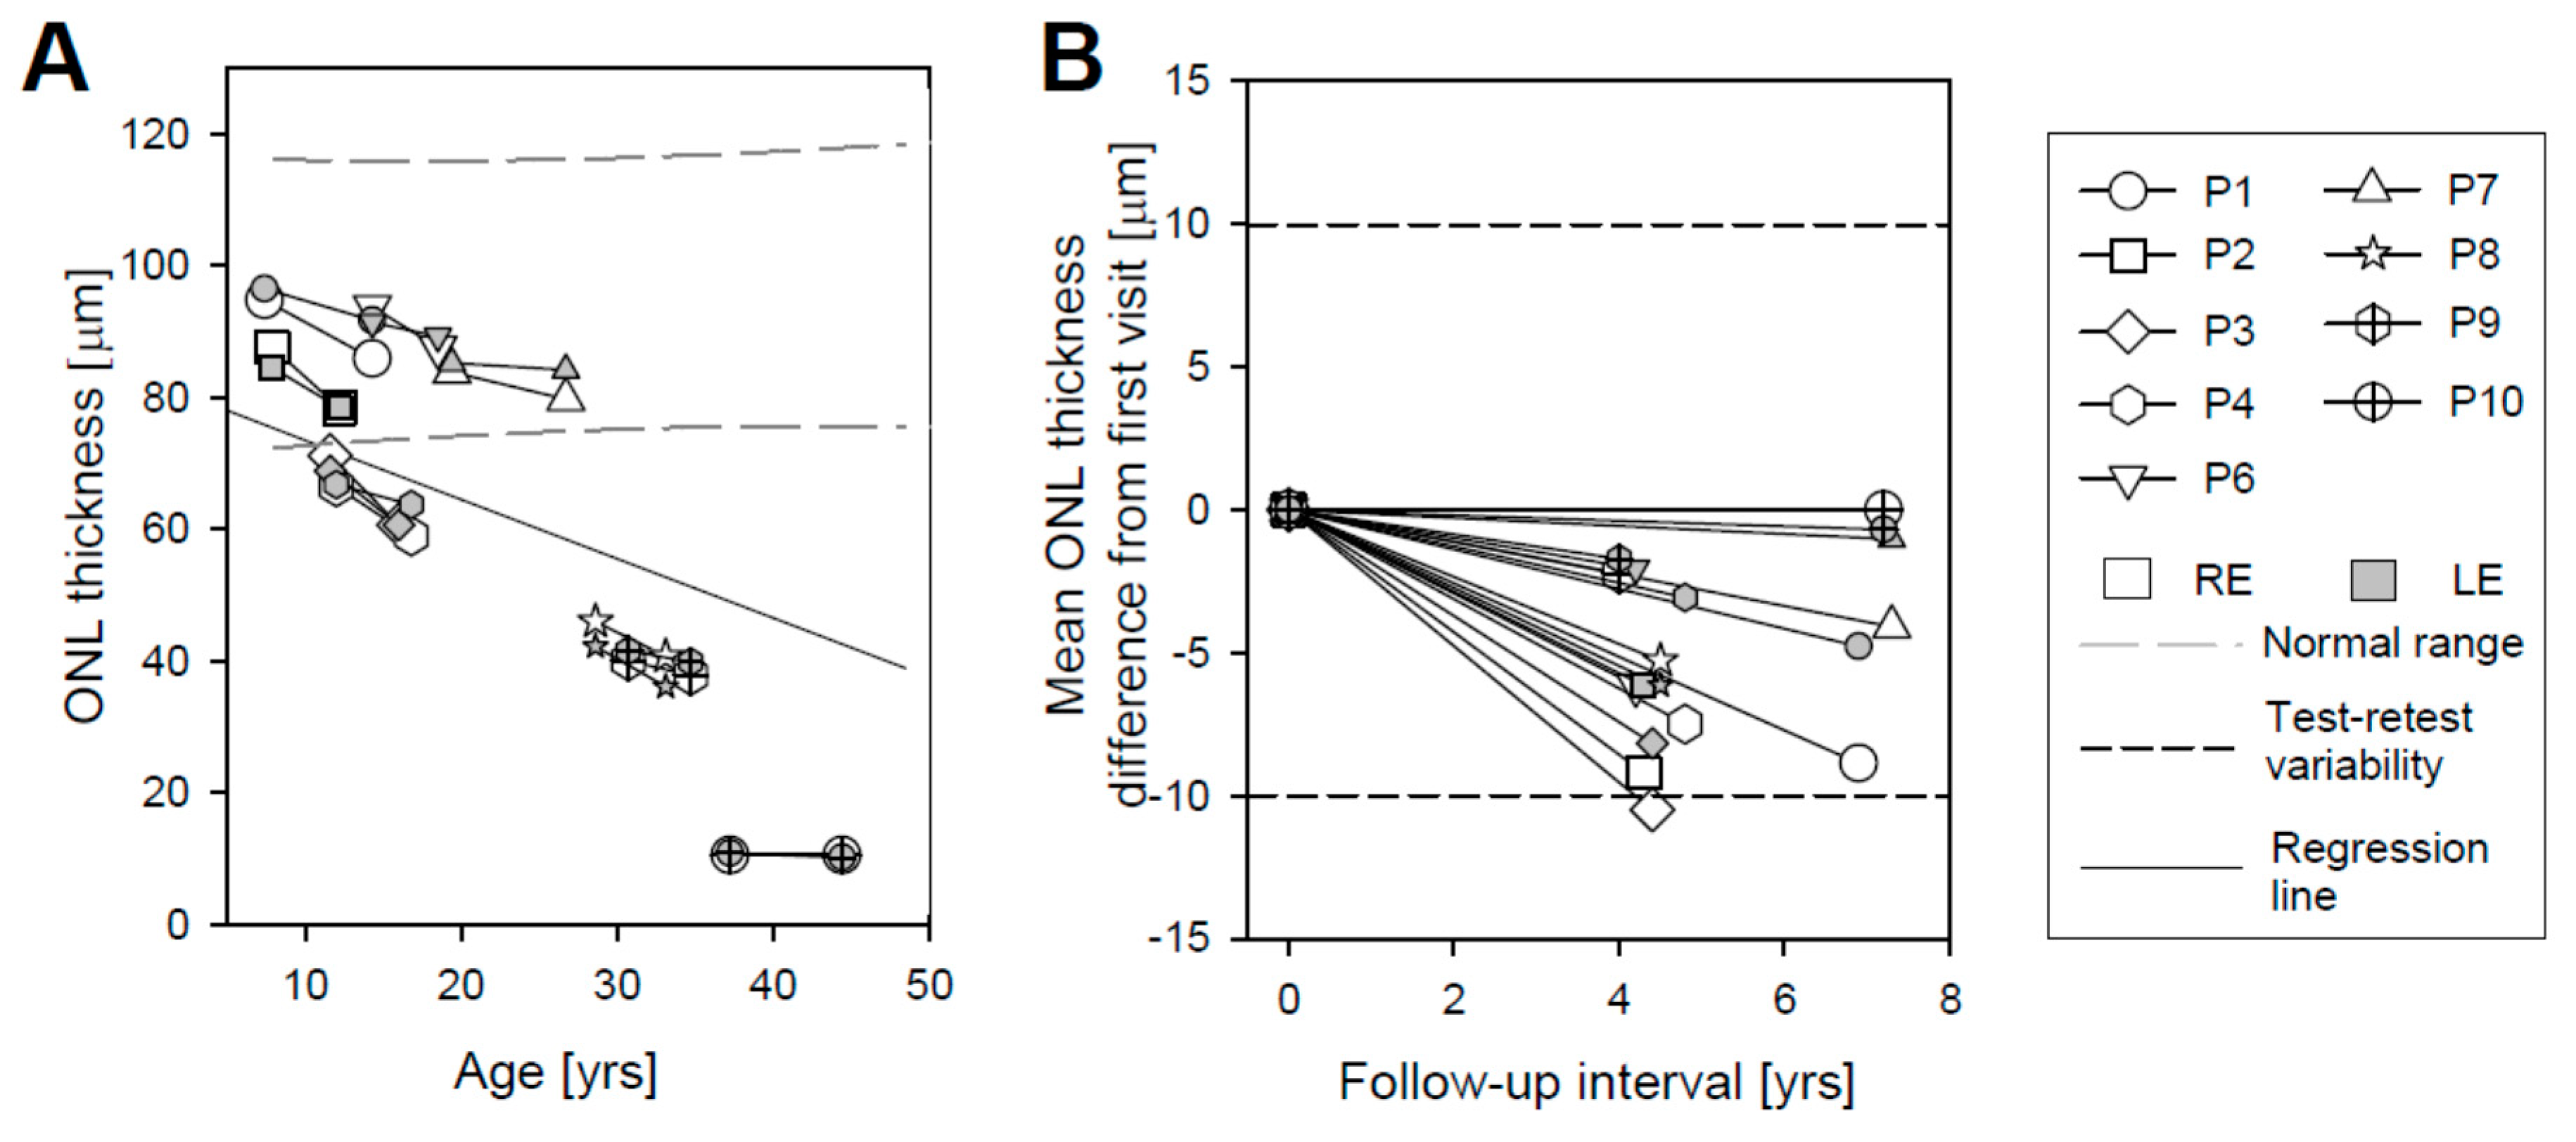
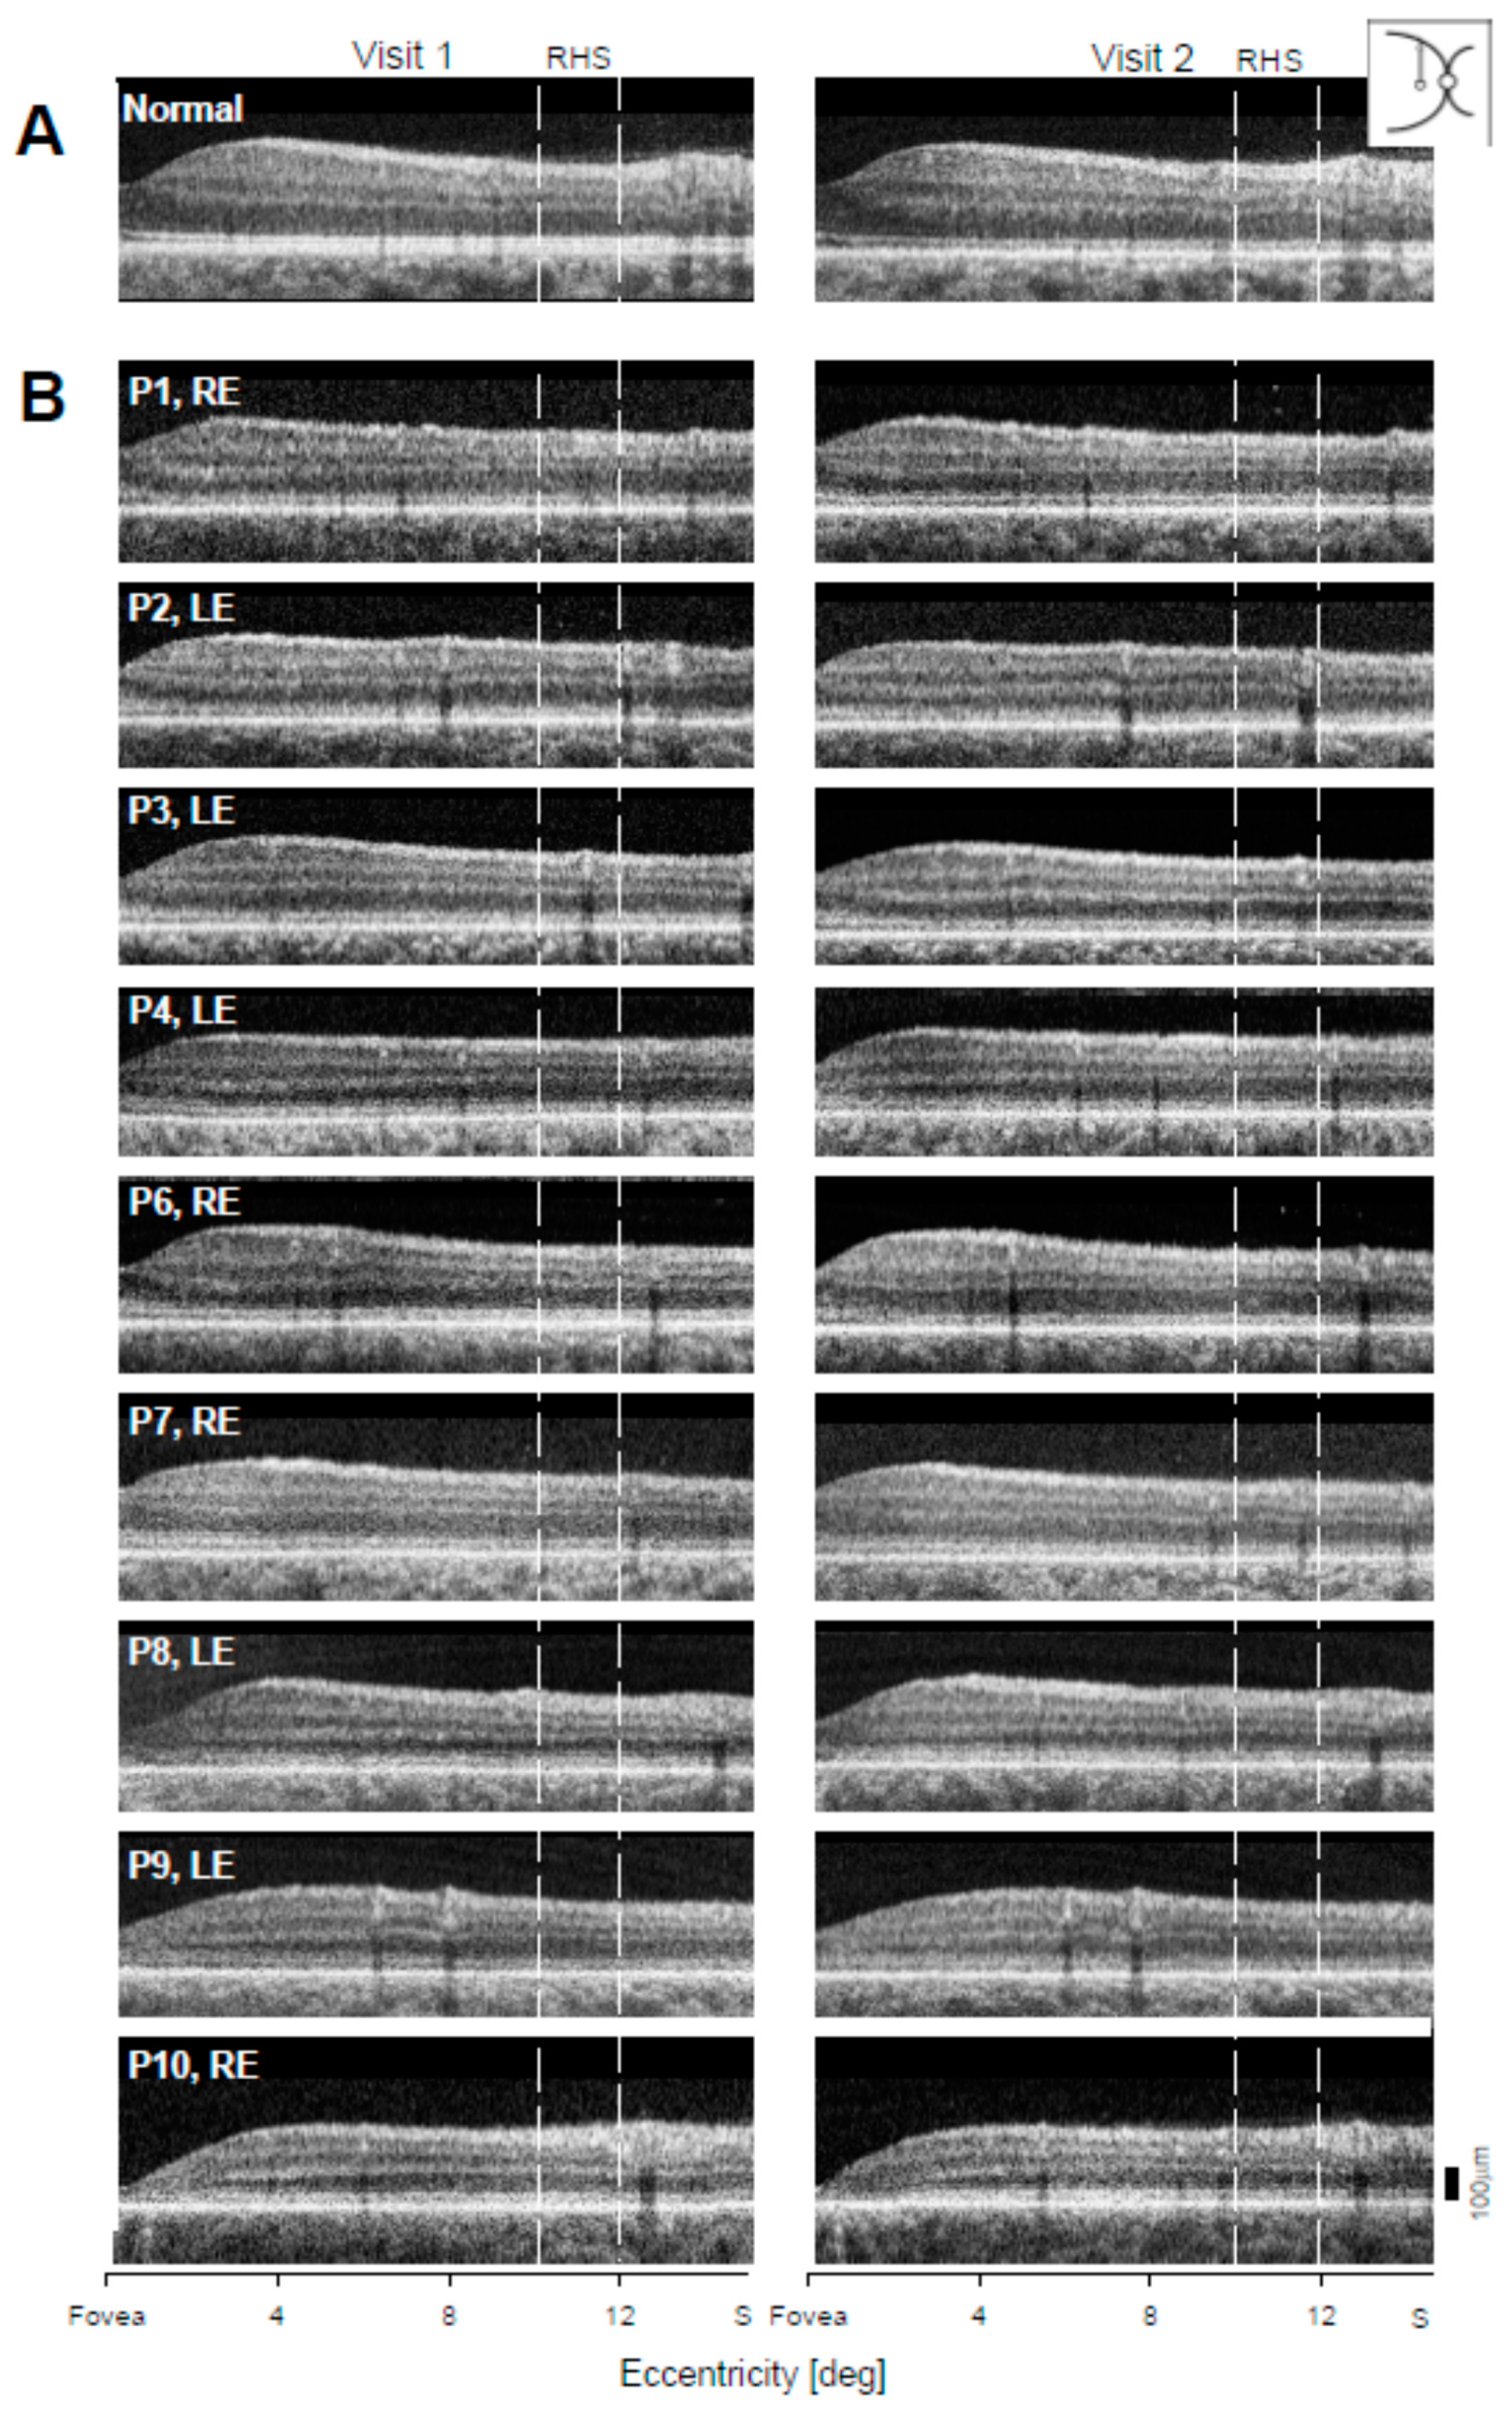
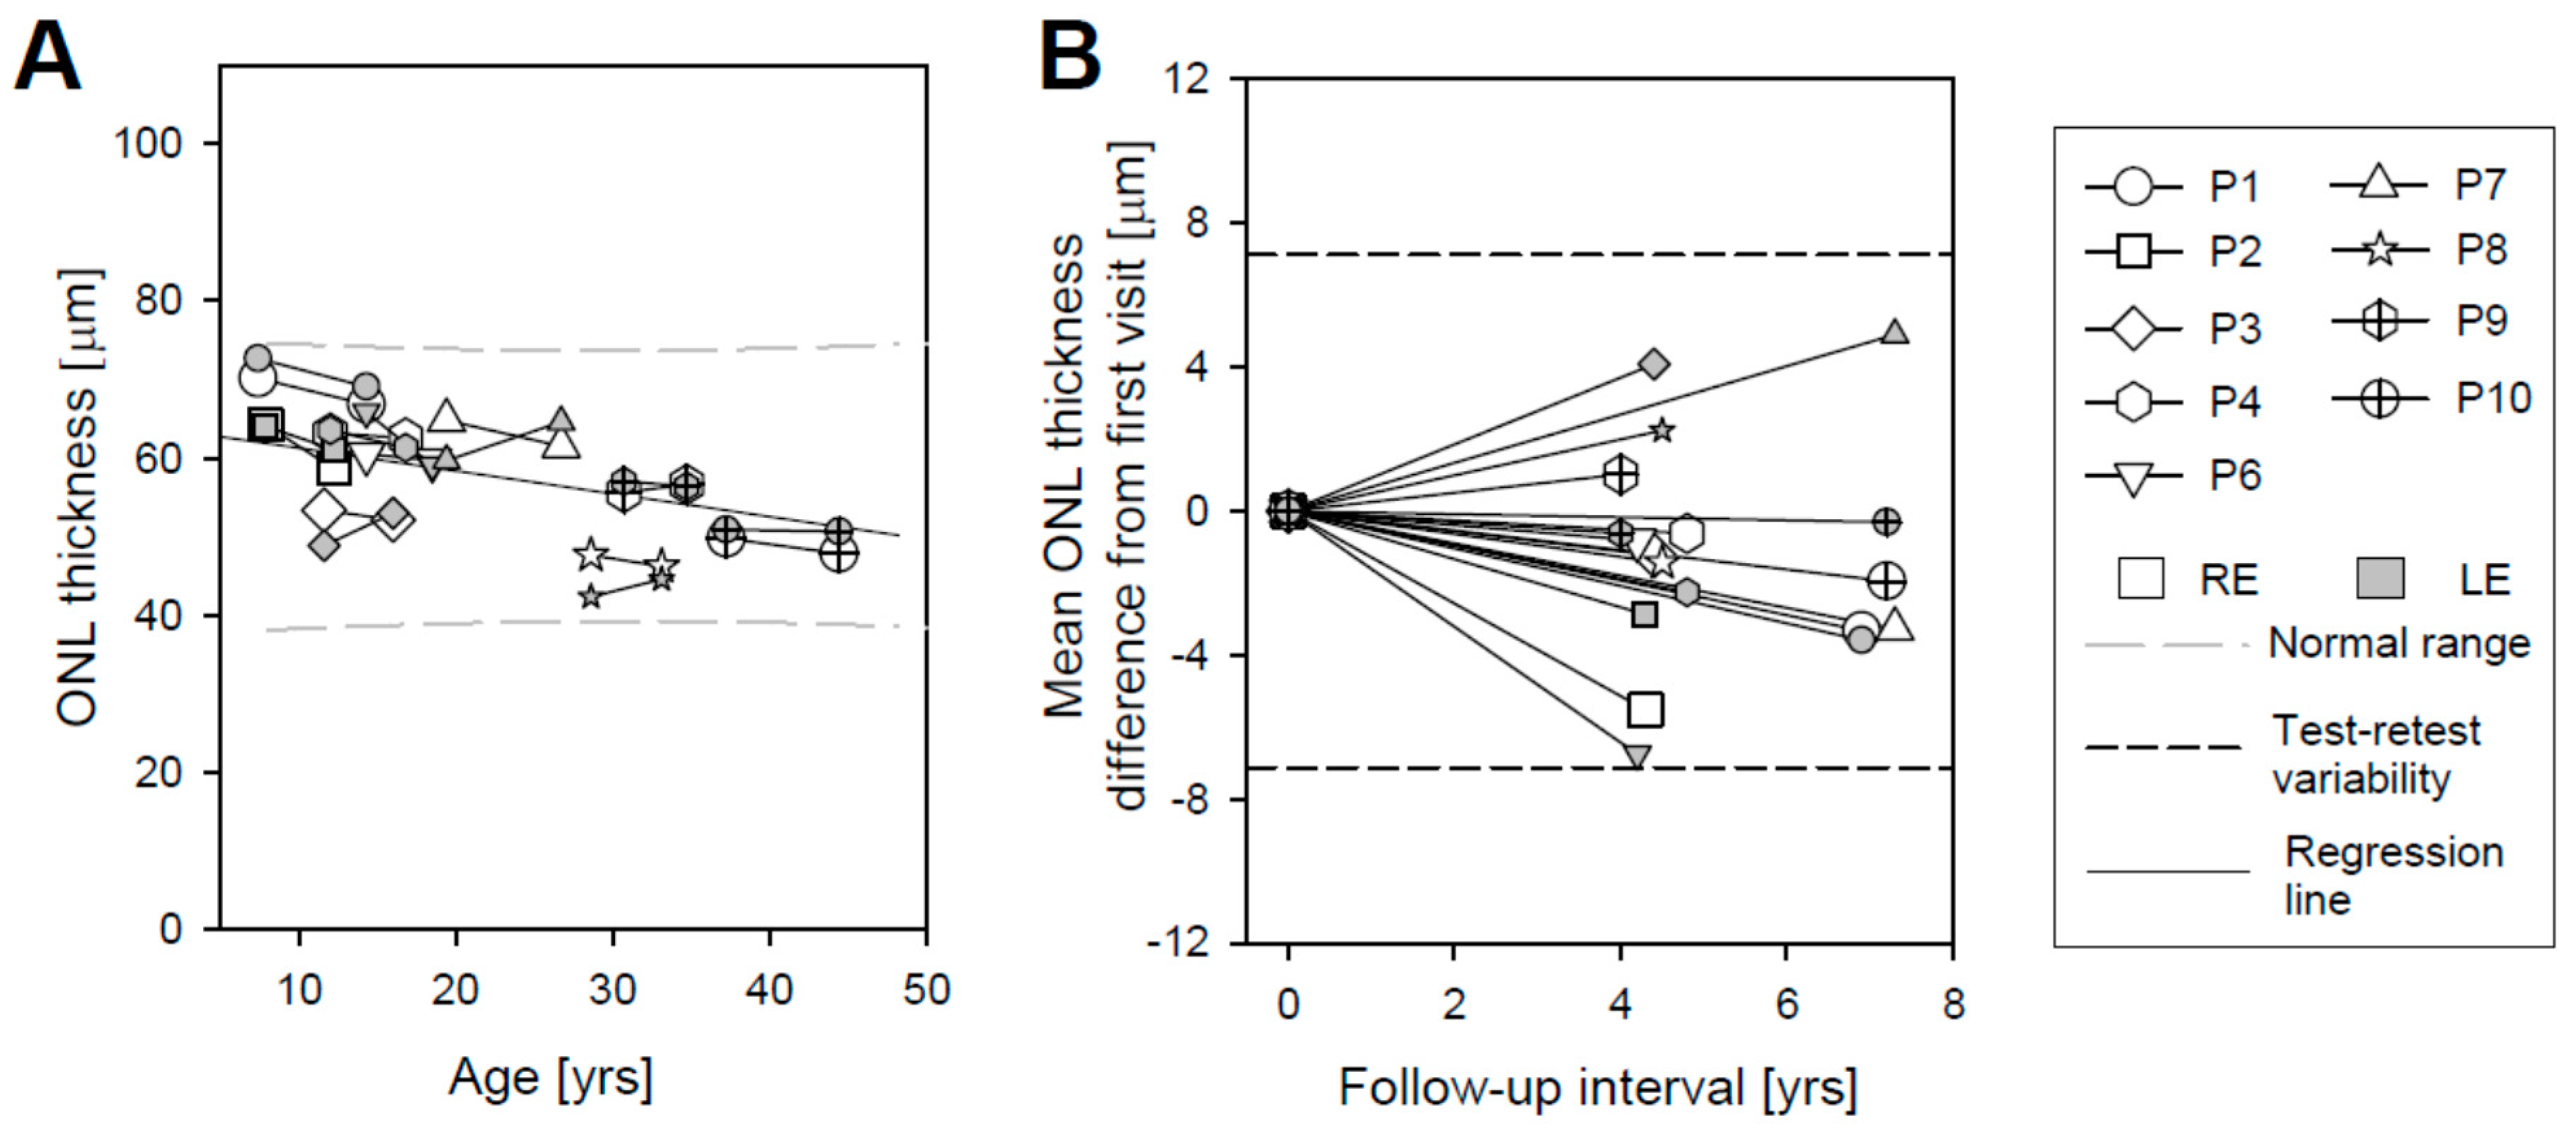
2.3. Photoreceptor Nuclear Layer Imaging with OCT as a Quantitative Safety Outcome
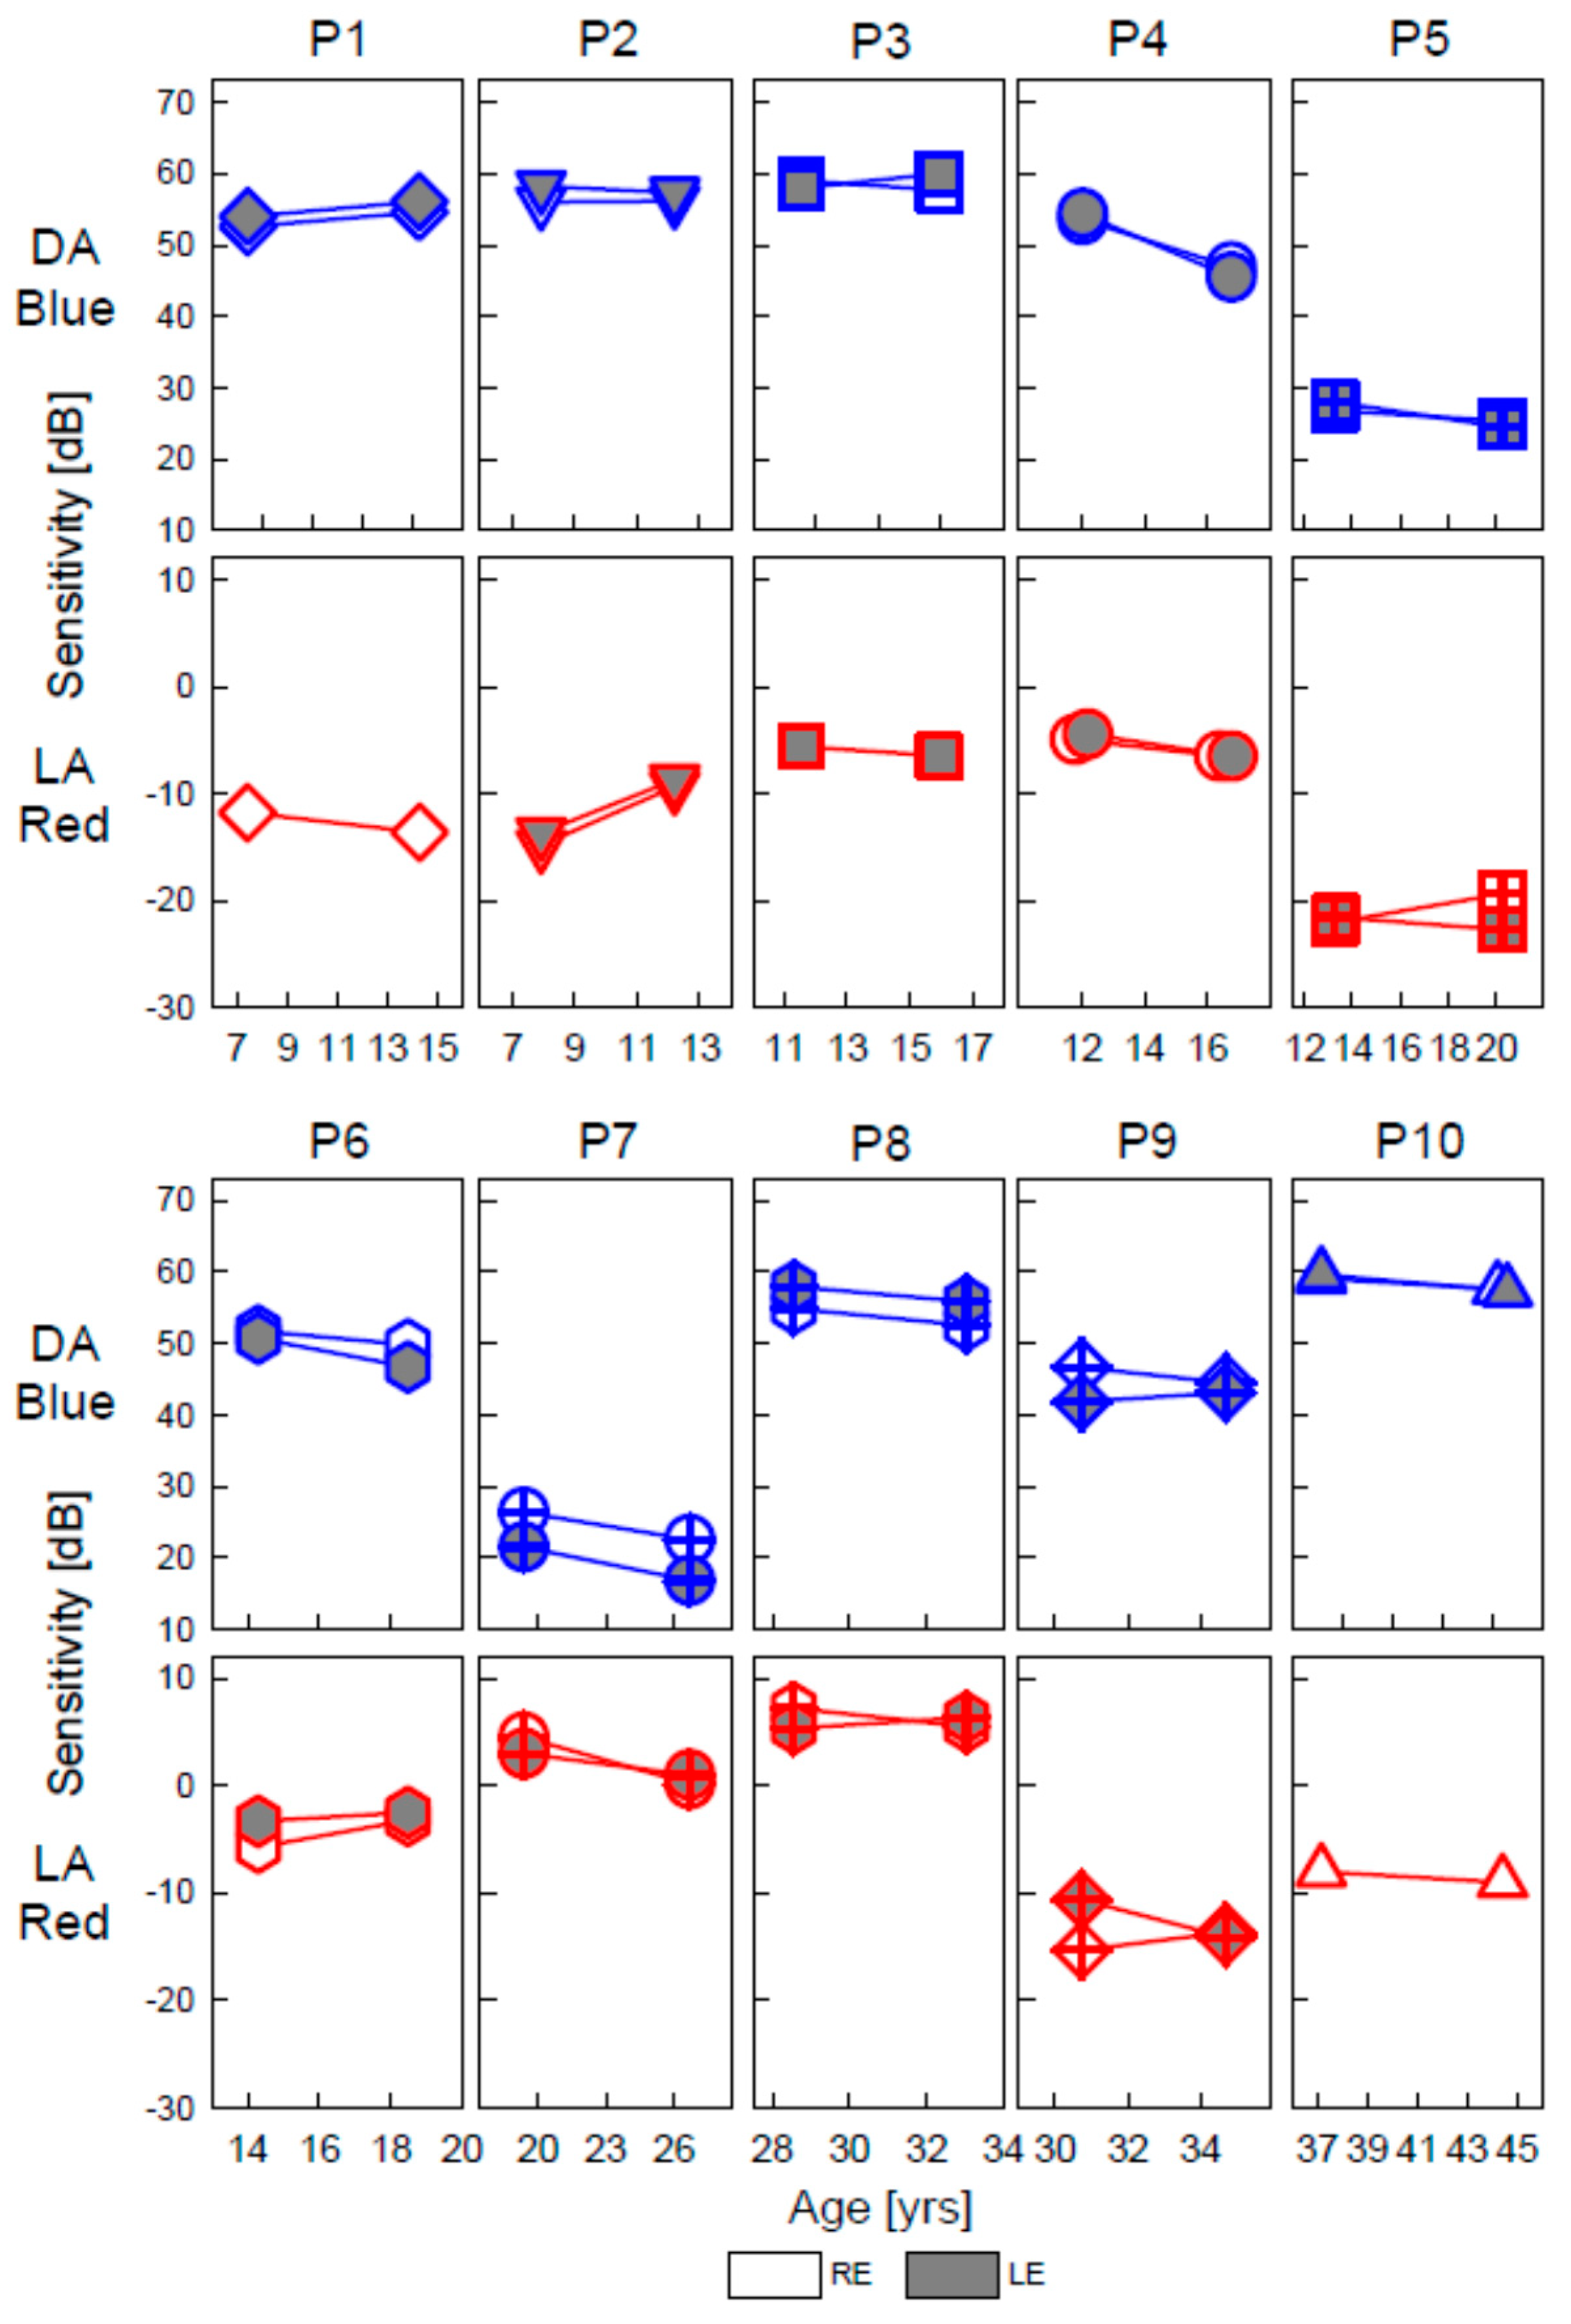
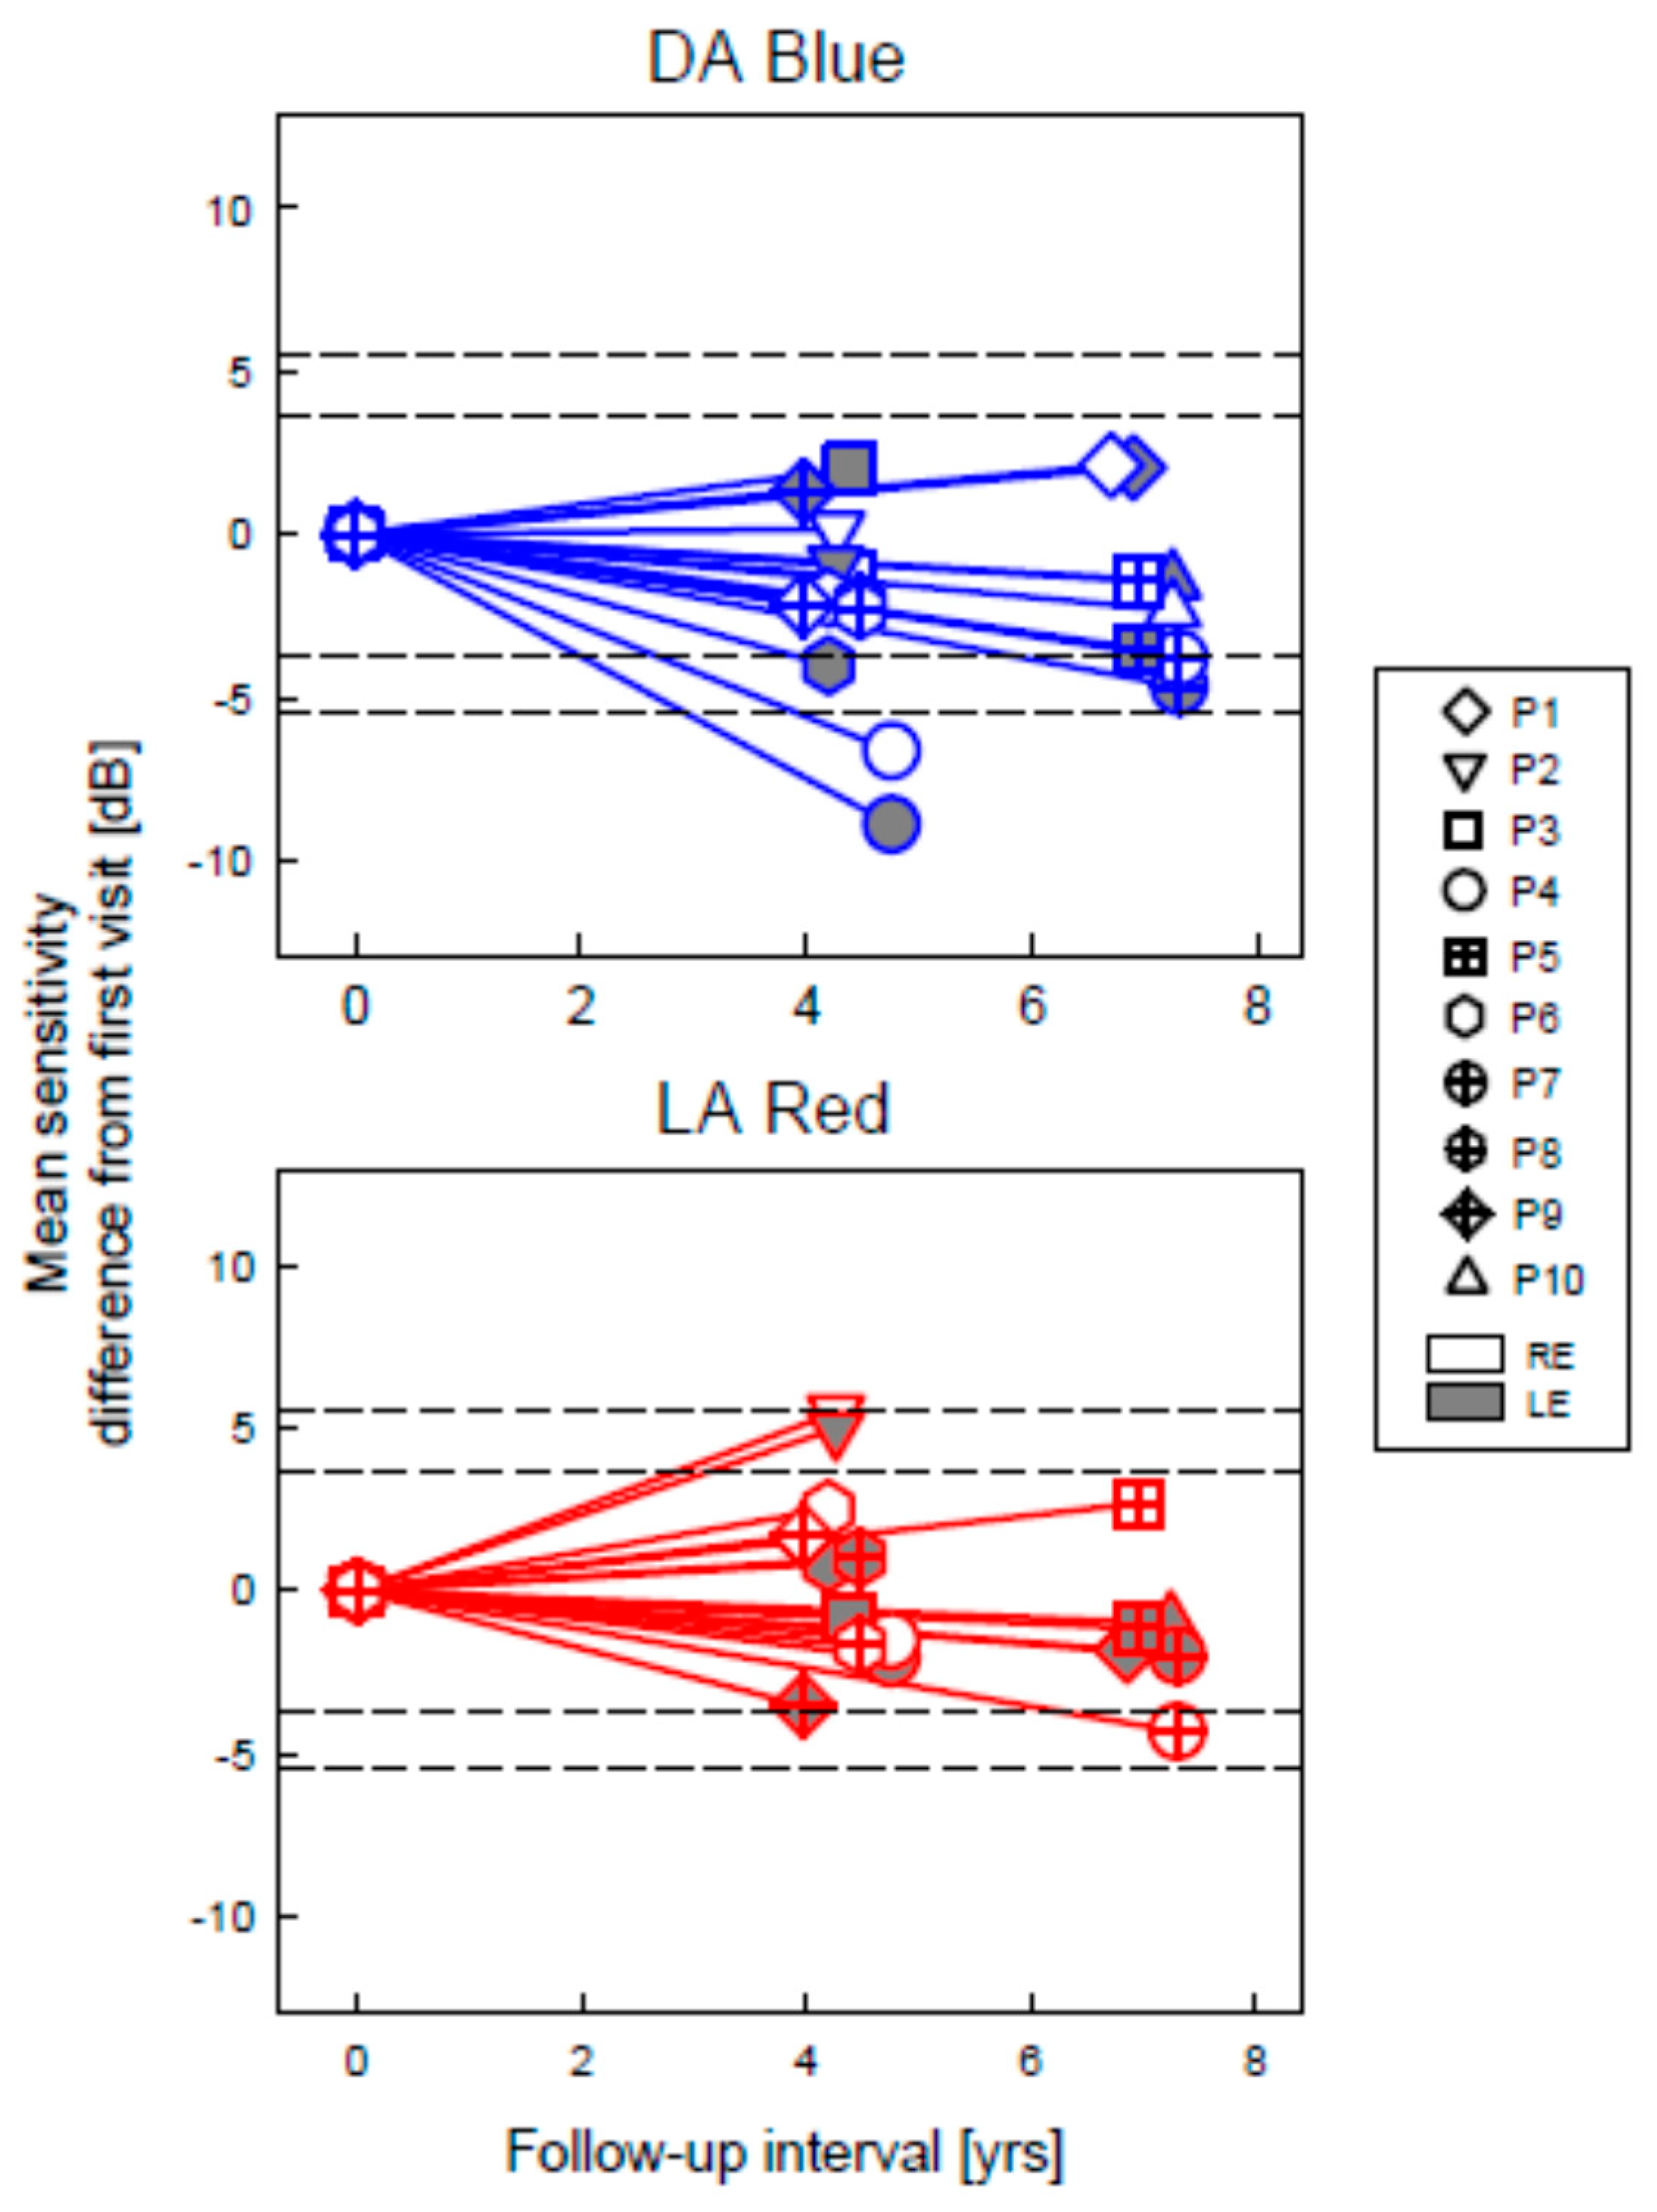
2.4. Full-Field Stimulus Testing as an Efficacy Outcome in GUCY2D-LCA
3. Summary and Conclusions
4. Materials and Methods
4.1. Subjects
4.2. Near-Infrared Autofluorescence
4.3. Optical Coherence Tomography
4.4. Visual Function
Supplementary Materials
Author Contributions
Funding
Institutional Review Board Statement
Informed Consent Statement
Conflicts of Interest
References
- Sacchetti, M.; Mantelli, F.; Merlo, D.; Lambiase, A. Systematic eview of Randomized Clinical Trials on Safety and Efficacy of Pharmacological and Nonpharmacological Treatments for Retinitis Pigmentosa. J. Ophthalmol. 2015, 2015, 1–11. [Google Scholar] [CrossRef] [Green Version]
- Thompson, D.A.; Iannaccone, A.; Ali, R.R.; Arshavsky, V.Y.; Audo, I.; Bainbridge, J.W.B.; Besirli, C.G.; Birch, D.G.; Branham, K.E.; Cideciyan, A.V.; et al. Advancing Clinical Trials for Inherited Retinal Diseases: Recommendations from the Second Monaciano Symposium. Transl. Vis. Sci. Technol. 2020, 9, 2. [Google Scholar] [CrossRef]
- Donato, L.; Scimone, C.; Alibrandi, S.; Rinaldi, C.; Sidoti, A.; D’Angelo, R. Transcriptome Analyses of lncRNAs in A2E-Stressed Retinal Epithelial Cells Unveil Advanced Links between Metabolic Impairments Related to Oxidative Stress and Retinitis Pigmentosa. Antioxidants 2020, 9, 318. [Google Scholar] [CrossRef] [Green Version]
- Scimone, C.; Alibrandi, S.; Scalinci, S.Z.; Battagliola, E.T.; D’Angelo, R.; Sidoti, A.; Donato, L. Expression of Pro-Angiogenic Markers Is Enhanced by Blue Light in Human RPE Cells. Antioxidants 2020, 9, 1154. [Google Scholar] [CrossRef] [PubMed]
- Donato, L.; Scimone, C.; Alibrandi, S.; Pitruzzella, A.; Scalia, F.; D’Angelo, R.; Sidoti, A. Possible A2E Mutagenic Effects on RPE Mitochondrial DNA from Innovative RNA-Seq Bioinformatics Pipeline. Antioxidants 2020, 9, 1158. [Google Scholar] [CrossRef]
- Donato, L.; Scimone, C.; Alibrandi, S.; Abdalla, E.M.; Nabil, K.M.; D’Angelo, R.; Sidoti, A. New Omics–Derived Perspectives on Retinal Dystrophies: Could Ion Channels-Encoding or Related Genes Act as Modifier of Pathological Phenotype? Int. J. Mol. Sci. 2020, 22, 70. [Google Scholar] [CrossRef]
- Hollander, A.I.D.; Roepman, R.; Koenekoop, R.K.; Cremers, F.P. Leber congenital amaurosis: Genes, proteins and disease mechanisms. Prog. Retin. Eye Res. 2008, 27, 391–419. [Google Scholar] [CrossRef] [PubMed]
- Kondkar, A.A.; Abu-Amero, K.K. Leber congenital amaurosis: Current genetic basis, scope for genetic testing and person-alized medicine. Exp. Eye Res. 2019, 189, 107834. [Google Scholar] [CrossRef]
- Cideciyan, A.V.; Jacobson, S.G. Proctor Award Lecture: Leber congenital amaurosis (LCA): Potential for improvement of vision. Investig. Ophthalmol. Vis. Sci. 2019, 60, 1680–1695. [Google Scholar] [CrossRef] [Green Version]
- Boye, S.E. Insights gained from gene therapy in animal models of retGC1 deficiency. Front. Mol. Neurosci. 2014, 7, 43. [Google Scholar] [CrossRef] [PubMed] [Green Version]
- Boye, S.E. Leber Congenital Amaurosis Caused by Mutations in GUCY2D. Cold Spring Harb. Perspect. Med. 2014, 5, a017350. [Google Scholar] [CrossRef] [Green Version]
- Jacobson, S.G.; Cideciyan, A.V.; Peshenko, I.V.; Sumaroka, A.; Olshevskaya, E.V.; Cao, L.; Schwartz, S.B.; Roman, A.J.; Olivares, M.B.; Sadigh, S.; et al. Determining consequences of retinal membrane guanylyl cyclase (RetGC1) deficiency in human Leber congenital amaurosis en route to therapy: Residual cone-photoreceptor vision correlates with biochemical properties of the mutants. Hum. Mol. Genet. 2012, 22, 168–183. [Google Scholar] [CrossRef] [Green Version]
- Jacobson, S.G.; Cideciyan, A.V.; Sumaroka, A.; Roman, A.J.; Charng, J.; Lu, M.; Choudhury, S.; Schwartz, S.B.; Heon, E.; Fishman, G.A.; et al. Defining Outcomes for Clinical Trials of Leber Congenital Amaurosis Caused by GUCY2D Mutations. Am. J. Ophthalmol. 2017, 177, 44–57. [Google Scholar] [CrossRef]
- Bouzia, Z.; Georgiou, M.; Hull, S.; Robson, A.G.; Fujinami, K.; Rotsos, T.; Pontikos, N.; Arno, G.; Webster, A.R.; Hardcastle, A.J.; et al. GUCY2D-Associated Leber Congenital Amaurosis: A Retrospective Natural History Study in Preparation for Trials of Novel Therapies. Am. J. Ophthalmol. 2020, 210, 59–70. [Google Scholar] [CrossRef] [Green Version]
- Roman, A.J.; Cideciyan, A.V.; Aleman, T.S.; Jacobson, S.G. Full-field stimulus testing (FST) to quantify visual perception in severely blind candidates for treatment trials. Physiol. Meas. 2007, 28, N51–N56. [Google Scholar] [CrossRef] [PubMed]
- Cideciyan, A.V.; Swider, M.; Aleman, T.S.; Roman, M.I.; Sumaroka, A.; Schwartz, S.B.; Stone, E.M.; Jacobson, S.G. Reduced-illuminance autofluorescence imaging in ABCA4-associated retinal degenerations. J. Opt. Soc. Am. A Opt. Image Sci. Vis. 2007, 24, 1457–1467. [Google Scholar] [CrossRef] [PubMed] [Green Version]
- Cideciyan, A.V.; Swider, M.; Jacobson, S.G. Autofluorescence imaging with near-infrared excitation: Normalization by reflectance to reduce signal from choroidal fluorophores. Invest. Ophthalmol. Vis. Sci. 2015, 56, 3393–3406. [Google Scholar] [CrossRef] [PubMed] [Green Version]
- Bland, J.M.; Altman, D.G. Measurement error. BMJ 1996, 312, 1654. [Google Scholar] [CrossRef] [PubMed] [Green Version]
- Sumaroka, A.; Garafalo, A.V.; Cideciyan, A.V.; Charng, J.; Roman, A.J.; Choi, W.; Saxena, S.; Aksianiuk, V.; Kohl, S.; Wissinger, B.; et al. Blue Cone Monochromacy Caused by the C203R Missense Mutation or Large Deletion Mutations. Investig. Opthalmology Vis. Sci. 2018, 59, 5762–5772. [Google Scholar] [CrossRef] [PubMed]
- Curcio, C.A.; Sloan, K.R.; Kalina, R.E.; Hendrickson, A.E. Human photoreceptor topography. J. Comp. Neurol. 1990, 292, 497–523. [Google Scholar] [CrossRef] [PubMed]
- Roman, A.J.; Schwartz, S.B.; Aleman, T.S.; Cideciyan, A.V.; Chico, J.D.; Windsor, E.A.; Gardner, L.M.; Ying, G.-S.; Smilko, E.E.; Maguire, M.G.; et al. Quantifying rod photoreceptor-mediated vision in retinal degenerations: Dark-adapted thresholds as outcome measures. Exp. Eye Res. 2005, 80, 259–272. [Google Scholar] [CrossRef] [PubMed]
- Jacobson, S.G.; Cideciyan, A.V.; Ratnakaram, R.; Heon, E.; Schwartz, S.B.; Roman, A.J.; Peden, M.C.; Aleman, T.S.; Boye, S.L.; Sumaroka, A.; et al. Gene therapy for Leber congenital amaurosis caused by RPE65 mutations: Safety and efficacy in 15 children and adults followed up to 3 years. Arch. Ophthalmol. 2012, 130, 9–24. [Google Scholar] [CrossRef] [PubMed] [Green Version]
- Jacobson, S.G.; Cideciyan, A.V.; Sumaroka, A.; Roman, A.J.; Charng, J.; Lu, M.; Choi, W.; Sheplock, R.; Swider, M.; Kosyk, M.S.; et al. Outcome Measures for Clinical Trials of Leber Congenital Amaurosis Caused by the Intronic Mutation in the CEP290 Gene. Investig. Opthalmology Vis. Sci. 2017, 58, 2609–2622. [Google Scholar] [CrossRef] [PubMed] [Green Version]


Publisher’s Note: MDPI stays neutral with regard to jurisdictional claims in published maps and institutional affiliations. |
© 2021 by the authors. Licensee MDPI, Basel, Switzerland. This article is an open access article distributed under the terms and conditions of the Creative Commons Attribution (CC BY) license (http://creativecommons.org/licenses/by/4.0/).
Share and Cite
Jacobson, S.G.; Cideciyan, A.V.; Sumaroka, A.; Roman, A.J.; Wu, V.; Swider, M.; Sheplock, R.; Krishnan, A.K.; Garafalo, A.V. Leber Congenital Amaurosis Due to GUCY2D Mutations: Longitudinal Analysis of Retinal Structure and Visual Function. Int. J. Mol. Sci. 2021, 22, 2031. https://0-doi-org.brum.beds.ac.uk/10.3390/ijms22042031
Jacobson SG, Cideciyan AV, Sumaroka A, Roman AJ, Wu V, Swider M, Sheplock R, Krishnan AK, Garafalo AV. Leber Congenital Amaurosis Due to GUCY2D Mutations: Longitudinal Analysis of Retinal Structure and Visual Function. International Journal of Molecular Sciences. 2021; 22(4):2031. https://0-doi-org.brum.beds.ac.uk/10.3390/ijms22042031
Chicago/Turabian StyleJacobson, Samuel G., Artur V. Cideciyan, Alexander Sumaroka, Alejandro J. Roman, Vivian Wu, Malgorzata Swider, Rebecca Sheplock, Arun K. Krishnan, and Alexandra V. Garafalo. 2021. "Leber Congenital Amaurosis Due to GUCY2D Mutations: Longitudinal Analysis of Retinal Structure and Visual Function" International Journal of Molecular Sciences 22, no. 4: 2031. https://0-doi-org.brum.beds.ac.uk/10.3390/ijms22042031