Article

Identification of Predictive Biomarkers of Response to HSP90 Inhibitors in Lung Adenocarcinoma

by
Ángela Marrugal
1,
Irene Ferrer
1,2,
David Gómez-Sánchez
1,2,
Álvaro Quintanal-Villalonga
3,
María Dolores Pastor
4,
Laura Ojeda
1,
Luis Paz-Ares
1,2,5,6,*,† and
Sonia Molina-Pinelo
2,4,*,†
1
H12O-CNIO Lung Cancer Clinical Research Unit, Instituto de Investigación Hospital 12 de Octubre & Centro Nacional de Investigaciones Oncológicas (CNIO), 28029 Madrid, Spain
2
CIBERONC, Respiratory Tract Tumors Program, 28029 Madrid, Spain
3
Program in Molecular Pharmacology, Memorial Sloan Kettering Cancer Center, New York, NY 10065, USA
4
Institute of Biomedicine of Seville (IBIS) (HUVR, CSIC, Universidad de Sevilla), 41013 Sevilla, Spain
5
Medical Oncology Department, Hospital Universitario Doce de Octubre, 28041 Madrid, Spain
6
Medical School, Universidad Complutense, 28040 Madrid, Spain
*
Authors to whom correspondence should be addressed.
These authors contributed equally to this work.
Int. J. Mol. Sci. 2021, 22(5), 2538; https://0-doi-org.brum.beds.ac.uk/10.3390/ijms22052538
Submission received: 29 January 2021 / Revised: 19 February 2021 / Accepted: 27 February 2021 / Published: 3 March 2021
(This article belongs to the Special Issue Evolution and Function of the Hsp70 and Hsp90 Chaperone Machineries)

Abstract

:
Heat shock protein 90 (HSP90) plays an essential role in lung adenocarcinoma, acting as a key chaperone involved in the correct functioning of numerous highly relevant protein drivers of this disease. To this end, HSP90 inhibitors have emerged as promising therapeutic strategies, even though responses to them have been limited to date. Given the need to maximize treatment efficacy, the objective of this study was to use isobaric tags for relative and absolute quantitation (iTRAQ)-based proteomic techniques to identify proteins in human lung adenocarcinoma cell lines whose basal abundances were correlated with response to HSP90 inhibitors (geldanamycin and radicicol derivatives). From the protein profiles identified according to response, the relationship between lactate dehydrogenase B (LDHB) and DNA topoisomerase 1 (TOP1) with respect to sensitivity and resistance, respectively, to geldanamycin derivatives is noteworthy. Likewise, rhotekin (RTKN) and decaprenyl diphosphate synthase subunit 2 (PDSS2) were correlated with sensitivity and resistance to radicicol derivatives. We also identified a relationship between resistance to HSP90 inhibition and the p53 pathway by glucose deprivation. In contrast, arginine biosynthesis was correlated with sensitivity to HSP90 inhibitors. Further study of these outcomes could enable the development of strategies to improve the clinical efficacy of HSP90 inhibition in patients with lung adenocarcinoma.

1. Introduction

Heat shock protein 90 (HSP90) is one of the most abundant and important heat shock proteins (HSPs) [1], functioning as a chaperone involved in the maturation, stabilization, and activation of more than 300 so-called “client proteins” [2,3]. Remarkably, most of HSP90′s client proteins are oncoproteins with crucial roles in different hallmarks of cancer [4,5]. For this reason, HSP90 is also known as the “cancer chaperone”, making it an important antitumor target, particularly in tumors such as lung cancer where HSP90 client proteins act as oncodrivers [6,7,8].
Lung cancer is the leading cause of cancer death in both men and women worldwide [9]. Concerning lung adenocarcinoma, the main non-small-cell lung cancer (NSCLC) subtype, which also represents approximately 50% of the total lung cancer cases, the fact that it can be driven by different genetic alterations is remarkable. Interestingly, the resulting proteins of many oncodrivers, such as epidermal growth factor receptor (EGFR) [10], Erb-B2 receptor tyrosine kinase 2 (ERBB2) [11], MET proto-oncogene, receptor tyrosine kinase (MET) [12], B-Raf proto-oncogene, serine/threonine kinase (BRAF) [13], or the echinoderm microtubule-associated protein-like (EML4)–anaplastic lymphoma kinase (ALK) fusion protein [14], are clients of HSP90. Nevertheless, the instability of these drivers and, as a consequence, their degradation via the targeted inhibition of HSP90 lead to a loss of viability of tumor cells. Consequently, elevated HSP90 expression has been correlated with a poorer clinical prognosis, such as resistance to chemotherapy and radiotherapy [15,16]. HSP90 inhibitors have shown antitumoral activity potential in preclinical studies and clinical trials in the treatment of NSCLC [17]. In addition, HSP90 inhibitors have been proposed to act as chemosensitizers [18] and radiosensitizers [19] and prevent acquired resistance to targeted therapies [20,21].
Some of the most promising HSP90 inhibitors have been the geldanamycin derivatives tanespimycin (17-AAG) and retaspimycin hydrochloride (IPI-504), as well as the radicicol analogs ganetespib (STA-9090) and luminespib (AUY-922) [22]. These inhibitors all act by blocking HSP90′s ATP binding site, which leads to proteasomal client degradation [23,24]. They have been widely evaluated in clinical trials with lung cancer patients and have shown encouraging results [25,26,27,28,29,30], specifically in those studies where the patients were molecularly stratified, such as lung adenocarcinoma patients with mutated EGFR and translocated ALK [25,27,28,31]. However, HSP90 inhibition as a treatment for lung cancer is still limited due to moderate efficacy outcomes, emergence of resistance, and early recurrence [17,32]. Recent research has focused on studying proteomic alterations produced at the cellular level after HSP90 inhibition as well as the physiological consequences of this blockade [33,34]. In this sense, previous results from our research group identified putative biomarkers of the HSP90 inhibition response in lung adenocarcinoma; these included eukaryotic translation initiation factor 3 subunit I (EIF3I) and transketolase, among others. In addition, it was shown that altered proteomic profiles after HSP90 inhibition affect energy production as well as metabolic and apoptotic pathways [35]. In this context, the complex interactome of HSP90 and the elevated number of cellular processes in which this chaperone is involved have made it commonplace for proteomic tools to be used to study HSP90 and its inhibition [36]. However, predictive biomarkers to identify which patients will respond positively (or not) to treatment have not yet been described, this being an essential condition for the therapeutic efficacy of HSP90 inhibitors to be optimized [32]. For these reasons, the main objective of our study was to use iTRAQ-based proteomics techniques to comprehensively characterize the proteomic profile associated with sensitivity and resistance to HSP90 inhibitors in human lung adenocarcinoma cell lines. Our findings are potentially important for improving therapeutic strategies to effectively treat this disease.

2. Results

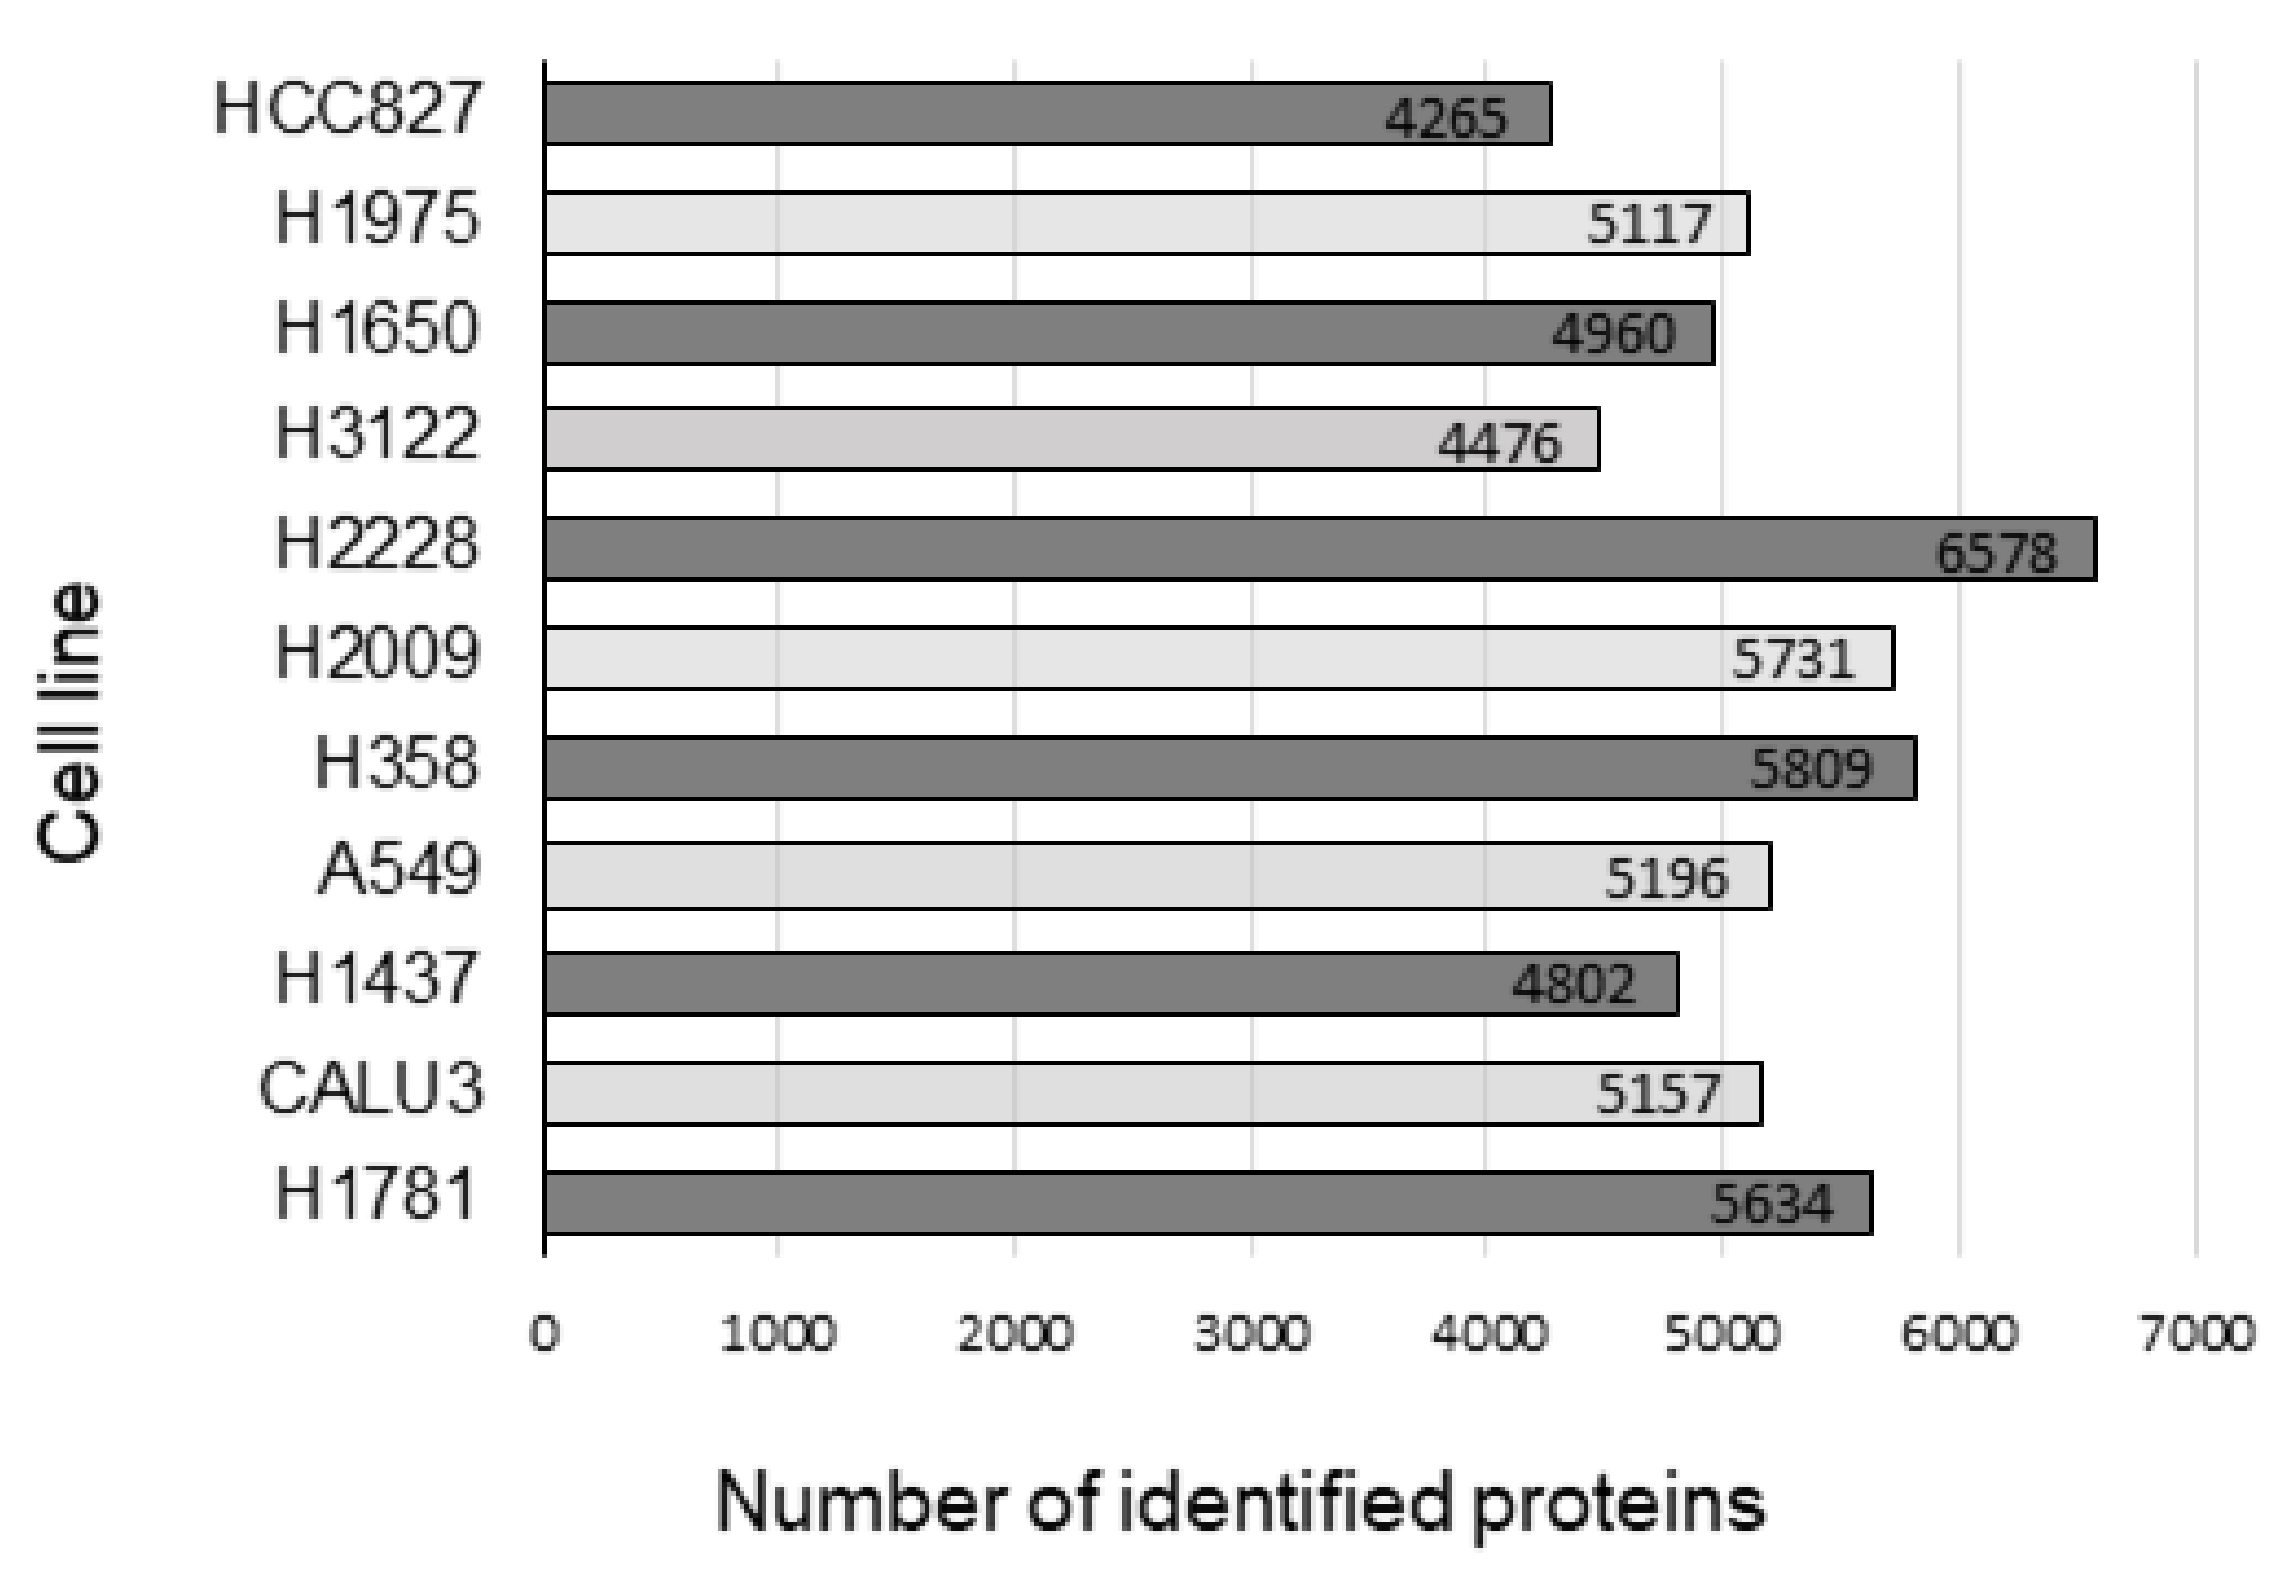
2.1. Determination of Proteomic Profiles Correlated with HSP90 Inhibitor Sensitivity or Resistance

iTRAQ protein quantitation coupled to mass spectrometry (NanoLC-MS/MS, Thermo Fisher Scientific, Waltham, Massachusetts, United States) was employed to predict sensitivity or resistance to HSP90 inhibitors by means of proteomic profiling of a panel of lung adenocarcinoma cell lines. Prior to treatment, the cell lines were profiled as mentioned and the basal abundance of proteins was calculated. An average of around 5000 proteins per cell line was identified (Figure 1).
To evaluate the efficiency of the response to HSP90 inhibition, the IC50 values for four HSP90 inhibitors were determined in our cell line panel. Table 1 shows IC50 values for geldanamycin derivatives (17-AAG and IPI-504) and radicicol derivatives (STA-9090 and AUY-922). The IC50 value was used to select the three cell lines most sensitive and resistant to each HSP90 inhibitor studied. In response to 17-AAG, cell lines H1975, H1437, and H1650 showed the lowest IC50 values (ranging from 1.258 to 6.555 nM); in contrast, HCC827, H2009, and Calu-3 showed the highest values (IC50 values between 26.255 and 87.733 nM). For the other geldanamycin derivative, IPI-504, the most sensitive lines were H1437 (IC50: 3.473 nM), H1650 (IC50: 3.764 nM), and H358 (IC50: 4.662 nM), while the most resistant were H2009, Calu-3, and H2228 (IC50: 33.833, 43.295, and 46.340 nM, respectively). In response to the radicicol derivative STA-9090, the lowest IC50 values were found in cell lines H2228, H2009, and H1975 (range: 4.131–4.739 nM), and the highest values were found in H3122 (IC50: 7.991 nM), H1781 (IC50: 9.954 nM), and Calu-3 (IC50: 18.445). In response to AUY-922 treatment, H1650, H2009, and H1975 were the most sensitive cell lines (IC50 values ranging from 1.472 to 2.595 nM), while H1781, A549, and Calu-3 were the most resistant (IC50 values between 23.787 and 1740.91 nM).
Our next step was to identify proteins commonly appearing in cell lines that were more sensitive or more resistant to the different treatments. Spearman’s rank correlation coefficient was then used to identify whether the basal abundances of these common proteins were correlated with the IC50 value of each inhibitor used in all the studied cell lines. Based on this criterion, for the geldanamycin derivatives 17-AAG and IPI-504, 27 and 1664 proteins, respectively, were related to sensitivity, while 171 and 1772, respectively, were related to resistance. Conversely, for the radicicol analogs STA-9090 and AUY-922, 51 and 1294 proteins, respectively, were correlated with sensitivity, while 21 and 1257, respectively, were correlated with resistance (Table 2). Notably, more proteins were related to sensitivity to radicicol derivatives, while more proteins were related to resistance to geldanamycin derivatives. Based on these differences, the study was continued according to the family of HSP90 inhibitors used.

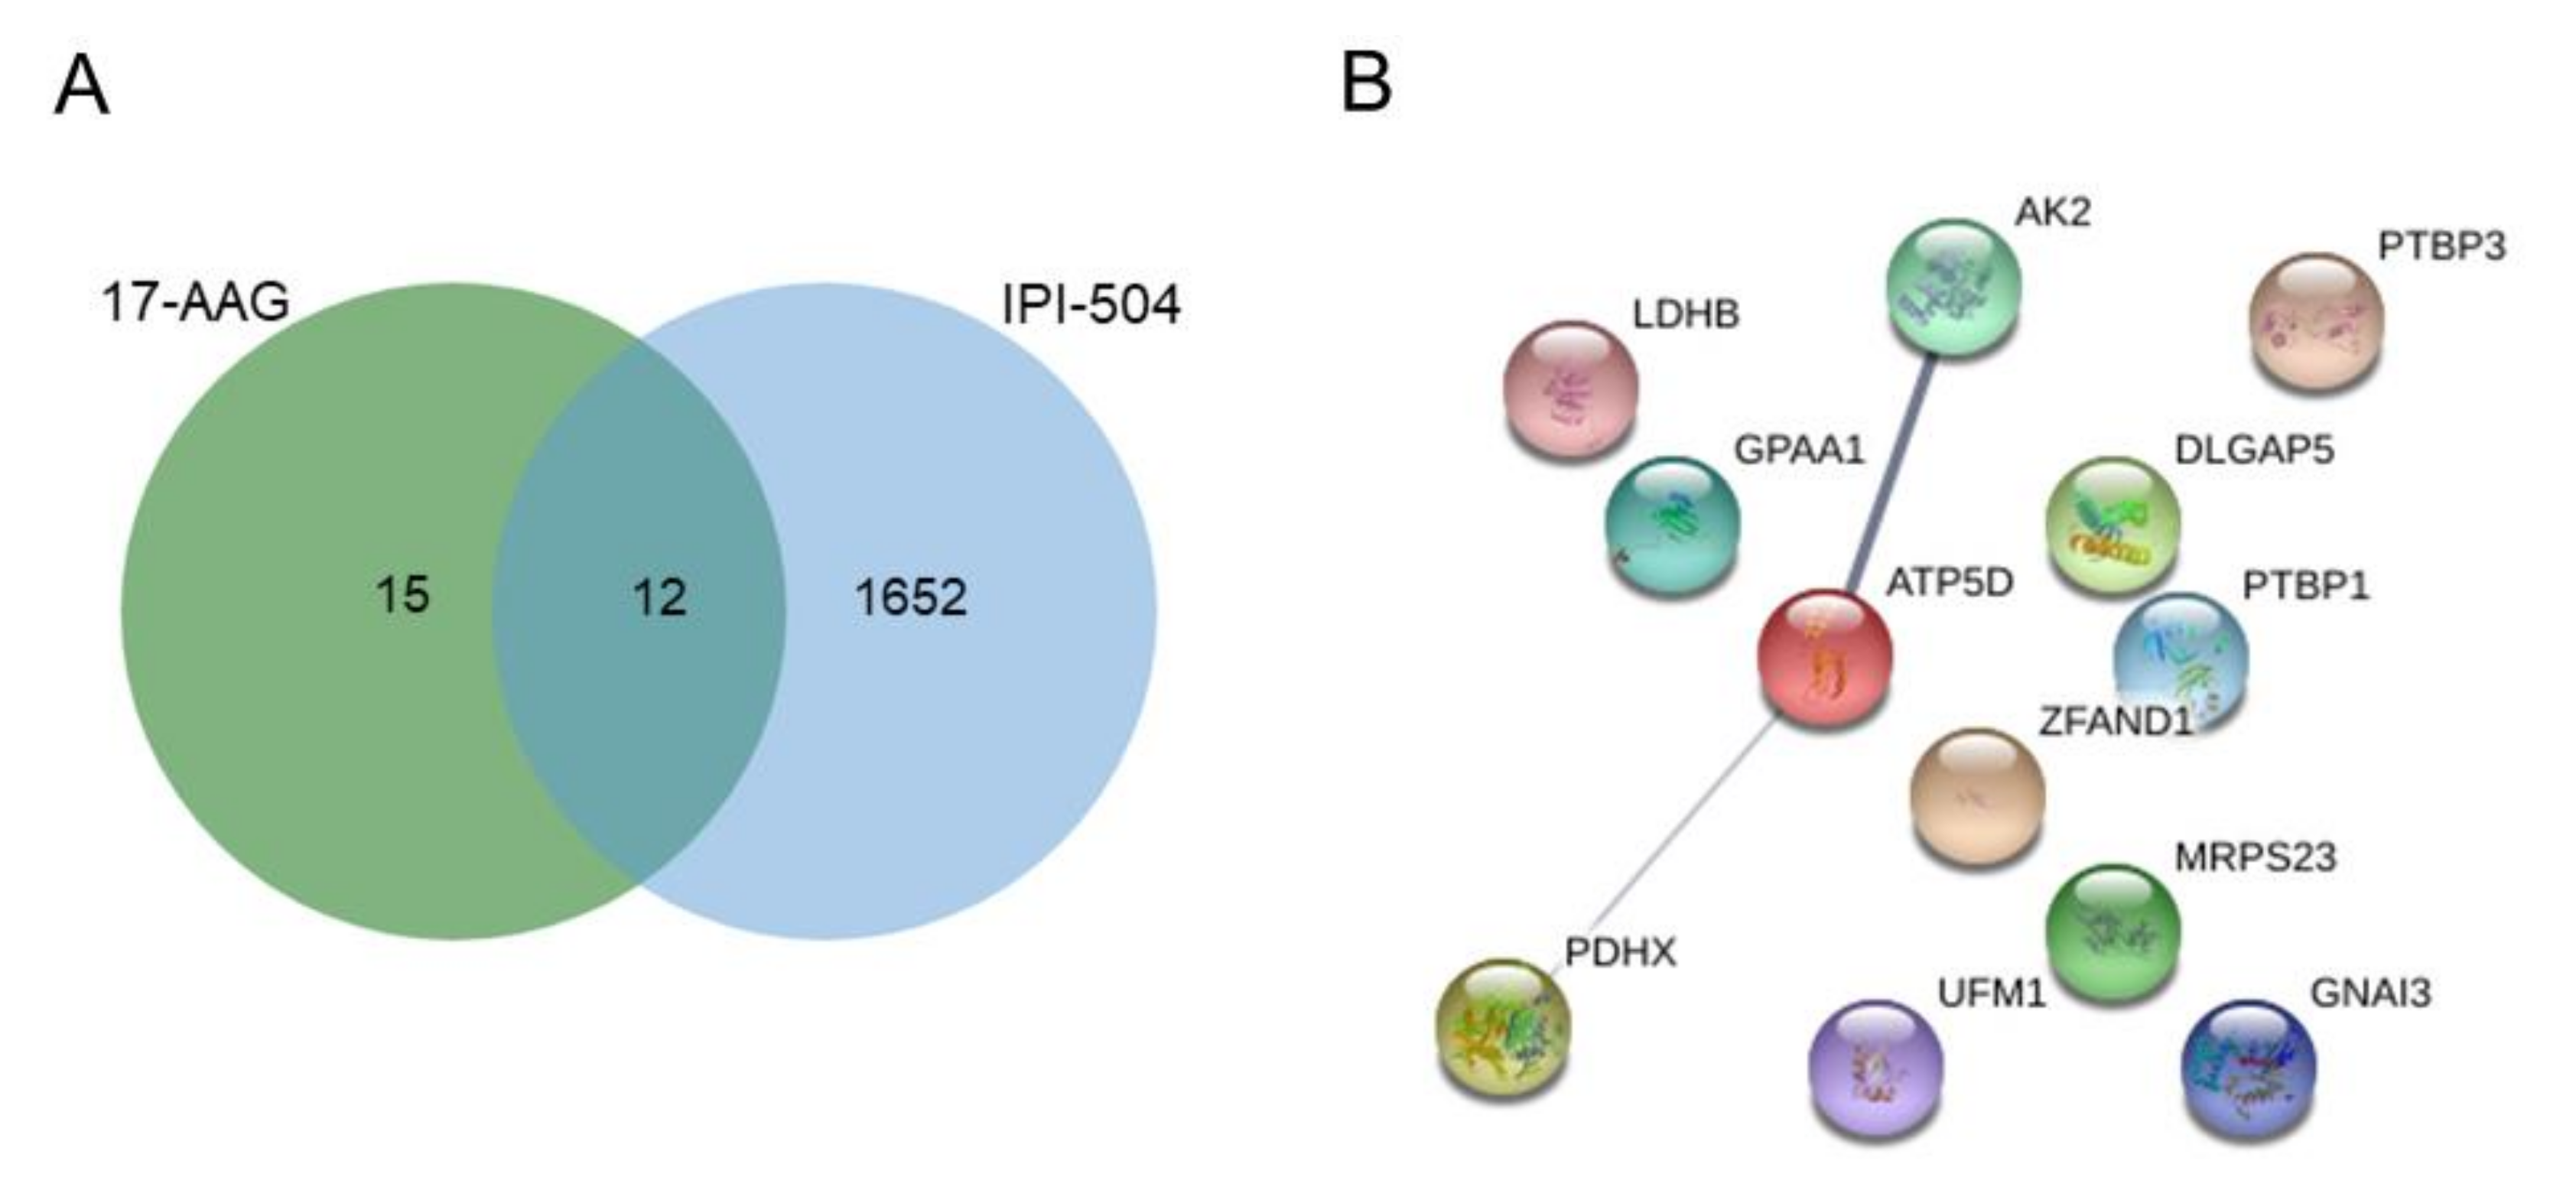
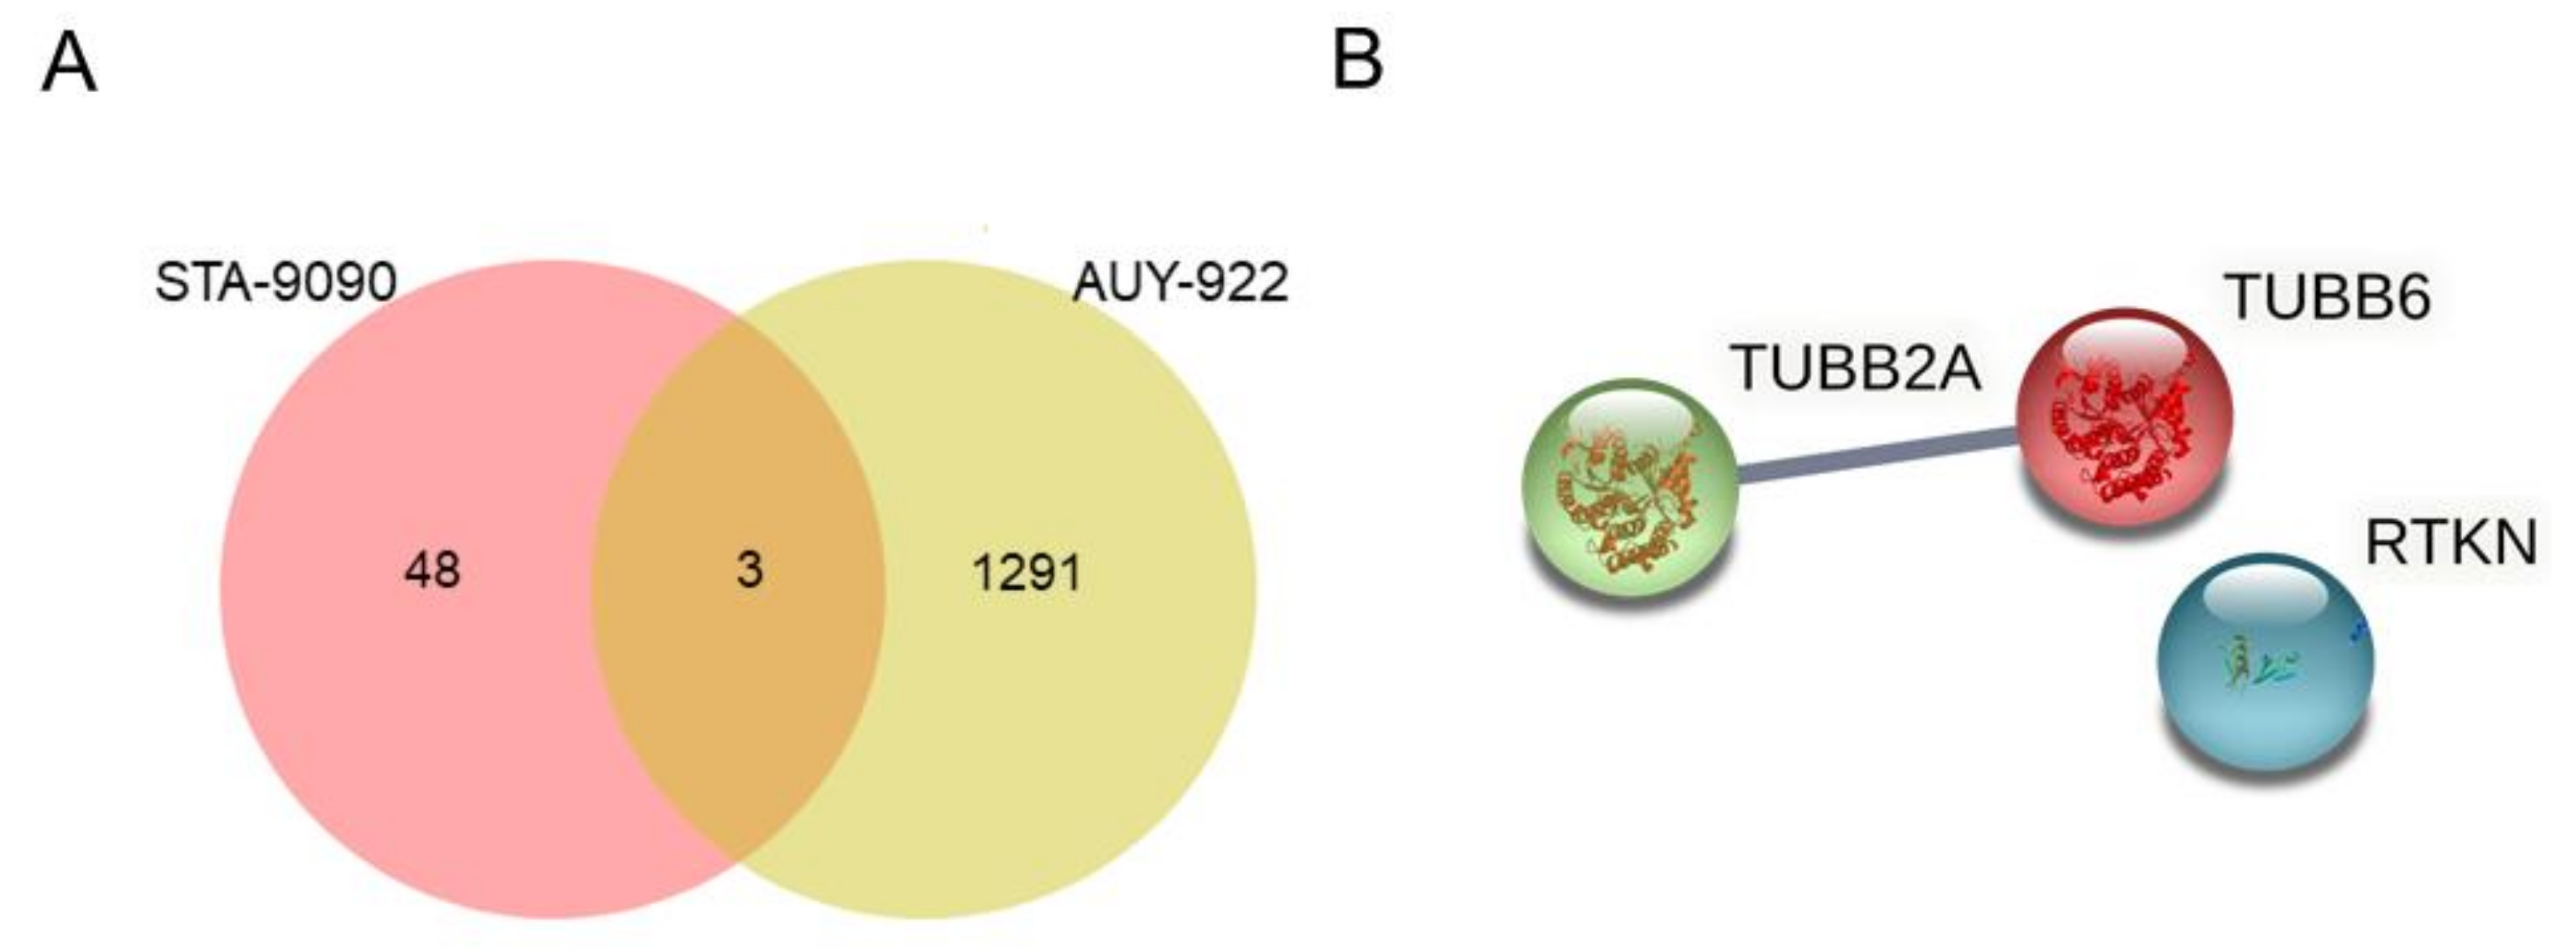
2.2. Identification of Candidate Biomarkers for Predicting Sensitivity to HSP90 Inhibitors in Lung Adenocarcinoma Cell Lines

Proteins whose basal abundances were correlated significantly with sensitivity to the different HSP90 inhibitor families were identified.
Focusing on the geldanamycin derivatives, a Venn diagram was built to determine the proteins associated with lower IC50 values for these HSP90 inhibitors (Figure 2A). We generated proteomic profiles for each drug, with 15 proteins expressed in only those cell lines with the highest sensitivity to 17-AAG and with 1652 proteins in the case of cell lines with high sensitivity to IPI-504 (Table S1). Additionally, both drugs shared 12 proteins in common that were associated with sensitivity to inhibition. Specifically, the 12 identified proteins were adenylate kinase 2 (AK2), ATP synthase subunit delta (ATP5D), disks large-associated protein 5 (DLGAP5), glycosylphosphatidylinositol anchor attachment 1 protein (GPAA1), guanine nucleotide-binding protein G(k) subunit alpha (GNAI3), lactate dehydrogenase B (LDHB), mitochondrial ribosomal protein S23 (MRPS23), polypyrimidine tract-binding protein 1 and 3 (PTBP1/3), pyruvate dehydrogenase protein X component (PDHX), ubiquitin-fold modifier 1 (UFM1), and zinc finger AN1-type containing 1 (ZFAND1) (Table S2). By mapping the protein–protein interactions of all common proteins associated with sensitivity to geldanamycin derivatives, we identified an interaction between AK2, ATP5D, and PDHX that is also associated with de novo purine synthesis (Figure 2B).
Concerning radicicol analogs, rhotekin (RTKN), tubulin beta-2A chain (TUBB2A), and tubulin beta-6 chain (TUBB6) were identified as proteins related to sensitivity to both drugs tested (Figure 3A and Table S3). Figure 3B shows how, of all of the proteins identified, TUBB2A and TUBB6 were the only ones that interacted; this interaction is also associated with cytoskeletal regulation by the Rho GTPases pathway. In addition, we identified 48 proteins expressed only in cell lines with a high sensitivity to STA9090, while 1291 proteins were expressed only in cell lines sensitive to AUY-992 (Figure 3A and Table S1).

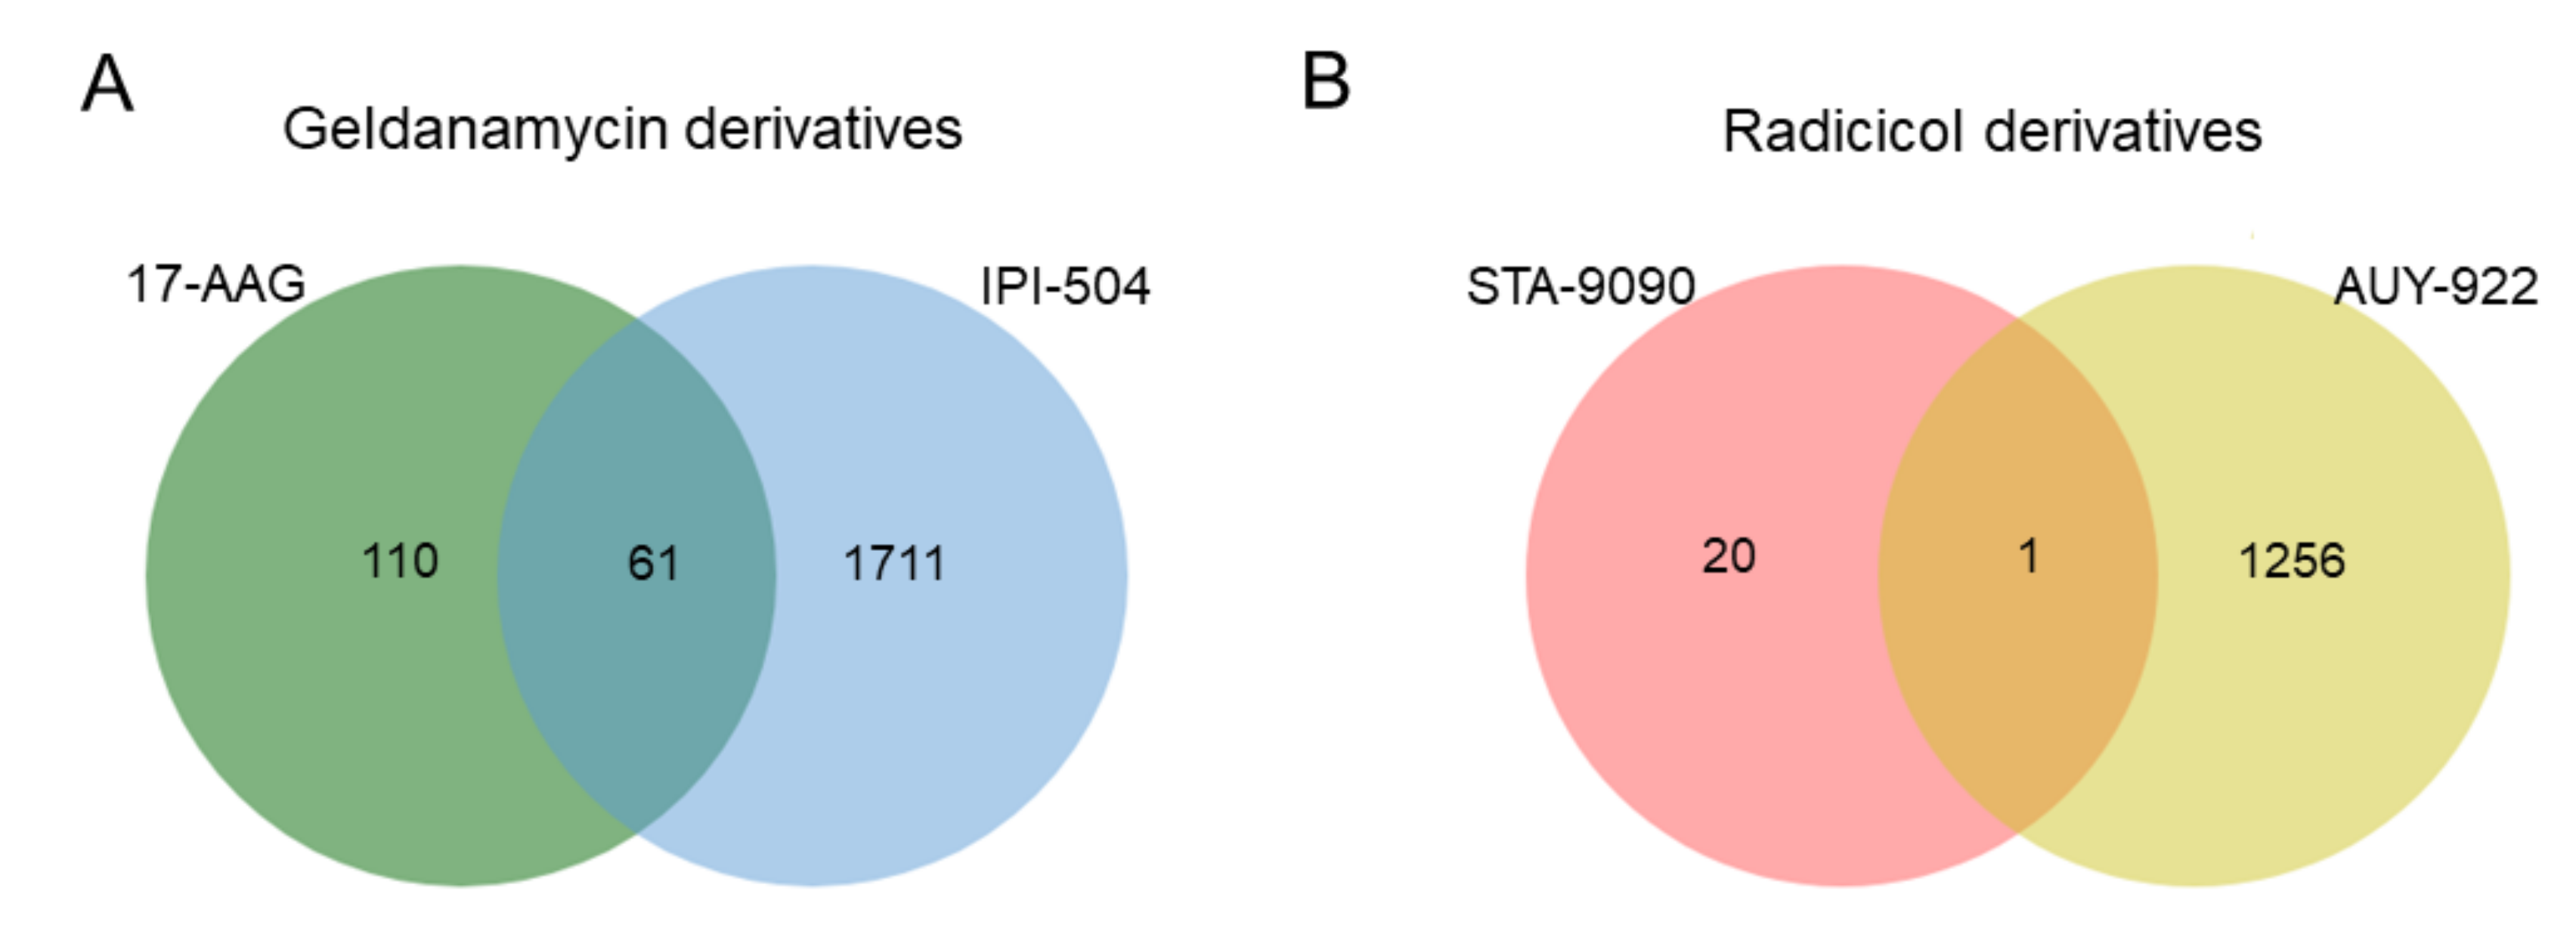
2.3. Detection of Potential Predictive Biomarkers of Resistance to HSP90 Inhibition in Lung Adenocarcinoma Cell Lines

Proteins whose pretreatment expression was significantly correlated with a lack of response to each HSP90 inhibitor family were isolated and depicted in Venn diagram form (Figure 4).
The 61 proteins related to resistance to geldanamycin derivatives (Figure 4A) are presented in Table 3.
Among these proteins, DNA topoisomerase 1 (TOP1) which is involved in the DNA replication pathway, stands out. Figure 5 shows the large number of interactions between these 61 proteins. Interactions between several members of the SWI/SNF family (SWI/SNF complex subunit SMARCC1 (SMARCC1), SWI/SNF complex subunit SMARCC2 (SMARCC2), and SWI/SNF-related matrix-associated actin-dependent regulator of chromatin A5 (SMARCA5)) are noteworthy, along with resistance to these HSP90 inhibitors being related to the WNT signaling pathway. On the other hand, we also found 110 and 1711 proteins specifically expressed in cell lines exhibiting the most resistance to 17-AAG and IPI-504, respectively (Table S4).
With respect to proteins specifically expressed in response to STA-9090 and AUY-922 treatment, we identified 20 and 1256 proteins, respectively. Decaprenyl diphosphate synthase subunit 2 (PDSS2) was the only protein associated with resistance that was common to both inhibitors (Figure 4B and Table S4).

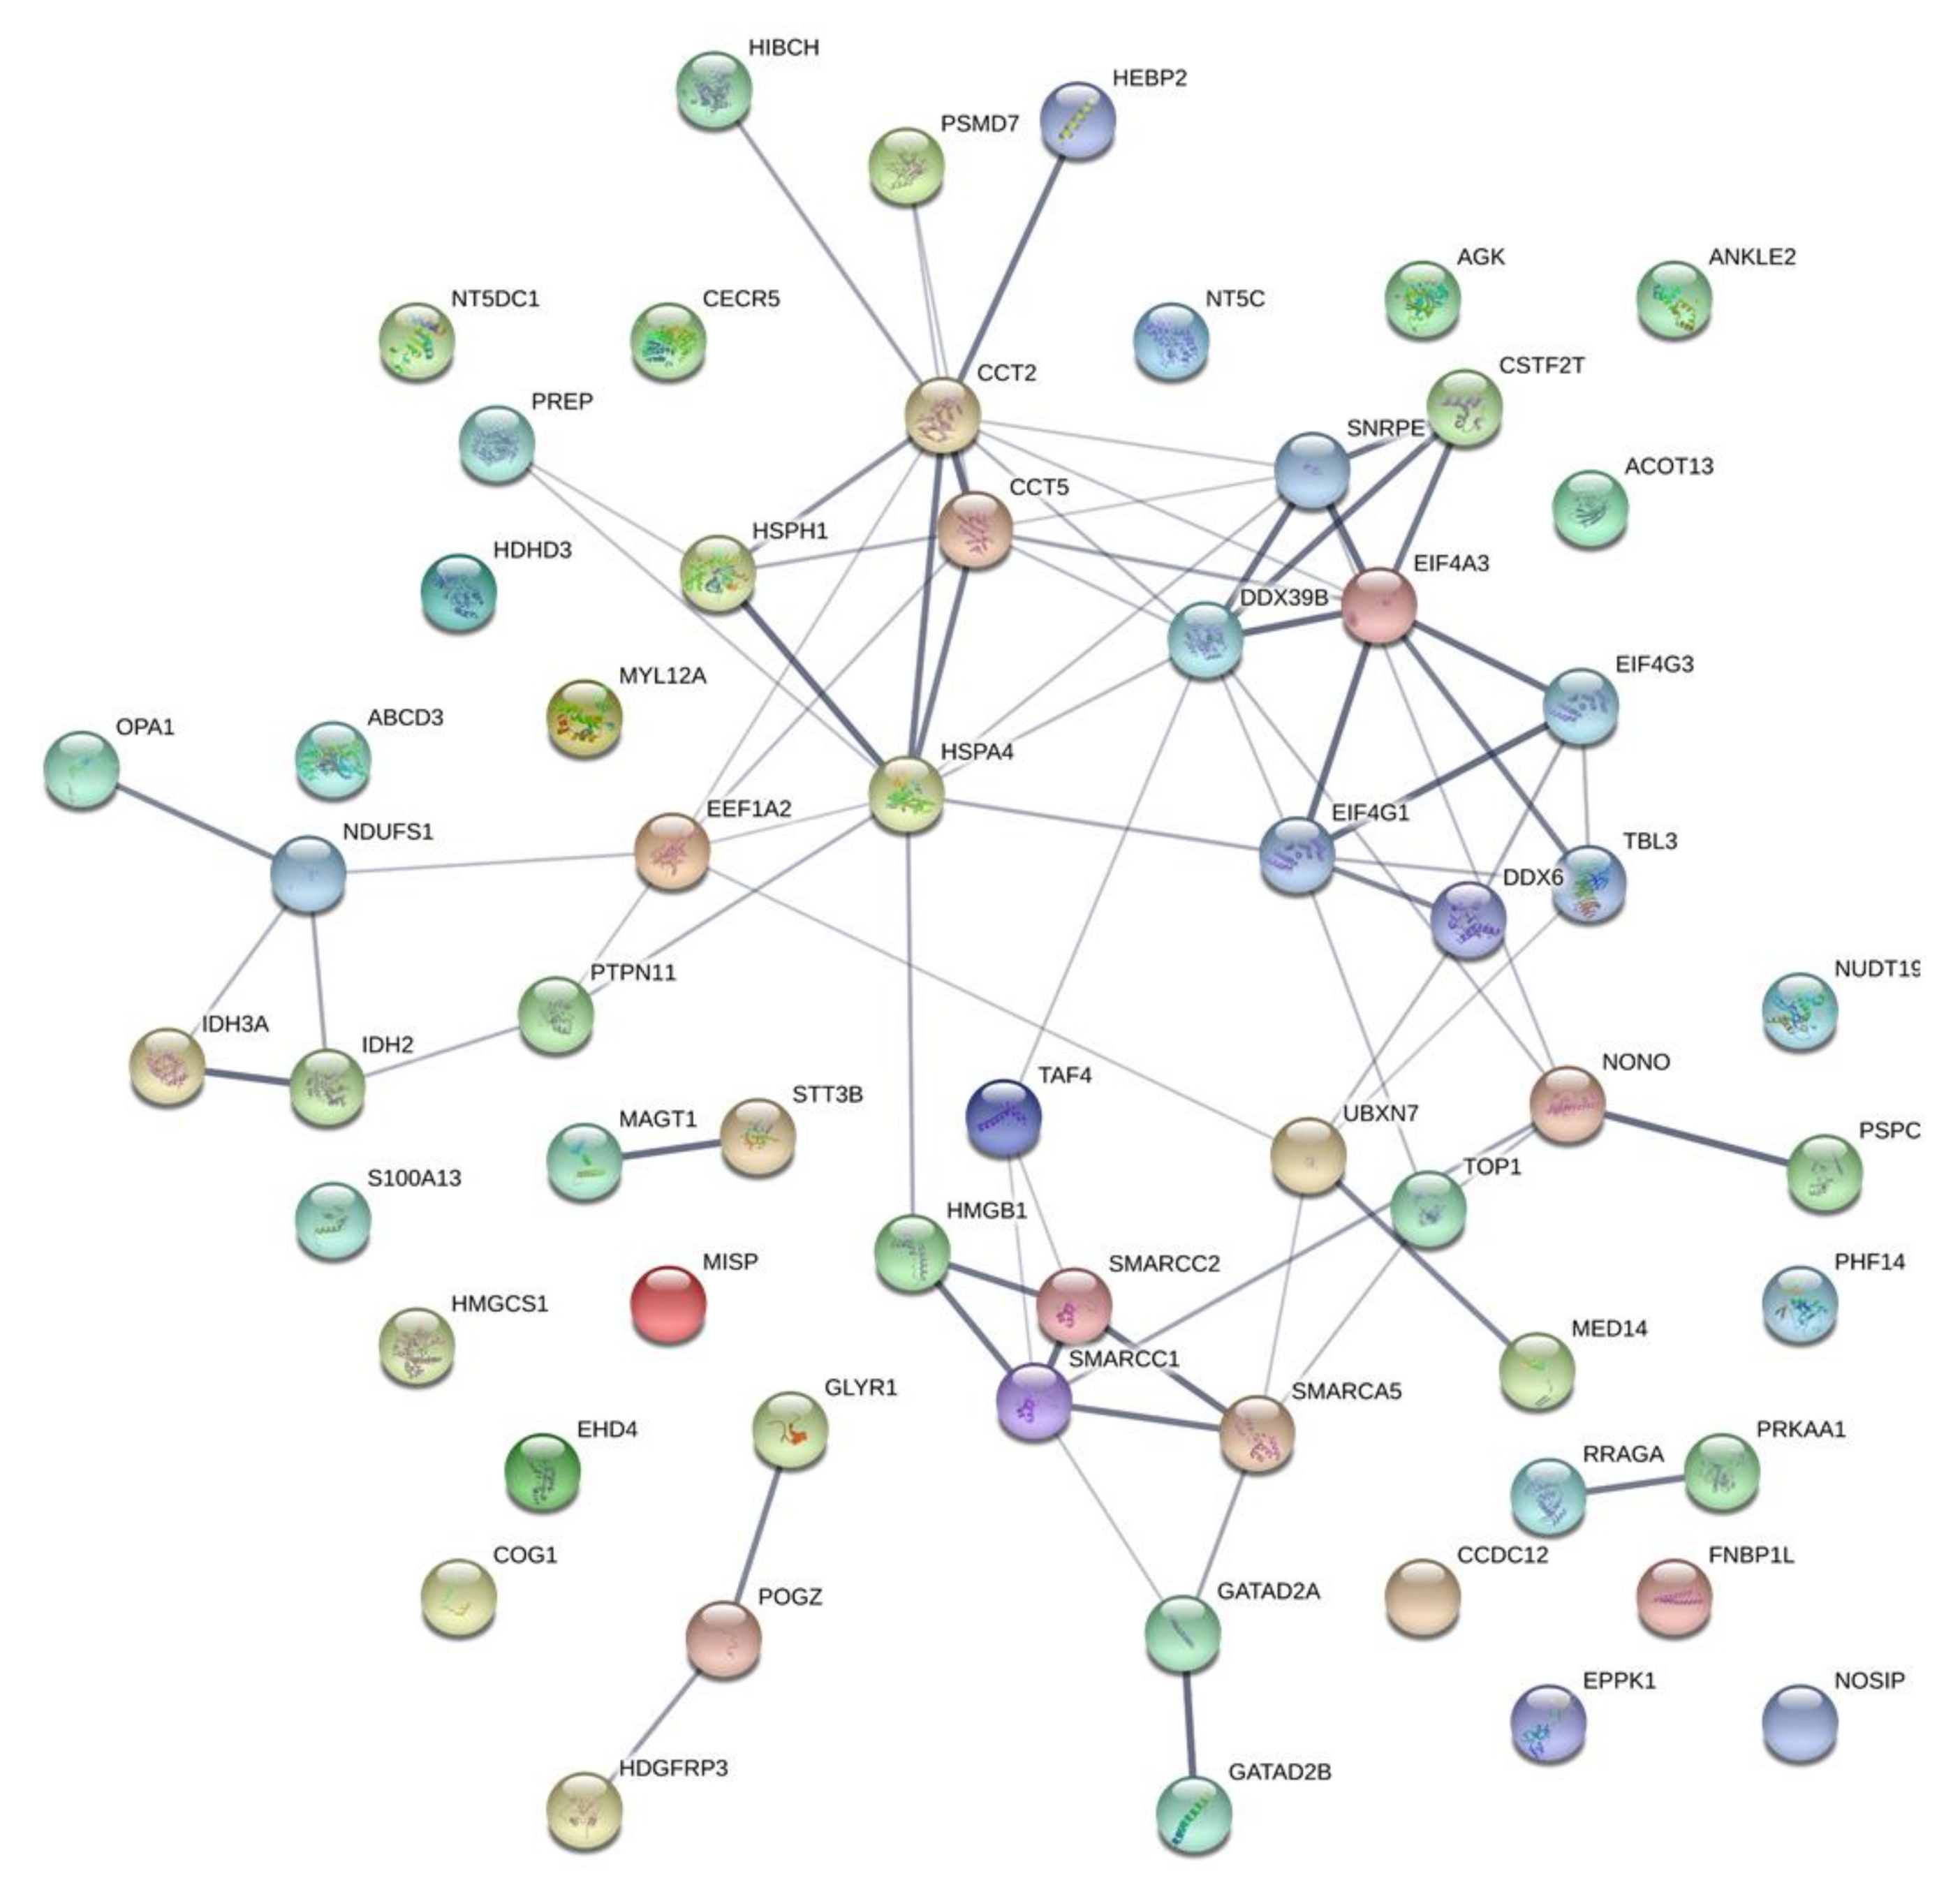
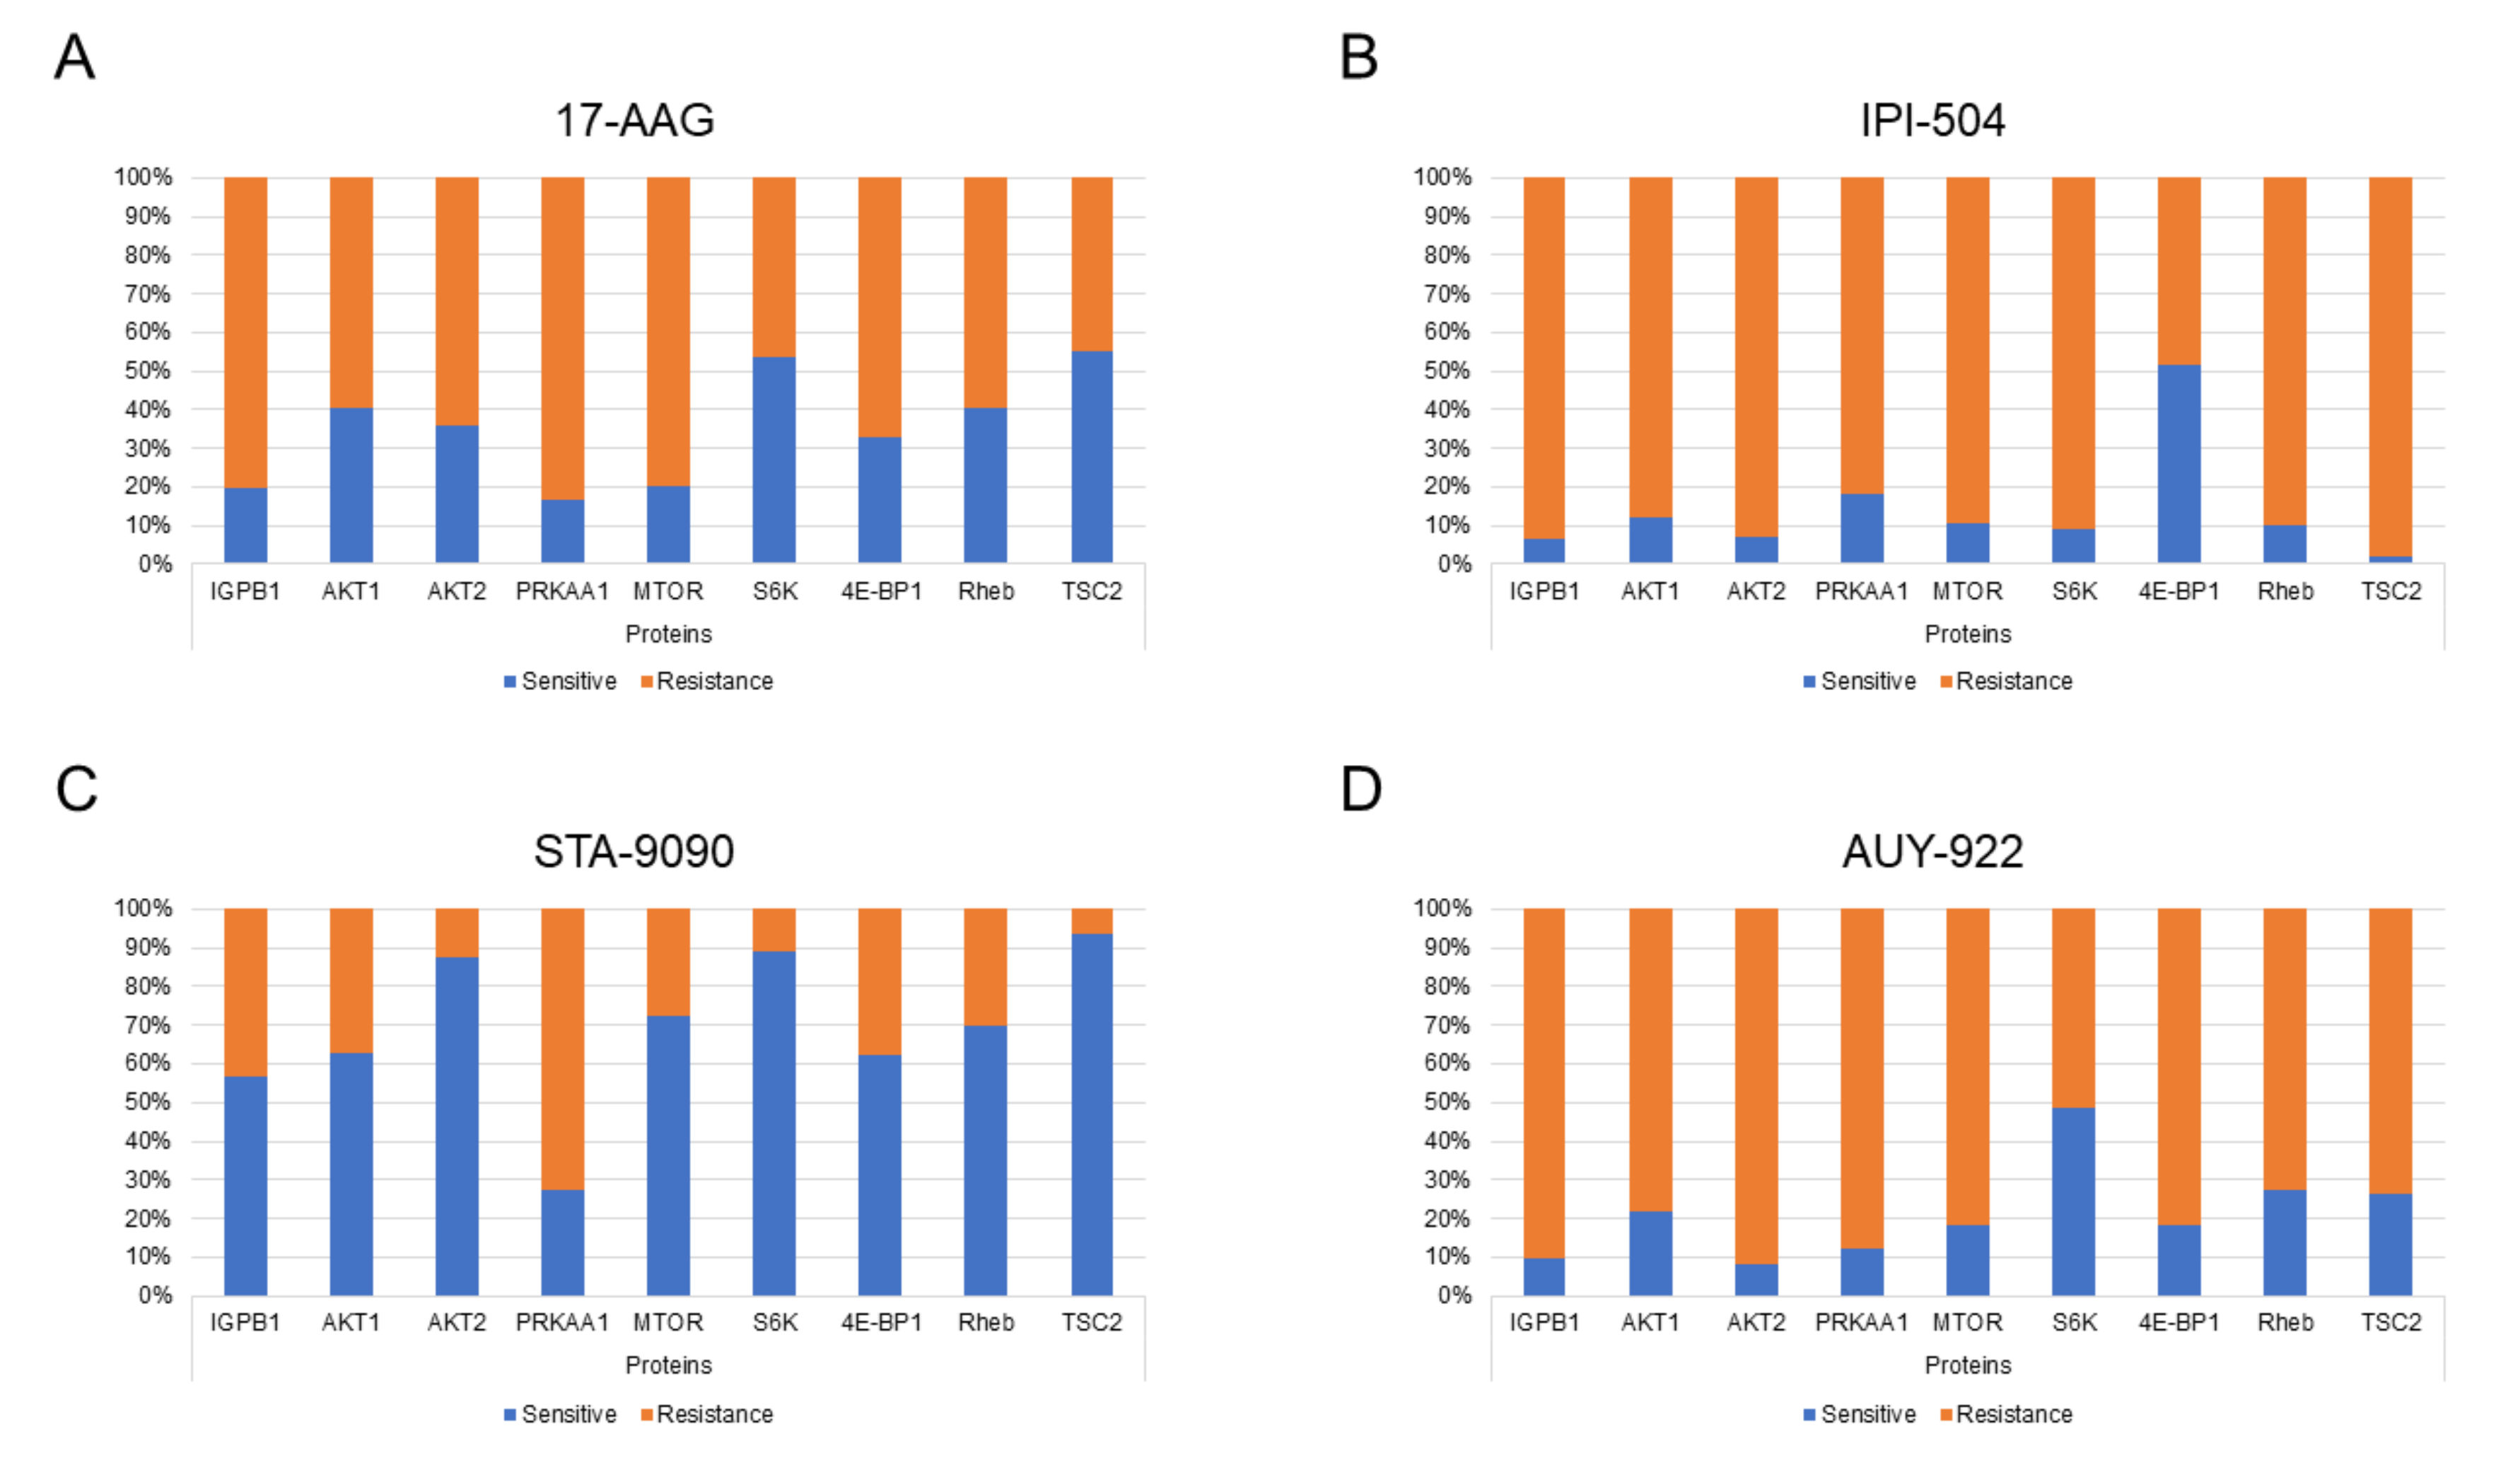
2.4. Candidate Pathways Associated with Susceptibility to HSP90 Inhibition

The PANTHER database was used to perform functional analyses of proteins significantly correlated with responses to HSP90 inhibitors. For a total of 58 biological pathways that were identified, only 6 (arginine biosynthesis, endogenous cannabinoid signaling, GABA-B receptor II signaling, gonadotropin-releasing hormone receptor pathway, opioid proenkephalin pathway, and opioid proopiomelanocortin pathway) were exclusively associated with sensitivity to the studied inhibitors. Interestingly, a greater number of pathways were related to resistance to HSP90 inhibition (Table 4).
Among them, the Toll receptor signaling pathway and the p53 pathway by glucose deprivation are relevant given their importance in tumor growth. Proteins involved in the p53 pathway by glucose deprivation identified in our work were immunoglobulin binding protein 1 (IGBP1), AKT serine/threonine kinase 1 (AKT1), AKT serine/threonine kinase 2 (AKT2), protein kinase AMP-activated catalytic subunit alpha 1 (PRKAA1), mechanistic target of rapamycin kinase (mTOR), ribosomal protein S6 kinase beta-1 (S6K), eukaryotic translation initiation factor 4E-binding protein 1 (4E-BP1), GTP-binding protein Rheb (Rheb), and tuberin (TSC2). Most proteins showed higher basal abundance in HSP90-inhibitor-resistant cell lines than in drug-sensitive ones, with the exception of STA-9090 (Figure 6).

3. Discussion

In this study, we used iTRAQ and mass spectrometry technology to identify proteins that served as predictive biomarkers describing sensitivity or resistance to HSP90 inhibition in lung adenocarcinoma cell lines. To this end, we analyzed the differential expression of specific proteins prior to and after inhibitor treatment and correlated our findings to the roles these proteins may play in signaling pathways involving tumorigenesis. Such an approach should enable us to optimize the manner in which HPS90 is used as a therapeutic target in lung cancer.
Treatment with the radicicol derivatives STA-9090 and AUY-922 revealed a large number of proteins significantly correlated with tumor cell sensitivity; this number was considerably greater than the number of proteins associated with resistance to these drugs. In contrast, more proteins related to resistance to the geldanamycin derivatives 17-AAG and IPI-504 were detected than those related to sensitivity. These data potentially indicate a greater efficacy of HSP90 inhibition through radicicol derivatives in lung adenocarcinoma cell lines and may explain why better clinical results have been achieved in lung cancer patients after treatment with radicicol derivatives [37], the only inhibitor family associated with ongoing clinical trials (NCT02503709 and NCT02535338).
Given differences in clinical results obtained according to the HSP90 inhibitor family used, this study focused on identifying biomarkers associated with the efficacy of geldanamycin and radicicol derivatives. As shown in our results, 12 proteins (AK2, ATP5D, DLGAP5, GPAA1, GNAI3, LDHB, MRPS23, PTBP1/3, PDHX, UFM1, and ZFAND1) were correlated with sensitivity to the geldanamycin analogs 17-AAG and IPI-504. Of these proteins, an association between LDHB and the antitumoral response has been proposed. Moreover, among the different isoenzymes of LDH, two of them—LDHB and LDHA—were reported as deregulated proteins in cancer cells and are involved in the regulation of tumor–stroma nutrient exchange [38]. A relationship between LDHB expression and response to other antitumor therapies, specifically adjuvant chemotherapy in patients with breast cancer, was also previously described [39]. Regarding NSCLC, it is noteworthy that the GALAXY-1 clinical trial showed that patients with high LDH expression responded better to a combination therapy consisting of the HSP90 inhibitor STA-9090 and docetaxel [29]. These data, despite not distinguishing between the A and B isoforms of LDH, together with the demonstrated importance of LDHB for the growth of certain lung adenocarcinomas [40], support the potential of LDHB as a predictive biomarker of the efficacy of geldanamycin derivatives. On the other hand, with respect to proteins related to resistance to the geldanamycin analogs 17-AAG and IPI-504, the presence of TOP1 among the 61 proteins identified was of note. In different tumor types, including lung cancer, a high expression of this important enzyme involved in DNA replication and transcription has been detected when compared to healthy tissue [41]. Furthermore, a low level of TOP1 expression has been proposed as a good prognostic factor related to greater overall survival in postoperative NSCLC patients [42]. These observations are consistent with results obtained in our work, where the TOP1 expression level and the DNA replication pathway in which it is involved are positively correlated with resistance to geldanamycin analogs. Based on this, and since different TOP1 inhibitors are used clinically for the treatment of small-cell lung, ovarian, and cervical cancer [43], their use in combination with 17-AAG or IPI-504 could be an interesting therapeutic strategy to be tested in lung adenocarcinoma patients presenting with high TOP1 expression. Our results also showed that Wnt signaling could be involved in the lack of response to 17-AAG and IPI-504 due to correlations between basal abundances of SMARCC1, SMARCC2, and SMARCA5 and resistance to geldanamycin derivatives. This pathway is involved in NSCLC initiation, progression, and metastasis [44,45]. Therefore, it is not surprising that a higher expression of SMARCC2 has been reported in tissue from NSCLC patients when compared to normal tissue [46]. Furthermore, in line with our data, SMARCC1 was previously described as a potential biomarker of efficacy with cytotoxic chemotherapy [47]. In addition, in bladder cancer, Li et al. observed decreased SMARCC1 expression levels after HSP90 inhibition, supporting our results [48]. Finally, it is worth highlighting that SMARCA5, which is overexpressed in different tumor types [49,50], forms a chromatin-remodeling complex with bromodomain adjacent to zinc finger domain 1B (BAZ1B) that facilitates the access of TOP1 at the replication fork. The overexpression of BAZ1B, and therefore that of SMARCA5, could potentiate the function of TOP1 during DNA replication, affecting the response of cancer cells to TOP1 inhibitors and to other treatments affecting replication [51]. These data might connect the two pathways proposed in this study, relating resistance to 17-AAG and IPI-504 with DNA replication and Wnt signaling. Taken together, further research is required on SMARCC1, SMARCC2, and SMARCA5, together with TOP1, as predictive biomarkers of resistance to geldanamycin derivatives as HSP90 inhibitors in lung adenocarcinoma.
Regarding radicicol derivatives, the relationship between the basal abundance of RTKN and its sensitivity to this family of HSP90 inhibitors is relevant. Among other functions, this Rho GTPase effector [52] is a key regulator of the cytoskeleton in multiple cellular functions, such as migration, adhesion, and cytokinesis [53]. Notably, our work identified cytoskeletal regulation by the Rho GTPases pathway as the only pathway associated with sensitivity to radicicol analogs in the studied lung adenocarcinoma cell lines. To this end, the radicicol derivative AUY-922 was shown to exert a strong antimigratory effect on tumor cells due primarily to reorganization of the cytoskeleton [54]. We, therefore, suggest that cytoskeletal properties and related HSP90 client proteins could be involved in favorable responses to the inhibition of this chaperone. On the other hand, among the proteins related to resistance to STA-9090 and AUY-922 treatments, a subunit of the enzyme decaprenyl diphosphate synthase, decaprenyl diphosphate synthase subunit 2 (PDSS2), plays a critical role in coenzyme Q10 (CoQ10) biosynthesis [55]. Low PDSS2 expression has been reported in different tumor types, including NSCLC, where the role of this protein as a tumor suppressor has been described [56,57]. However, research has demonstrated an association between CoQ10 and the decrease in the effectiveness of different chemotherapeutic agents in cancer cells due to the antioxidant activity of this coenzyme [58]. These observations support our results, where the basal abundance of PDSS2, and therefore CoQ10, was significantly correlated with resistance to radicicol derivatives in lung adenocarcinoma cell lines.
It is important to highlight that several proteins included in the identified protein pattern are involved in the HSP90 interactome [59]. There are unimpeachable pieces of evidence showing that the degradation of these client proteins is fundamental in the response to HSP90 inhibitors [8,24]; however, there is no information about their predictive role. Furthermore, the broad protein network of HSP90 includes not only its clients but also many proteins that, unlike clients, are overexpressed after its inhibition [48]. Nonetheless, due to the crucial role of the HSP90 interactome in the response to its inhibition, it is essential to know which proteins in our profile are clients of this chaperone [1]. Specifically, we found that ATP5D, TUBB2A, TUBB6, 26S proteasome non-ATPase regulatory subunit (7PSMD7), PRKAA1, conserved oligomeric Golgi complex subunit 1 (COG1), and myosin regulatory light chain 12A (MYL12A) are HSP90 client proteins with a potential predictive role of resistance or sensitivity to HSP90 inhibitors. Therefore, changes in these proteins, which are involved in the cytoskeleton, proteasome, ATP synthesis, or p53 pathway by glucose deprivation, among others, could be directly or indirectly affecting the response to the blockade of HSP90. Therefore, it would be essential to study these interesting proteins in depth to know how their basal abundances may be related, in addition to sensitivity or resistance to HSP90 inhibitors, with the response to them.
We also carried out a functional annotation of all proteins whose basal abundance was related to sensitivity or resistance to HSP90 inhibitors. Among all of the pathways correlated with sensitivity to HSP90 inhibition, the role of the arginine biosynthesis pathway is highly relevant, with this amino acid highly implicated in cell proliferation, as previously described [60]. Based on this premise, the potential role of argininosuccinate synthase 1 (ASS1) [61], a key enzyme in arginine biosynthesis and which we identified as a predictor of sensitivity to HSP90 inhibitors in lung adenocarcinoma, warrants attention. Moreover, among the pathways related to resistance to HSP90 inhibitors, we identified the relevance of p53 by glucose deprivation. Our analyses detected a higher basal abundance of nine proteins (IGPB1, AKT1, AKT2, PRKAA1, mTOR, S6K, 4E-BP1, Rheb, and TSC2) involved in the p53 pathway by glucose deprivation in resistant cell lines compared to those sensitive to HSP90 inhibitors. These results found for the majority of inhibitors studied, especially for AUY-922, were significant and in line with those of recent researchers who described this pathway as involved in the induction of cell death by altering multidrug resistance [62,63,64]. However, STA-9090 was the only inhibitor whose lack of response suggests that it must be related to the alteration of another pathway. Therefore, it is important to extend our knowledge and understanding of the proteins involved in this p53 by glucose deprivation pathway given their possible predictive role of response to HPS90 inhibition in lung adenocarcinoma.
Given that our results are based exclusively on in vitro data, the in vivo validation of potential biomarkers and proposed pathways related to the efficacy of HSP90 inhibition in lung adenocarcinoma will be the next important step to translate these findings into clinical practice. However, a limitation to this is the lack of patients undergoing treatment with HSP90 inhibitors, mainly due to the toxicity presented by clinically tested inhibitors and the lack of treatment response in patients with lung adenocarcinoma. The use of the proteins presented in this study as potential predictive biomarkers of response to inhibitors highlights important issues regarding the correct selection of lung adenocarcinoma patients, which would increase the potential benefits of HSP90 inhibition as a therapeutic strategy.

4. Materials and Methods

4.1. Cell Culture

Human lung adenocarcinoma cell lines (HCC827, H1975, H1650, H2009, H358, H2228, Calu-3, H1437, and H1781) were obtained from the American Type Culture Collection (ATCC). Dr. Sánchez and Dr. Koivunen kindly provided the A549 and H3122 cell lines, respectively. Cells were cultured in RPMI-1640 medium (Sigma-Aldrich, Saint Louis, MO, USA), with the exception of A549 and Calu-3 cells, which were propagated in DMEM (Sigma-Aldrich). All cell lines were supplemented with 10% fetal bovine serum (FBS, TICO Europe, Amstelveen, The Netherlands), 1% antibiotic–antimycotic solution (Sigma-Aldrich), and 1% glutamine. Cells were maintained at 37 °C in a humidified incubator under a 5% CO2 and 95% air atmosphere and subcultured every 2–3 days. Cells were authenticated and regularly checked for mycoplasma.

4.2. Cell Viability

Cells in the log phase were plated at 3 × 10³/well in 96-well plates for 24 h. HSP90 inhibitor derivatives of geldanamycin (tanespimycin (17-AAG) (Selleckchem, Munich, Germany) and retaspimycin hydrochloride (IPI-504) (Eurodiagnóstico, Madrid, Spain)) and radicicol derivatives (ganetespib (STA-9090) and luminespib (AUY-922) (Selleckchem, Munich, Germany)) were dissolved in dimethyl sulfoxide (DMSO) as stock solutions according to the manufacturers’ instructions. Cells were then independently treated with HSP90 inhibitors at concentrations ranging from 0.33 nM to 20 µM for 96 h. The half-maximal inhibitory concentration (IC50) for each inhibitor was determined from the dose–response curve. Three independent experiments were performed at each concentration.

4.3. Proteomic Sample Preparation

Each of the cell lines was grown in 10 cm diameter dishes for 24 h. Then, cells were collected, precipitated, and washed with ice-cold PBS. Next, the cells were resuspended in lysis buffer containing 1 M TEAB (triethylammonium bicarbonate, Sigma-Aldrich), 0.05% SDS, 1:100 phosphatase inhibitor cocktail (PhosSTOP EASYpack, Roche, Basel, Switzerland), 1:100 protease inhibitor cocktail (cOmplete Mini EDTA-free, Roche), and 0.002% benzonase (Novagen, Buenos Aires, Argentina) and lysed for 1 h on ice with intermittent vortexing. Cell debris was removed by centrifugation at 14,000 rpm for 15 min at 4 °C. Supernatants were collected, and protein concentrations assayed using Qubit fluorometric quantitation (Life Technologies, Carlsbad, CA, USA). Finally, 100 µg of each sample was aliquoted and stored at –80 °C until required. These lysates were prepared from each cell line and condition.

4.4. Trypsin Digestion and iTRAQ Labeling

The proteins from each sample were reduced with 50 mM TCEP (tris-(2-carboxyethyl)phosphine, AB Sciex) at 60 °C for 1 h with shaking and were subsequently alkylated with 200 mM MMTS (S-methyl methanethiosulfonate, AB Sciex) for 10 min at room temperature. Proteins were then trypsinized at 37 °C in a 10:1 ratio (w/w) of substrate/enzyme (Promega) in a water bath overnight. Finally, a speed-vac concentrator was used for drying the peptides.
The iTRAQ-labeling assay was conducted according to the manufacturer’s instructions (iTRAQ 8-plex, AB Sciex). Briefly, each tryptic digest was reconstituted in 1 M TEAB and labeled with one isobaric amine-reactive tag, with 113 being the focus in the present work. After 2 h of incubation, labeled samples were pooled, dried at 45 °C, and stored overnight at 4 °C.

4.5. Cleaning and Fractionation

iTRAQ-labeled samples were desalted using Oasis HLB C18 cartridges (Waters, Milford, MA, USA) and dried using a vacuum centrifuge. Peptides were then prefractionated using MCX Oasis columns (Waters) and increasing concentrations (50, 100, 200, 300, 400, 500, 600, 700, 800, and 900 mM and 1, 1.5, and 2 M) of ammonium formate. A total of 13 fractions were collected and individually washed using C18 cartridges, after which they were dried.

4.6. NanoLC-MS/MS Analysis

Peptides from each fraction were separated using nano-liquid chromatography (nano LC 1000, Thermo Scientific) and analyzed by means of nano-electrospray ionization (Proxeon Biosystems, Odense, Denmark) connected to a Q Exactive Plus Orbitrap mass spectrometer (Thermo Scientific). Briefly, 13 µL of each fraction was loaded, preconcentrated, and washed in an Acclaim PepMap (75 µm × 2 cm, nanoViper, C18, 3 µm, 100 Å) precolumn (Thermo Scientific). Peptides were separated in an analytical column (75 µm × 15 cm, nanoViper, C18, 2 µm, 100 Å (Acclaim PepMap RSLC)) (Thermo Scientific) for 240 min at 200 nL/min.
Peptides were eluted with a gradient of buffer A (0.1% formic acid, 100% H2O) to buffer B (0.1% formic acid, 100% acetonitrile) as follows: 0–220 min, 0–35% buffer B; 220–230 min, 35–45% buffer B; and 230–240 min, 45–95% buffer B. The Q Exactive system was used for MS/MS analysis in the positive ion and information-dependent acquisition modes. Mass spectra were acquired over a scan range of 200 to 1800 m/z with a resolution of 70,000 FWHM from m/z 100. Up to 15 precursors with a charge state ≥2 were selected and incorporated into an exclusion list for 60 s. Peptide identification and quantification were carried out considering the higher-energy collisional dissociation (HCD) spectrum. HCD fragmentation was performed with a collision energy of 32% to maximize the abundance of iTRAQ reporter ions.

4.7. Protein Identification and Quantification

Peptide identification and quantification were conducted using the Sequest HT search engine and Percolator, both of which were included in Proteome Discoverer 1.4 software (Thermo Fisher Scientific). Each MS/MS spectrum was searched against the UniProt Database for Homo sapiens. The parameter considered for the search was digestion enzyme (trypsin); iTRAQ 8-plex peptide label (N-terminal) and iTRAQ 8-plex peptide label (lysine) were used as fixed modifications, and the oxidation of methionine and carbamidomethylation of cysteine were selected as variable modifications. Subsequently, the relative peptide abundances were determined using the MS/MS scans of iTRAQ-labeled peptides, where the ratios of peak areas of the iTRAQ reporter ions reflect the relative abundances of the peptides and therefore of proteins in the samples. Proteins had to contain at least two unique peptides with a significance score ≥95%, a ratio with a p-value ≤ 0.05, and a false discovery rate (FDR) <2 to be considered quantifiable.

4.8. Data Analysis

To identify potential predictive proteins related to sensitivity or resistance to HSP90 inhibitors, we analyzed the proteomic signature in human lung adenocarcinoma cells prior to treatment and correlated this with the efficacy of the response to treatment. The sum of the intensities of the peptides identified in the control group labeled with 113 was employed to calculate the basal abundances of proteins in the pretreated cell lines. On the other hand, those proteins commonly identified in the three cell lines most sensitive or resistant to each HSP90 inhibitor were selected. Then, for each of these proteins of interest, the Spearman coefficient was employed to test for a potential correlation between the basal abundance and the IC50 value of each inhibitor in all of the cell lines where these proteins were identified. Only proteins with a significant correlation (p-value < 0.05) were used in the subsequent analysis.
Sensitivity- or resistance-related proteins found in common for each HSP90 inhibitor family were grouped in Venn–Euler diagrams using the jvenn (http://jvenn.toulouse.inra.fr/app/index.html) program. Next, proteins of interest were functionally analyzed and categorized according to their biological processes and molecular functions using the PANTHER (Protein ANalysis THrough Evolutionary Relationships) online database (http://pantherdb.org/ accessed on May 2020). Finally, known and predicted protein–protein interaction networks of proteins were built based on the publicly available Search Tool for the Retrieval of Interacting Genes/Proteins (STRING) database (https://string-db.org/ accessed on May 2020). Only results with a Benjamini–Hochberg adjusted p-value of less than 0.05 were considered statistically significant.

5. Conclusions

We analyzed proteins whose basal abundances were correlated with response to HSP90 inhibitors in a panel of lung adenocarcinoma cell lines using iTRAQ-based assays. A total of 3219 proteins were associated with sensitivity to treatment with HSP90 inhibitors, and 3384 proteins were associated with resistance to treatment with HSP90 inhibitors. It is relevant to highlight that among all the proteins identified in our predictive profile, seven of them are HSP90 client proteins, which could be indicating an ensured effect of inhibition. In addition, we found specific differences according to the two families of inhibitors used; this was highlighted by the roles of LDHB and TOP1 proteins in sensitivity and resistance to geldanamycin analogs, respectively. In the case of radicicol derivatives, RTKN was correlated with sensitivity to these treatments, and PDSS2 was correlated with resistance to these treatments. In addition, functional annotation analyses of identified proteins revealed that the p53 pathway by glucose deprivation and arginine biosynthesis were correlated with resistance and sensitivity to HSP90 inhibitors, respectively. A thorough in vivo validation of our findings is required for future clinical use of these inhibitors to treat human lung adenocarcinoma.

Supplementary Materials

Supplementary materials can be found at https://0-www-mdpi-com.brum.beds.ac.uk/1422-0067/22/5/2538/s1. Table S1. Proteins identified in human cell lines from lung adenocarcinoma with the highest sensitivity to each geldanamycin derivative, Table S2. Protein profile associated with sensitivity to both geldanamycin derivatives in lung adenocarcinoma, Table S3. Proteins related to sensitivity to radicicol analogs in lung adenocarcinoma, Table S4. Proteins specifically expressed in lung adenocarcinoma cell lines with the highest resistance to 17-AAG and IPI-504.

Author Contributions

Conceptualization Á.M., S.M.-P., and L.P.-A.; methodology, Á.M., M.D.P., D.G.-S., I.F., S.M.-P., L.O., and Á.Q.-V.; investigation, Á.M., L.P.-A., and S.M.-P.; formal analysis, Á.M., D.G.-S., and S.M.-P.; writing—original draft preparation, Á.M., S.M.-P., and L.P.-A.; writing—review and editing, Á.M., I.F., D.G.-S., M.D.P., L.O., Á.Q.-V., S.M.-P., and L.P.-A.; supervision, S.M.-P. and L.P.-A.; funding acquisition L.P.-A. All authors have read and agreed to the published version of the manuscript.

Funding

L.P.A. was funded by the Comunidad de Madrid, CAM, (B2017/BMD3884), ISCIII (PIE15/00076, PI17/00778 and DTS17/00089), and CIBERONC (CB16/12/00442), and co-funded by FEDER from Regional Development European Funds (European Union). S.M.P. was funded by the Fundación Mutua Madrileña (2014), Ministry of Health and Social Welfare of the Junta de Andalucía (Nicolas Monardes Program RC-0004-2020 and OH-0022-2018), ISCIII (PI17/00033 and PI20/01109), and co-funded by European Regional Development Fund “A way to make Europe” I.F. was funded by the AECC (AIO2015) and ISCIII (PI16/01311) and co-funded by FEDER from Regional Development European Funds (European Union).

Institutional Review Board Statement

Not applicable.

Informed Consent Statement

Not applicable.

Data Availability Statement

Not applicable.

Conflicts of Interest

The authors declare no conflict of interest.

Abbreviations

17-AAGTanespimycin
7PSMD726S proteasome non-ATPase regulatory subunit
4E-BP1Eukaryotic translation initiation factor 4E-binding protein 1
AK2Adenylate kinase 2
AKT1AKT serine/threonine kinase 1
AKT2AKT serine/threonine kinase 2
ALKAnaplastic lymphoma kinase
ATP5DATP synthase subunit delta
AUY-922Luminespib
BRAFB-Raf proto-oncogene: serine/threonine kinase
COG1Conserved oligomeric Golgi complex subunit 1
DLGAP5Disks large-associated protein 5
EGFREpidermal growth factor receptor
EIF3IEukaryotic translation initiation factor 3 subunit I
EML4Echinoderm microtubule-associated protein-like
ERBB2Erb-B2 receptor tyrosine kinase 2
GNAI3Guanine nucleotide-binding protein G(k) subunit alpha
GPAA1Glycosylphosphatidylinositol anchor attachment 1 protein
HSPHeat shock protein
HSP90Heat shock protein 90
IGBP1Immunoglobulin binding protein 1
IPI-504Retaspimycin hydrochloride
LDHBLactate dehydrogenase B
METMET proto-oncogene, receptor tyrosine kinase
MYL12AMyosin regulatory light chain 12A
MRPS23Mitochondrial ribosomal protein S23
mTORMechanistic target of rapamycin kinase
NSCLCNon-small-cell lung cancer
PDHXPyruvate dehydrogenase protein X component
PDSS2Decaprenyl diphosphate synthase subunit 2
PRKAA1Protein kinase AMP-activated catalytic subunit alpha 1
PTBP1Polypyrimidine tract-binding protein 1
PTBP3Polypyrimidine tract-binding protein 3
RhebGTP-binding protein Rheb
RTKNRhotekin
S6KRibosomal protein S6 kinase beta-1
STA-9090Ganetespib
TOP1DNA topoisomerase 1
TSC2Tuberin
TUBB2ATubulin beta-2A chain
TUBB6Tubulin beta-6 chain
UFM1Ubiquitin-fold modifier 1
ZFAND1Zinc finger AN1-type containing 1

References

  1. Hoter, A.; EI-Sabban, M.E.; Naim, H.Y. The HSP90 Family: Structure, Regulation, Function, and Implications in Health and Disease. Int. J. Mol. Sci. 2018, 19, 2560. [Google Scholar] [CrossRef] [PubMed] [Green Version]
  2. Echeverria, P.C.; Bernthaler, A.; Dupuis, P.; Mayer, B.; Picard, D. An interaction network predicted from public data as a discovery tool: Application to the Hsp90 molecular chaperone machine. PLoS ONE 2011, 6, e26044. [Google Scholar] [CrossRef]
  3. Tatokoro, M.; Koga, F.; Yoshida, S.; Kihara, K. Heat shock protein 90 targeting therapy: State of the art and future perspective. Excli J. 2015, 14, 48–58. [Google Scholar]
  4. Hanahan, D.; Weinberg, R.A. Hallmarks of cancer: The next generation. Cell 2011, 144, 646–674. [Google Scholar] [CrossRef] [Green Version]
  5. Whitesell, L.; Lindquist, S.L. HSP90 and the chaperoning of cancer. Nat. Rev. Cancer 2005, 5, 761–772. [Google Scholar] [CrossRef]
  6. Butler, L.M.; Ferraldeschi, R.; Armstrong, H.K.; Centenera, M.M.; Workman, P. Maximizing the Therapeutic Potential of HSP90 Inhibitors. Mol. Cancer Res. 2015, 13, 1445–1451. [Google Scholar] [CrossRef] [PubMed] [Green Version]
  7. Workman, P.; Burrows, F.; Neckers, L.; Rosen, N. Drugging the cancer chaperone HSP90: Combinatorial therapeutic exploitation of oncogene addiction and tumor stress. Ann. N. Y. Acad. Sci. 2007, 1113, 202–216. [Google Scholar] [CrossRef] [PubMed]
  8. Neckers, L.; Workman, P. Hsp90 molecular chaperone inhibitors: Are we there yet? Clin. Cancer Res. 2012, 18, 64–76. [Google Scholar] [CrossRef] [PubMed] [Green Version]
  9. Bray, F.; Ferlay, J.; Soerjomataram, I.; Siegel, R.L.; Torre, L.A.; Jemal, A. Global cancer statistics 2018: GLOBOCAN estimates of incidence and mortality worldwide for 36 cancers in 185 countries. CA Cancer J. Clin. 2018, 68, 394–424. [Google Scholar] [CrossRef] [Green Version]
  10. Shimamura, T.; Lowell, A.M.; Engelman, J.A.; Shapiro, G.I. Epidermal growth factor receptors harboring kinase domain mutations associate with the heat shock protein 90 chaperone and are destabilized following exposure to geldanamycins. Cancer Res. 2005, 65, 6401–6408. [Google Scholar] [CrossRef] [PubMed] [Green Version]
  11. Xu, W.; Soga, S.; Beebe, K.; Lee, M.J.; Kim, Y.S.; Trepel, J.; Neckers, L. Sensitivity of epidermal growth factor receptor and ErbB2 exon 20 insertion mutants to Hsp90 inhibition. Br. J. Cancer 2007, 97, 741–744. [Google Scholar] [CrossRef]
  12. Wang, S.; Pashtan, I.; Tsutsumi, S.; Xu, W.; Neckers, L. Cancer cells harboring MET gene amplification activate alternative signaling pathways to escape MET inhibition but remain sensitive to Hsp90 inhibitors. Cell Cycle 2009, 8, 2050–2056. [Google Scholar] [CrossRef] [PubMed] [Green Version]
  13. Da Rocha Dias, S.; Friedlos, F.; Light, Y.; Springer, C.; Workman, P.; Marais, R. Activated B-RAF is an Hsp90 client protein that is targeted by the anticancer drug 17-allylamino-17-demethoxygeldanamycin. Cancer Res. 2005, 65, 10686–10691. [Google Scholar] [CrossRef] [PubMed] [Green Version]
  14. Normant, E.; Paez, G.; West, K.A.; Lim, A.R.; Slocum, K.L.; Tunkey, C.; McDougall, J.; Wylie, A.A.; Robison, K.; Caliri, K.; et al. The Hsp90 inhibitor IPI-504 rapidly lowers EML4-ALK levels and induces tumor regression in ALK-driven NSCLC models. Oncogene 2011, 30, 2581–2586. [Google Scholar] [CrossRef] [Green Version]
  15. Esfahani, K.; Cohen, V. HSP90 as a novel molecular target in non-small-cell lung cancer. Lung Cancer (Auckl.) 2016, 7, 11–17. [Google Scholar] [PubMed] [Green Version]
  16. Gallegos Ruiz, M.I.; Floor, K.; Roepman, P.; Rodriguez, J.A.; Meijer, G.A.; Mooi, W.J.; Jassem, E.; Niklinski, J.; Muley, T.; van Zandwijk, N.; et al. Integration of gene dosage and gene expression in non-small cell lung cancer, identification of HSP90 as potential target. PLoS ONE 2008, 3, e0001722. [Google Scholar] [CrossRef] [PubMed]
  17. Hendriks, L.E.L.; Dingemans, A.C. Heat shock protein antagonists in early stage clinical trials for NSCLC. Expert. Opin. Investig. Drugs 2017, 26, 541–550. [Google Scholar] [CrossRef]
  18. Proia, D.A.; Sang, J.; He, S.; Smith, D.L.; Sequeira, M.; Zhang, C.; Liu, Y.; Ye, S.; Zhou, D.; Blackman, R.K.; et al. Synergistic activity of the Hsp90 inhibitor ganetespib with taxanes in non-small cell lung cancer models. Invest. New Drugs 2012, 30, 2201–2209. [Google Scholar] [CrossRef] [PubMed] [Green Version]
  19. Wang, Y.; Liu, H.; Diao, L.; Potter, A.; Zhang, J.; Qiao, Y.; Wang, J.; Proia, D.A.; Tailor, R.; Komaki, R.; et al. Hsp90 Inhibitor Ganetespib Sensitizes Non-Small Cell Lung Cancer to Radiation but Has Variable Effects with Chemoradiation. Clin. Cancer Res. 2016, 22, 5876–5886. [Google Scholar] [CrossRef] [Green Version]
  20. Smith, D.L.; Acquaviva, J.; Sequeira, M.; Jimenez, J.P.; Zhang, C.; Sang, J.; Bates, R.C.; Proia, D.A. The HSP90 inhibitor ganetespib potentiates the antitumor activity of EGFR tyrosine kinase inhibition in mutant and wild-type non-small cell lung cancer. Target. Oncol. 2015, 10, 235–245. [Google Scholar] [CrossRef] [Green Version]
  21. Sang, J.; Acquaviva, J.; Friedland, J.C.; Smith, D.L.; Sequeira, M.; Zhang, C.; Jiang, Q.; Xue, L.; Lovly, C.M.; Jimenez, J.P.; et al. Targeted inhibition of the molecular chaperone Hsp90 overcomes ALK inhibitor resistance in non-small cell lung cancer. Cancer Discov. 2013, 3, 430–443. [Google Scholar] [CrossRef] [PubMed] [Green Version]
  22. Akram, A.; Khalil, S.; Halim, S.A.; Younas, H.; Iqbal, S.; Mehar, S. Therapeutic Uses of HSP90 Inhibitors in Non-Small Cell Lung Carcinoma (NSCLC). Curr. Drug. Metab. 2018, 19, 335–341. [Google Scholar] [CrossRef] [PubMed]
  23. Prodromou, C.; Roe, S.M.; O’Brien, R.; Ladbury, J.E.; Piper, P.W.; Pearl, L.H. Identification and structural characterization of the ATP/ADP-binding site in the Hsp90 molecular chaperone. Cell 1997, 90, 65–75. [Google Scholar] [CrossRef] [Green Version]
  24. Ehrlich, E.S.; Wang, T.; Luo, K.; Xiao, Z.; Niewiadomska, A.M.; Martinez, T.; Xu, W.; Neckers, L.; Yu, X.F. Regulation of Hsp90 client proteins by a Cullin5-RING E3 ubiquitin ligase. Proc. Natl. Acad. Sci. USA 2009, 106, 20330–20335. [Google Scholar] [CrossRef] [Green Version]
  25. Sequist, L.V.; Gettinger, S.; Senzer, N.N.; Martins, R.G.; Janne, P.A.; Lilenbaum, R.; Gray, J.E.; Iafrate, A.J.; Katayama, R.; Hafeez, N.; et al. Activity of IPI-504, a novel heat-shock protein 90 inhibitor, in patients with molecularly defined non-small-cell lung cancer. J. Clin. Oncol. 2010, 28, 4953–4960. [Google Scholar] [CrossRef] [PubMed]
  26. Sessa, C.; Shapiro, G.I.; Bhalla, K.N.; Britten, C.; Jacks, K.S.; Mita, M.; Papadimitrakopoulou, V.; Pluard, T.; Samuel, T.A.; Akimov, M.; et al. First-in-human phase I dose-escalation study of the HSP90 inhibitor AUY922 in patients with advanced solid tumors. Clin. Cancer Res. 2013, 19, 3671–3680. [Google Scholar] [CrossRef] [Green Version]
  27. Felip, E.; Barlesi, F.; Besse, B.; Chu, Q.; Gandhi, L.; Kim, S.W.; Carcereny, E.; Sequist, L.V.; Brunsvig, P.; Chouaid, C.; et al. Phase 2 Study of the HSP-90 Inhibitor AUY922 in Previously Treated and Molecularly Defined Patients with Advanced Non-Small Cell Lung Cancer. J. Thorac. Oncol. 2018, 13, 576–584. [Google Scholar] [CrossRef] [PubMed] [Green Version]
  28. Johnson, M.L.; Yu, H.A.; Hart, E.M.; Weitner, B.B.; Rademaker, A.W.; Patel, J.D.; Kris, M.G.; Riely, G.J. Phase I/II Study of HSP90 Inhibitor AUY922 and Erlotinib for EGFR-Mutant Lung Cancer With Acquired Resistance to Epidermal Growth Factor Receptor Tyrosine Kinase Inhibitors. J. Clin. Oncol. 2015, 33, 1666–1673. [Google Scholar] [CrossRef] [PubMed] [Green Version]
  29. Ramalingam, S.; Goss, G.; Rosell, R.; Schmid-Bindert, G.; Zaric, B.; Andric, Z.; Bondarenko, I.; Komov, D.; Ceric, T.; Khuri, F.; et al. A randomized phase II study of ganetespib, a heat shock protein 90 inhibitor, in combination with docetaxel in second-line therapy of advanced non-small cell lung cancer (GALAXY-1). Ann. Oncol. 2015, 26, 1741–1748. [Google Scholar] [CrossRef]
  30. Pillai, R.N.; Fennell, D.A.; Kovcin, V.; Ciuleanu, T.E.; Ramlau, R.; Kowalski, D.; Schenker, M.; Yalcin, I.; Teofilovici, F.; Vukovic, V.M.; et al. Randomized Phase III Study of Ganetespib, a Heat Shock Protein 90 Inhibitor, With Docetaxel Versus Docetaxel in Advanced Non-Small-Cell Lung Cancer (GALAXY-2). J. Clin. Oncol. 2020, 38, 613–622. [Google Scholar] [CrossRef]
  31. Socinski, M.A.; Goldman, J.; El-Hariry, I.; Koczywas, M.; Vukovic, V.; Horn, L.; Paschold, E.; Salgia, R.; West, H.; Sequist, L.V.; et al. A multicenter phase II study of ganetespib monotherapy in patients with genotypically defined advanced non-small cell lung cancer. Clin. Cancer Res. 2013, 19, 3068–3077. [Google Scholar] [CrossRef] [Green Version]
  32. Rong, B.; Yang, S. Molecular mechanism and targeted therapy of Hsp90 involved in lung cancer: New discoveries and developments (Review). Int. J. Oncol. 2018, 52, 321–336. [Google Scholar] [CrossRef]
  33. Voruganti, S.; Kline, J.T.; Balch, M.J.; Rogers, J.; Matts, R.L.; Hartson, S.D. Proteomic Profiling of Hsp90 Inhibitors. Methods Mol. Biol. 2018, 1709, 139–162. [Google Scholar]
  34. Zimmer, A.; Amar-Farkash, S.; Danon, T.; Alon, U. Dynamic proteomics reveals bimodal protein dynamics of cancer cells in response to HSP90 inhibitor. BMC Syst. Biol. 2017, 11, 33. [Google Scholar] [CrossRef] [PubMed] [Green Version]
  35. Marrugal, Á.; Ferrer, I.; Pastor, M.D.; Ojeda, L.; Quintanal-Villalonga, Á.; Carnero, A.; Molina-Pinelo, S.; Paz-Ares, L. Impact of Heat Shock Protein 90 Inhibition on the Proteomic Profile of Lung Adenocarcinoma as Measured by Two-Dimensional Electrophoresis Coupled with Mass Spectrometry. Cells 2019, 8, 806. [Google Scholar] [CrossRef] [PubMed] [Green Version]
  36. Weidenauer, L.; Wang, T.; Joshi, S.; Chiosis, G.; Quadroni, M.R. Proteomic interrogation of HSP90 and insights for medical research. Expert Rev. Proteomics 2017, 14, 1105–1117. [Google Scholar] [CrossRef] [PubMed]
  37. Chatterjee, S.; Bhattacharya, S.; Socinski, M.A.; Burns, T.F. HSP90 inhibitors in lung cancer: Promise still unfulfilled. Clin. Adv. Hematol. Oncol. 2016, 14, 346–356. [Google Scholar]
  38. Mishra, D.; Banerjee, D. Lactate Dehydrogenases as Metabolic Links between Tumor and Stroma in the Tumor Microenvironment. Cancers (Basel) 2019, 11, 750. [Google Scholar] [CrossRef] [PubMed] [Green Version]
  39. Dennison, J.B.; Molina, J.R.; Mitra, S.; Gonzalez-Angulo, A.M.; Balko, J.M.; Kuba, M.G.; Sanders, M.E.; Pinto, J.A.; Gomez, H.L.; Arteaga, C.L.; et al. Lactate dehydrogenase B: A metabolic marker of response to neoadjuvant chemotherapy in breast cancer. Clin. Cancer Res. 2013, 19, 3703–3713. [Google Scholar] [CrossRef] [PubMed] [Green Version]
  40. McCleland, M.L.; Adler, A.S.; Deming, L.; Cosino, E.; Lee, L.; Blackwood, E.M.; Solon, M.; Tao, J.; Li, L.; Shames, D.; et al. Lactate dehydrogenase B is required for the growth of KRAS-dependent lung adenocarcinomas. Clin. Cancer Res. 2013, 19, 773–784. [Google Scholar] [CrossRef] [Green Version]
  41. Hou, G.X.; Liu, P.; Yang, J.; Wen, S. Mining expression and prognosis of topoisomerase isoforms in non-small-cell lung cancer by using Oncomine and Kaplan-Meier plotter. PLoS ONE 2017, 12, e0174515. [Google Scholar] [CrossRef] [PubMed] [Green Version]
  42. Lu, B.; Zhang, H.; Zhang, T.; Cai, Y.; Hu, Y.; Zheng, H.; Li, B. Topoisomerase I expression is associated with prognosis in postoperative non-small cell lung cancer patients. Thorac. Cancer 2016, 7, 486–494. [Google Scholar] [CrossRef] [PubMed] [Green Version]
  43. Riedlinger, T.; Bartkuhn, M.; Zimmermann, T.; Hake, S.B.; Nist, A.; Stiewe, T.; Kracht, M.; Schmitz, M.L. Chemotherapeutic Drugs Inhibiting Topoisomerase 1 Activity Impede Cytokine-Induced and NF-kappaB p65-Regulated Gene Expression. Cancers (Basel) 2019, 11, 883. [Google Scholar] [CrossRef] [PubMed] [Green Version]
  44. Serman, L.; Nikuseva Martic, T.; Serman, A.; Vranic, S. Epigenetic alterations of the Wnt signaling pathway in cancer: A mini review. Bosn. J. Basic Med. Sci. 2014, 14, 191–194. [Google Scholar] [CrossRef] [PubMed] [Green Version]
  45. Chen, X.; Song, X.; Yue, W.; Chen, D.; Yu, J.; Yao, Z.; Zhang, L. Fibulin-5 inhibits Wnt/beta-catenin signaling in lung cancer. Oncotarget 2015, 6, 15022–15034. [Google Scholar] [CrossRef] [PubMed] [Green Version]
  46. Remmelink, M.; Mijatovic, T.; Gustin, A.; Mathieu, A.; Rombaut, K.; Kiss, R.; Salmon, I.; Decaestecker, C. Identification by means of cDNA microarray analyses of gene expression modifications in squamous non-small cell lung cancers as compared to normal bronchial epithelial tissue. Int. J. Oncol. 2005, 26, 247–258. [Google Scholar] [CrossRef] [PubMed]
  47. Iwagami, Y.; Eguchi, H.; Nagano, H.; Akita, H.; Hama, N.; Wada, H.; Kawamoto, K.; Kobayashi, S.; Tomokuni, A.; Tomimaru, Y.; et al. miR-320c regulates gemcitabine-resistance in pancreatic cancer via SMARCC1. Br. J. Cancer 2013, 109, 502–511. [Google Scholar] [CrossRef] [Green Version]
  48. Li, Q.Q.; Hao, J.J.; Zhang, Z.; Krane, L.S.; Hammerich, K.H.; Sanford, T.; Trepel, J.B.; Neckers, L.; Agarwal, P.K. Proteomic analysis of proteome and histone post-translational modifications in heat shock protein 90 inhibition-mediated bladder cancer therapeutics. Sci. Rep. 2017, 7, 201. [Google Scholar] [CrossRef] [PubMed] [Green Version]
  49. Gigek, C.O.; Lisboa, L.C.; Leal, M.F.; Silva, P.N.; Lima, E.M.; Khayat, A.S.; Assumpcao, P.P.; Burbano, R.R.; Smith Mde, A. SMARCA5 methylation and expression in gastric cancer. Cancer Invest. 2011, 29, 162–166. [Google Scholar] [CrossRef]
  50. Jin, Q.; Mao, X.; Li, B.; Guan, S.; Yao, F.; Jin, F. Overexpression of SMARCA5 correlates with cell proliferation and migration in breast cancer. Tumour. Biol. 2015, 36, 1895–1902. [Google Scholar] [CrossRef]
  51. Ribeyre, C.; Zellweger, R.; Chauvin, M.; Bec, N.; Larroque, C.; Lopes, M.; Constantinou, A. Nascent DNA Proteomics Reveals a Chromatin Remodeler Required for Topoisomerase I Loading at Replication Forks. Cell Rep. 2016, 15, 300–309. [Google Scholar] [CrossRef] [Green Version]
  52. Ito, H.; Morishita, R.; Nagata, K.I. Functions of Rhotekin, an Effector of Rho GTPase, and Its Binding Partners in Mammals. Int J. Mol. Sci. 2018, 19, 2121. [Google Scholar] [CrossRef] [PubMed] [Green Version]
  53. Bishop, A.L.; Hall, A. Rho GTPases and their effector proteins. Biochem. J. 2000, 348, 241–255. [Google Scholar] [CrossRef]
  54. Memmel, S.; Sisario, D.; Zoller, C.; Fiedler, V.; Katzer, A.; Heiden, R.; Becker, N.; Eing, L.; Ferreira, F.L.R.; Zimmermann, H.; et al. Migration pattern, actin cytoskeleton organization and response to PI3K-, mTOR-, and Hsp90-inhibition of glioblastoma cells with different invasive capacities. Oncotarget 2017, 8, 45298–45310. [Google Scholar] [CrossRef] [Green Version]
  55. Lopez, L.C.; Schuelke, M.; Quinzii, C.M.; Kanki, T.; Rodenburg, R.J.; Naini, A.; Dimauro, S.; Hirano, M. Leigh syndrome with nephropathy and CoQ10 deficiency due to decaprenyl diphosphate synthase subunit 2 (PDSS2) mutations. Am. J. Hum. Genet. 2006, 79, 1125–1129. [Google Scholar] [CrossRef] [Green Version]
  56. Chen, P.; Yu, J.; Knecht, J.; Chen, Q. Decrease of PDSS2 expression, a novel tumor suppressor, in non-small cell lung cancer. Cancer. Epidemiol. 2013, 37, 166–171. [Google Scholar] [CrossRef] [PubMed]
  57. Chen, P.; Zhang, Y.; Polireddy, K.; Chen, Q. The tumor-suppressing activity of the prenyl diphosphate synthase subunit 2 gene in lung cancer cells. Anticancer Drugs 2014, 25, 790–798. [Google Scholar] [CrossRef] [PubMed]
  58. Brea-Calvo, G.; Rodriguez-Hernandez, A.; Fernandez-Ayala, D.J.; Navas, P.; Sanchez-Alcazar, J.A. Chemotherapy induces an increase in coenzyme Q10 levels in cancer cell lines. Free Radic. Biol. Med. 2006, 40, 1293–1302. [Google Scholar] [CrossRef]
  59. HSP90 Interactors. Available online: https://www.picard.ch/downloads/Hsp90interactors.pdf (accessed on 20 May 2020).
  60. Jahani, M.; Noroznezhad, F.; Mansouri, K. Arginine: Challenges and opportunities of this two-faced molecule in cancer therapy. Biomed. Pharmacother. 2018, 102, 594–601. [Google Scholar] [CrossRef] [PubMed]
  61. Keshet, R.; Erez, A. Arginine and the metabolic regulation of nitric oxide synthesis in cancer. Dis. Model. Mech 2018, 11. [Google Scholar] [CrossRef] [Green Version]
  62. Lee, Y.J.; Galoforo, S.S.; Berns, C.M.; Chen, J.C.; Davis, B.H.; Sim, J.E.; Corry, P.M.; Spitz, D.R. Glucose deprivation-induced cytotoxicity and alterations in mitogen-activated protein kinase activation are mediated by oxidative stress in multidrug-resistant human breast carcinoma cells. J. Biol. Chem. 1998, 273, 5294–5299. [Google Scholar] [CrossRef] [PubMed] [Green Version]
  63. Joly, J.H.; Delfarah, A.; Phung, P.S.; Parrish, S.; Graham, N.A. A synthetic lethal drug combination mimics glucose deprivation-induced cancer cell death in the presence of glucose. J. Biol. Chem. 2020, 295, 1350–1365. [Google Scholar] [CrossRef] [PubMed]
  64. Simons, A.L.; Mattson, D.M.; Dornfeld, K.; Spitz, D.R. Glucose deprivation-induced metabolic oxidative stress and cancer therapy. J. Cancer Res. Ther. 2009, 5, S2–S6. [Google Scholar] [PubMed]
Figure 1. Number of proteins per cell line identified by iTRAQ and mass spectrometry analysis.
Ijms 22 02538 g001
Figure 2. Study of proteins related to sensitivity to geldanamycin derivatives. (A) Venn diagram showing the overlap of proteins associated with a more sensitive response to 17-AAG and IPI-504 inhibitors. The analysis of shared proteins following geldanamycin treatments was performed with STRING software (https://string-db.org/), which identified (B) interactions between AK2, ATP5D, and PDHX proteins.
Ijms 22 02538 g002
Figure 3. Analysis of proteins associated with sensitivity to radicicol derivatives. (A) Common proteins related to optimal response to STA-9090 and AUY-922 as well as those specific to each HPS90 inhibitor are shown in a Venn diagram. (B) STRING software was used to determine interactions between common proteins related to sensitivity to geldanamycin treatments.
Ijms 22 02538 g003
Figure 4. Venn diagrams showing the number of proteins related to resistance to specific geldanamycin (A) or radicicol (B) derivatives and overlap common to each HSP90 inhibitor family.
Ijms 22 02538 g004
Figure 5. Map of interactions of common proteins related to geldanamycin resistance.
Ijms 22 02538 g005
Figure 6. Basal abundance of proteins involved in the p53 pathway by glucose deprivation in cell lines sensitive or resistant to geldanamycin derivatives (17-AAG (A) and IPI-504 (B)) and radicicol derivatives (STA-9090 (C) and AUY-922 (D)).
Ijms 22 02538 g006
Table 1. IC50 values for geldanamycin and radicicol analogs.
Cell Line Geldanamycin DerivativesRadicicol Derivatives
IC50 17-AAG (nM)IC50 IPI-504 (nM)IC50 STA-9090 (nM)IC50 AUY-922 (nM)
HCC82726.25517.1455.1384.167
H19751.25812.7504.7392.595
H16506.5543.7645.6591.472
H312226.16528.3717.9919.110
H222810.88846.3404.1314.488
H200943.19833.8334.6592.477
H35813.0664.6627.7408.105
A54916.29619.4926.31030.733
H14373.7083.4736.7942.814
CALU-387.73343.29518.4451740.91
H178112.34530.9759.95423.787
Table 2. Number of proteins significantly correlated with sensitivity or resistance to the studied HSP90 inhibitors.
TreatmentResponseNumber of Response-Related Proteins
DetectedSignificant
17-AAGSensitivity372427
Resistance3607171
IPI-504Sensitivity38981664
Resistance43951772
STA-9090Sensitivity449751
Resistance370421
AUY-922Sensitivity41491294
Resistance39341257
Table 3. Proteins related to a shared resistance to 17-AAG and IPI-504.
Protein NameUniProt 1Gene 2
Spliceosome RNA helicase DDX39BQ13838DDX39B
26S proteasome non-ATPase regulatory subunit 7P51665PSMD7
3-hydroxyisobutyryl-CoA hydrolase, mitochondrialQ6NVY1HIBCH
5′(3′)-deoxyribonucleotidase, cytosolic typeQ8TCD5NT5C
5′-AMP-activated protein kinase catalytic subunit alpha-1Q13131PRKAA1
5′-nucleotidase domain containing 1Q5TFE4NT5DC1
Acyl-coenzyme A thioesterase 13Q9NPJ3ACOT13
Acylglycerol kinase, mitochondrialQ53H12AGK
Ankyrin repeat and LEM domain-containing protein 2Q86XL3ANKLE2
ATP-binding cassette sub-family D member 3P28288ABCD3
Cleavage stimulation factor subunit 2 tau variantQ9H0L4CSTF2T
Coiled-coil domain containing 12Q8WUD4CCDC12
Conserved oligomeric Golgi complex subunit 1Q8WTW3COG1
DNA topoisomerase 1P11387TOP1
Dolichyl-diphosphooligosaccharide--protein glycosyltransferase subunit STT3BQ8TCJ2STT3B
Dynamin-like 120 kDa protein, mitochondrialO60313OPA1
EH domain-containing protein 4Q9H223EHD4
Elongation factor 1-alpha 2Q05639EEF1A2
EpiplakinP58107EPPK1
Eukaryotic initiation factor 4A-IIIP38919EIF4A3
Eukaryotic translation initiation factor 4 gamma 1Q04637EIF4G1
Eukaryotic translation initiation factor 4 gamma 3O43432EIF4G3
Formin-binding protein 1-likeQ5T0N5FNBP1L
Haloacid dehalogenase like hydrolase domain containing 3Q9BSH5HDHD3
Haloacid dehalogenase-like hydrolase domain-containing 5Q9BXW7CECR5
Heat shock protein 105 kDa and 70 kDa proteinsQ92598HSPH1
Heat shock protein family A member 4P34932HSPA4
Heme-binding protein 2Q9Y5Z4HEBP2
Hepatoma-derived growth factor-related protein 3Q9Y3E1HDGFRP3
High mobility group protein B1P09429HMGB1
Hydroxymethylglutaryl-CoA synthase, cytoplasmicQ01581HMGCS1
Isocitrate dehydrogenase [NAD] subunit alpha, mitochondrialP50213IDH3A
Isocitrate dehydrogenase [NADP], mitochondrialP48735IDH2
Magnesium transporter protein 1Q9H0U3MAGT1
Mediator of RNA polymerase II transcription subunit 14O60244MED14
Mitotic interactor and substrate of PLK1Q8IVT2MISP
Myosin regulatory light chain 12AP19105MYL12A
NADH-ubiquinone oxidoreductase 75 kDa subunit, mitochondrialP28331NDUFS1
Nitric oxide synthase-interacting proteinQ9Y314NOSIP
Non-POU domain-containing octamer-binding proteinQ15233NONO
Nucleoside diphosphate-linked moiety X motif 19A8MXV4NUDT19
Paraspeckle component 1Q8WXF1PSPC1
PHD finger protein 14O94880PHF14
Pogo transposable element with ZNF domainQ7Z3K3POGZ
Probable ATP-dependent RNA helicase DDX6P26196DDX6
Prolyl endopeptidaseP48147PREP
Protein S100-A13Q99584S100A13
Putative oxidoreductase GLYR1Q49A26GLYR1
Ras-related GTP-binding protein AQ7L523RRAGA
Small nuclear ribonucleoprotein EP62304SNRPE
SWI/SNF complex subunit SMARCC1Q92922SMARCC1
SWI/SNF complex subunit SMARCC2Q8TAQ2SMARCC2
SWI/SNF-related matrix-associated actin-dependent regulator of chromatin subfamily A member 5O60264SMARCA5
T-complex protein 1 subunit beta;P78371CCT2
T-complex protein 1 subunit epsilonP48643CCT5
Transcription initiation factor TFIID subunit 4O00268TAF4
Transcriptional repressor p66-alphaQ86YP4GATAD2A
Transcriptional repressor p66-betaQ8WXI9GATAD2B
Transducin beta-like protein 3;Q12788TBL3
Tyrosine-protein phosphatase non-receptor type 11Q06124PTPN11
UBX domain-containing protein 7O94888UBXN7
1 UniProt accession number. 2 Entrez gene ID.
Table 4. Pathways related to responses to HSP90 inhibitors.
SensitivityResistance
Arginine biosynthesisAdrenaline and noradrenaline biosynthesis
Endogenous cannabinoid signalingAlzheimer’s disease–amyloid secretase pathway
GABA-B receptor II signalingBlood coagulation
Gonadotropin-releasing hormone receptor pathwayCoenzyme A biosynthesis
Opioid proenkephalin pathwayGeneral transcription regulation
Opioid proopiomelanocortin pathwayOrnithine degradation
p53 pathway by glucose deprivation
Purine metabolism
Toll receptor signaling pathway
Vasopressin synthesis
Publisher’s Note: MDPI stays neutral with regard to jurisdictional claims in published maps and institutional affiliations.

