Article

Identification of Transcriptomic Differences between Lower Extremities Arterial Disease, Abdominal Aortic Aneurysm and Chronic Venous Disease in Peripheral Blood Mononuclear Cells Specimens

by
Daniel P. Zalewski
1,*,†,
Karol P. Ruszel
2,†,
Andrzej Stępniewski
3,
Dariusz Gałkowski
4,
Jacek Bogucki
5,
Przemysław Kołodziej
6,
Jolanta Szymańska
7,
Bartosz J. Płachno
8,
Tomasz Zubilewicz
9,
Marcin Feldo
9,‡,
Janusz Kocki
2,‡ and
Anna Bogucka-Kocka
1,‡
1
Chair and Department of Biology and Genetics, Medical University of Lublin, 4a Chodźki St., 20-093 Lublin, Poland
2
Chair of Medical Genetics, Department of Clinical Genetics, Medical University of Lublin, 11 Radziwiłłowska St., 20-080 Lublin, Poland
3
Ecotech Complex Analytical and Programme Centre for Advanced Environmentally Friendly Technologies, University of Marie Curie-Skłodowska, 39 Głęboka St., 20-612 Lublin, Poland
4
Department of Pathology and Laboratory Medicine, Rutgers-Robert Wood Johnson Medical School, One Robert Wood Johnson Place, New Brunswick, NJ 08903-0019, USA
5
Chair and Department of Organic Chemistry, Medical University of Lublin, 4a Chodźki St., 20-093 Lublin, Poland
6
Laboratory of Diagnostic Parasitology, Chair and Department of Biology and Genetics, Medical University of Lublin, 4a Chodźki St., 20-093 Lublin, Poland
7
Department of Integrated Paediatric Dentistry, Chair of Integrated Dentistry, Medical University of Lublin, 6 Chodźki St., 20-093 Lublin, Poland
8
Department of Plant Cytology and Embryology, Institute of Botany, Faculty of Biology, Jagiellonian University in Kraków, 9 Gronostajowa St., 30-387 Cracow, Poland
9
Chair and Department of Vascular Surgery and Angiology, Medical University of Lublin, 11 Staszica St., 20-081 Lublin, Poland
*
Author to whom correspondence should be addressed.
Both authors shared first authorship.
These authors shared senior authorship.
Int. J. Mol. Sci. 2021, 22(6), 3200; https://0-doi-org.brum.beds.ac.uk/10.3390/ijms22063200
Submission received: 31 January 2021 / Revised: 14 March 2021 / Accepted: 18 March 2021 / Published: 21 March 2021

Abstract

:
Several human tissues are investigated in studies of molecular biomarkers associated with diseases development. Special attention is focused on the blood and its components due to combining abundant information about systemic responses to pathological processes as well as high accessibility. In the current study, transcriptome profiles of peripheral blood mononuclear cells (PBMCs) were used to compare differentially expressed genes between patients with lower extremities arterial disease (LEAD), abdominal aortic aneurysm (AAA) and chronic venous disease (CVD). Gene expression patterns were generated using the Ion S5XL next-generation sequencing platform and were analyzed using DESeq2 and UVE-PLS methods implemented in R programming software. In direct pairwise analysis, 21, 58 and 10 differentially expressed genes were selected from the comparison of LEAD vs. AAA, LEAD vs. CVD and AAA vs. CVD patient groups, respectively. Relationships between expression of dysregulated genes and age, body mass index, creatinine levels, hypertension and medication were identified using Spearman rank correlation test and two-sided Mann–Whitney U test. The functional analysis, performed using DAVID website tool, provides potential implications of selected genes in pathological processes underlying diseases studied. Presented research provides new insight into differences of pathogenesis in LEAD, AAA and CVD, and selected genes could be considered as potential candidates for biomarkers useful in diagnosis and differentiation of studied diseases.

1. Introduction

Noncommunicable diseases such as cancer, diabetes mellitus, cardiovascular and chronic respiratory diseases are today the major contributors to the global burden of death instances [1,2]. Out of them conditions linked to cardiovascular system are one of the most common cause of death worldwide and their contribution will be even higher in future decades [1,3]. This work encompasses comparative gene expression analysis of three conditions from this vast group of diseases: lower extremities arterial disease (LEAD), abdominal aortic aneurysm (AAA) and chronic venous disease (CVD), which are complex and multifactorial vascular diseases burdened with high prevalence and severe life-threating consequences, making them major global health problems.
LEAD is the most common manifestation of peripheral arterial disease (PAD), characterized by chronic degenerative changes due to vascular flow deficit caused by formation of atheromatous plaques in arteries of lower limbs [4,5]. Overall global prevalence of LEAD is estimated to 5.56% of individuals aged 25 years and older and exceeds 10% in people older than 70 years [6]. The risk factors for LEAD include age, dyslipidemia, diabetes, smoking, hypertension and cardiovascular disease history [4,6]. The typical symptom of LEAD is intermittent claudication, resulting from recurrent ischemia-reperfusion cycles during physical activity, however more than 50% of LEAD cases is asymptomatic [5,7]. One of the most severe complication of LEAD is chronic limb-threatening ischemia, which affects approximately 11% of patients with LEAD [4,8].
AAA is a focal dilatation of the abdominal aorta measuring 50% greater than the proximal normal segment, or >3 cm in maximum diameter [9]. The prevalence of AAA ranges between 4% and 8% in general population of men aged 65–80 years [10]. Identified risk factors for aneurysm development include older age, male gender, cigarette smoking, obesity, dysregulation of lipid levels, hypertension [9,11,12] and genetic predisposition [13,14]. Patients with AAA may report nonspecific symptoms such as abdominal and back pain; however, in many cases, disease progress is asymptomatic [15]. Globally, AAA rupture is responsible for 0.3–0.4% of all death causes and approximately 1% of deaths among men above 65 years [16]. AAA rupture is associated with high distensibility of aortic wall, higher peak wall stress and aortic calcification [17].
CVD is defined as a syndrome of chronic morphological and functional abnormalities of the venous system caused by venous wall remodeling related to vascular inflammation, leading to venous hypertension, venous valve incompetency and reflux in veins of lower limbs [18,19,20,21]. The disease encompasses a wide spectrum of clinical presentations such as telangiectasia, varicose veins, leg edema, skin changes and ulcers [22]. The prevalence of symptomatic CVD among general practitioner attendees was estimated as high as 60%. The common risk factors include age, obesity, low physical activity, periods of prolonged standing or sitting and positive family history [23].
Guidelines for LEAD, AAA and CVD management, accomplished by specialists in the field and regularly updated [4,9,20,24,25], indicate urgent need for more effective diagnostic, treatment and differentiating strategies. Despite different clinical onset of LEAD, AAA and CVD, these diseases share main pathological mechanisms, such as inflammation, endothelial dysfunction and vascular smooth muscle cells proliferation and apoptosis, potentially impeding identification of specific biomarkers able to distinguish individuals affected with LEAD, AAA and CVD. Elucidation of molecular aspects of these diseases, including alterations in gene expression patterns associated with vascular pathology, could provide more focused insight into pathological conditions governing variety of vascular diseases.
Many studies have identified dysregulations of gene expression associated with vascular cell functions, including cell differentiation, proliferation, migration, and apoptosis exhibiting modulatory function of angiogenesis, endothelial cells dysfunction and response for ischemic events and oxidative stress [26,27,28,29,30,31]. Alterations in expression of numerous genes are considered as potential signatures of vascular diseases including atherosclerosis [32,33,34], LEAD [35,36,37], AAA [38,39,40,41,42] and CVD [43,44,45,46].
Peripheral blood mononuclear cells (PBMCs) represent a white blood cell subpopulation that includes lymphocytes and monocytes and constitute blood-derived clinical material broadly studied for elucidation of diseases processes due to possessing abundant information about systemic alterations in pathology. High accessibility of PBMCs make them a valuable source of potential biomarkers useful for detection and monitoring of disease progress. Changes in transcriptome expression of PBMCs may reflect ongoing local pathological processes in vascular tissues in either LEAD, AAA and CVD. Moreover, PBMCs subpopulations are key regulators of vascular inflammation, which is an important element of either LEAD, AAA or CVD onsets.
Therefore, transcriptomic patterns of PBMCs subpopulations originating from patients with LEAD, AAA and CVD versus healthy subjects were previously compared and potential transcriptomic biomarkers of these diseases were proposed [37,42,46]. In the current study, pairwise comparison of gene expression profiles between LEAD, AAA and CVD were performed in order to identify transcriptomic similarities and differences of these conditions. Obtained results could provide deeper insight into either general mechanisms of vascular pathology or unique processes contributing to LEAD, AAA and CVD. Identification of specific biomarkers potentially enables to select and monitor patients with high cardiovascular risk and to classify affected individuals to LEAD, AAA and CVD group, providing new diagnostic and treatment perspectives.
The study design, methodology and language were inspired by our previous studies regarding dysregulation of microRNA (miRNA) regulatory network in LEAD [37], AAA [42] and CVD [46] compared to healthy controls.

2. Results

2.1. Study Group Characteristics

The study group included 8 patients with LEAD, 7 patients with AAA and 7 patients with CVD. Clinical characteristics of participants are presented in Table 1 and detailed description of clinical features specific for each disease was provided in Table A1 in Appendix A. Statistical analysis of studied groups showed statistically significant (p < 0.05) differences in some characteristics, including age, BMI (body mass index), smoking habits, hypertension status, creatinine serum level and medication with statins, acetylsalicylic acid and beta-adrenergic blockers. These differences are a result of different risk factors and medication related to studied diseases. The influence of demographical and clinical differences on obtained results was examined and discussed further in the text.

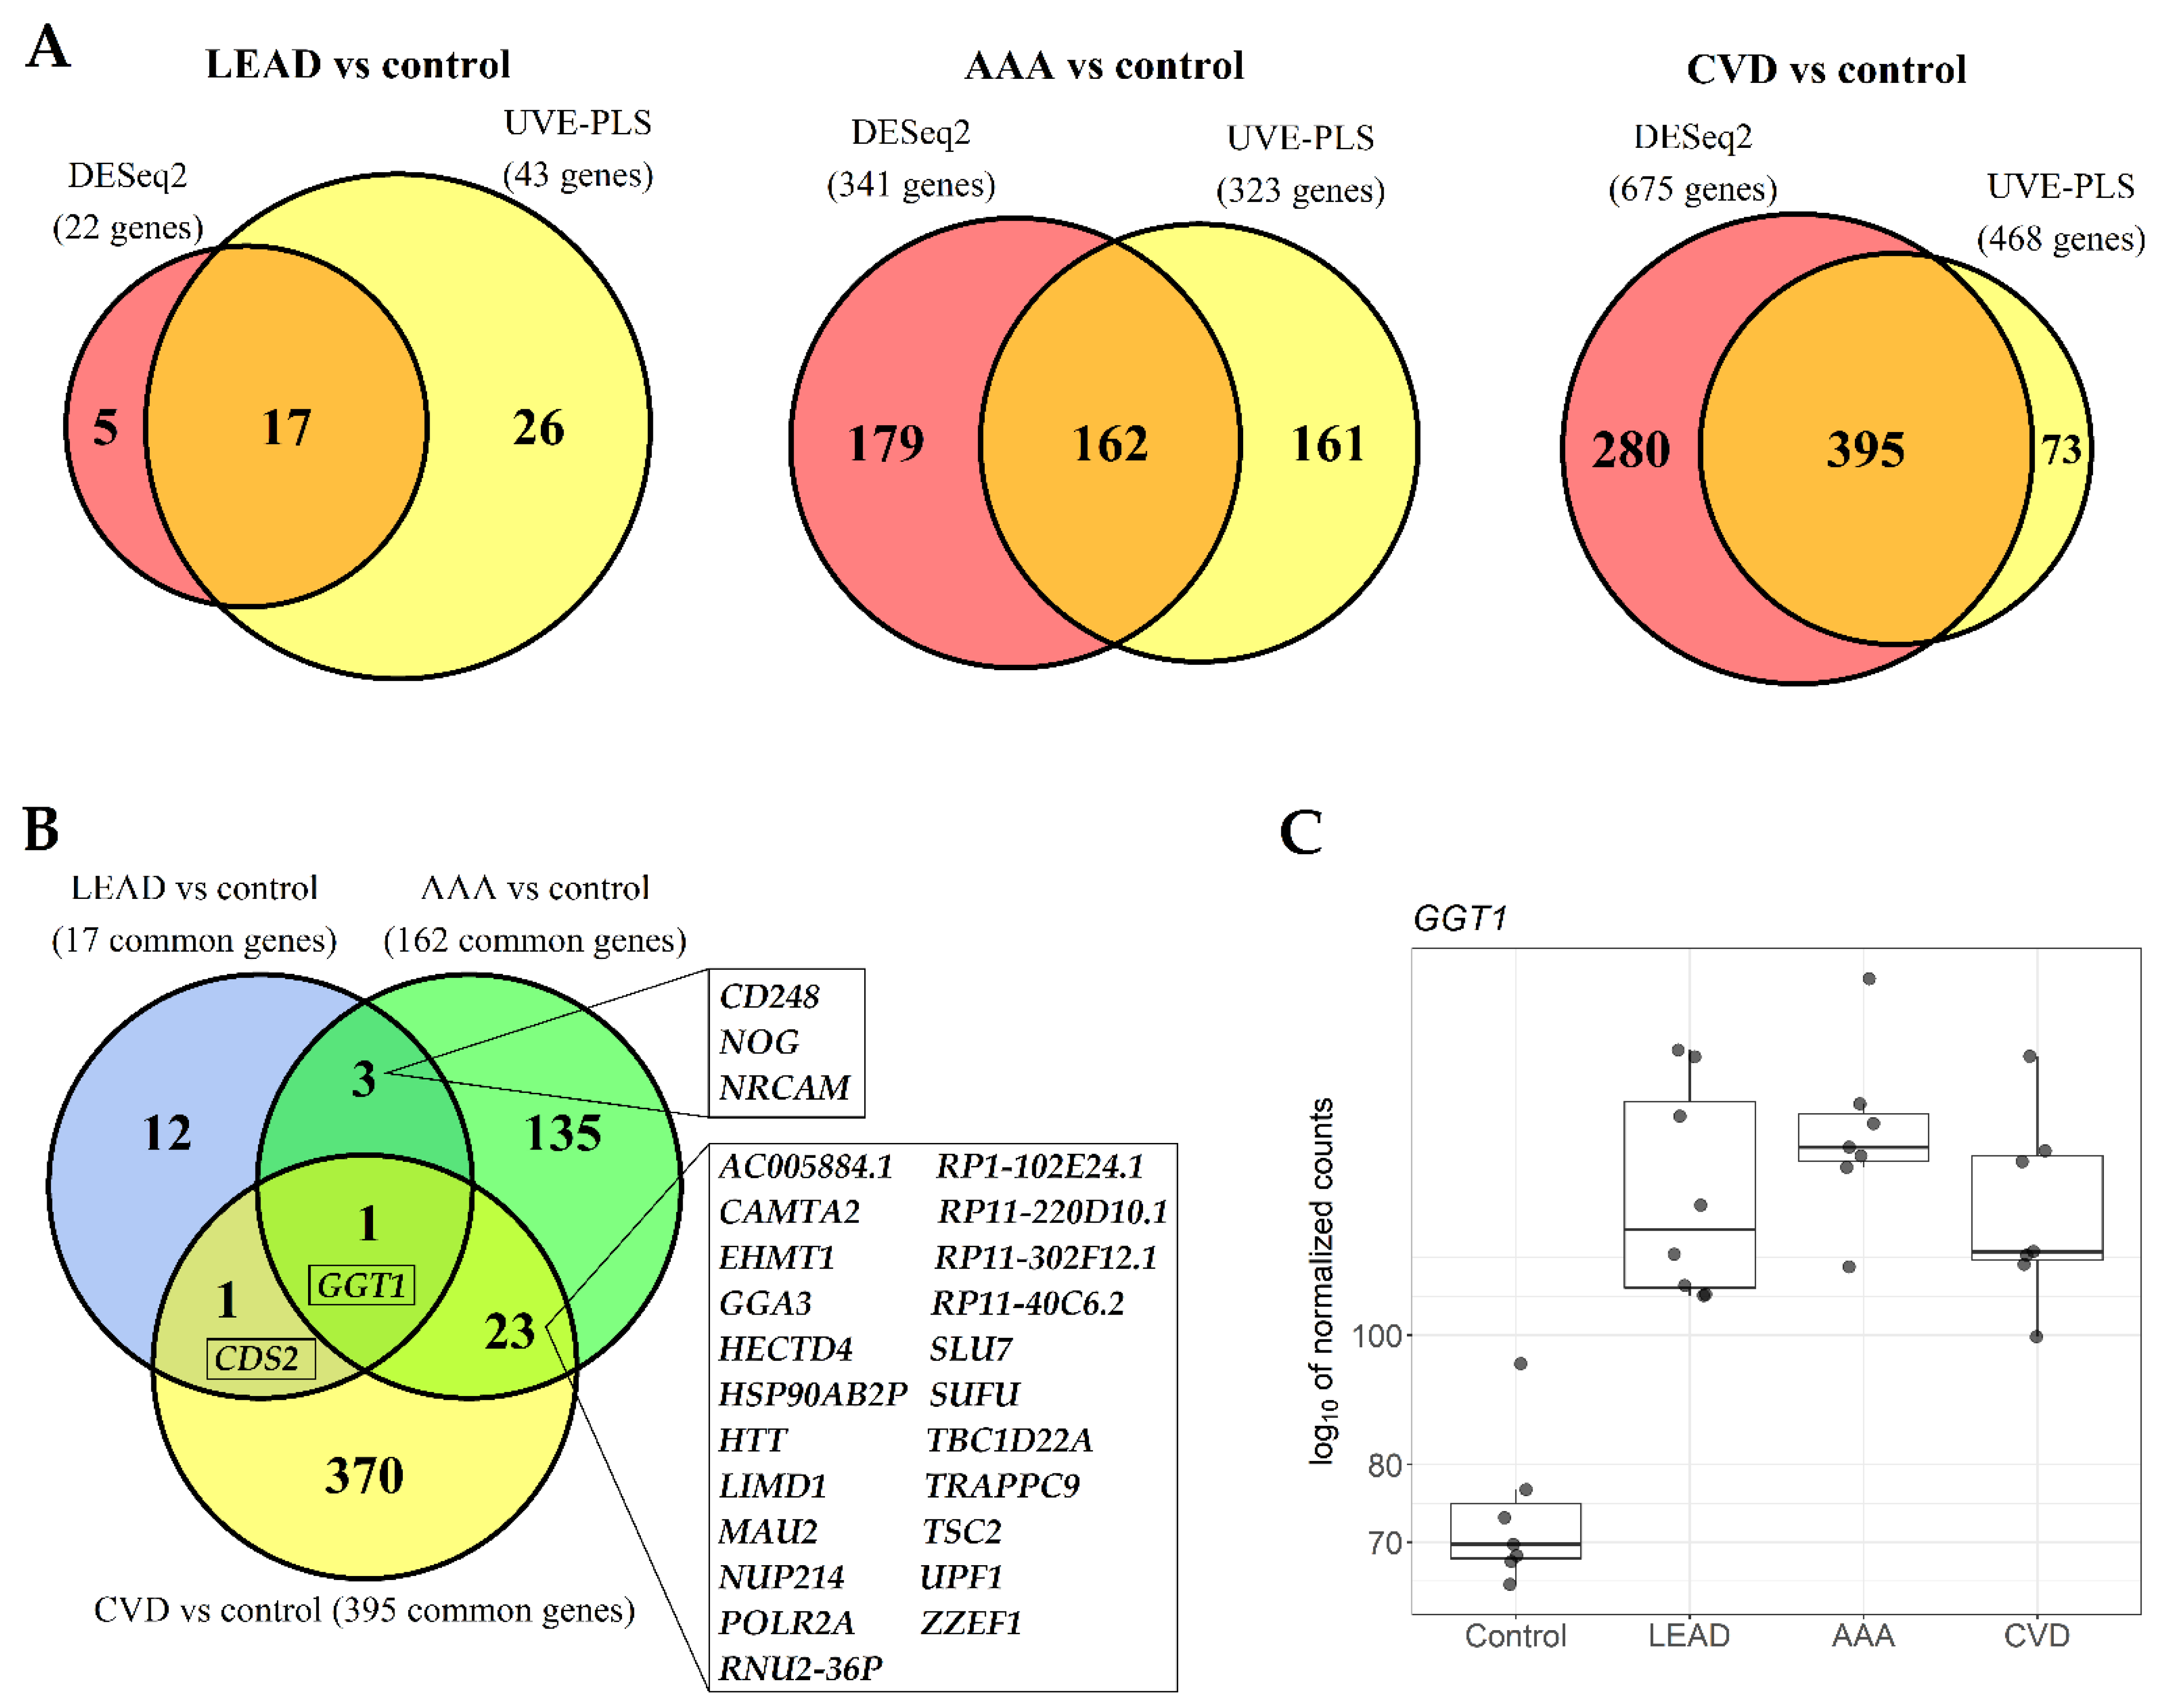
2.2. The Comparison of Differentially Expressed Genes in PBMCs of LEAD, AAA and CVD Subjects in Relation to Healthy Controls

In our previous studies, whole transcriptome and miRNA expression profiles of PBMCs in patients with LEAD [37], AAA [42] and CVD [46] in relation to healthy controls were investigated. MiRNAs and genes with the most promising biomarker potential as well as alterations of miRNA regulatory network associated with analyzed diseases were identified. Further functional analyzes draw interesting relations between proposed biomarkers and the etiopathology of studied diseases.
In this paper, we continue our investigations on molecular aspects of LEAD, AAA and CVD etiopathogenesis by searching for transcriptomic differences and similarities between these diseases. In the first approach, we compared previously obtained results of differential expression analysis that were performed for the total number of 55,765 genes using DESeq2 and UVE-PLS (Uninformative Variable Elimination by Partial Least Squares) methods between disease groups in the background of healthy controls (LEAD vs. control, AAA vs. control and CVD vs. control) [37,42,46]. To reduce and to assure high comparability of the data, strict and unified cutoff criteria for gene selection were applied: for DESeq2 results—genes with p value (adjusted by Benjamini–Hochberg false discovery rate) below 0.001 were selected and for UVE-PLS results—genes with the minimum reliability score equal to 8 were selected. Application of p < 0.001 threshold to DESeq2 data resulted in a selection of 22 differentially expressed genes in LEAD vs. control, 341 differentially expressed genes in AAA vs. control and 675 differentially expressed genes in CVD vs. control. As a result of establishing reliability score ≥8 as a selection criterium of differentially expressed genes resulted from UVE-PLS, 43 genes in LEAD vs. control, 323 genes in AAA vs. control and 468 genes in CVD vs. control were obtained. The sets of selected genes were compared within each studied disease on Venn diagrams and 17, 162 and 395 genes were obtained as common for both methods for LEAD vs. control, AAA vs. control and CVD vs. control, respectively (Figure 1A). Differential expression characteristics of common genes, including adjusted p values, fold changes and Partial Least Squares (PLS) coefficients are provided in Supplementary File 2.
To identify transcriptomic similarities and differences between LEAD, AAA and CVD, the sets of selected 17, 162 and 395 genes were compared on Venn diagram (Figure 1B). Differential expression of one gene (GGT1, gamma-glutamyltransferase 1) was common for all analyzed gene sets, one gene (CDS2, CDP-diacylglycerol synthase 2) was common for LEAD vs. control and CVD vs. control, three genes were common for LEAD vs. control and AAA vs. control, and 23 genes were common for AAA vs. control and CVD vs. control (Figure 1B). To conclude, the approach of making comparisons of differentially expressed gene sets in LEAD, AAA and CVD in relation to control group indicated that upregulation of GGT1 could be considered as a common feature of PBMCs from patients with these diseases (Figure 1C). Moreover, the differential expression of 12, 135 and 370 genes are specific for the comparisons LEAD vs. control, AAA vs. control and CVD vs. control, respectively (Figure 1B). These genes were additionally highlighted in the Supplementary File 2.
To further examine differences between diseases, the potential biological role of 12, 135 and 370 genes specific for LEAD vs. control, AAA vs. control and CVD vs. control comparisons, respectively, was determined in functional enrichment analysis performed using Database for Annotation, Visualization and Integrated Discovery (DAVID) database. Up to top ten enriched terms (with the lowest p value of enrichment) of Gene Ontology Biological Processing (GOBP), Gene Ontology Cellular Compartment (GOCC), Gene Ontology Molecular Function (GOMF), KEGG (Kyoto Encyclopedia of Genes and Genomes) and Reactome categories for each gene sets were selected and presented on Figure 2.

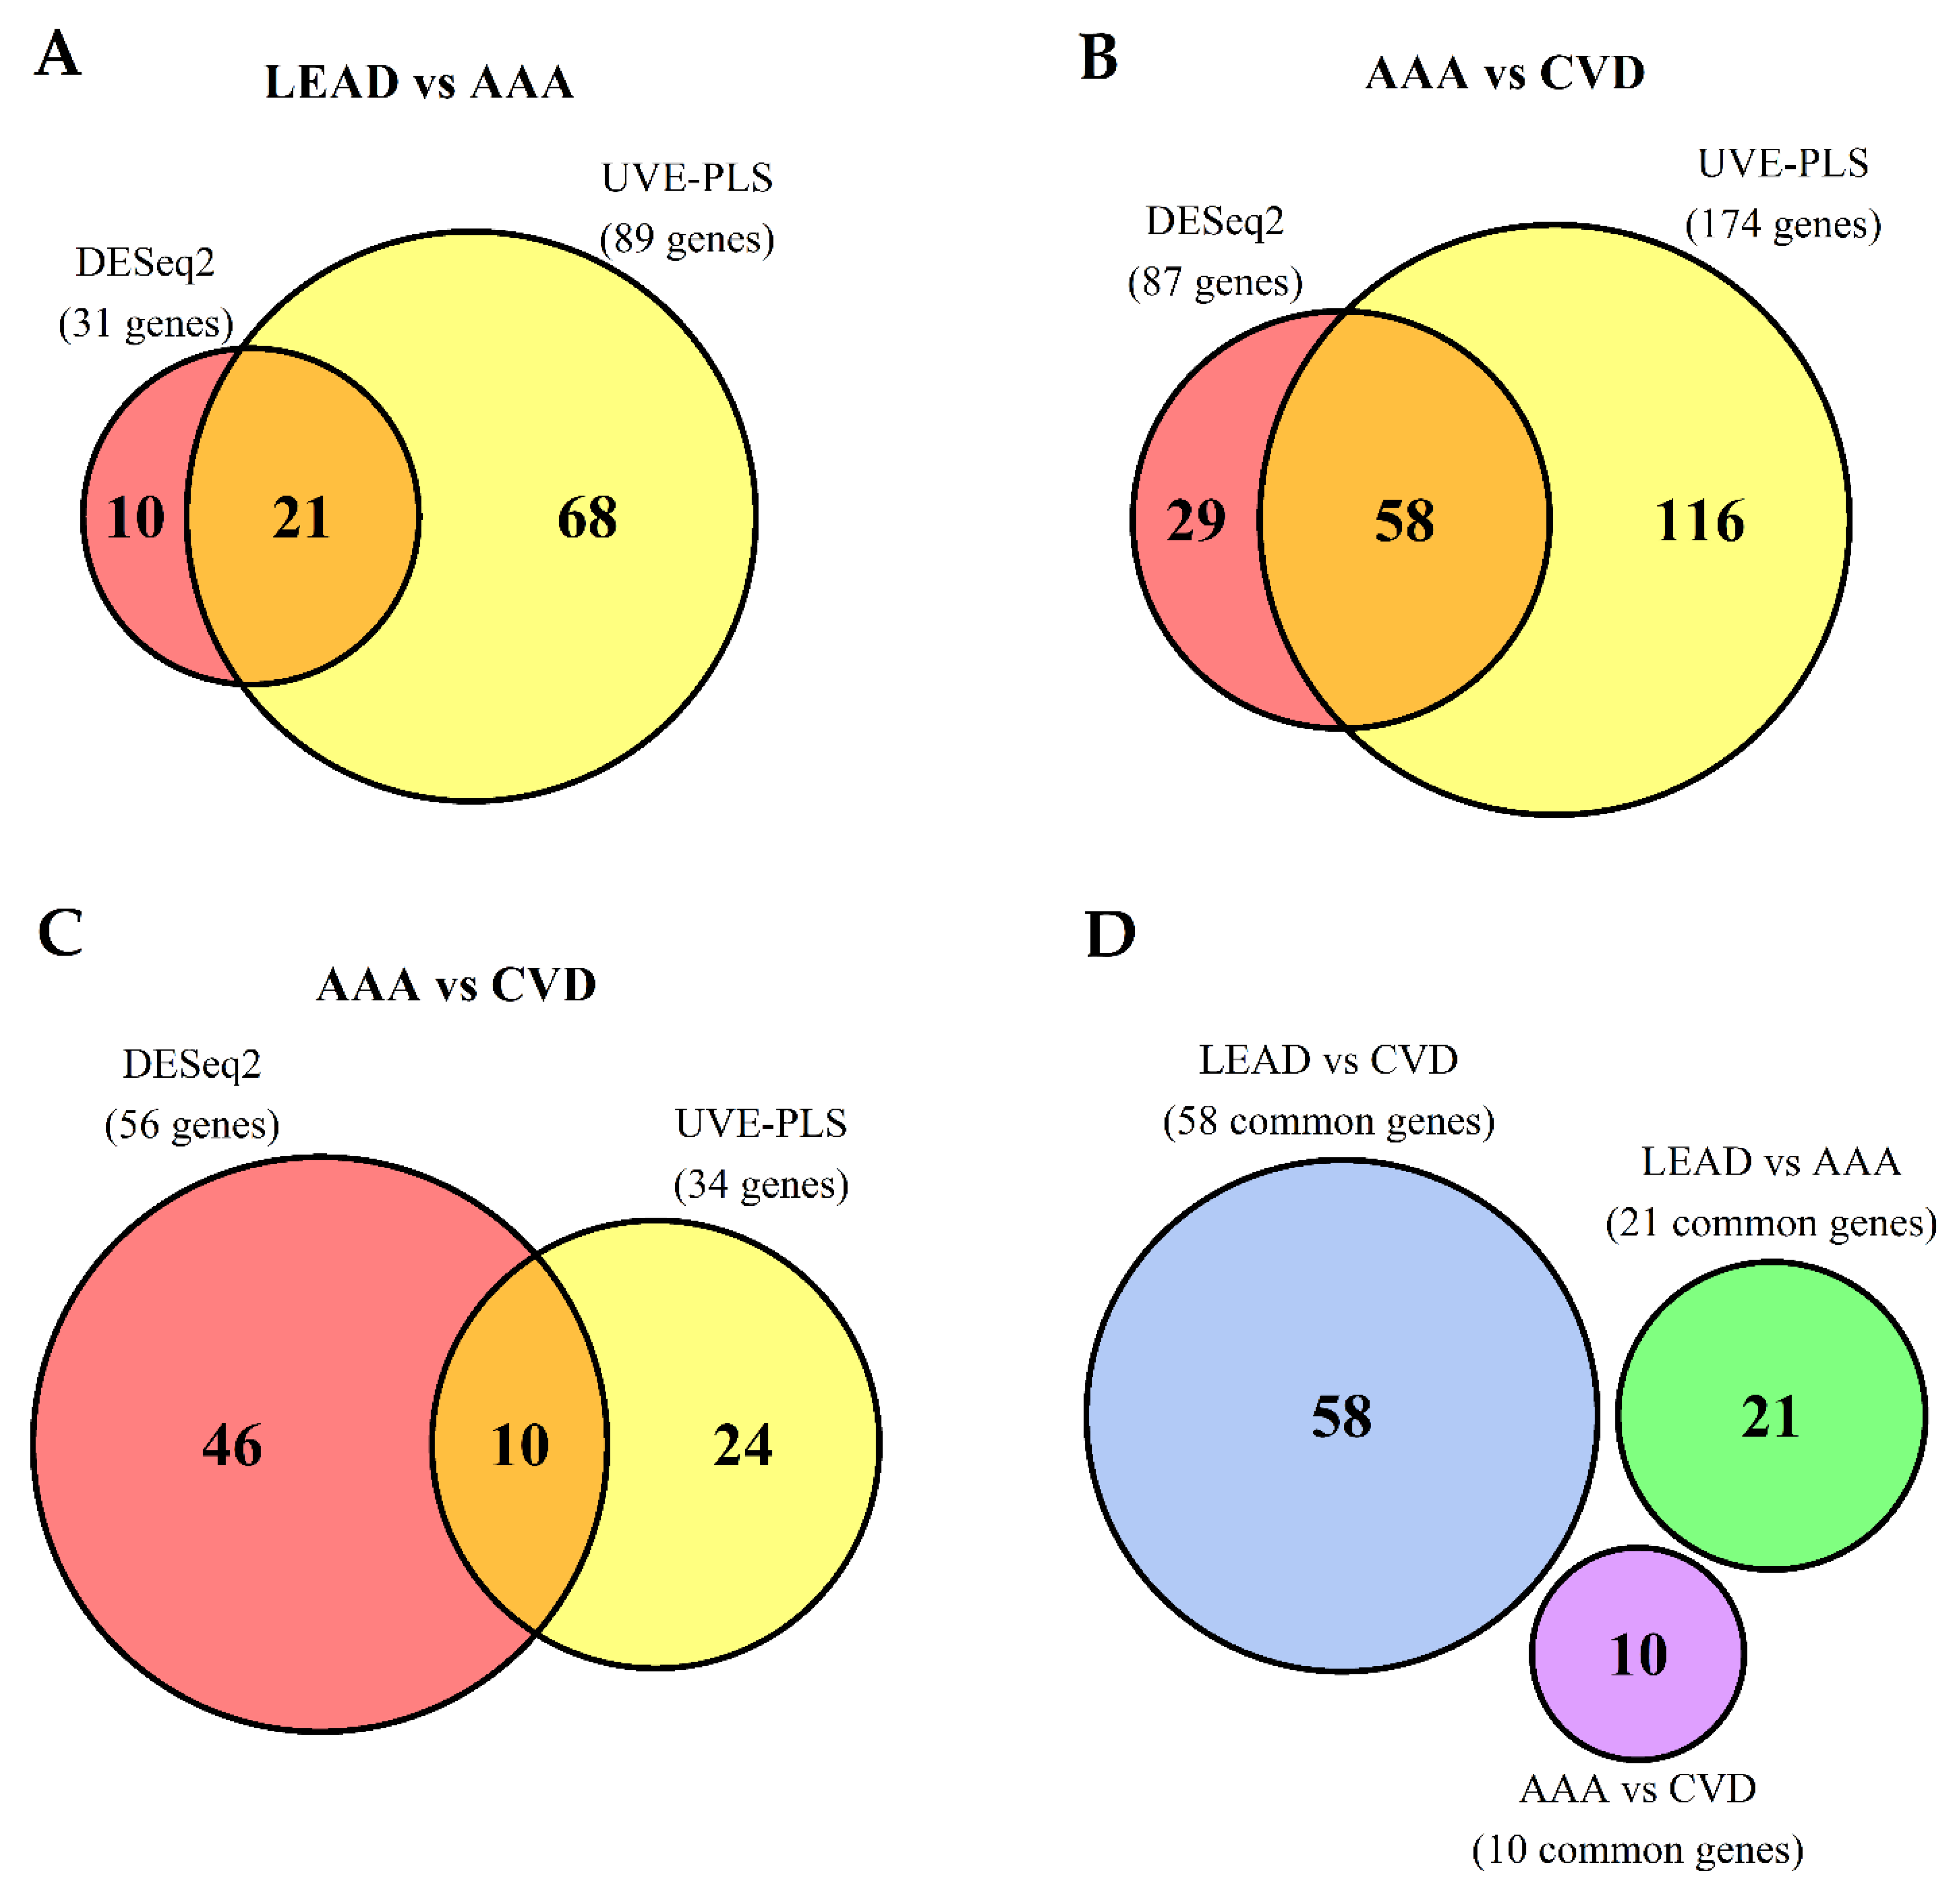
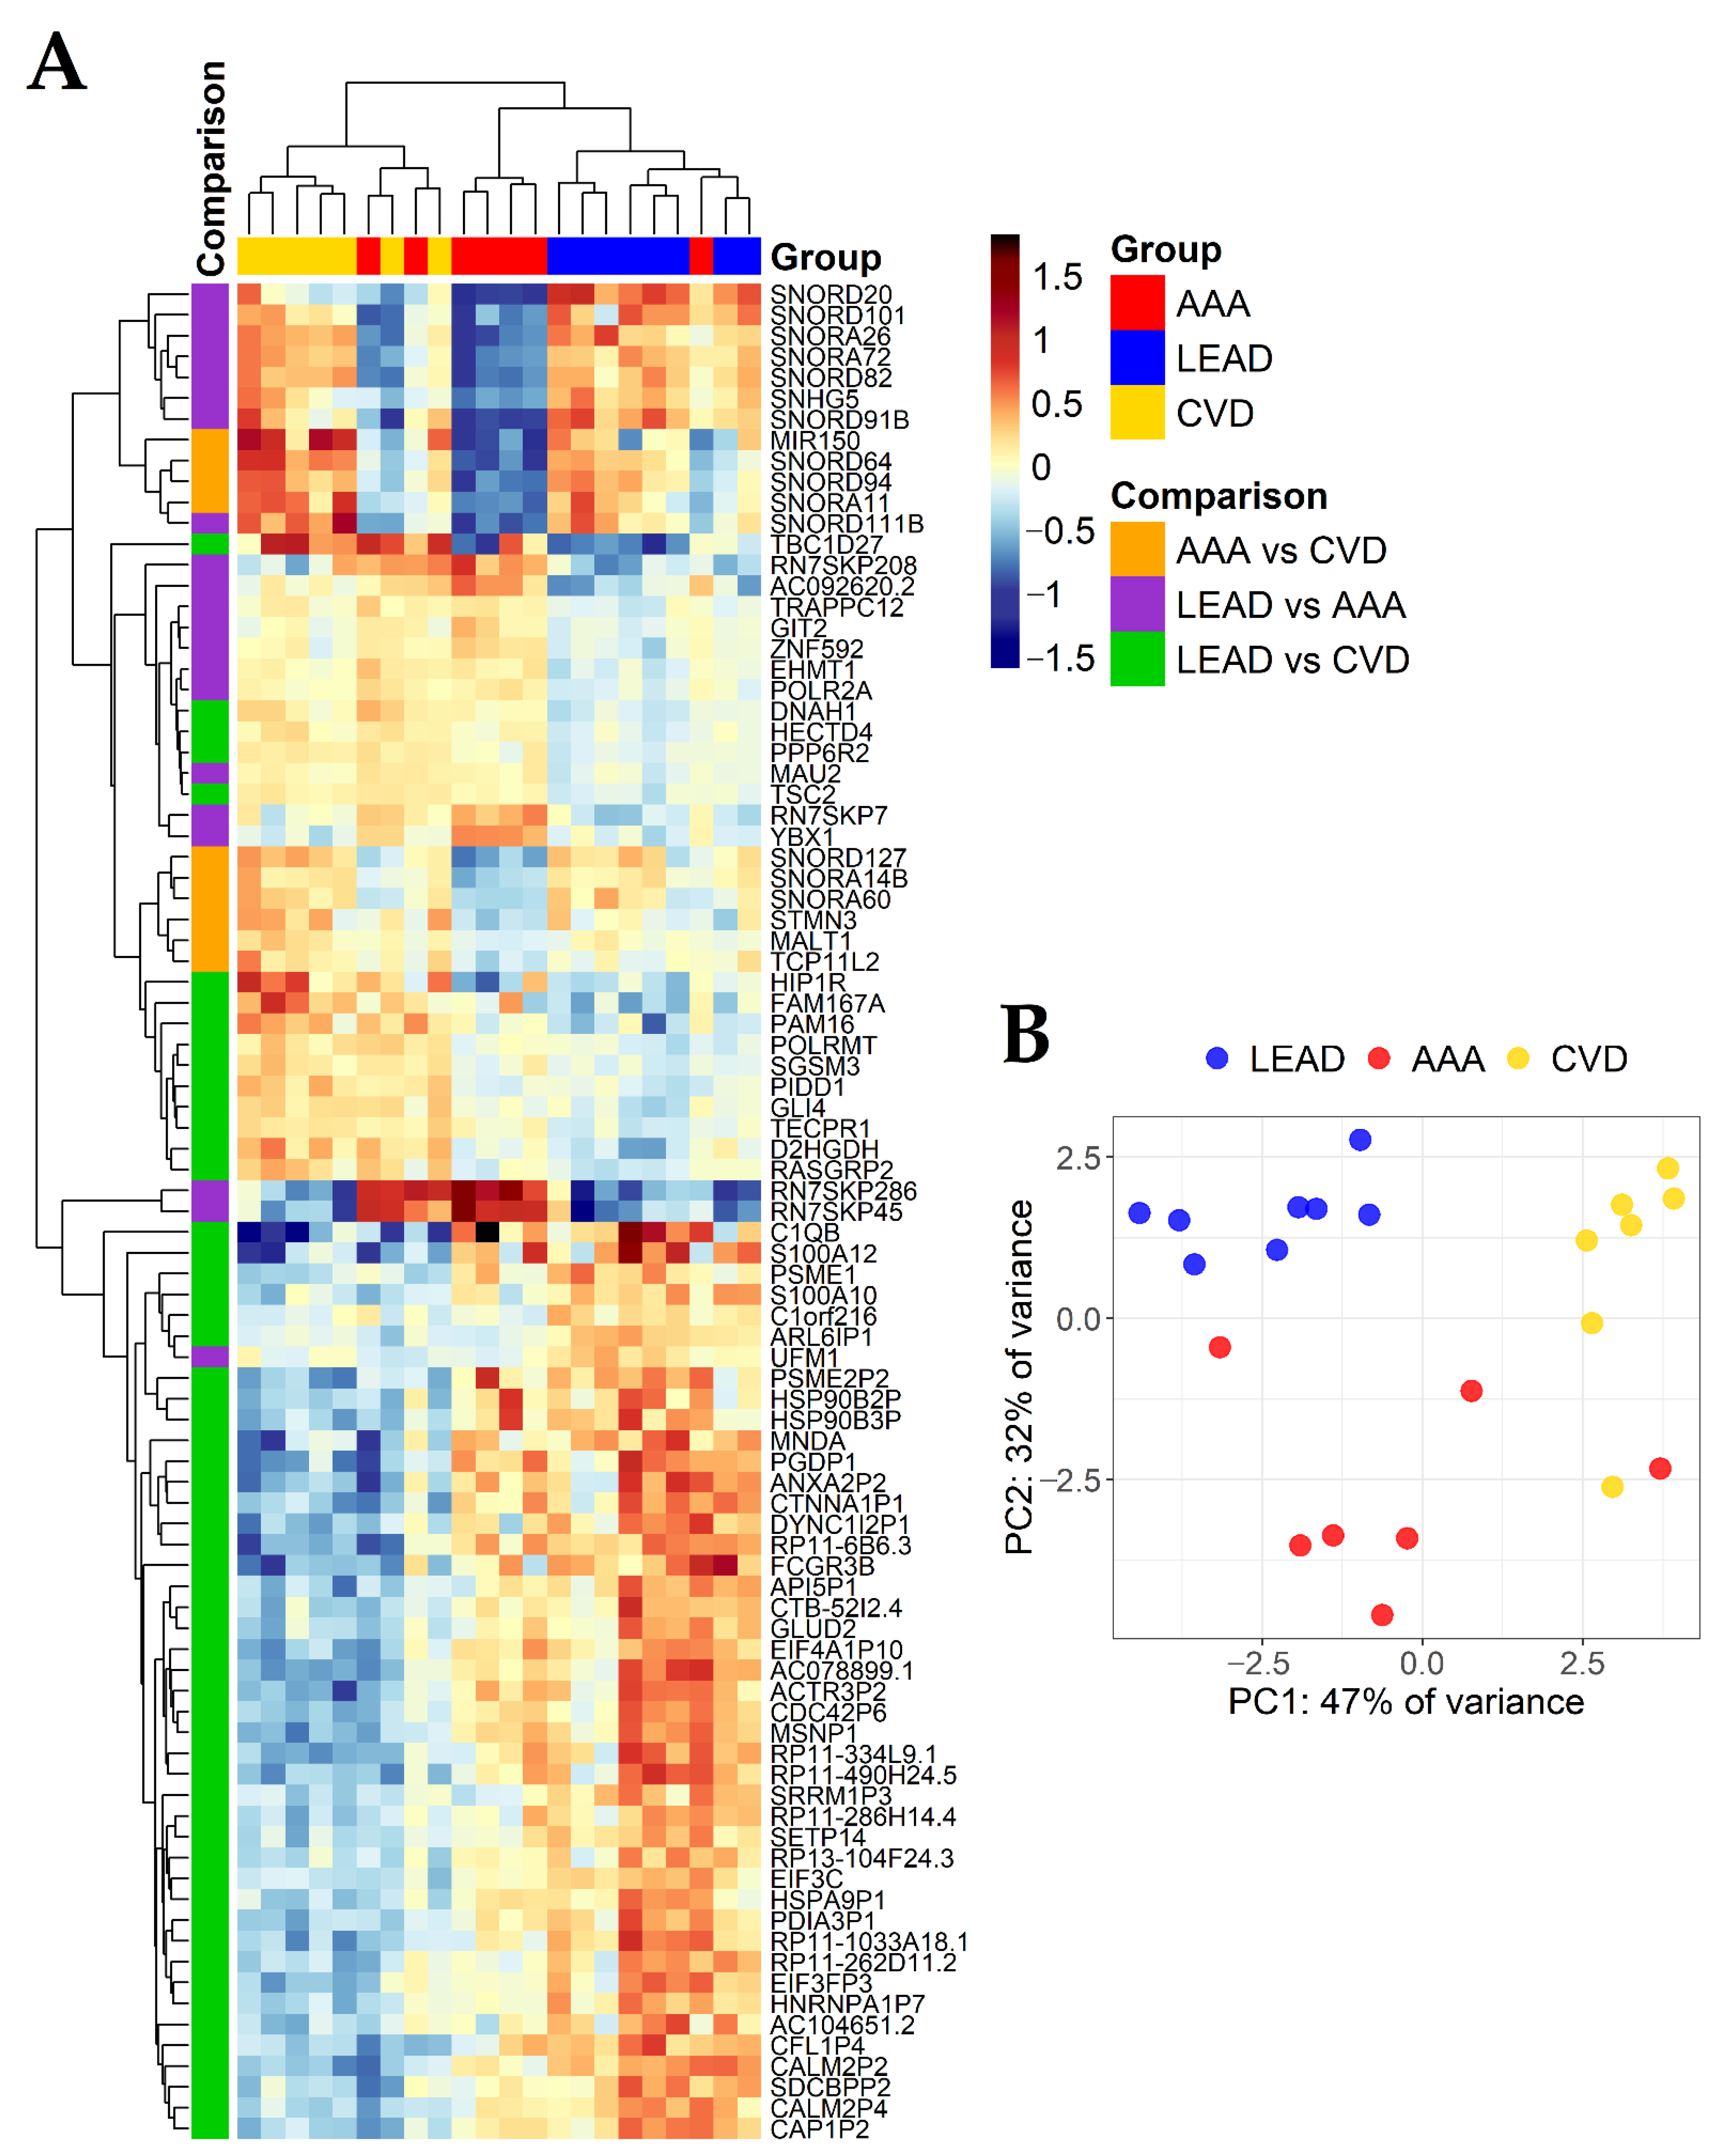
2.3. The Comparison of Differentially Expressed Genes in PBMCs of LEAD, AAA and CVD Subjects after Direct, Pairwise Comparisons

To further investigate transcriptomic similarities and differences in PBMCs of LEAD, AAA and CVD subjects, a direct, pairwise differential gene expression analysis was performed within these groups. In this approach, LEAD vs. AAA, LEAD vs. CVD and AAA vs. CVD comparisons were performed using DESeq2 and UVE-PLS methods. To assess the quality of the data, control plots including MA plot and histogram of p values were generated and evaluated for each comparison (Supplementary Materials Figures S1–S3). The boxplot of Cook’s distances of genes across all samples presents lack of any outliers in analyzed data (Figure S4). Similar to the previous approach, the unified cutoff thresholds (corrected p < 0.001 and reliability score ≥8) were used for gene selection from DESeq2 and UVE-PLS results, respectively (Table A2). Sets of genes selected from used methods were compared on Venn diagrams, revealing 21 genes (9 upregulated and 12 downregulated) common for DESeq2 and UVE-PLS methods from the comparison of LEAD vs. AAA (Figure 3A), 58 genes (43 upregulated and 15 downregulated) common for both methods from the comparison of LEAD vs. CVD (Figure 3B) and 10 genes (all downregulated) common for both methods from the comparison of AAA vs. CVD (Figure 3C, Table 2).
To identify common and unique genes for LEAD vs. AAA, LEAD vs. CVD and AAA vs. CVD diseases pairs, the obtained sets of 21, 58 and 10 genes were compared on the subsequent Venn diagram (Figure 3D), which shows a lack of genes shared by all three sets of genes. It indicates that these gene sets could be considered as potentially unique for performed comparisons and presumably useful to differentiate studied diseases. Differential expression characteristics of 89 (21 + 58 + 10) unique genes, including adjusted p values, fold changes and Partial Least Squares (PLS) coefficients are provided in Table 3. The expression of 89 unique genes was visualized on the heatmap with Euclidean clustering and on the Principal Component Analysis (PCA) plot (Figure 4).
The Receiver Operating Characteristics (ROC) analysis was performed to further evaluate the discriminative ability of 89 unique genes. The obtained areas under ROC curves ranged between 1 and 0.939 for analyzed genes, indicating good performance for distinguishing of studied diseases (Table 3). The detailed results of ROC analysis are provided in Table S1.
To explore the biological role of unique genes, a set of 21 unique genes selected from the comparison LEAD vs. AAA, 58 unique genes selected from the comparison LEAD vs. CVD and 10 unique genes selected from the comparison AAA vs. CVD were submitted to functional analysis performed by DAVID website tool. Up to top ten the most enriched functional terms for each gene set were harvested and presented on Figure 5. The most enriched terms for 21 genes differentiating LEAD and AAA groups were mainly associated with regulation of posttranscriptional modifications of RNA and translation, the most enriched terms for 58 genes differentiating LEAD and CVD were associated mainly with protein metabolism, and the most enriched terms for 10 genes differentiating AAA and CVD were mainly associated with intracellular signal transduction (Figure 5). Network of functional terms and associated genes is presented on Figure 6.

2.4. Identification of Relationships between the Study Group Characteristics and Expression of Genes Found as Unique for LEAD vs. AAA, LEAD vs. CVD and AAA vs. CVD Comparisons

The identified transcriptomic differences between studied diseases could be an effect of not only disease status, but also clinical and demographical characteristics for each studied group. Therefore, the relationships between expression of 89 genes (21 + 58 + 10) identified as unique for LEAD vs. AAA, LEAD vs. CVD and AAA vs. CVD comparisons and characteristics differentiating LEAD, AAA and CVD groups with statistical significance were evaluated. The analyzed characteristics include age, body mass index, smoking and hypertension status, creatinine level, medication with statins, acetylsalicylic acid and beta-adrenergic blockers (Table 1). Analysis of continuous variables (age, body mass index, creatinine level) was performed using Spearman rank correlation test with application of corrected statistical significance p < 0.05 and the absolute value of correlation coefficient R ≥ 0.6 as a cutoff threshold. For categorical variables (never and former smokers vs. current smokers, hypertension status, medication with statins, acetylsalicylic acid and beta-adrenergic blockers), a two-sided Mann–Whitney U test with corrected p < 0.05 as a cutoff threshold was applied.
Among 21 genes unique for LEAD vs. AAA comparison, three were negatively correlated with creatinine level. In the group of 58 genes unique for LEAD vs. CVD comparison, 15 were correlated with age, eight were correlated with BMI and 12 were positively correlated with creatinine level. In the case of 10 genes selected from AAA vs. CVD comparison, four were negatively correlated with age (Table 3). Obtained results show relation of either age, BMI or creatinine level with genes differentiating LEAD and CVD groups, suggesting difference in influence of these characteristics on LEAD and CVD onsets. Obtained correlations could be also a reflective for differences in these characteristics between LEAD and CVD groups, because LEAD group included significantly older subjects with higher BMI and creatinine levels than CVD group (Table 1).
Fifteen genes unique for LEAD and CVD comparison as well as 4 genes unique for AAA vs. CVD comparison were correlated with age (Table 3), what could be result in significant differences in age between compared groups. Interestingly, there were no genes unique from AAA vs. CVD comparison which were correlated with BMI, despite significant differences in BMI between these groups, what may suggest lower impact of these characteristic an AAA than on LEAD development.
In the case of correlation between gene expression and creatinine level, genes downregulated in LEAD vs. AAA were negatively correlated with creatinine levels as well as genes upregulated in LEAD vs. CVD were positively correlated with creatinine levels (Table 2 and Table 3), what may reflect a relationship between the higher creatinine levels in LEAD patients (Table 1) and change in expression of correlated genes. Results of correlation analysis show that differences in gene expression patterns found between compared diseases are at least partially affected by differences in age, BMI and creatinine levels and further investigations of these relationships should be carried out.
The statistically significant relationships between expression of 89 genes identified as unique for LEAD vs. AAA, LEAD vs. CVD and AAA vs. CVD comparisons and categorical characteristics of all patients (smoking and hypertension status, medication with statins, acetylsalicylic acid and beta-adrenergic blockers) are presented in Table 4. None of analyzed genes was found to be related to smoking status, which could be a result of similar proportions of patients who never and former smoked to patients who are current smokers (Table 1). There were also none of analyzed genes which were found to have statistically significant different expression between subjects with and without beta-adrenergic blockers medication. Two genes each from LEAD vs. CVD comparison were found to be linked to hypertension status (GLI4 and MNDA) and usage of statins (FAM167A and C1orf216) as well as 58 genes (54 and 4 from LEAD vs. CVD and AAA vs. CVD comparisons, respectively) were related to acetylsalicylic acid medication (Table 4). These genes mainly belong to genes differentiating LEAD and CVD groups, characterized by prominent differences in hypertension status and usage of statins and acetylsalicylic acid (Table 1), what could be an substantial factor altering expression of related genes.
Obtained results indicate that hypertension and medication in studied groups could affect transcriptomic profiles of PBMCs and the differential character of analyzed genes could be a result of applied pharmacotherapy, however further studies are needed to evaluate this effect.

3. Discussion

High prevalence and the burden of severe complications make LEAD, AAA and CVD together the major health problem worldwide. Often asymptomatic course of disease progress as well as atypical symptoms cause these diseases to be constantly underdiagnosed what creates the need for new tools for detection and assessment. Determination of biological markers using high-accessible biological material, including PBMCs and other blood components, is beneficial for clinical practice. Therefore, in our previous works we used PBMCs to identify dysregulations in miRNA:gene regulatory network in patients with LEAD, AAA and CVD in relation to healthy controls and potential biomarkers were proposed [37,42,46]. In the current paper, transcriptomic differences in PBMCs between studied diseases were investigated and potential implications to pathogenesis were explored.
In the first approach, upregulation of GGT1 was identified as a common marker of LEAD, AAA and CVD subjects after comparison to healthy controls (Figure 1). This finding is in concordance with previous studies, where increased serum level of GGT was found to be associated with peripheral arterial disease (PAD) in non-alcoholic males [47] and with higher risk of subclinical coronary atherosclerosis, coronary artery calcification and cardiac events [48,49]. Elevated serum GGT levels are related to increased concentrations of homocysteine [50], which is well known independent risk factor of cardiovascular diseases, including LEAD [51]. Upregulation of GGT1 was also found in aortic tissue wall of AAA patients [52]. Increased GGT level is considered as an adaptation to higher oxidative stress, since GGT plays an important role in glutathione homeostasis by providing cysteine for intracellular de novo synthesis of glutathione via breaking down extracellularly localized glutathione [53]. GGT is also involved in arachidonic acid metabolism through catalyzing of leukotriene D4 (LTD4) formation [54], a factor stimulating vascular inflammation [55]. Both GGT1 and LTD4 circulatory levels were demonstrated to be elevated in individuals exposed to acute hypoxia [56]. These finding suggests that the upregulation of GGT1 in LEAD and AAA could be a hallmark of oxidative stress, inflammation and hypoxia, which are pertinent elements of these diseases’ onsets.
In the second approach, differential gene expression analysis was performed using DESeq2 and UVE-PLS methods for the following comparisons: LEAD vs. AAA, LEAD vs. CVD and AAA vs. CVD. From each comparison, genes meeting unified cutoff criteria (p value adjusted by Benjamini–Hochberg false discovery rate <0.001 for DESeq2 results and reliability score ≥8 for UVE-PLS results) were selected. 21, 58 and 10 genes were selected from LEAD vs. AAA, LEAD vs. CVD and AAA vs. CVD, respectively (Figure 3, Table 2). Interestingly, there were no genes overlapping in all three sets (Figure 3D), therefore selected genes could be considered as specific for corresponding comparisons and may carry abundant information about differences in transcriptomic patterns of studied diseases.
Differentially expressed genes identified as specific for performed comparisons formed a transcriptional landscape of every disease, pointing out differences between them. The striking observation was a clear bias towards enrichment in genes of various regulatory potential, such as pseudogenes (Table 5). Due to advancement of high-throughput sequencing platforms, it was shown, that a high number of pseudogenes is indeed transcriptionally active and could be functionally significant part of the genome [57,58,59].
Pseudogene regulatory function may be elucidated by many different mechanisms such as being a microRNA sponge, recruiting chromatin-remodeling factors to its parental gene, acting as a decoy for RNA-binding proteins, associating with DNA-binding transcription factors and interrupting the DNA binding capacity [60].
Upregulation of genes belong to pseudogene class is a prominent feature distinguishing LEAD from CVD, comprising 76.7% (Table 5) of all upregulated specific genes. This may reveal potential complex mode of regulation in LEAD as a subtype of atherosclerosis and may reflect relative richness of atherosclerotic symptoms and characteristics.
The majority of genes with lower expression in AAA group in relation to LEAD and CVD patients belongs to small nucleolar RNAs (snoRNAs) of C/D box and H/ACA box types (Table 5). The function snoRNAs is 2′-O-ribose methylation and pseudouridylation of ribosomal RNAs [61], which suggests different regulation of translation process in AAA when compared to LEAD and CVD.
SNHG5 was reported as a pro-oncogenic factor stimulating proliferation of myeloid leukemia cells [62]. High expression of two snoRNAs, SNORA72 and SNORA26, was correlated with pro-oncogenic properties of cells and poor prognosis in cancer [63,64]. Upregulation of these genes in LEAD vs. AAA subjects may promote proliferation of immune cells and reflect higher inflammation status of the atherosclerotic lesions compared to aneurysm.
Four out of 12 genes downregulated in LEAD vs. AAA patients belong to RN7SK miscellaneous RNAs (RN7SKP7, RN7SKP45, RN7SKP208, RN7SKP286) (Table 5). For the time being, there were no reports about contribution of those genes to cardiovascular diseases or any biological process (according to GWAS Catalog database [65], accessed 15 January 2021). Despite lack of data, their function could be elucidated on the known functions of the RN7SK gene. Its product is a long, non-coding RNA which contributes to control of transcription elongation by RNA polymerase II [66,67]. One can speculate, that miscellaneous RN7SK RNAs found in our study may coregulate the AAA transcriptome in a global manner.
Upregulation of UFM1 was demonstrated in LEAD vs. AAA group (Table 2). UFM1 encodes evolutionarily conserved ubiquitin-like protein triggering activation of protein targets through UFMylation. UFMylation process is essential for erythropoiesis by maintaining proper survival and differentiation of cells in erythroid lineage. Knockout of UFMylation pathway downstream effectors in animals causes severe anemia associated with defective differentiation of both megakaryocytes and erythrocytes [68]. Higher expression of UFM1 in LEAD patients when compared to AAA subjects may reflect enhanced erythropoiesis stimulated by chronic ischemia characteristic for LEAD progression.
The presented study show downregulation of EHMT1 in LEAD vs. AAA group (Table 2). Lower expression level of EHMT1 was shown to be a factor increasing fetal hemoglobin levels [69], which is positively correlated with carotid artery intima media thickness in patients with β-thalassemia major [70]. The influence of atherosclerosis status of fetal hemoglobin levels seems to be an interesting topic for future studies on biomarkers of atherosclerosis. Moreover, EHMT1 together with EHMT2 regulate alternative splicing of VEGFA [71], which antiangiogenic splice isoform VEGF-A165b was shown to be elevated in serum of LEAD patients with coexistence of the reduction of the proangiogenic VEGF-A165a isoform [72]. The possible influence of EHMT1 dysregulation on biosynthesis of these VEGFA splicing isoforms in the context of vascular diseases should be further investigated.
Downregulation of YBX1 observed in the current study in LEAD vs. AAA subjects (Table 2) may indicate enhanced oxidized LDL-mediated inflammatory response and lipid deposition in macrophages [73], what is characteristic for pathogenesis of atherosclerosis, and hence LEAD.
GIT2 was identified as a key regulator of complex ageing processes, including DNA damage, oxidative stress, metabolic disruption, inflammation and fat deposition. GIT2 promote DNA repair and its age-dependent increase reflects a cellular protection mechanism attenuating ROS-induced DNA damage. Elevation in GIT2 expression levels was reported in an animal model for diabetes and obesity. GIT2 is also involved in regulation of inflammaging, which is an age-related, progressive increase in low-grade chronic inflammation linked to elevated levels of inflammatory biomarkers such as C-reactive protein and interleukin IL-6 [74]. Higher expression of GIT2 in AAA patients in relation to LEAD subjects (Table 2) suggests enhanced association of aging hallmarks with AAA pathogenesis in comparison to LEAD, what is especially suggestive, because individuals in the AAA and LEAD groups have similar age.
S100A10 and S100A2 were shown in presented research as to be upregulated in LEAD vs. CVD group (Table 2). S100A10 was previously shown to be hypomethylated in coronary artery plaques compared to great saphenous vein [75], what may be an explanation of higher expression of this gene in LEAD group. Higher expression of S100A12 was identified as a biomarker of coronary artery disease, aortic calcification, increased plaque vulnerability and as predictor of cardiovascular events [76]. Both genes were identified as being involved in macrophage activation and inflammatory cytokines induction [75,76]. Implications of S100A10 and S100A12 in atherosclerosis could entail differences in their expression in LEAD and CVD groups, however acetylic acid medication could also be causative for obtained results (Table 5).
Upregulation of SGSM3 in CVD vs. LEAD group (Table 2) may reflect higher ROS status in CVD, due to protective role of SGSM3 against oxidative stress [77].
In CVD group, TSC2 exhibits higher expression when compared to LEAD group (Table 2). It may suggest less intense cellular proliferation in CVD since TSC2 was evidenced to exert suppressing effect on cell cycle through inhibition of mTOR signaling [78]. Lower expression of TSC2 in LEAD may be an effect of aging, a process with declined AMP-activated protein kinase (AMPK) signaling, which activates TSC2 [78]. One of the features of aging related to suppression of AMPK is lowering the autophagy, a process essential for degradation of protein aggregates forming in aging cells [79]. Lower level of autophagy could be also indicated by downregulation of promotor of aggrephagy TCPR1 in LEAD group [80]. These findings could reflect a more advanced aging process in LEAD vs. CVD group, but may also be a result of significant difference in age between these groups.
Another gene downregulated in LEAD after comparison to CVD group is RASGRP2 (Table 2), which promotes adhesion of T cells and contribute to the endothelial homeostasis via preventing TNF-induced ROS production and apoptosis in umbilical vein endothelial cells (HUVECs) [81]. Higher expression of RASGRP2 in CVD vs. LEAD may be a stimulus for venous inflammation and lower expression in LEAD could be a hallmark of endothelium dysfunction, however further studies on this topic are required.
MIR150 is a gene downregulated in AAA vs. CVD and also negatively correlated with age and potentially linked to acetylsalicylic acid usage (Table 2, Table 3 and Table 4). This gene encodes mature miRNA miR-150-5p, whose downregulation was reported in patients with AAA and subaneurysmal aortic dilation in relation to high cardiovascular risk subjects with normal aortic diameter [82]. Aberrant expression of this miRNA seems to be triggered by disease status rather than by age, because age-matched populations were investigated in [82]. Lower expression of miR-150-5p may indicate AAA-associated endothelial dysfunction and vascular remodeling, since this miRNA has been suggested to play protective role by maintaining endothelium function and suppressing vascular remodeling via inhibition of pentaxin-3 expression [83].
Another gene with expression higher in CVD when compared to AAA is MALT1 (Table 2), which is a component of CARD11–BCL10–MALT1 signalosome, triggering inflammatory pathways in activated leukocytes and mediate lymphocyte proliferation, differentiation, metabolic reprogramming and survival after antigen recognition. The CARD10–BCL-10–MALT1 complex is a regulator of cardiovascular inflammation and remodeling though induction of cytokine and chemokine production in either endothelial or vascular smooth muscle cells. Moreover, this complex mediates the disruption of the endothelial barrier [84]. Higher expression of MALT1 in CVD patients may be a hallmark of vascular inflammation and remodeling ongoing in vein tissues during CVD.
Three genes (POLR2A, ZNF592, TRAPPC12) differentiating LEAD from AAA and 12 genes (RP11-262D11.2, SRRM1P3, SDCBPP2, ARL6IP1, HNRNPA1P7, API5P1, AC104651.2, EIF3FP3, RP11-286H14.4, CTNNA1P1, DYNC1I2P1, CTB-52I2.4) differentiating LEAD and CVD were also correlated with creatinine levels (Table 3). Altered expression of these genes probably reflect higher levels of creatinine observed in LEAD patients (Table 1). High creatinine level is a hallmark of declined glomerular filtration rate, a typical clinical marker of kidney failure. Chronic kidney disease was previously reported to be strongly associated with LEAD and other markers of kidney function such as cystatin C and β2-microglobulin were shown to be better markers of LEAD risk in patients with kidney diseases [85,86,87]. POLR2A gene, which is shown in the current study as downregulated in LEAD vs. AAA (Table 2) and negatively correlated with creatinine level (Table 3), was previously found as involved in congenital obstructive nephropathy [88] and encoded protein was strongly functionally linked to dysregulated proteins in animal models of salt-induced kidney damage [89]. The implications of POLR2A and other dysregulated genes correlated with creatinine levels in cross-talks between LEAD and kidney failure onsets should be a subject of further studies.
A descriptive character of our study raised some limitations. Application of unified cutoff criteria for selection of differentially expressed genes, although increasing the comparability of obtained results, could cause loss of certain genes important for differentiating diseases studied. Due to statistically significant differences in demographic and clinical characteristics of compared groups, selected differentially expressed genes could be not exclusive for disease status, but their expression levels could be affected by other analyzed variables, especially age, BMI, creatinine levels, hypertension and medication. Moreover, changes in lymphocytes and monocytes subpopulations content in PBMCs samples, however assessed as not significant (Figure S5), could be a potential source of bias in obtained transcriptome profiles.
To recompensate the lack of qPCR validation, we decided to use broader and more advance statistical analysis (DESeq2 with UVE-PLS confirmation, ROC analysis) and took much stricter thresholds of statistical significance (p < 0.001) with Benjamini–Hochberg false discovery rate correction into account in order to substantially limit potential false positive results.
Finally, due to initial and descriptive character of the presented study, the conclusions inferred from obtained results need to be confirmed in explanatory studies. Differential character of determined gene signatures and their role in vascular pathology should be elucidated in detail in further studies using such techniques as qPCR, flow cytometry, western blot, transfection methods or experiments with animal models. Further validation studies should also include investigations in much larger and more balanced populations.
The aim of sharing findings of the current work was to give the opportunity to start a discussion within scientific community and to propose new explorative paths for other research groups.

4. Materials and Methods

4.1. Study Participants

The study was performed in accordance with the Declaration of Helsinki and after approval of the Bioethics Commission of the Medical University of Lublin (decision No. KE-0254/341/2015, approval date 17 December 2015). The study group consists of 8 patients with LEAD, 7 patients with AAA and 7 patients with CVD. All individuals were diagnosed in Independent Public Clinical Hospital No. 1 in Lublin between February 2016 and May 2017. Informed and signed consent was obtained from all study subjects. Detailed inclusion procedure and established exclusion criteria were provided in our previous papers [37,42,46]. Clinical characteristics of participants are presented in Table 1 and detailed clinical features specific for each disease was provided in Table A1 in Appendix A.

4.2. Gene Expression Datasets

Gene expression datasets were generated by RNA sequencing of PBMCs samples obtained from the study participants as described in our previous papers. Briefly, PBMCs specimens were isolated from whole blood samples using density gradient centrifugation with Gradisol L reagent (Aqua-Med, Łódź, Poland). A diversity of white blood cells subpopulations in studied groups were evaluated using the whole blood morphology analysis (Figure S5). Total RNA was isolated from PBMCs samples using TRI Reagent Solution (Applied Biosystems, Foster City, CA, USA). Total RNA samples underwent ribodepletion procedure using RiboMinus Eukaryote System v2 (Ambion, Austin, TX, USA) and were subjected to whole transcriptome libraries preparation using Ion Total RNA-Seq Kit v2, Magnetic Bead Cleanup Module kit and Ion Xpress RNA-Seq Barcode 01-16 Kit (Life Technologies, Carlsbad, CA, USA). Libraries were sequenced on Ion 540 chips (Life Technologies) using Ion S5 XL System (Thermo Fisher Scientific, Waltham, MA, USA). Raw sequences were aligned to 55,765 genes of hg19 human genome using Torrent Suite Software v5.0.4. and Ion Torrent RNASeqAnalysis plugin v.5.0.3.0 (Thermo Fisher Scientific). Statistics of parameters describing transcriptome libraries and primary results of sequencing data analysis are provided in Table S2.

4.3. Data Analysis

Data analysis was performed using R environment (version 3.6.3, https://www.r-project.org, accessed on 12 January 2021) and appropriate packages according to corresponding reference manuals.
Statistical significance of differences in demographic and clinical parameters between LEAD, AAA and CVD groups was examined using Kruskal-Wallis rank sum test for continuous variables (kruskal.test function in R) and two-sided Fisher’s exact test for categorical variables (fisher.test function in R).
All further statistical procedures applied to expression datasets and subsequent bioinformatical analysis were previously described in detail in [37,42,46].
Differential expression analysis of whole transcriptome expression datasets was performed on biological replicates using DESeq2 method implemented in DESeq2 1.26.0 package [90] (https://bioconductor.org/packages/release/bioc/html/DESeq2.html, accessed on 12 January 2021) and Uninformative Variable Elimination by Partial Least Squares (UVE-PLS) method [91] implemented in plsVarSel 0.9.6 package [92] (https://cran.r-project.org/web/packages/plsVarSel/index.html, accessed on 12 January 2021).
DESeq2 analysis was performed on expression data filtered out of genes with mean of reads lower than one. Differentially expressed genes received from DESeq2 analysis with p value below 0.001 after Benjamini–Hochberg false discovery rate correction were considered as statistically significant.
For UVE-PLS analysis, filtered expression data was transformed using regularized log normalization (rlog function in DESeq2 package). UVE-PLS analysis was performed with 1000 iterations, reliability score cutoff threshold equal to 8 and 0.75 ratio for splitting into trained and tested data subsets. An optimal number of PLS (Partial Least Squares) components for UVE-PLS analysis (Table A2 in Appendix B) was established by PLS regression with leave-one-out (LOO) cross-validation followed by visual inspection of plots presenting the arrangement of estimated Root Mean Squared Error of Prediction (RMSEP) over the number of PLS components (Figure S6).
Venn diagrams, heatmap with Euclidean clustering and PCA plot were created using VennDiagram 1.6.20 (https://cran.r-project.org/web/packages/VennDiagram/index.html, accessed on 15 January 2021) [93], pheatmap 1.0.12 (https://cran.r-project.org/web/packages/pheatmap/index.html, accessed on 15 January 2021) and ggplot2 3.3.0 (https://ggplot2.tidyverse.org, accessed on 15 January 2021) packages, respectively.
A ROC analysis implemented in pROC package 1.16.2 [94] (https://cran.r-project.org/web/packages/pROC/index.html, accessed on 16 January 2021) was used to evaluate the predictive value of selected genes.
Identification of relationships between characteristics of study participants and expression of selected genes were performed using Spearman rank correlation test implemented in Hmisc package 4.4-0. (https://cran.r-project.org/web/packages/Hmisc/index.html, accessed on 18 January 2021) as well as a two-sided Mann–Whitney U test implemented in wilcox.test function in R.
Functional analysis of selected genes was performed using Database for Annotation, Visualization and Integrated Discovery (DAVID) 6.8 tool (https://david.ncifcrf.gov/, accessed on 21 January 2021) [95,96]. Default whole genome of Homo sapiens was applied as a background. Up to ten top the most enriched terms were selected from Gene Ontology, KEGG and Reactome categories. Functional network of the most enriched terms and associated genes was constructed using Cytoscape v3.7.0 software (https://cytoscape.org/, accessed on 23 January 2021) [97].

5. Conclusions

In our work we demonstrated that PBMCs are a valuable material to investigate transcriptomic differences between patients with LEAD, AAA and CVD. Analysis of PBMCs gene expression profiles enabled finding of associations of selected genes with characteristics of participants and their implications in disease pathogenesis. Performed identification of potentially disease-specific biomarkers could provide new diagnostic and therapeutic opportunities in LEAD, AAA and CVD management; however, further validation in studies on larger and demographically matched populations is required to launch implementation process of our results to clinical practice.

Supplementary Materials

Supplementary materials can be found at https://0-www-mdpi-com.brum.beds.ac.uk/1422-0067/22/6/3200/s1, Figure S1: Quality control of results obtained from differential gene expression analysis performed by DESeq2 package between group of 8 LEAD subjects and a group of 7 CVD subjects, Figure S2: Quality control of results obtained from differential gene expression analysis performed by DESeq2 package between group of 8 LEAD subjects and a group of 7 AAA subjects, Figure S3: Quality control of results obtained from differential gene expression analysis performed by DESeq2 package between group of 7 AAA subjects and a group of 7 CVD subjects, Figure S4: Boxplot presenting Cook’s distances of genes across samples, Figure S5: Proportions of white blood cells subpopulations in the study subjects, resulted from blood morphology analysis, Figure S6: Plots presenting the arrangement of prediction error and Partial Least Squares (PLS) components generated in UVE-PLS differential expression analysis of gene expression data, Table S1: Results of ROC analysis for 21 genes unique for the comparison of LEAD vs. AAA, 58 genes unique for the comparison of LEAD vs. CVD and 10 genes unique for the comparison of AAA vs. CVD, Table S2: Assessment of transcriptome libraries and results of primary analysis of transcriptome sequencing data carried out with Ion Torrent RNASeqAnalysis plugin v.5.0.3.0.

Author Contributions

Conceptualization, M.F., J.K. and A.B.-K.; data curation, D.P.Z., K.P.R. and A.S.; formal analysis, D.P.Z., K.P.R., J.B., J.S. and A.B.-K.; funding acquisition, A.B.-K.; investigation, D.P.Z., K.P.R. and P.K.; methodology, D.P.Z., K.P.R., M.F., J.K. and A.B.-K.; project administration, A.S., T.Z. and A.B.-K.; resources, A.S., M.F., J.K. and A.B.-K.; software, D.P.Z., A.S. and J.B.; supervision, A.S., M.F., J.K. and A.B.-K.; validation, D.P.Z., K.P.R., M.F. and A.B.-K.; visualization, D.P.Z.; writing—original draft, D.P.Z. and K.P.R.; writing—review and editing, D.G., B.J.P., M.F. and A.B.-K. All authors have read and agreed to the published version of the manuscript.

Funding

This research was funded by statutory funds of the Medical University of Lublin, number DS43 to A.B.-K.

Institutional Review Board Statement

The study was conducted according to the guidelines of the Declaration of Helsinki and approved by the Bioethics Commission of the Medical University of Lublin (protocol code KE-0254/341/2015, approval date 17 December 2015).

Informed Consent Statement

Informed consent was obtained from all subjects involved in the study.

Data Availability Statement

The data generated for this study are openly available in FigShare repository at https://0-doi-org.brum.beds.ac.uk/10.6084/m9.figshare.14252897.v1.

Acknowledgments

The research was performed using the equipment purchased within the project “The equipment of innovative laboratories doing research on new medicines used in the therapy of civilization and neoplastic diseases” within the Operational Program Development of Eastern Poland 2007–2013, Priority Axis I Modern Economy, Operations I.3 Innovation Promotion, and presented results were partially obtained using the apparatus located in the Center ECOTECH-COMPLEX in Lublin, purchased under the project “ECOTECH-COMPLEX Man, Environment, Production” No POIG.02.01.00-06-212/09 funded from the European Regional Development Fund 2007–2013 by the National Center for Research and Development in Poland.

Conflicts of Interest

The authors declare no conflict of interest.

Abbreviations

AAAAbdominal Aortic Aneurysm
AMPKAMP-activated protein kinase
BMIBody Mass Index
CVDChronic Venous Disease
DAVIDDatabase for Annotation, Visualization and Integrated Discovery
GOBPGene Ontology Biological Processing
GOCCGene Ontology Cellular Compartment
GOMFGene Ontology Molecular Function
KEGGKyoto Encyclopedia of Genes and Genomes
LEADLower Extremities Arterial Disease
miRNAmicroRNA
PADPeripheral Arterial Disease
PBMCsPeripheral Blood Mononuclear Cells
PCAPrincipal Component Analysis
PLSPartial Least Squares
ROCReceiver Operating Characteristics
ROC-AUCArea under ROC curve
snoRNASmall nucleolar RNA
UVE-PLSUninformative Variable Elimination by Partial Least Squares

Appendix A

Table A1. Detailed clinical characteristics of the study subjects specific for LEAD, AAA and CVD groups.
GroupParameter
LEAD
(n = 8)
Indication for treatment:
Rutherford category 26 (75%)
Rutherford category 32 (25%)
Initial claudication distance (m)143.75 ± 26.69 (100–180) 1
Ankle-brachial index0.658 ± 0.045 (0.59–0.72) 1
Length of occlusion (cm)13.63 ± 5.15 (7–22) 1
Plaque localization:
Iliac artery1 (12.5%)
Femoral artery6 (75%)
Iliac and femoral artery1 (12.5%)
AAA
(n = 7)
Abdominal aneurysm measurements:
Maximum aneurysm diameter (cm)6.371 ± 0.419 (5.8–7.0) 1
Thrombus volume (cm3)10.821 ± 2.605 (6.3–14.7) 1
Aneurysm neck length (cm)0.971 ± 0.198 (0.7–1.2) 1
CVD
(n = 7)
Signs and symptoms:
Pain2 (28.6%)
Ankle-brachial index0.974 ± 0.016 (0.95–0.99) 1
Extended anatomical classification:
Great saphenous vein (above knee)3 (42.8%)
Great saphenous vein (below knee)2 (28.6%)
Small saphenous vein2 (28.6%)
Medication:
Micronized diosmin3 (42.98)
Preparation with vitamin C, hesperidin and Ruscus aculeatus extract2 (28.6%)
Both medications2 (28.6%)
1 mean ± SD (range). LEAD—lower extremities arterial disease, AAA—abdominal aortic aneurysm, CVD—chronic venous disease.

Appendix B

Table A2. General results of differential gene expression analysis performed using DESeq2 and UVE-PLS methods obtained for comparisons: LEAD vs. AAA, LEAD vs. CVD and AAA vs. CVD.
ComparisonDESeq2UVE-PLSNumber of Genes Common for Sets of Genes Selected from DESeq2 (p < 0.001) and from UVE-PLS (Reliability Score ≥8)
Number of All Differentially Expressed GenesNumber of Differentially Expressed Genes with p < 0.05 NUMBER of Differentially Expressed Genes with p < 0.001Number of PLS Components/IterationsNumber of Informative Genes with Reliability Score ≥8
LEAD vs. AAA21,460544313/10008921
LEAD vs. CVD21,4601603873/100017458
AAA vs. CVD20,550685562/10003410
p—statistical significance after correction by Benjamini–Hochberg false discovery rate, AAA—abdominal aortic aneurysm, CVD—chronic venous disease, LEAD—lower extremities arterial disease, UVE-PLS—Uninformative Variable Elimination by Partial Least Squares.

References

  1. Fuster, V.; Kelly, B.B. Promoting Cardiovascular Health in the Developing World: A Critical Challenge to Acheive Global Health; The National Academies Press: Washington, DC, USA, 2010; ISBN 9780309147743. [Google Scholar]
  2. Joseph, P.; Leong, D.; McKee, M.; Anand, S.S.; Schwalm, J.D.; Teo, K.; Mente, A.; Yusuf, S. Reducing the global burden of cardiovascular disease, part 1: The epidemiology and risk factors. Circ. Res. 2017, 121, 677–694. [Google Scholar] [CrossRef] [PubMed]
  3. Kaptoge, S.; Pennells, L.; De Bacquer, D.; Cooney, M.T.; Kavousi, M.; Stevens, G.; Riley, L.M.; Savin, S.; Khan, T.; Altay, S.; et al. World Health Organization cardiovascular disease risk charts: Revised models to estimate risk in 21 global regions. Lancet Glob. Health 2019, 7, e1332–e1345. [Google Scholar] [CrossRef] [Green Version]
  4. Aboyans, V.; Ricco, J.B.; Bartelink, M.L.E.L.; Björck, M.; Brodmann, M.; Cohnert, T.; Collet, J.P.; Czerny, M.; De Carlo, M.; Debus, S.; et al. 2017 ESC Guidelines on the Diagnosis and Treatment of Peripheral Arterial Diseases, in collaboration with the European Society for Vascular Surgery (ESVS). Eur. Heart J. 2018, 39, 763–816. [Google Scholar] [CrossRef] [Green Version]
  5. Hamburg, N.M.; Creager, M.A. Pathophysiology of intermittent claudication in peripheral artery disease. Circ. J. 2017, 81, 281–289. [Google Scholar] [CrossRef] [Green Version]
  6. Song, P.; Rudan, D.; Zhu, Y.; Fowkes, F.J.I.; Rahimi, K.; Fowkes, F.G.R.; Rudan, I. Global, regional, and national prevalence and risk factors for peripheral artery disease in 2015: An updated systematic review and analysis. Lancet Glob. Health 2019, 7, e1020–e1030. [Google Scholar] [CrossRef] [Green Version]
  7. Shu, J.; Santulli, G. Update on peripheral artery disease: Epidemiology and evidence-based facts. Atherosclerosis 2018, 275, 379–381. [Google Scholar] [CrossRef] [PubMed]
  8. Nehler, M.R.; Duval, S.; Diao, L.; Annex, B.H.; Hiatt, W.R.; Rogers, K.; Zakharyan, A.; Hirsch, A.T. Epidemiology of peripheral arterial disease and critical limb ischemia in an insured national population. J. Vasc. Surg. 2014, 60, 686–695.e2. [Google Scholar] [CrossRef] [PubMed] [Green Version]
  9. Chaikof, E.L.; Dalman, R.L.; Eskandari, M.K.; Jackson, B.M.; Lee, W.A.; Mansour, M.A.; Mastracci, T.M.; Mell, M.; Murad, M.H.; Nguyen, L.L.; et al. The Society for Vascular Surgery practice guidelines on the care of patients with an abdominal aortic aneurysm. J. Vasc. Surg. 2018, 67, 2–77.e2. [Google Scholar] [CrossRef] [Green Version]
  10. Lattanzi, S. Abdominal aortic aneurysms: Pathophysiology and clinical issues. J. Intern. Med. 2020, 288, 376–378. [Google Scholar] [CrossRef]
  11. Kent, K.C.; Zwolak, R.M.; Egorova, N.N.; Riles, T.S.; Manganaro, A.; Moskowitz, A.J.; Gelijns, A.C.; Greco, G. Analysis of risk factors for abdominal aortic aneurysm in a cohort of more than 3 million individuals. J. Vasc. Surg. 2010, 52, 539–548. [Google Scholar] [CrossRef] [PubMed] [Green Version]
  12. Ahmed, R.; Ghoorah, K.; Kunadian, V. Abdominal aortic aneurysms and risk factors for adverse events. Cardiol. Rev. 2016, 24, 88–93. [Google Scholar] [CrossRef]
  13. Golledge, J.; Kuivaniemi, H. Genetics of abdominal aortic aneurysm. Curr. Opin. Cardiol. 2013, 28, 290–296. [Google Scholar] [CrossRef]
  14. Bown, M.J. Genomic insights into abdominal aortic aneurysms. Ann. R. Coll. Surg. Engl. 2014, 96, 405–414. [Google Scholar] [CrossRef] [Green Version]
  15. Alamoudi, A.O.; Haque, S.; Srinivasan, S.; Mital, D.P. Diagnostic efficacy value in terms of sensitivity and specificity of imaging modalities in detecting the abdominal aortic aneurysm: A systematic review. Int. J. Med. Eng. Inform. 2015, 7, 15–35. [Google Scholar] [CrossRef]
  16. Naghavi, M.; Wang, H.; Lozano, R.; Davis, A.; Liang, X.; Zhou, M.; Vollset, S.E.; Abbasoglu Ozgoren, A.; Abdalla, S.; Abd-Allah, F.; et al. Global, regional, and national age-sex specific all-cause and cause-specific mortality for 240 causes of death, 1990–2013: A systematic analysis for the Global Burden of Disease Study 2013. Lancet 2015, 385, 117–171. [Google Scholar] [CrossRef]
  17. Krishna, S.M.; Morton, S.K.; Li, J.; Golledge, J. Risk factors and mouse models of abdominal aortic aneurysm rupture. Int. J. Mol. Sci. 2020, 21, 7250. [Google Scholar] [CrossRef] [PubMed]
  18. Eberhardt, R.T.; Raffetto, J.D. Chronic venous insufficiency. Circulation 2014, 130, 333–346. [Google Scholar] [CrossRef]
  19. Ligi, D.; Croce, L.; Mannello, F. Chronic venous disorders: The dangerous, the good, and the diverse. Int. J. Mol. Sci. 2018, 19, 2544. [Google Scholar] [CrossRef] [PubMed] [Green Version]
  20. Nicolaides, A.; Kakkos, S.; Baekgaard, N.; Comerota, A.; De Maeseneer, M.; Eklof, B.; Giannoukas, A.; Lugli, M.; Maleti, O.; Mansilha, A.; et al. Management of chronic venous disorders of the lower limbs: Guidelines according to scientific evidence part II (Chapters 9–18). Int. Angiol. 2020, 39, 175–230. [Google Scholar] [CrossRef] [PubMed]
  21. Mansilha, A.; Sousa, J. Pathophysiological mechanisms of chronic venous disease and implications for venoactive drug therapy. Int. J. Mol. Sci. 2018, 19, 1669. [Google Scholar] [CrossRef] [Green Version]
  22. Lurie, F.; Passman, M.; Meisner, M.; Dalsing, M.; Masuda, E.; Welch, H.; Bush, R.L.; Blebea, J.; Carpentier, P.H.; De Maeseneer, M.; et al. The 2020 update of the CEAP classification system and reporting standards. J. Vasc. Surg. Venous Lymphat. Disord. 2020, 8, 342–352. [Google Scholar] [CrossRef]
  23. Vuylsteke, M.E.; Colman, R.; Thomis, S.; Guillaume, G.; Van Quickenborne, D.; Staelens, I. An Epidemiological Survey of Venous Disease Among General Practitioner Attendees in Different Geographical Regions on the Globe: The Final Results of the Vein Consult Program. Angiology 2018, 69, 779–785. [Google Scholar] [CrossRef] [Green Version]
  24. Conte, M.S.; Bradbury, A.W.; Kolh, P.; White, J.V.; Dick, F.; Fitridge, R.; Mills, J.L.; Ricco, J.B.; Suresh, K.R.; Murad, M.H.; et al. Global Vascular Guidelines on the Management of Chronic Limb-Threatening Ischemia. Eur. J. Vasc. Endovasc. Surg. 2019, 58, S1–S109.e33. [Google Scholar] [CrossRef] [Green Version]
  25. Wittens, C.; Davies, A.H.; Bækgaard, N.; Broholm, R.; Cavezzi, A.; Chastanet, S.; De Wolf, M.; Eggen, C.; Giannoukas, A.; Gohel, M.; et al. Editor’s choice—Management of chronic venous disease: Clinical practice guidelines of the European Society for Vascular Surgery (ESVS). Eur. J. Vasc. Endovasc. Surg. 2015, 49, 678–737. [Google Scholar] [CrossRef] [PubMed] [Green Version]
  26. Griendling, K.K.; Sorescu, D.; Lassègue, B.; Ushio-Fukai, M. Modulation of protein kinase activity and gene expression by reactive oxygen species and their role in vascular physiology and pathophysiology. Arterioscler. Thromb. Vasc. Biol. 2000, 20, 2175–2183. [Google Scholar] [CrossRef] [PubMed] [Green Version]
  27. Lim, C.S.; Kiriakidis, S.; Sandison, A.; Paleolog, E.M.; Davies, A.H. Hypoxia-inducible factor pathway and diseases of the vascular wall. J. Vasc. Surg. 2013, 58, 219–230. [Google Scholar] [CrossRef] [PubMed] [Green Version]
  28. Park, C.; Kim, T.M.; Malik, A.B. Transcriptional regulation of endothelial cell and vascular development. Circ. Res. 2013, 112, 1380–1400. [Google Scholar] [CrossRef]
  29. Harris, B.H.L.; Barberis, A.; West, C.M.L.; Buffa, F.M. Gene Expression Signatures as Biomarkers of Tumour Hypoxia. Clin. Oncol. 2015, 27, 547–560. [Google Scholar] [CrossRef]
  30. Jeong, H.W.; Hernández-Rodríguez, B.; Kim, J.M.; Kim, K.P.; Enriquez-Gasca, R.; Yoon, J.; Adams, S.; Schöler, H.R.; Vaquerizas, J.M.; Adams, R.H. Transcriptional regulation of endothelial cell behavior during sprouting angiogenesis. Nat. Commun. 2017, 8, 1–14. [Google Scholar] [CrossRef]
  31. Frismantiene, A.; Philippova, M.; Erne, P.; Resink, T.J. Smooth muscle cell-driven vascular diseases and molecular mechanisms of VSMC plasticity. Cell. Signal. 2018, 52, 48–64. [Google Scholar] [CrossRef]
  32. Chen, H.H.; Stewart, A.F.R. Transcriptomic Signature of Atherosclerosis in the Peripheral Blood: Fact or Fiction? Curr. Atheroscler. Rep. 2016, 18, 77. [Google Scholar] [CrossRef]
  33. Hueso, M.; Mallén, A.; Casas, Á.; Guiteras, J.; Sbraga, F.; Blasco-Lucas, A.; Lloberas, N.; Torras, J.; Cruzado, J.M.; Navarro, E. Integrated miRNA/mRNA counter-expression analysis highlights oxidative stress-related genes CCR7 and FOXO1 as blood markers of coronary arterial disease. Int. J. Mol. Sci. 2020, 21, 1943. [Google Scholar] [CrossRef] [PubMed] [Green Version]
  34. Murphy, J.M.; Jeong, K.; Steve Lim, S.T. FAK family kinases in vascular diseases. Int. J. Mol. Sci. 2020, 21, 3630. [Google Scholar] [CrossRef]
  35. Kullo, I.J.; Leeper, N.J. The Genetic Basis of Peripheral Arterial Disease: Current Knowledge, Challenges, and Future Directions. Circ. Res. 2015, 116, 1551–1560. [Google Scholar] [CrossRef] [Green Version]
  36. Belkin, N.; Damrauer, S.M. Peripheral Arterial Disease Genetics: Progress to Date and Challenges Ahead. Curr. Cardiol. Rep. 2017, 19. [Google Scholar] [CrossRef] [PubMed]
  37. Bogucka-Kocka, A.; Zalewski, D.P.; Ruszel, K.P.; Stępniewski, A.; Gałkowski, D.; Bogucki, J.; Komsta, Ł.; Kołodziej, P.; Zubilewicz, T.; Feldo, M.; et al. Dysregulation of MicroRNA Regulatory Network in Lower Extremities Arterial Disease. Front. Genet. 2019, 10. [Google Scholar] [CrossRef] [Green Version]
  38. Pahl, M.C.; Erdman, R.; Kuivaniemi, H.; Lillvis, J.H.; Elmore, J.R.; Tromp, G. Transcriptional (ChIP-Chip) analysis of ELF1, ETS2, RUNX1 and STAT5 in human abdominal aortic aneurysm. Int. J. Mol. Sci. 2015, 16, 11229–11258. [Google Scholar] [CrossRef] [PubMed] [Green Version]
  39. Butt, H.Z.; Sylvius, N.; Salem, M.K.; Wild, J.B.; Dattani, N.; Sayers, R.D.; Bown, M.J. Microarray-based Gene Expression Profiling of Abdominal Aortic Aneurysm. Eur. J. Vasc. Endovasc. Surg. 2016, 52, 47–55. [Google Scholar] [CrossRef] [Green Version]
  40. Yang, P.; Cai, Z.; Wu, K.; Hu, Y.; Liu, L.; Liao, M. Identification of key microRNAs and genes associated with abdominal aortic aneurysm based on the gene expression profile. Exp. Physiol. 2020, 105, 160–173. [Google Scholar] [CrossRef]
  41. Gurung, R.; Choong, A.M.; Woo, C.C.; Foo, R.; Sorokin, V. Genetic and epigenetic mechanisms underlying vascular smooth muscle cell phenotypic modulation in abdominal aortic aneurysm. Int. J. Mol. Sci. 2020, 21, 1–33. [Google Scholar] [CrossRef] [PubMed]
  42. Zalewski, D.P.; Ruszel, K.P.; Stępniewski, A.; Gałkowski, D.; Bogucki, J.; Komsta, Ł.; Kołodziej, P.; Chmiel, P.; Zubilewicz, T.; Feldo, M.; et al. Dysregulation of microRNA Modulatory Network in Abdominal Aortic Aneurysm. J. Clin. Med. 2020, 9, 1974. [Google Scholar] [CrossRef] [PubMed]
  43. Markovic, J.N.; Shortell, C.K. Genomics of varicose veins and chronic venous insufficiency. Semin. Vasc. Surg. 2013, 26, 2–13. [Google Scholar] [CrossRef]
  44. Grant, Y.; Onida, S.; Davies, A. Genetics in chronic venous disease. Phlebology 2017, 32, 3–5. [Google Scholar] [CrossRef] [Green Version]
  45. Serralheiro, P.; Novais, A.; Cairrão, E.; Maia, C.; Costa Almeida, C.M.; Verde, I. Variability of MMP/TIMP and TGF-β1 receptors throughout the clinical progression of chronic venous disease. Int. J. Mol. Sci. 2018, 19, 6. [Google Scholar] [CrossRef] [PubMed] [Green Version]
  46. Zalewski, D.P.; Ruszel, K.P.; Stępniewski, A.; Gałkowski, D.; Bogucki, J.; Komsta, Ł.; Kołodziej, P.; Chmiel, P.; Zubilewicz, T.; Feldo, M.; et al. Dysregulations of MicroRNA and Gene Expression in Chronic Venous Disease. J. Clin. Med. 2020, 9, 1251. [Google Scholar] [CrossRef]
  47. Shankar, A.; Li, J.; Klein, B.E.K.; Javier Nieto, F.; Klein, R. Serum gamma-glutamyltransferase level and peripheral arterial disease. Atherosclerosis 2008, 199, 102–109. [Google Scholar] [CrossRef]
  48. Cho, Y.K.; Kang, Y.M.; Hwang, J.Y.; Kim, E.H.; Yang, D.H.; Kang, J.W.; Park, J.Y.; Lee, W.J.; Kim, H.K.; Jung, C.H. Association between serum gamma-glutamyltransferase and the progression of coronary artery calcification. Atherosclerosis 2015, 243, 300–306. [Google Scholar] [CrossRef]
  49. Kim, Y.G.; Park, G.M.; Lee, S.B.; Yang, D.H.; Kang, J.W.; Lim, T.H.; Kim, H.K.; Choe, J.; Lee, S.W.; Kim, Y.H. Association of gamma-glutamyl transferase with subclinical coronary atherosclerosis and cardiac outcomes in non-alcoholics. Sci. Rep. 2020, 10, 1–8. [Google Scholar] [CrossRef]
  50. Lippi, G.; Salvagno, G.L.; Targher, G.; Montagnana, M.; Guidi, G.C. Plasma γ-glutamyl transferase activity predicts homocysteine concentration in a large cohort of unselected outpatients. Intern. Med. 2008, 47, 705–707. [Google Scholar] [CrossRef] [PubMed] [Green Version]
  51. Ganguly, P.; Alam, S.F. Role of homocysteine in the development of cardiovascular disease. Nutr. J. 2015, 14, 1–10. [Google Scholar] [CrossRef] [PubMed] [Green Version]
  52. Lenk, G.M.; Tromp, G.; Weinsheimer, S.; Gatalica, Z.; Berguer, R.; Kuivaniemi, H. Whole genome expression profiling reveals a significant role for immune function in human abdominal aortic aneurysms. BMC Genom. 2007, 8, 237. [Google Scholar] [CrossRef] [PubMed] [Green Version]
  53. Zhang, H.; Forman, H.J.; Choi, J. Γ-Glutamyl Transpeptidase in Glutathione Biosynthesis. Methods Enzymol. 2005, 401, 468–483. [Google Scholar] [CrossRef] [PubMed]
  54. Lukic, A.; Ji, J.; Idborg, H.; Samuelsson, B.; Palmberg, L.; Gabrielsson, S.; Rådmark, O. Pulmonary epithelial cancer cells and their exosomes metabolize myeloid cell-derived leukotriene C4to leukotriene D4. J. Lipid Res. 2016, 57, 1659–1669. [Google Scholar] [CrossRef] [PubMed] [Green Version]
  55. Kondeti, V.; Al-Azzam, N.; Duah, E.; Thodeti, C.K.; Boyce, J.A.; Paruchuri, S. Leukotriene D4 and prostaglandin E2 signals synergize and potentiate vascular inflammation in a mast cell-dependent manner through cysteinyl leukotriene receptor 1 and E-prostanoid receptor 3. J. Allergy Clin. Immunol. 2016, 137, 289–298. [Google Scholar] [CrossRef] [Green Version]
  56. Liu, C.; Liu, B.; Liu, L.; Zhang, E.-L.; Sun, B.; Xu, G.; Chen, J.; Gao, Y. Arachidonic acid metabolism pathway is not only dominant in metabolic modulation but associated with phenotypic variation after acute hypoxia exposure. Front. Physiol. 2018, 9, 236. [Google Scholar] [CrossRef] [Green Version]
  57. Pei, B.; Sisu, C.; Frankish, A.; Howald, C.; Habegger, L.; Mu, X.J.; Harte, R.; Balasubramanian, S.; Tanzer, A.; Diekhans, M.; et al. The GENCODE pseudogene resource. Genome Biol. 2012, 13, R51. [Google Scholar] [CrossRef] [PubMed] [Green Version]
  58. Kalyana-Sundaram, S.; Kumar-Sinha, C.; Shankar, S.; Robinson, D.R.; Wu, Y.M.; Cao, X.; Asangani, I.A.; Kothari, V.; Prensner, J.R.; Lonigro, R.J.; et al. Expressed pseudogenes in the transcriptional landscape of human cancers. Cell 2012, 149, 1622–1634. [Google Scholar] [CrossRef] [PubMed] [Green Version]
  59. Kovalenko, T.F.; Patrushev, L.I. Pseudogenes as Functionally Significant Elements of the Genome. Biochemistry 2018, 83, 1332–1349. [Google Scholar] [CrossRef] [PubMed]
  60. Morris, K.V. Long Non-coding RNAs in Human Disease. Curr. Top. Microbiol. Immunol. 2016, 394. [Google Scholar] [CrossRef]
  61. Henras, A.K.; Plisson-Chastang, C.; Humbert, O.; Romeo, Y.; Henry, Y. Synthesis, Function, and Heterogeneity of snoRNA-Guided Posttranscriptional Nucleoside Modifications in Eukaryotic Ribosomal RNAs. Enzymes 2017, 41, 169–213. [Google Scholar] [CrossRef] [PubMed]
  62. Han, W.; Shi, J.; Cao, J.; Dong, B.; Guan, W. Latest advances of long non-coding RNA SNHG5 in human cancers. Onco Targets Ther. 2020, 13, 6393–6403. [Google Scholar] [CrossRef] [PubMed]
  63. Liu, J.; Liao, X.; Zhu, X.; Lv, P.; Li, R. Identification of potential prognostic small nucleolar RNA biomarkers for predicting overall survival in patients with sarcoma. Cancer Med. 2020, 9, 7018–7033. [Google Scholar] [CrossRef]
  64. Zhang, L.; Ma, R.; Gao, M.; Zhao, Y.; Lv, X.; Zhu, W.; Han, L.; Su, P.; Fan, Y.; Yan, Y.; et al. SNORA72 Activates the Notch1/c-Myc Pathway to Promote Stemness Transformation of Ovarian Cancer Cells. Front. Cell Dev. Biol. 2020, 8, 1–11. [Google Scholar] [CrossRef] [PubMed]
  65. Buniello, A.; Macarthur, J.A.L.; Cerezo, M.; Harris, L.W.; Hayhurst, J.; Malangone, C.; McMahon, A.; Morales, J.; Mountjoy, E.; Sollis, E.; et al. The NHGRI-EBI GWAS Catalog of published genome-wide association studies, targeted arrays and summary statistics 2019. Nucleic Acids Res. 2019, 47, D1005–D1012. [Google Scholar] [CrossRef] [PubMed] [Green Version]
  66. Quaresma, A.J.C.; Bugai, A.; Barboric, M. Cracking the control of RNA polymerase II elongation by 7SK snRNP and P-TEFb. Nucleic Acids Res. 2016, 44, 7527–7539. [Google Scholar] [CrossRef] [Green Version]
  67. Cosgrove, M.S.; Ding, Y.; Rennie, W.A.; Lane, M.J.; Hanes, S.D. The bin3 RNA methyltransferase targets 7SK RNA to control transcription and translation. Wiley Interdiscip. Rev. RNA 2012, 3, 633–647. [Google Scholar] [CrossRef] [Green Version]
  68. Cai, Y.; Singh, N.; Li, H. Essential role of Ufm1 conjugation in the hematopoietic system. Exp. Hematol. 2016, 44, 442–446. [Google Scholar] [CrossRef] [Green Version]
  69. Renneville, A.; Van Galen, P.; Canver, M.C.; McConkey, M.; Krill-Burger, J.M.; Dorfman, D.M.; Holson, E.B.; Bernstein, B.E.; Orkin, S.H.; Bauer, D.E.; et al. EHMT1 and EHMT2 inhibition induces fetal hemoglobin expression. Blood 2015, 126, 1930–1939. [Google Scholar] [CrossRef] [Green Version]
  70. Tantawy, A.A.G.; Adly, A.A.M.; El Maaty, M.G.A.; Amin, S.A.G. Subclinical atherosclerosis in young β-thalassemia major patients. Hemoglobin 2009, 33, 463–474. [Google Scholar] [CrossRef]
  71. Salton, M.; Voss, T.C.; Misteli, T. Identification by high-throughput imaging of the histone methyltransferase EHMT2 AS an epigenetic regulator of VEGFA alternative splicing. Nucleic Acids Res. 2014, 42, 13662–13672. [Google Scholar] [CrossRef] [PubMed] [Green Version]
  72. Kikuchi, R.; Nakamura, K.; MacLauchlan, S.; Ngo, D.T.M.; Shimizu, I.; Fuster, J.J.; Katanasaka, Y.; Yoshida, S.; Qiu, Y.; Yamaguchi, T.P.; et al. An antiangiogenic isoform of VEGF-A contributes to impaired vascularization in peripheral artery disease. Nat. Med. 2014, 20, 1464–1471. [Google Scholar] [CrossRef] [PubMed] [Green Version]
  73. Cao, X.; Zhu, N.; Li, L.; Zhang, Y.; Chen, Y.; Zhang, J.; Li, J.; Gao, C. Y-box binding protein 1 regulates ox-LDL mediated inflammatory responses and lipid uptake in macrophages. Free Radic. Biol. Med. 2019, 141, 10–20. [Google Scholar] [CrossRef]
  74. Van Gastel, J.; Boddaert, J.; Jushaj, A.; Premont, R.T.; Luttrell, L.M.; Janssens, J.; Martin, B.; Maudsley, S. GIT2—A keystone in ageing and age-related disease. Ageing Res. Rev. 2018, 43, 46–63. [Google Scholar] [CrossRef] [PubMed]
  75. Wang, X.; Liu, A.H.; Jia, Z.W.; Pu, K.; Chen, K.Y.; Guo, H. Genome-wide DNA methylation patterns in coronary heart disease. Herz 2018, 43, 656–662. [Google Scholar] [CrossRef]
  76. Oesterle, A.; Hofmann Bowman, M.A. S100A12 and the S100/Calgranulins: Emerging Biomarkers for Atherosclerosis and Possibly Therapeutic Targets. Arterioscler. Thromb. Vasc. Biol. 2015, 35, 2496–2507. [Google Scholar] [CrossRef] [Green Version]
  77. Joo, H.C.; Choi, J.W.; Moon, H.; Lee, C.Y.; Yoo, K.J.; Kim, S.W.; Hwang, K.C. Protective effects of kenpaullone on cardiomyocytes following H2O2-induced oxidative stress are attributed to inhibition of connexin 43 degradation by SGSM3. Biochem. Biophys. Res. Commun. 2018, 499, 368–373. [Google Scholar] [CrossRef] [PubMed]
  78. Motoshima, H.; Goldstein, B.J.; Igata, M.; Araki, E. AMPK and cell proliferation—AMPK as a therapeutic target for atherosclerosis and cancer. J. Physiol. 2006, 574, 63–71. [Google Scholar] [CrossRef]
  79. Ghosh, R.; Vinod, V.; Symons, J.D.; Boudina, S. Protein and Mitochondria Quality Control Mechanisms and Cardiac Aging. Cells 2020, 9, 933. [Google Scholar] [CrossRef] [PubMed]
  80. Wetzel, L.; Blanchard, S.; Rama, S.; Beier, V.; Kaufmann, A.; Wollert, T. TECPR1 promotes aggrephagy by direct recruitment of LC3C autophagosomes to lysosomes. Nat. Commun. 2020, 11. [Google Scholar] [CrossRef]
  81. Canault, M.; Alessi, M.C. RasGRP2 structure, function and genetic variants in platelet pathophysiology. Int. J. Mol. Sci. 2020, 21, 1075. [Google Scholar] [CrossRef] [Green Version]
  82. Torres-Do Rego, A.; Barrientos, M.; Ortega-Hernández, A.; Modrego, J.; Gómez-Gordo, R.; Álvarez-Sala, L.A.; Cachofeiro, V.; Gómez-Garre, D. Identification of a Plasma Microrna Signature as Biomarker of Subaneurysmal Aortic Dilation in Patients with High Cardiovascular Risk. J. Clin. Med. 2020, 9, 2783. [Google Scholar] [CrossRef]
  83. Luo, X.Y.; Zhu, X.Q.; Li, Y.; Wang, X.B.; Yin, W.; Ge, Y.S.; Ji, W.M. MicroRNA-150 restores endothelial cell function and attenuates vascular remodeling by targeting PTX3 through the NF-κB signaling pathway in mice with acute coronary syndrome. Cell Biol. Int. 2018, 42, 1170–1181. [Google Scholar] [CrossRef]
  84. Ruland, J.; Hartjes, L. CARD–BCL-10–MALT1 signalling in protective and pathological immunity. Nat. Rev. Immunol. 2019, 19, 118–134. [Google Scholar] [CrossRef] [PubMed]
  85. Selvin, E.; Köttgen, A.; Coresh, J. Kidney function estimated from serum creatinine and cystatin C and peripheral arterial disease in NHANES 1999-2002. Eur. Heart J. 2009, 30, 1918–1925. [Google Scholar] [CrossRef] [PubMed] [Green Version]
  86. Joosten, M.M.; Pai, J.K.; Bertoia, M.L.; Gansevoort, R.T.; Bakker, S.J.L.; Cooke, J.P.; Rimm, E.B.; Mukamal, K.J. β2-Microglobulin, cystatin C, and creatinine and risk of symptomatic peripheral artery disease. J. Am. Heart Assoc. 2014, 3, 1–12. [Google Scholar] [CrossRef] [PubMed] [Green Version]
  87. Bourrier, M.; Ferguson, T.W.; Embil, J.M.; Rigatto, C.; Komenda, P.; Tangri, N. Peripheral Artery Disease: Its Adverse Consequences With and Without CKD. Am. J. Kidney Dis. 2020, 75, 705–712. [Google Scholar] [CrossRef] [PubMed]
  88. Xin, G.; Chen, R.; Zhang, X. Candidate gene and mechanism investigations in congenital obstructive nephropathy based on bioinformatics analysis. Mol. Med. Rep. 2018, 18, 2651–2660. [Google Scholar] [CrossRef] [Green Version]
  89. Jiang, S.; He, H.; Tan, L.; Wang, L.; Su, Z.; Liu, Y.; Zhu, H.; Zhang, M.; Hou, F.F.; Li, A. Proteomic and phosphoproteomic analysis of renal cortex in a salt-load rat model of advanced kidney damage. Sci. Rep. 2016, 6, 1–13. [Google Scholar] [CrossRef]
  90. Love, M.I.; Huber, W.; Anders, S. Moderated estimation of fold change and dispersion for RNA-seq data with DESeq2. Genome Biol. 2014, 15, 1–21. [Google Scholar] [CrossRef] [Green Version]
  91. Centner, V.; Massart, D.L.; De Noord, O.E.; De Jong, S.; Vandeginste, B.M.; Sterna, C. Elimination of Uninformative Variables for Multivariate Calibration. Anal. Chem. 1996, 68, 3851–3858. [Google Scholar] [CrossRef]
  92. Mehmood, T.; Liland, K.H.; Snipen, L.; Sæbø, S. A review of variable selection methods in Partial Least Squares Regression. Chemom. Intell. Lab. Syst. 2012, 118, 62–69. [Google Scholar] [CrossRef]
  93. Chen, H.; Boutros, P.C. VennDiagram: A package for the generation of highly-customizable Venn and Euler diagrams in R. BMC Bioinform. 2011, 12, 35. [Google Scholar] [CrossRef] [PubMed] [Green Version]
  94. Robin, X.; Turck, N.; Hainard, A.; Tiberti, N.; Lisacek, F.; Sanchez, J.C.; Müller, M. pROC: An open-source package for R and S+ to analyze and compare ROC curves. BMC Bioinform. 2011, 12. [Google Scholar] [CrossRef] [PubMed]
  95. Huang, D.W.; Sherman, B.T.; Lempicki, R.A. Systematic and integrative analysis of large gene lists using DAVID bioinformatics resources. Nat. Protoc. 2009, 4, 44–57. [Google Scholar] [CrossRef] [PubMed]
  96. Huang, D.W.; Sherman, B.T.; Lempicki, R.A. Bioinformatics enrichment tools: Paths toward the comprehensive functional analysis of large gene lists. Nucleic Acids Res. 2009, 37, 1–13. [Google Scholar] [CrossRef] [Green Version]
  97. Shannon, P.; Markiel, A.; Ozier, O.; Baliga, N.S.; Wang, J.T.; Ramage, D.; Amin, N.; Schwikowski, B.; Ideker, T. Cytoscape: A software environment for integrated models of biomolecular interaction networks. Genome Res. 2003, 13, 2498–2504. [Google Scholar] [CrossRef] [PubMed]
Figure 1. The comparison of differentially expressed genes in lower extremities arterial disease (LEAD), abdominal aortic aneurysm (AAA) and chronic venous disease (CVD) in relation to healthy controls. (A) The comparisons of differentially expressed genes in LEAD vs. control, AAA vs. control and CVD vs. control comparisons. Genes were obtained using DESeq2 and UVE-PLS methods and unified selection criteria (p value adjusted by Benjamini–Hochberg false discovery rate < 0.001 and reliability score ≥ 8, respectively). The numbers in the middle fields in each Venn diagram represent the amount of genes common for both methods. (B) The comparison of the genes common for DESeq2 and UVE-PLS methods from the Venn diagrams on panel A. The rectangles present gene symbols located in the corresponding fields of the Venn diagram. (C) Boxplot for the log10 of normalized counts of GGT1, which was found as a common gene on the Venn diagram from panel B. Whiskers define range between minimum and maximum value, boxes range between 25% and 75% quartile, horizontal lines inside boxes mark median value. UVE-PLS-Uninformative Variable Elimination by Partial Least Squares.
Ijms 22 03200 g001
Figure 2. Results of functional analysis performed using DAVID website tool for the sets of (A) 12 potentially specific genes for the comparison of lower extremities arterial disease (LEAD) vs. control, (B) 135 potentially specific genes for the comparison of abdominal aortic aneurysm (AAA) vs. control and (C) 370 potentially specific genes for the comparison of chronic venous disease (CVD) vs. control (refer to panel B on the Figure 1). Up to top ten the most enriched terms of Gene Ontology Biological Processing (GOBP), Gene Ontology Cellular Compartment (GOCC), Gene Ontology Molecular Function (GOMF), KEGG (Kyoto Encyclopedia of Genes and Genomes) and Reactome categories were presented. p value—EASE score for enrichment, the thick black vertical line represents p = 0.05 threshold. The numbers in brackets following the names of terms indicate the numbers of associated genes. Due to a large length of some names of Reactome terms on panel C, to make the figure more readable they were shown in shorten form: the full name of “APC/C:Cdh1 mediated degradation of Cdc20” term is “APC/C:Cdh1 mediated degradation of Cdc20 and other APC/C:Cdh1 targeted proteins in late mitosis/early G1”, the full name of “Activation of anterior HOX genes” term is “Activation of anterior HOX genes in hindbrain development during early embryogenesis”.
Ijms 22 03200 g002
Figure 3. The comparison of differentially expressed genes resulted from comparative analysis performed using DESeq2 and UVE-PLS methods between (A) LEAD and AAA groups, (B) LEAD and CVD groups as well as (C) AAA and CVD groups. Genes were selected using unified selection criteria: p value adjusted by Benjamini–Hochberg false discovery rate < 0.001 (for DESeq2 results) and reliability score ≥ 8 (for UVE-PLS results). The number in the middle fields in each Venn diagram represents the number of genes common for both methods. Genes shared by both methods from each comparison (genes from the middle fields in Venn diagrams on panel AC) were selected and compared on the subsequent Venn diagram (D), which shows a lack of sharing genes. AAA—abdominal aortic aneurysm, CVD—chronic venous disease, LEAD—lower extremities arterial disease, UVE-PLS—Uninformative Variable Elimination by Partial Least Squares.
Ijms 22 03200 g003
Figure 4. Differential expression of 21, 58 and 10 genes identified as unique for LEAD vs. AAA, LEAD vs. CVD and AAA vs. CVD comparisons, respectively. (A) Heatmap with clustering of Euclidean distances using complete method. (B) Principal Component Analysis (PCA) plot. LEAD—lower extremities arterial disease, AAA—abdominal aortic aneurysm, CVD—chronic venous disease.
Ijms 22 03200 g004
Figure 5. Results of functional analysis performed using DAVID website tool for the sets of (A) 21 unique genes for LEAD vs. AAA comparison, (B) 58 unique genes for LEAD vs. CVD comparison and (C) 10 unique genes for AAA vs. CVD comparison. Similar to Figure 2, up to ten of the most enriched terms of Gene Ontology Biological Processing (GOBP), Gene Ontology Cellular Compartment (GOCC), Gene Ontology Molecular Function (GOMF), KEGG (Kyoto Encyclopedia of Genes and Genomes) and Reactome categories were presented. p value—EASE score for enrichment, the black vertical line represents p = 0.05 threshold. The number in brackets following the name of terms indicates the number of associated genes. Due to a large length of some names of Gene Ontology terms on panel A, to make this figure clearer, they were shown in shortened form: the full name of “RNA splicing” term is “RNA splicing, via transesterification reactions with bulged adenosine as nucleophile”, the full name of “transferase activity” term is “transferase activity, transferring phosphorus-containing groups”. LEAD—lower extremities arterial disease, AAA—abdominal aortic aneurysm, CVD—chronic venous disease.
Ijms 22 03200 g005
Figure 6. Networks of enriched functional terms and associated genes. The network was constructed using significantly (p < 0.05) enriched terms revealed for 21 unique genes selected from LEAD vs. AAA comparison (A) and 58 unique genes selected from LEAD vs. CVD comparison (B) (refer to Figure 5). Due to the lack of significantly enriched terms for 10 unique genes selected from AAA vs. CVD comparison, all terms presented on Figure 5 were networked (C). GOBP—Gene Ontology Biological Processing, GOCC—Gene Ontology Cellular Compartment, GOMF—Gene Ontology Molecular Function, AAA—abdominal aortic aneurysm, CVD—chronic venous disease LEAD—lower extremities arterial disease.
Ijms 22 03200 g006
Table 1. Clinical characteristics of the study subjects.
CharacteristicLEAD (n = 8)AAA (n = 7)CVD (n = 7)p1
Age62 ± 7.82 266.3 ± 4.03 241.3 ± 4.03 28.273 × 10⁻⁴ 4
48–71 359–71 335–47 3
Gender males/females6 (75%)/2 (25%)6 (85.7%)/3 (42.9%)/0.275 5
1 (14.3%)4 (57.1%)
Body mass index (BMI)28.25 ± 2.07 227.23 ± 2.76 223.36 ± 1.94 26.272 × 10⁻³ 4
25.5–31.2 323.66–30.85 320.94–25.83 3
Risk factors and cardiovascular comorbidities
Smoking never/former/current0 (0%)/6 (75%)/3 (42.9%)/5 (71.4%)/0 (0%)/0.011 5
2 (25%)2 (28.6%)/2 (28.6%)2 (28.6%)
Diabetes type 23 (37.5%)2 (28.6%)0 (0%)0.300 5
Hypertension7 (87.5%)5 (71.4%)0 (0%)9.418 × 10⁻⁴ 5
Coronary artery disease (CAD)2 (25%)1 (14.3%)0 (0%)0.746 5
Myocardial infarction2 (25%)1 (14.3%)0 (0%)0.746 5
Stroke/Transient ischemic attack0 (0%)0 (0%)0 (0%)1.000 5
Hematological and biochemical blood parameters
Red blood cells (M/µl)4.81 ± 0.33 24.96 ± 0.19 24.93 ± 0.31 20.630 4
4.22–5.18 34.56–5.10 34.29–5.21 3
White blood cells (K/µl)5.49 ± 0.69 25.85 ± 0.75 25.58 ± 0.50 20.677 4
4.79–6.70 34.89–6.89 34.67–5.99 3
Platelets (K/µl)348.5 ± 105.5 2379.43 ± 82.26 2368.14 ± 66.26 20.430 4
267–432 3267–501 3295–467 3
Hemoglobin (g/dl)14.22 ± 0.59 213.88 ± 0.52 213.98 ± 0.33 20.415 4
13.45–14.80 313.34–14.60 313.56–14.60 3
Hematocrit (%)40.91 ± 1.15 241.31 ± 1.13 240.24 ± 2.35 20.425 4
38.9–42 339.9–43 337.00–44 3
Creatinine (mmol/L)80.38 ± 11.11 258.86 ± 11.60 258.71 ± 8.75 24.529 × 10⁻³ 4
59–89 344–77 345–67 3
Urea (mmol/L)4.69 ± 0.70 24.61 ± 0.47 24.77 ± 0.98 20.931 4
3.70–6.01 33.89–5.10 33.78–6.37 3
Medication
Statins7 (87.5%)4 (57.1%)0 (0%)2.818 × 10⁻³ 5
Acetylsalicylic acid8 (100%)7 (100%)0 (0%)1.173 × 10⁻⁵ 5
Clopidogrel2 (25%)0 (0%)0 (0%)0.303 5
Beta-adrenergic blockers6 (75%)5 (71.4%)0 (0%)8.375 × 10⁻³ 5
Angiotensin-converting enzyme inhibitor2 (25%)0 (0%)0 (0%)0.303 5
Ca2+ channel blockers3 (37.5%)1 (14.3%)0 (0%)0.270 5
Fibrates3 (37.5%)1 (14.3%)0 (0%)0.270 5
Metformin1 (12.5%)0 (0%)0 (0%)1.000 5
Gliclazide3 (37.5%)2 (28.6%)0 (0%)0.300 5
1 Statistical significance of differences between lower extremities arterial disease (LEAD), abdominal aortic aneurysm (AAA) and chronic venous disease (CVD) groups, 2 mean ± SD, 3 range, 4 p value calculated using Kruskal-Wallis rank sum test, 5 p value calculated using two-sided Fisher’s exact test.
Table 2. Differential expression parameters of 21, 58 and 10 genes identified as unique for LEAD vs. AAA, LEAD vs. CVD and AAA vs. CVD comparisons, respectively. The table presents p (FDR with Benjamini–Hochberg correction) and fold change values received from DESeq2 analysis, PLS coefficients received from UVE-PLS analysis and areas under ROC curves (ROC-AUC) received from ROC analysis. Genes were divided into upregulated and downregulated groups within each comparison and ordered according to increasing p value. Gene symbols without assigned gene names by HUGO Gene Nomenclature Committee Multi-symbol checker (https://www.genenames.org/tools/multi-symbol-checker/, accessed on 20 January 2021) were named as “Unmatched”.
No.Gene SymbolGene NamepFold ChangePLS CoefficientROC-AUC
LEAD vs. AAA—Upregulated Genes
1.SNORD20small nucleolar RNA, C/D box 201.712 × 10−73.3382.746 × 10−31.000
2.SNORA72small nucleolar RNA, H/ACA box 721.205 × 10−42.1031.551 × 10−30.964
3.SNHG5small nucleolar RNA host gene 51.205 × 10−41.9841.541 × 10−31.000
4.SNORA26small nucleolar RNA, H/ACA box 261.358 × 10−42.3651.857 × 10−31.000
5.SNORD82small nucleolar RNA, C/D box 821.489 × 10−42.2061.721 × 10−31.000
6.UFM1ubiquitin fold modifier 12.157 × 10−41.3917.038 × 10−41.000
7.SNORD101small nucleolar RNA, C/D box 1013.292 × 10−42.3521.757 × 10−30.964
8.SNORD91Bsmall nucleolar RNA, C/D box 91B6.538 × 10−42.4931.987 × 10−31.000
9.SNORD111Bsmall nucleolar RNA, C/D box 111B7.373 × 10−42.3371.910 × 10−31.000
LEAD vs. AAA—downregulated genes
10.POLR2ARNA polymerase II subunit A2.583 × 10−50.764−6.306 × 10−41.000
11.AC092620.2Unmatched2.583 × 10−50.401−1.694 × 10−31.000
12.EHMT1euchromatic histone lysine methyltransferase 12.854 × 10−50.744−6.428 × 10−41.000
13.TRAPPC12trafficking protein particle complex 121.313 × 10−40.762−5.972 × 10−40.980
14.RN7SKP286RN7SK pseudogene 2861.313 × 10−40.143−3.159 × 10−30.964
15.ZNF592zinc finger protein 5925.389 × 10−40.740−6.769 × 10−41.000
16.YBX1Y-box binding protein 15.525 × 10−40.625−9.797 × 10−40.982
17.RN7SKP208RN7SK pseudogene 2085.525 × 10−40.292−1.571 × 10−30.982
18.RN7SKP45RN7SK pseudogene 455.525 × 10−40.213−2.861 × 10−30.982
19.RN7SKP7RN7SK pseudogene 75.525 × 10−40.199−1.277 × 10−31.000
20.MAU2MAU2 sister chromatid cohesion factor6.538 × 10−40.804−4.892 × 10−40.982
21.GIT2GIT ArfGAP 29.198 × 10−40.768−5.651 × 10−41.000
LEAD vs. CVD—upregulated genes
1.CALM2P2calmodulin 2 pseudogene 24.927 × 10−62.6221.572 × 10−31.000
2.RP11-490H24.5Unmatched9.430 × 10−63.2311.296 × 10−31.000
3.RP11-334L9.1Unmatched1.438 × 10−53.2361.468 × 10−30.982
4.API5P1apoptosis inhibitor 5 pseudogene 13.627 × 10−52.5921.284 × 10−31.000
5.PDIA3P1protein disulfide isomerase family A member 3 pseudogene 13.627 × 10−51.9681.090 × 10−31.000
6.ARL6IP1ADP ribosylation factor like GTPase 6 interacting protein 13.627 × 10−51.5408.133 × 10−41.000
7.RP11-1033A18.1Unmatched4.570 × 10−52.2661.376 × 10−31.000
8.EIF4A1P10eukaryotic translation initiation factor 4A1 pseudogene 105.014 × 10−52.0261.131 × 10−31.000
9.RP11-262D11.2Unmatched5.014 × 10−51.9131.072 × 10−30.946
10.S100A10S100 calcium binding protein A105.014 × 10−51.7239.939 × 10−41.000
11.CFL1P4cofilin 1 pseudogene 45.355 × 10−52.8261.400 × 10−31.000
12.AC078899.1Unmatched5.355 × 10−52.4111.334 × 10−30.982
13.CAP1P2CAP1 pseudogene 27.322 × 10−52.1041.191 × 10−31.000
14.HNRNPA1P7heterogeneous nuclear ribonucleoprotein A1 pseudogene 77.322 × 10−51.8141.017 × 10−31.000
15.FCGR3BFc fragment of IgG receptor IIIb9.228 × 10−53.1351.917 × 10−31.000
16.CTNNA1P1catenin alpha 1 pseudogene 19.228 × 10−53.0301.412 × 10−30.982
17.PSME1proteasome activator subunit 19.228 × 10−51.7441.083 × 10−31.000
18.RP11-6B6.3Unmatched1.126 × 10−43.2061.602 × 10−31.000
19.MSNP1moesin pseudogene 11.602 × 10−42.0591.213 × 10−31.000
20.ACTR3P2ACTR3 pseudogene 21.640 × 10−42.5641.369 × 10−31.000
21.RP13-104F24.3Unmatched1.640 × 10−42.1438.857 × 10−40.982
22.HSP90B3Pheat shock protein 90 beta family member 3, pseudogene1.987 × 10−42.3731.277 × 10−31.000
23.DYNC1I2P1dynein cytoplasmic 1 intermediate chain 2 pseudogene 12.024 × 10−42.4411.344 × 10−31.000
24.EIF3FP3eukaryotic translation initiation factor 3 subunit F pseudogene 32.996 × 10−41.9761.059 × 10−30.964
25.C1orf216chromosome 1 open reading frame 2163.042 × 10−41.4746.989 × 10−40.982
26.ANXA2P2annexin A2 pseudogene 23.767 × 10−42.3681.258 × 10−31.000
27.MNDAmyeloid cell nuclear differentiation antigen4.212 × 10−42.1981.322 × 10−31.000
28.AC104651.2Unmatched4.292 × 10−43.3499.316 × 10−40.946
29.PGDP1phosphogluconate dehydrogenase pseudogene 14.292 × 10−42.6531.284 × 10−30.982
30.PSME2P2proteasome activator subunit 2 pseudogene 24.425 × 10−42.5471.508 × 10−31.000
31.CDC42P6cell division cycle 42 pseudogene 64.693 × 10−41.9811.051 × 10−31.000
32.HSP90B2Pheat shock protein 90 beta family member 2, pseudogene5.142 × 10−42.0481.107 × 10−31.000
33.HSPA9P1heat shock protein family A (Hsp70) member 9 pseudogene 15.302 × 10−41.9308.806 × 10−41.000
34.C1QBcomplement C1q B chain5.647 × 10−45.4922.159 × 10−30.964
35.CTB-52I2.4Unmatched5.855 × 10−42.0771.013 × 10−30.982
36.RP11-286H14.4Unmatched5.907 × 10−41.9329.926 × 10−41.000
37.SETP14SET pseudogene 146.672 × 10−41.7859.681 × 10−41.000
38.CALM2P4calmodulin 2 pseudogene 46.970 × 10−42.3291.066 × 10−31.000
39.GLUD2glutamate dehydrogenase 27.874 × 10−41.8708.908 × 10−40.982
40.EIF3Ceukaryotic translation initiation factor 3 subunit C8.845 × 10−41.6709.814 × 10−41.000
41.SDCBPP2syndecan binding protein pseudogene 29.306 × 10−42.4541.164 × 10−31.000
42.SRRM1P3serine/arginine repetitive matrix 1 pseudogene 39.306 × 10−42.0441.077 × 10−31.000
43.S100A12S100 calcium binding protein A129.443 × 10−42.9721.516 × 10−30.946
LEAD vs. CVD—downregulated genes
44.TSC2TSC complex subunit 23.328 × 10−60.765−5.314 × 10−41.000
45.SGSM3small G protein signaling modulator 35.014 × 10−50.723−5.758 × 10−41.000
46.TECPR1tectonin beta-propeller repeat containing 16.319 × 10−50.716−6.552 × 10−41.000
47.RASGRP2RAS guanyl releasing protein 27.322 × 10−50.663−7.661 × 10−40.964
48.GLI4GLI family zinc finger 41.484 × 10−40.671−6.852 × 10−41.000
49.PPP6R2protein phosphatase 6 regulatory subunit 21.640 × 10−40.773−5.375 × 10−41.000
50.TBC1D27PTBC1 domain family member 27, pseudogene1.806 × 10−40.220−2.347 × 10−31.000
51.D2HGDHD-2-hydroxyglutarate dehydrogenase2.024 × 10−40.589−9.321 × 10−40.964
52.DNAH1dynein axonemal heavy chain 12.532 × 10−40.727−5.605 × 10−41.000
53.PAM16presequence translocase associated motor 163.180 × 10−40.526−1.073 × 10−30.982
54.HIP1Rhuntingtin interacting protein 1 related3.236 × 10−40.489−1.198 × 10−31.000
55.FAM167Afamily with sequence similarity 167 member A4.088 × 10−40.331−1.221 × 10−30.982
56.PIDD1p53-induced death domain protein 14.292 × 10−40.682−6.748 × 10−41.000
57.HECTD4HECT domain E3 ubiquitin protein ligase 45.855 × 10−40.785−4.282 × 10−40.982
58.POLRMTRNA polymerase mitochondrial6.453 × 10−40.710−5.682 × 10−41.000
AAA vs. CVD—downregulated genes
1.SNORA11small nucleolar RNA, H/ACA box 112.066 × 10−60.392−1.585 × 10−30.980
2.SNORD64small nucleolar RNA, C/D box 644.692 × 10−60.354−1.471 × 10−30.959
3.MIR150microRNA 1502.022 × 10−50.274−1.996 × 10−30.959
4.SNORD94small nucleolar RNA, C/D box 943.480 × 10−50.441−1.229 × 10−30.939
5.MALT1MALT1 paracaspase1.177 × 10−40.762−4.413 × 10−41.000
6.SNORD127small nucleolar RNA, C/D box 1271.519 × 10−40.550−9.698 × 10−40.959
7.SNORA14Bsmall nucleolar RNA, H/ACA box 14B4.364 × 10−40.672−6.430 × 10−40.959
8.STMN3stathmin 34.598 × 10−40.603−8.031 × 10−40.939
9.TCP11L2t-complex 11 like 27.061 × 10−40.689−6.071 × 10−41.000
10.SNORA60small nucleolar RNA, H/ACA box 609.366 × 10−40.641−7.161 × 10−40.959
AAA—abdominal aortic aneurysm, CVD—chronic venous disease, LEAD—lower extremities arterial disease, ROC—receiver operating characteristics, UVE-PLS—Uninformative Variable Elimination by Partial Least Squares.
Table 3. Correlation analysis between characteristics of studied groups (age, BMI, creatinine level) and expression of 21, 58 and 10 genes identified as unique for LEAD vs. AAA, LEAD vs. CVD and AAA vs. CVD comparisons, respectively. The table presents genes correlated with statistical significance (Benjamini–Hochberg FDR adjusted p < 0.05) and with the absolute value of Spearman correlation coefficient R ≥ 0.6 (the entire correlation results are provided in Supplementary File 2.
ComparisonAgeBMICreatinine
Gene SymbolRpGene SymbolRpGene SymbolRp
LEAD vs. AAAnonenonePOLR2A−0.652.91 × 10−3
ZNF592−0.625.25 × 10−3
TRAPPC12−0.607.01 × 10−3
LEAD vs. CVDPSME2P20.691.27 × 10−3TECPR1−0.762.25 × 10−4RP11−262D11.20.726.68 × 10−4
FCGR3B0.691.35 × 10−3PIDD−0.752.97 × 10−4SRRM1P30.709.06 × 10−4
API5P10.671.83 × 10−3PSME10.672.01 × 10−3SDCBPP20.709.66 × 10−4
ACTR3P20.652.80 × 10−3D2HGDH−0.662.42 × 10−3ARL6IP10.671.83 × 10−3
CDC42P60.643.80 × 10−3HSP90B3P0.653.04 × 10−3HNRNPA1P70.671.83 × 10−3
HSP90B2P0.634.24 × 10−3PPP6R2−0.643.39 × 10−3API5P10.671.94 × 10−3
PIDD1−0.624.70 × 10−3EIF3C0.623.41 × 10−3AC104651.20.662.39 × 10−3
SGSM3−0.624.79 × 10−3HSPA9P10.606.72 × 10−3EIF3FP30.652.85 × 10−3
CAP1P20.624.89 × 10−3 RP11-286H14.40.652.88 × 10−3
RP11-6B6.30.625.08 × 10−3 CTNNA1P10.643.25 × 10−3
RP11-490H24.50.625.14 × 10−3 DYNC1I2P10.643.54 × 10−3
RP13-104F24.30.615.55 × 10−3 CTB-52I2.40.625.49 × 10−3
CTB-52I2.40.615.65 × 10−3
HSP90B3P0.615.77 × 10−3
CTNNA1P10.606.83 × 10−3
AAA vs. CVDSNORD64−0.681.40 × 10−3nonenone
STMN3−0.662.20 × 10−3
MIR150−0.652.99 × 10−3
MALT1−0.634.39 × 10−3
None—no genes meeting selection criteria (R ≥ 0.6 and corrected p < 0.05), R—Spearman correlation coefficient, BMI—body mass index, AAA—abdominal aortic aneurysm, CVD—chronic venous disease, LEAD—lower extremities arterial disease.
Table 4. Relationships between categorical characteristics of study subjects (smoking and hypertension status, medication with statins, acetylsalicylic acid and beta-adrenergic blockers) and expression of 89 genes selected from LEAD vs. AAA, LEAD vs. CVD and AAA vs. CVD comparisons. The table presents genes with statistically significant relationship (Benjamini–Hochberg FDR adjusted p < 0.05) obtained from two-sided Mann–Whitney U test (the entire results are provided in Supplementary File 2).
ComparisonHypertension StatusStatins MedicationAcetylsalicylic Acid
Gene SymbolpGene SymbolpGene SymbolpGene SymbolpGene Symbolp
LEAD vs. AAAnonenonenone
LEAD vs. CVDGLI48.09 × 10−3FAM167A2.05 × 10−2FCGR3B2.09 × 10−3SGSM35.22 × 10−3D2HGDH1.09 × 10−2
MNDA3.52 × 10−2C1orf2164.76 × 10−2GLI42.09 × 10−3CDC42P66.02 × 10−3DYNC1I2P11.09 × 10−2
HSP90B2P2.09 × 10−3EIF3C6.02 × 10−3EIF3FP31.09 × 10−2
PSME2P22.09 × 10−3EIF4A1P106.02 × 10−3PGDP11.09 × 10−2
TECPR12.09 × 10−3PSME16.02 × 10−3RASGRP21.09 × 10−2
HSP90B3P2.32 × 10−3RP11-6B6.36.02 × 10−3SDCBPP21.09 × 10−2
PIDD12.32 × 10−3ANXA2P27.34 × 10−3CALM2P41.38 × 10−2
RP11-490H24.52.32 × 10−3CAP1P27.34 × 10−3FAM167A1.38 × 10−2
RP13-104F24.32.32 × 10−3HIP1R7.34 × 10−3RP11-262D11.21.38 × 10−2
HSPA9P13.04 × 10−3MSNP17.34 × 10−3TBC1D27P1.38 × 10−2
PDIA3P13.04 × 10−3POLRMT7.34 × 10−3C1orf2161.82 × 10−2
SETP143.04 × 10−3RP11-1033A18.17.34 × 10−3TSC21.82 × 10−2
ACTR3P23.91 × 10−3CALM2P29.06 × 10−3SRRM1P33.11 × 10−2
API5P13.91 × 10−3CTB-52I2.49.06 × 10−3AC104651.23.90 × 10−2
C1QB3.91 × 10−3CTNNA1P19.06 × 10−3CFL1P43.90 × 10−2
HNRNPA1P73.91 × 10−3GLUD29.06 × 10−3HECTD44.76 × 10−2
RP11-286H14.45.22 × 10−3MNDA9.06 × 10−3PAM164.76 × 10−2
RP11-334L9.15.22 × 10−3AC078899.11.09 × 10−2S100A104.76 × 10−2
AAA vs. CVDnonenoneTCP11L26.02 × 10−3STMN31.38 × 10−2MIR1503.11 × 10−2
MALT16.02 × 10−3
None—no genes meeting selection criteria (corrected p < 0.05), AAA—abdominal aortic aneurysm, CVD—chronic venous disease, LEAD—lower extremities arterial disease.
Table 5. Gene types of 21, 58 and 10 genes identified as specific for LEAD vs. AAA, LEAD vs. CVD and AAA vs. CVD comparisons, respectively. Gene types were harvested from Ensembl genome browser release 102 (http://www.ensembl.org/index.html, accessed on 20 January 2021).
Direction of RegulationGene TypeGene SymbolsNumber in up-/Downregulated Group of Genes%
LEAD vs. AAA
upsnoRNASNORA26, SNORA72, SNORD101, SNORD111B, SNORD20, SNORD826/966.7
protein codingUFM11/911.1
lncRNASNHG51/911.1
sense intronicSNORD91B1/911.1
downprotein coding POLR2A, EHMT1, TRAPPC12, ZNF592, YBX1, MAU2, GIT27/1258.3
misc RNARN7SKP208, RN7SKP286, RN7SKP45, RN7SKP74/1233.3
lncRNAAC092620.21/128.3
LEAD vs. CVD
uppseudogeneAC078899.1, AC104651.2, ACTR3P2, ANXA2P2, API5P1, CALM2P2, CALM2P4, CAP1P2, CDC42P6, CFL1P4, CTB-52I2.4, CTNNA1P1, DYNC1I2P1, EIF3FP3, EIF4A1P10, HNRNPA1P7, HSP90B2P, HSP90B3P, HSPA9P1, MSNP1, PDIA3P1, PGDP1, PSME2P2, RP11-1033A18.1, RP11-262D11.2, RP11-286H14.4, RP11-334L9.1, RP11-490H24.5, RP11-6B6.3, RP13-104F24.3, SDCBPP2, SETP14, SRRM1P333/4376.7
protein codingARL6IP1, C1orf216, C1QB, EIF3C, FCGR3B, GLUD2, MNDA, PSME1, S100A10, S100A1210/4323.3
downprotein codingD2HGDH, DNAH1, FAM167A, GLI4, HECTD4, HIP1R, PAM16, PIDD1, POLRMT, PPP6R2, RASGRP2, SGSM3, TECPR1, TSC214/1593.3
pseudogeneTBC1D27P1/156.7
AAA vs. CVD
downsnoRNASNORA11, SNORA14B, SNORA60, SNORD127, SNORD64, SNORD946/1060
protein codingMALT1, STMN3, TCP11L23/1030
miRNAMIR1501/1010
AAA—abdominal aortic aneurysm, CVD—chronic venous disease, LEAD—lower extremities arterial disease, lncRNA—long non-coding RNA, miRNA—microRNA, misc RNA—miscellaneous RNA, snoRNA—small nucleolar RNA.
Publisher’s Note: MDPI stays neutral with regard to jurisdictional claims in published maps and institutional affiliations.

