
The Importance of Free Fatty Chain Length on the Lipid Organization in the Long Periodicity Phase

 and
and 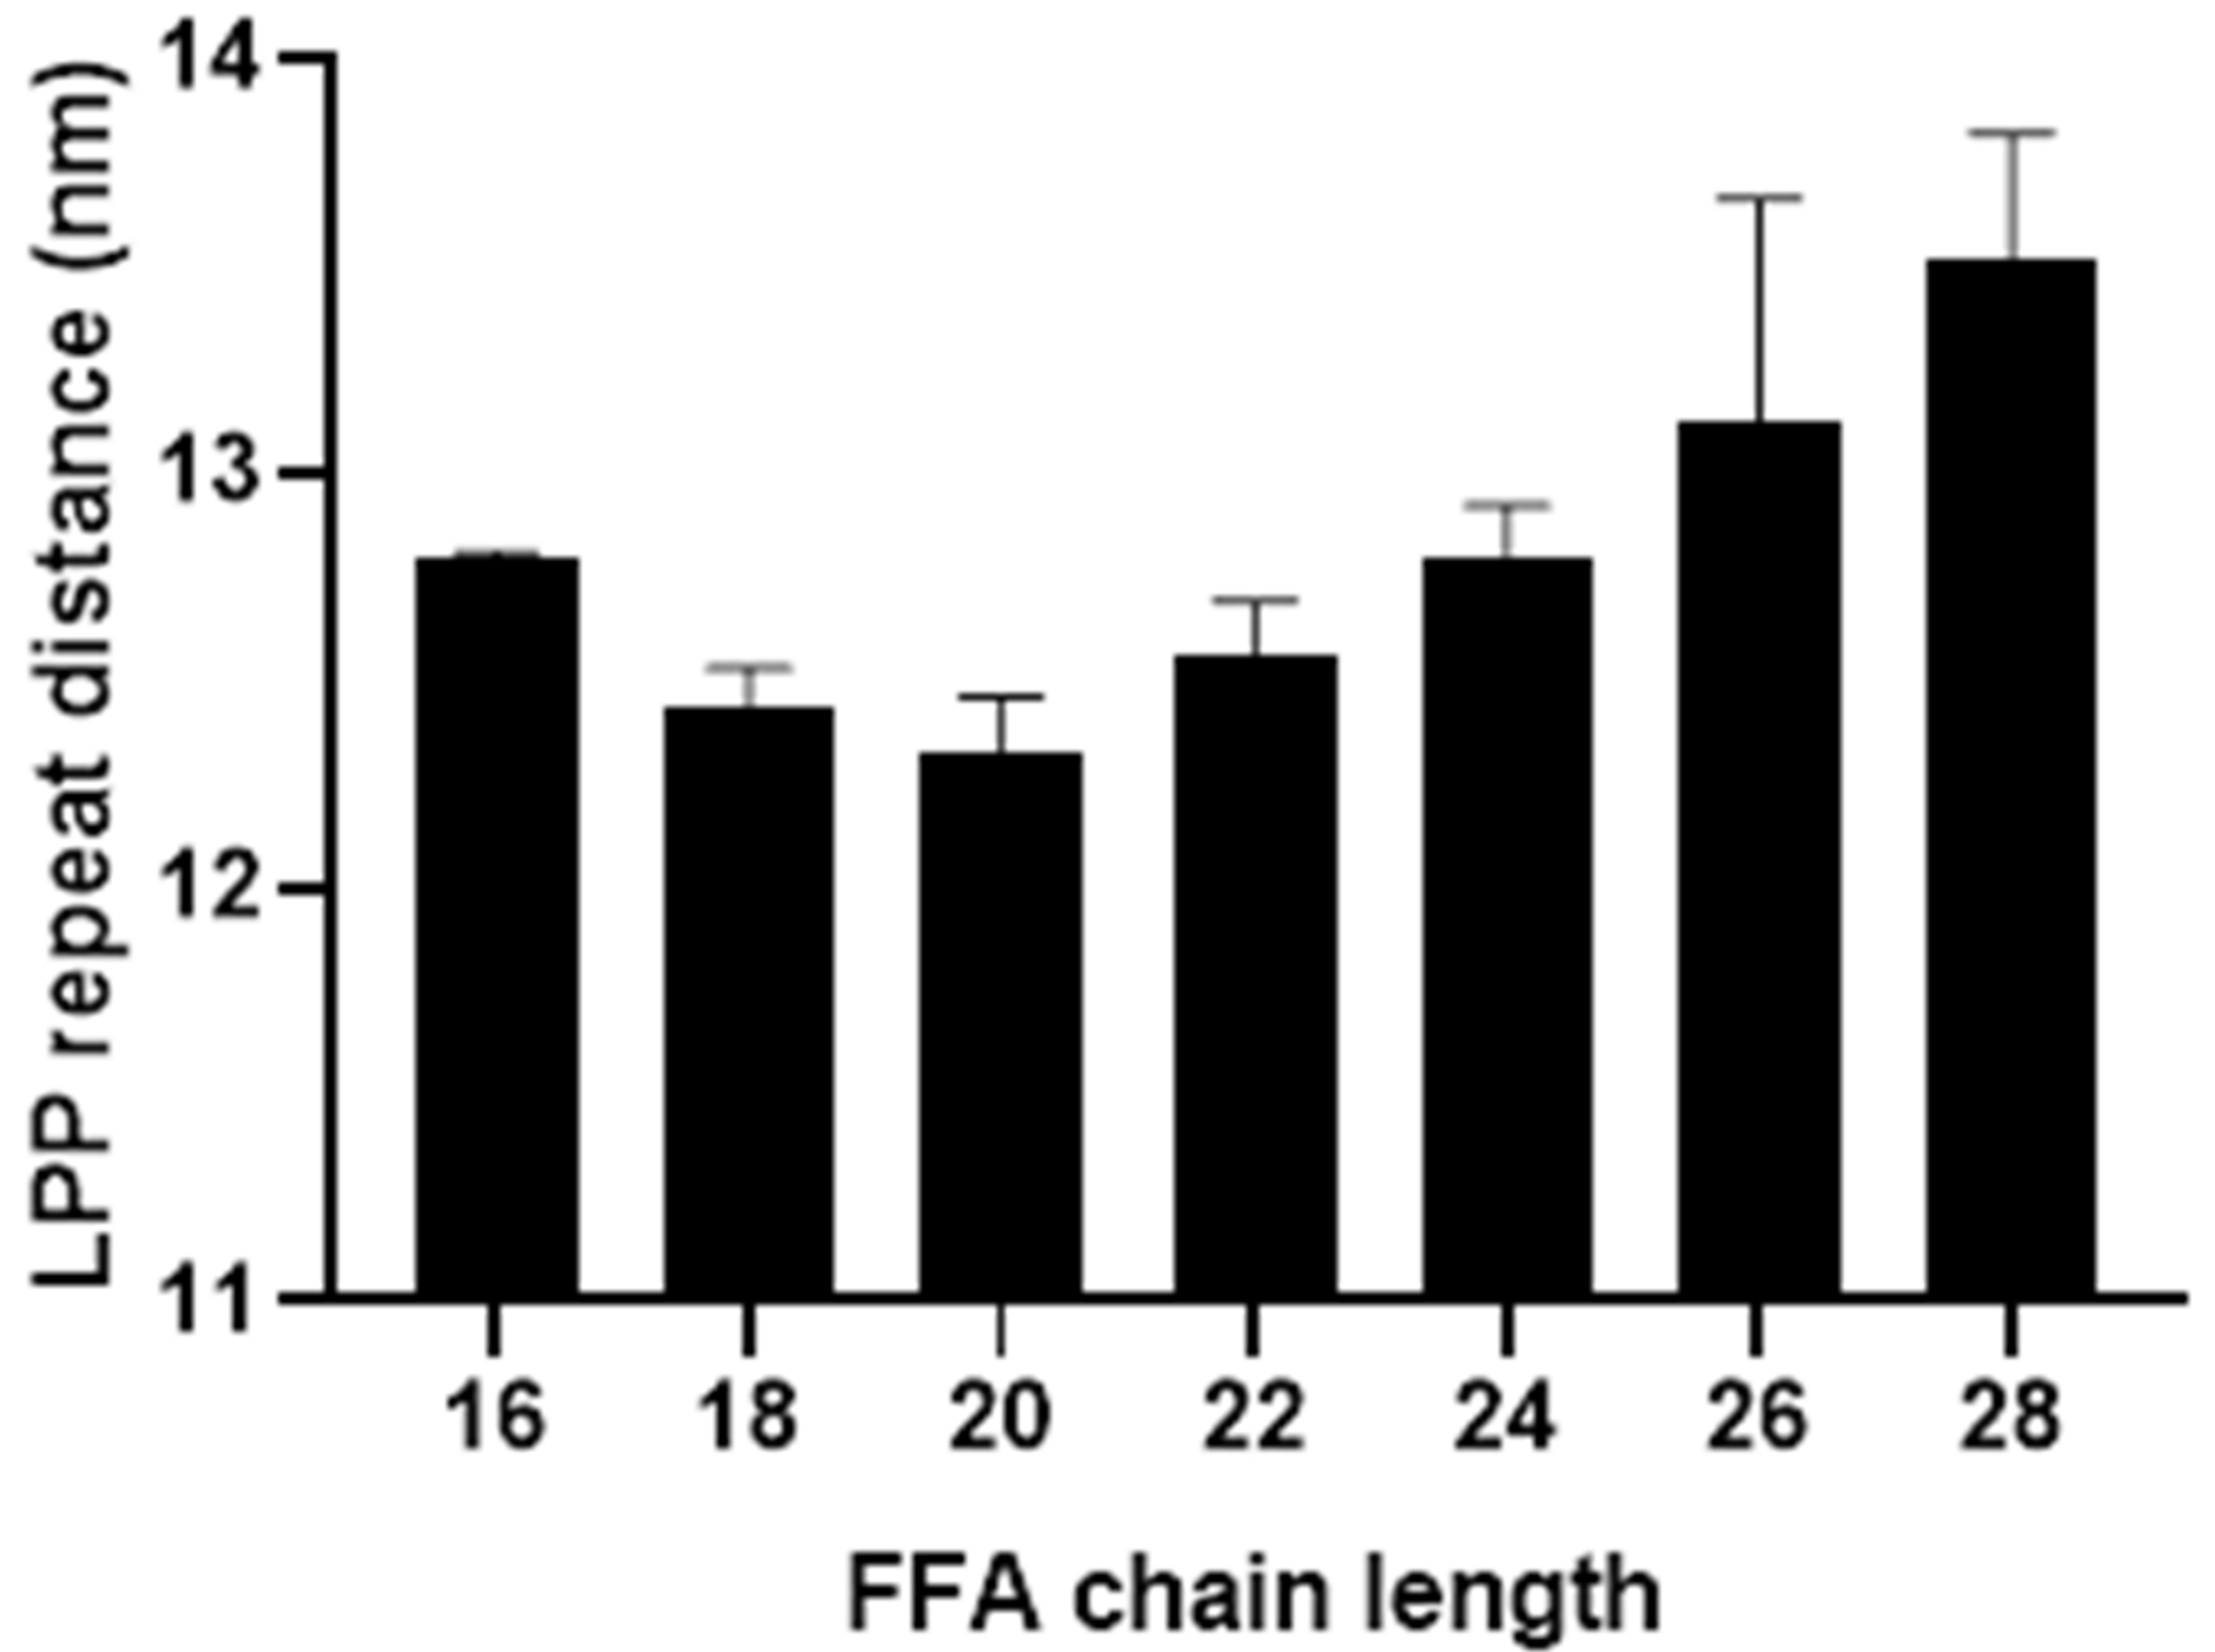
Abstract
:1. Introduction
2. Materials and Methods
2.1. Materials
2.2. Lipid Matrix Models
2.3. Small Angle X-ray Diffraction (SAXD)
2.4. FTIR Measurements
2.5. Trans Epidermal Water Loss (TEWL) Measurements
3. Results
3.1. Behavioural Changes Due to Increasingly Shorter FFAs Are Not Categorically Linear
3.2. An Optimal Barrier Function Is Possible with Increased Shorter FFAs Content, within a Finite Range
4. Conclusions
Supplementary Materials
Author Contributions
Funding
Institutional Review Board Statement
Informed Consent Statement
Data Availability Statement
Acknowledgments
Conflicts of Interest
References
- Blank, I.H. Cutaneous Barriers, From the Research Laboratories of the Department of Dermatology of the Harvard Medical School at the Massachusetts General Hospital, Boston, Massachusetts 02114. J. Investig. Dermatol. 1965, 45, 249–256. [Google Scholar] [CrossRef] [PubMed] [Green Version]
- Elias, P.M. Epidermal Barrier Function: Intercellular Lamellar Lipid Structures, Origin, Composition and Metabolism. J. Control. Release 1991, 15, 199–208. [Google Scholar] [CrossRef]
- Bouwstra, J.A.; Gooris, G.S.; Bras, W.; Downing, D.T. Lipid Organization in Pig Stratum Corneum. J. Lipid Res. 1995, 36, 685–695. [Google Scholar] [CrossRef]
- Hill, J.R.; Wertz, P.W. Molecular Models of the Intercellular Lipid Lamellae from Epidermal Stratum Corneum. Biochim. Biophys. Acta (BBA) Biomembr. 2003, 1616, 121–126. [Google Scholar] [CrossRef] [Green Version]
- Bouwstra, J.; Gooris, G.; Ponec, M. The Lipid Organisation of the Skin Barrier: Liquid and Crystalline Domains Coexist in Lamellar Phases. J. Biol. Phys. 2002, 28, 211–223. [Google Scholar] [CrossRef] [PubMed]
- Boncheva, M.; Damien, F.; Normand, V. Molecular Organization of the Lipid Matrix in Intact Stratum Corneum using ATR-FTIR Spectroscopy. Biochim. Biophys. Acta (BBA) Biomembr. 2008, 1778, 1344–1355. [Google Scholar] [CrossRef] [Green Version]
- Groen, D.; Gooris, G.S.; Bouwstra, J.A. Model Membranes Prepared with Ceramide EOS, Cholesterol and Free Fatty Acids Form a Unique Lamellar Phase. Langmuir 2010, 26, 4168–4175. [Google Scholar] [CrossRef] [PubMed]
- Bouwstra, J.A.; Gooris, G.S.; Cheng, K.; Weerheim, A.; Bras, W.; Ponec, M. Phase Behavior of Isolated Skin Lipids. J. Lipid Res. 1996, 37, 999–1011. [Google Scholar] [CrossRef]
- Bouwstra, J.A.; Cheng, K.; Gooris, G.S.; Weerheim, A.; Ponec, M. The Role of Ceramides 1 and 2 in the Stratum Corneum Lipid Organisation. Biochim. Biophys. Acta (BBA) Lipids Lipid Metab. 1996, 1300, 177–186. [Google Scholar] [CrossRef]
- De Jager, M.W.; Gooris, G.S.; Dolbnya, I.P.; Ponec, M.; Bouwstra, J.A. Modelling the Stratum Corneum Lipid Organisation with Synthetic Lipid Mixtures: The Importance of Synthetic Ceramide Composition. Biochim. Biophys. Acta Biomembr. 2004, 1664, 132–140. [Google Scholar] [CrossRef] [Green Version]
- Bouwstra, J.A.; Gooris, G.S.; Dubbelaar, F.E.R.; Ponec, M.; Weerheim, A.M. pH, Cholesterol Sulfate, and Fatty Acids Affect the Stratum Corneum Lipid Organization. J. Investig. Dermatol. Symp. Proc. 1998, 3, 69–74. [Google Scholar] [CrossRef] [PubMed] [Green Version]
- Van Smeden, J.; Bouwstra, J.A. Stratum Corneum Lipids: Their Role for the Skin Barrier Function in Healthy Subjects and Atopic Dermatitis Patients. Curr. Probl. Dermatol. 2016, 49, 8–26. [Google Scholar]
- Sahle, F.F.; Gebre-Mariam, T.; Dobner, B.; Wohlrab, J.; Neubert, R.H.H. Skin Diseases Associated with the Depletion of Stratum Corneum Lipids and Stratum Corneum Lipid Substitution Therapy. Skin Pharmacol. Physiol. 2015, 28, 42–55. [Google Scholar] [CrossRef]
- Seth, D.; Cheldize, K.; Brown, D.; Freeman, E.F. Global Burden of Skin Disease: Inequities and Innovations. Curr. Dermatol. Rep. 2017, 6, 204–210. [Google Scholar] [CrossRef]
- Uche, L.E.; Gooris, G.S.; Bouwstra, J.A.; Beddoes, C.M. Barrier Capability of Skin Lipid Models: Effect of Ceramides and Free Fatty Acid Composition. Langmuir 2019, 35, 15376–15388. [Google Scholar] [CrossRef] [PubMed]
- Oguri, M.; Gooris, G.S.; Bito, K.; Bouwstra, J.A. The Effect of the Chain Length Distribution of Free Fatty Acids on the Mixing Properties of Stratum Corneum Model Membranes. Biochim. Biophys. Acta (BBA) Biomembr. 2014, 1838, 1851–1861. [Google Scholar] [CrossRef] [PubMed] [Green Version]
- Van Smeden, J.; Boiten, W.A.; Hankemeier, T.; Rissmann, R.; Bouwstra, J.A.; Vreeken, R.J. Combined LC/MS-platform for Analysis of all Major Stratum Corneum Lipids, and the Profiling of Skin Substitutes. Biochim. Biophys. Acta (BBA) Mol. Cell Biol. Lipids 2014, 1841, 70–79. [Google Scholar] [CrossRef]
- Van Smeden, J.; Janssens, M.; Kaye, E.C.J.; Caspers, P.J.; Lavrijsen, A.P.; Vreeken, R.J.; Bouwstra, J.A. The Importance of Free Fatty Acid Chain Length for the Skin Barrier Function in Atopic Eczema Patients. Exp. Dermatol. 2014, 23, 45–52. [Google Scholar] [CrossRef]
- Van Smeden, J.; Janssens, M.; Boiten, W.A.; van Drongelen, V.; Furio, L.; Vreeken, R.J.; Hovnanian, A.; Bouwstra, J.A. Intercellular Skin Barrier Lipid Composition and Organization in Netherton Syndrome Patients. J. Investig. Dermatol. 2014, 134, 1238–1245. [Google Scholar] [CrossRef] [Green Version]
- Paz Ramos, A.; Lafleur, M. Chain Length of Free Fatty Acids Influences the Phase Behavior of Stratum Corneum Model Membranes. Langmuir 2015, 31, 11621–11629. [Google Scholar] [CrossRef]
- Chen, X.; Kwak, S.; Lafleur, M.; Bloom, M.; Kitson, N.; Thewalt, J. Fatty Acids Influence “Solid” Phase Formation in Models of Stratum Corneum Intercellular Membranes. Langmuir 2007, 23, 5548–5556. [Google Scholar] [CrossRef]
- Motta, S.; Monti, M.; Sesana, S.; Caputo, R.; Carelli, S.; Ghidoni, R. Ceramide Composition of the Psoriatic Scale. Biochim. Biophys. Acta Mol. Basis Dis. 1993, 1182, 147–151. [Google Scholar] [CrossRef]
- Wertz, P.W.; Downing, D.T. Epidermal Lipids. In Physiology, Biochemistry and Molecular Biology of the Skin; Goldsmith, L.A., Ed.; Oxford University Press: Oxford, UK, 1991; pp. 205–235. [Google Scholar]
- Gooris, G.S.; Kamran, M.; Kros, A.; Moore, D.J.; Bouwstra, J.A. Interactions of Dipalmitoylphosphatidylcholine with Ceramide-Based Mixtures. Biochim. Biophys. Acta Biomembr. 2018, 1860, 1272–1281. [Google Scholar] [CrossRef] [PubMed]
- Uche, L.E.; Gooris, G.S.; Beddoes, C.M.; Bouwstra, J.A. New Insight into Phase Behavior and Permeability of Skin Lipid Models Based on Sphingosine and Phytosphingosine Ceramides. Biochim. Biophys. Acta Biomembr. 2019, 1861, 1317–1328. [Google Scholar] [CrossRef] [PubMed]
- Wojdyr, M. Fityk: A General-Purpose Peak Fitting Program. J. Appl. Crystallogr. 2010, 43, 1126–1128. [Google Scholar] [CrossRef]
- Ouimet, J.; Lafleur, M. Hydrophobic Match between Cholesterol and Saturated Fatty Acid Is Required for the Formation of Lamellar Liquid Ordered Phases. Langmuir 2004, 20, 7474–7481. [Google Scholar] [CrossRef]
- Mojumdar, E.H.; Gooris, G.S.; Barlow, D.J.; Lawrence, M.J.; Deme, B.; Bouwstra, J.A. Skin Lipids: Localization of Ceramide and Fatty Acid in the Unit Cell of the Long Periodicity Phase. Biophys. J. 2015, 108, 2670–2679. [Google Scholar] [CrossRef] [Green Version]
- Beddoes, C.M.; Gooris, G.S.; Foglia, F.; Ahmadi, D.; Barlow, D.J.; Lawrence, M.J.; Demé, B.; Bouwstra, J.A. Arrangement of Ceramides in the Skin: Sphingosine Chains Localize at a Single Position in Stratum Corneum Lipid Matrix Models. Langmuir 2020, 36, 10270–10278. [Google Scholar] [CrossRef] [PubMed]
- Frolov, V.A.; Shnyrova, A.V.; Zimmerberg, J. Lipid Polymorphisms and Membrane Shape. Cold Spring Harb. Perspect. Biol. 2011, 3, a004747. [Google Scholar] [CrossRef] [PubMed] [Green Version]
- Rogers, J.; Harding, C.; Mayo, A.; Banks, J.; Rawlings, A. Stratum Corneum Lipids: The Effect of Ageing and the Seasons. Arch. Dermatol. Res. 1996, 288, 765–770. [Google Scholar] [CrossRef] [PubMed]
- Ishikawa, J.; Shimotoyodome, Y.; Ito, S.; Miyauchi, Y.; Fujimura, T.; Kitahara, T.; Hase, T. Variations in the Ceramide Profile in Different Seasons and Regions of the Body Contribute to Stratum Corneum Functions. Arch. Dermatol. Res. 2013, 305, 151–162. [Google Scholar] [CrossRef]
- Brief, E.; Kwak, S.; Cheng, J.T.J.; Kitson, N.; Thewalt, J.; Lafleur, M. Phase Behavior of an Equimolar Mixture of N-Palmitoyl-d-erythro-sphingosine, Cholesterol, and Palmitic Acid, a Mixture with Optimized Hydrophobic Matching. Langmuir 2009, 25, 7523–7532. [Google Scholar] [CrossRef]
- Dahlen, B.; Pascher, I. Molecular Arrangements in Sphingolipids. Crystal structure of N-tetracosanoylphytosphingosine. Acta Crystallogr. B 1972, 28, 2396–2404. [Google Scholar] [CrossRef]
- Janssens, M.; Gooris, G.S.; Bouwstra, J.A. Infrared Spectroscopy Studies of Mixtures Prepared with Synthetic Ceramides Varying in Head Group Architecture: Coexistence of Liquid and Crystalline Phases. Biochim. Biophys. Acta Biomembr. 2009, 1788, 732–742. [Google Scholar] [CrossRef] [Green Version]
- Uchiyama, M.; Oguri, M.; Mojumdar, E.H.; Gooris, G.S.; Bouwstra, J.A. Free Fatty Acids Chain Length Distribution Affects the Permeability of Skin Lipid Model Membranes. Biochim. Biophys. Acta Biomembr. 2016, 1858, 2050–2059. [Google Scholar] [CrossRef] [PubMed]
- Janssens, M.; van Smeden, J.; Gooris, G.S.; Bras, W.; Portale, G.; Caspers, P.J.; Vreeken, R.J.; Hankemeier, T.; Kezic, S.; Wolterbeek, R.; et al. Increase in Short-Chain Ceramides Correlates with an Altered Lipid Organization and Decreased Barrier Function in Atopic Eczema Patients. J. Lipid Res. 2012, 53, 2755–2766. [Google Scholar] [CrossRef] [Green Version]
- Ishikawa, J.; Narita, H.; Kondo, N.; Hotta, M.; Takagi, Y.; Masukawa, Y.; Kitahara, T.; Takema, Y.; Koyano, S.; Yamazaki, S.; et al. Changes in the Ceramide Profile of Atopic Dermatitis Patients. J. Investig. Dermatol. 2010, 130, 2511–2514. [Google Scholar] [CrossRef] [Green Version]
- Di Nardo, A.; Wertz, P.; Gianneti, A.; Seidenari, S. Ceramide and Cholesterol Composition of the Skin of Patients with Atopic Dermatitis. Acta Derm. Venereol. 1998, 78, 27–30. [Google Scholar] [CrossRef] [PubMed] [Green Version]
- Imokawa, G.; Abe, A.; Jin, K.; Higaki, Y.; Kawashima, M.; Hidano, A. Decreased Level of Ceramides in Stratum Corneum of Atopic Dermatitis: An Etiologic Factor in Atopic Dry Skin? J. Investig. Dermatol. 1991, 96, 523–526. [Google Scholar] [CrossRef] [Green Version]


Publisher’s Note: MDPI stays neutral with regard to jurisdictional claims in published maps and institutional affiliations. |
© 2021 by the authors. Licensee MDPI, Basel, Switzerland. This article is an open access article distributed under the terms and conditions of the Creative Commons Attribution (CC BY) license (https://creativecommons.org/licenses/by/4.0/).
Share and Cite
Beddoes, C.M.; Rensen, D.E.; Gooris, G.S.; Malfois, M.; Bouwstra, J.A. The Importance of Free Fatty Chain Length on the Lipid Organization in the Long Periodicity Phase. Int. J. Mol. Sci. 2021, 22, 3679. https://0-doi-org.brum.beds.ac.uk/10.3390/ijms22073679
Beddoes CM, Rensen DE, Gooris GS, Malfois M, Bouwstra JA. The Importance of Free Fatty Chain Length on the Lipid Organization in the Long Periodicity Phase. International Journal of Molecular Sciences. 2021; 22(7):3679. https://0-doi-org.brum.beds.ac.uk/10.3390/ijms22073679
Chicago/Turabian StyleBeddoes, Charlotte M., Denise E. Rensen, Gert S. Gooris, Marc Malfois, and Joke A. Bouwstra. 2021. "The Importance of Free Fatty Chain Length on the Lipid Organization in the Long Periodicity Phase" International Journal of Molecular Sciences 22, no. 7: 3679. https://0-doi-org.brum.beds.ac.uk/10.3390/ijms22073679