Article

FeIII, CuII and ZnII Complexes of the Rigid 9-Oxido-phenalenone Ligand—Spectroscopy, Electrochemistry, and Cytotoxic Properties

1
Department für Chemie, Institut für Anorganische Chemie, Universität zu Köln, Greinstraße 6, D-50939 Köln, Germany
2
Institute of Medicinal and Pharmaceutical Chemistry, Technische Universität Braunschweig, Beethovenstrasse 55, D-38106 Braunschweig, Germany
*
Author to whom correspondence should be addressed.
Int. J. Mol. Sci. 2021, 22(8), 3976; https://0-doi-org.brum.beds.ac.uk/10.3390/ijms22083976
Submission received: 30 March 2021 / Revised: 7 April 2021 / Accepted: 7 April 2021 / Published: 12 April 2021

Abstract

:
The three complexes [Fe(opo)3], [Cu(opo)2], and [Zn(opo)2] containing the non-innocent anionic ligand opo (opo = 9-oxido-phenalenone, Hopo = 9-hydroxyphenalonone) were synthesised from the corresponding acetylacetonates. [Zn(opo)2] was characterised using 1H nuclear magnetic resonance (NMR) spectroscopy, the paramagnetic [Fe(opo)3] and [Cu(opo)2] by electron paramagnetic resonance (EPR) spectroscopy. While the EPR spectra of [Cu(opo)2] and [Cu(acac)2] in dimethylformamide (DMF) solution are very similar, a rather narrow spectrum was observed for [Fe(opo)3] in tetrahydrofuran (THF) solution in contrast to the very broad spectrum of [Fe(acac)3] in THF (Hacac = acetylacetone, 2,4-pentanedione; acac = acetylacetonate). The narrow, completely isotropic signal of [Fe(opo)3] disagrees with a metal-centred S = 5/2 spin system that is observed in the solid state. We assume spin-delocalisation to the opo ligand in the sense of an opo to FeIII electron transfer. All compounds show several electrochemical opo-centred reduction waves in the range of −1 to −3 V vs. the ferrocene/ferrocenium couple. However, for CuII and FeIII the very first one-electron reductions are metal-centred. Electronic absorption in the UV to vis range are due to π–π* transitions in the opo core, giving Hopo and [Zn(opo)2] a yellow to orange colour. The structured bands ranging from 400 to 500 for all compounds are assigned to the lowest energy π−π* transitions. They show markedly higher intensities and slight shifts for the CuII (brown) and FeIII (red) complexes and we assume admixing metal contributions (MLCT for CuII, LMCT for FeIII). For both complexes long-wavelength absorptions assignable to d–d transitions were detected. Detailed spectroelectrochemical experiments confirm both the electrochemical and the optical assignments. Hopo and the complexes [Cu(opo)2], [Zn(opo)2], and [Fe(opo)3] show antiproliferative activities against HT-29 (colon cancer) and MCF-7 (breast cancer) cell lines in the range of a few µM, comparable to cisplatin under the same conditions.

1. Introduction

Although 9-hydroxyphenalenone (Hopo) was first synthesised 80 years ago [1], till about 10 years ago the coordination chemistry of the anionic 9-oxido-phenalenone (opo) ligand (Scheme 1, left) was rather underdeveloped. Most of the reports were on the proton tautomerism [2,3,4,5,6,7,8,9] and tunnelling effects [10] of the Hopo molecule which are far more pronounced than for the corresponding parent acetyl acetone system. When coordinating deprotonated opo to metals, stable six-ring chelates stabilise the complexes and two one-electron ligand-centred reductions (opo/opo2− and opo2−/opo3−) and one one-electron oxidation of the ligand (opo/opo) should be accessible (Scheme 1, right). The 13 e opo and the 15 e opo•2− are radical species. Not surprisingly, opo complexes of the main group elements Be, B have been investigated till today towards their conducting abilities [11,12,13,14,15,16].
In contrast to the simplest β-diketonate ligand acetylacetonate (acac) (Scheme 1), which has been used extensively to coordinate main group and transition metals [17,18,19,20], opo complexes are expected to be quite similar to the corresponding acac complexes, but were rather scarce till about 2010. Early reports on opo complexes of MnII, FeIII, CoII, NiII, CuII, ZnII, and UO22+ do not contain detailed characterisations or applications [21,22,23]. A number of main-group metal complexes containing BIII [11,12,13,14,15,16], SiIV [24], GeIV [24], BeII [11,21], or AlIII [21,25] or the f-elements NdIII [25,26], EuIII [25,26,27], DyIII [25,28], ErIII [25,26], and YbIII [25,26] were studied till 2010, the latter with interesting luminescence properties.
In a benchmarking study of the opo complexes of RhI, PdII and PtII, their cytotoxic activities against HL60 human acute myeloid leukemia cell lines were reported in 2006 to be comparable to that of cisplatin [29]. After that, the opo PtII complex [Pt(opo)(NH3)2]+ was studied through DFT calculations alongside other PtII-containing complexes with anti-cancer activities [30], and very recently [Pt(opo)(dach)](NO3) (dach = 1,2-diaminocyclohexane) was found to have high antiproliferative activity in a murine NSCLC (lung cancer) tumour model [31]. This is not surprising since derivatives of Hopo [32,33] and especially the naturally occurring derivatives Hypocrellin A and B (Scheme 1) have been studied for quite some time for their cytotoxic properties [34,35,36]. Furthermore, Hypocrellin derivatives [37,38] and complexes of ZnII [39], CuII [40], CoIII [41], AuIII, and PtIV [42] were investigated for their photonuclease activity. Moreover, a Hypocrellin A ZnII complex was reported for the optical recognition of pyrophosphate [43].
Since about 2010, researchers have recognised the enormous potential of the so-called non-innocent ligand opo with its high similarity to the o-semiquinones (Scheme 1) [18,44,45,46,47,48]. In complexes of non-innocent ligands, the ligands can have variable charges and oxidation states, thus making the metal oxidation state ambiguous [18]. Opo complexes of main-group and transition metals are therefore intensely studied for their magnetic, electron- and charge-transfer phenomena [44,45,46,47,48,49,50,51,52,53,54,55] as well as for their use in electroactive materials [51,52,53,54,55,56,57,58,59] or in electron transfer or related catalysis [53,55,57,60,61,62,63,64,65,66,67,68,69,70].
Herein we report on a novel facile synthesis of the simple complexes [Fe(opo)3], [Cu(opo)2], and [Zn(opo)2] alongside with electrochemical and spectroelectrochemical studies and their anti-proliferative properties against the cancer cell-lines HT-29 and MCF-7 We will relate our results to recent benchmarking studies in which these complexes were applied in various fields, thus giving a brief account on the interesting development the 3d transition metal complexes of the opo ligand over the last 10 years. For comparison we have also studied the acetylacetonate derivatives [Fe(acac)3], [Cu(acac)2], [Zn(acac)2] to probe the impact of the delocalised system of the opo ligand.

2. Results and Discussion

2.1. Determination of the pKa values of Hopo and Hacac

Hopo is completely insoluble in H2O and also mixtures of H2O and MeCN or dimethylformamide (DMF) did not allow dissolving the compound. So we embarked on determining the pKa values of Hopo and Hacac in MeCN solution using Kim’s voltammetric method [71]. We observed a shift peak-shift on the first reduction wave of 1,4-benzoquinone in the presence of Hopo of 192 mV in MeCN solution which translates to a pKa value of 20.7. The corresponding shift for Hacac was 354 mV which corresponds to a pKa value of 17.8. The reported pKa values of Hypocrellin A and Hacac in H2O are about 7 and 9, respectively which is in keeping with the expected slightly higher acidity of the phenol protons in Hyprocrellin A and the resonance stabilisation (see Scheme 1) compared with Hacac. In MeCN solution Hopo is less acidic than Hacac, which is probably due to the lack of stabilisation of the resonance form of opo with two negative charges on the oxygen atoms and a positive charge on the remote phenyl core (Scheme 1).

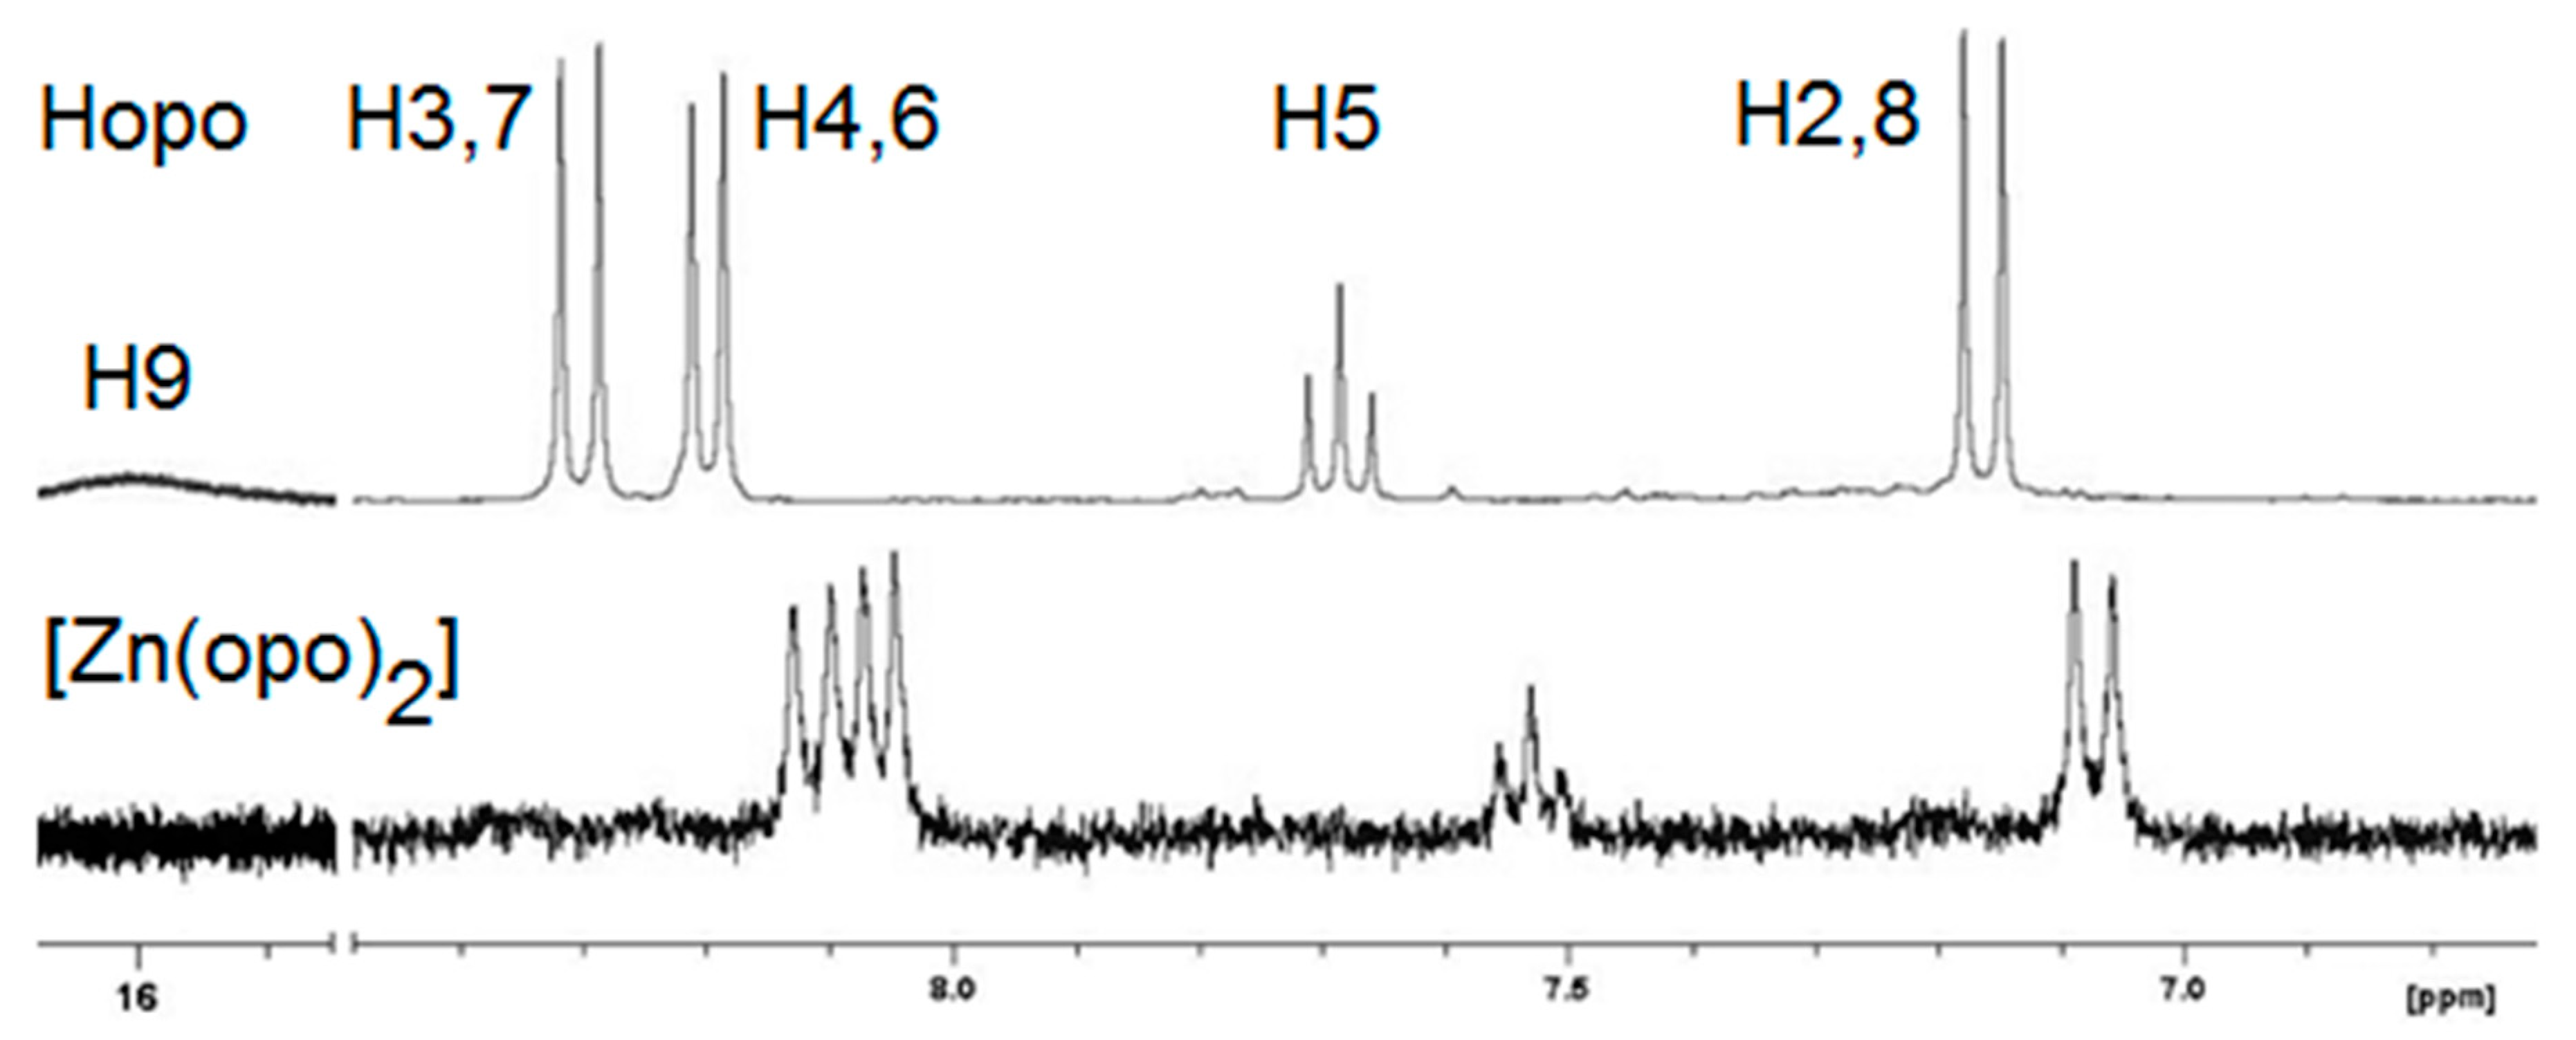
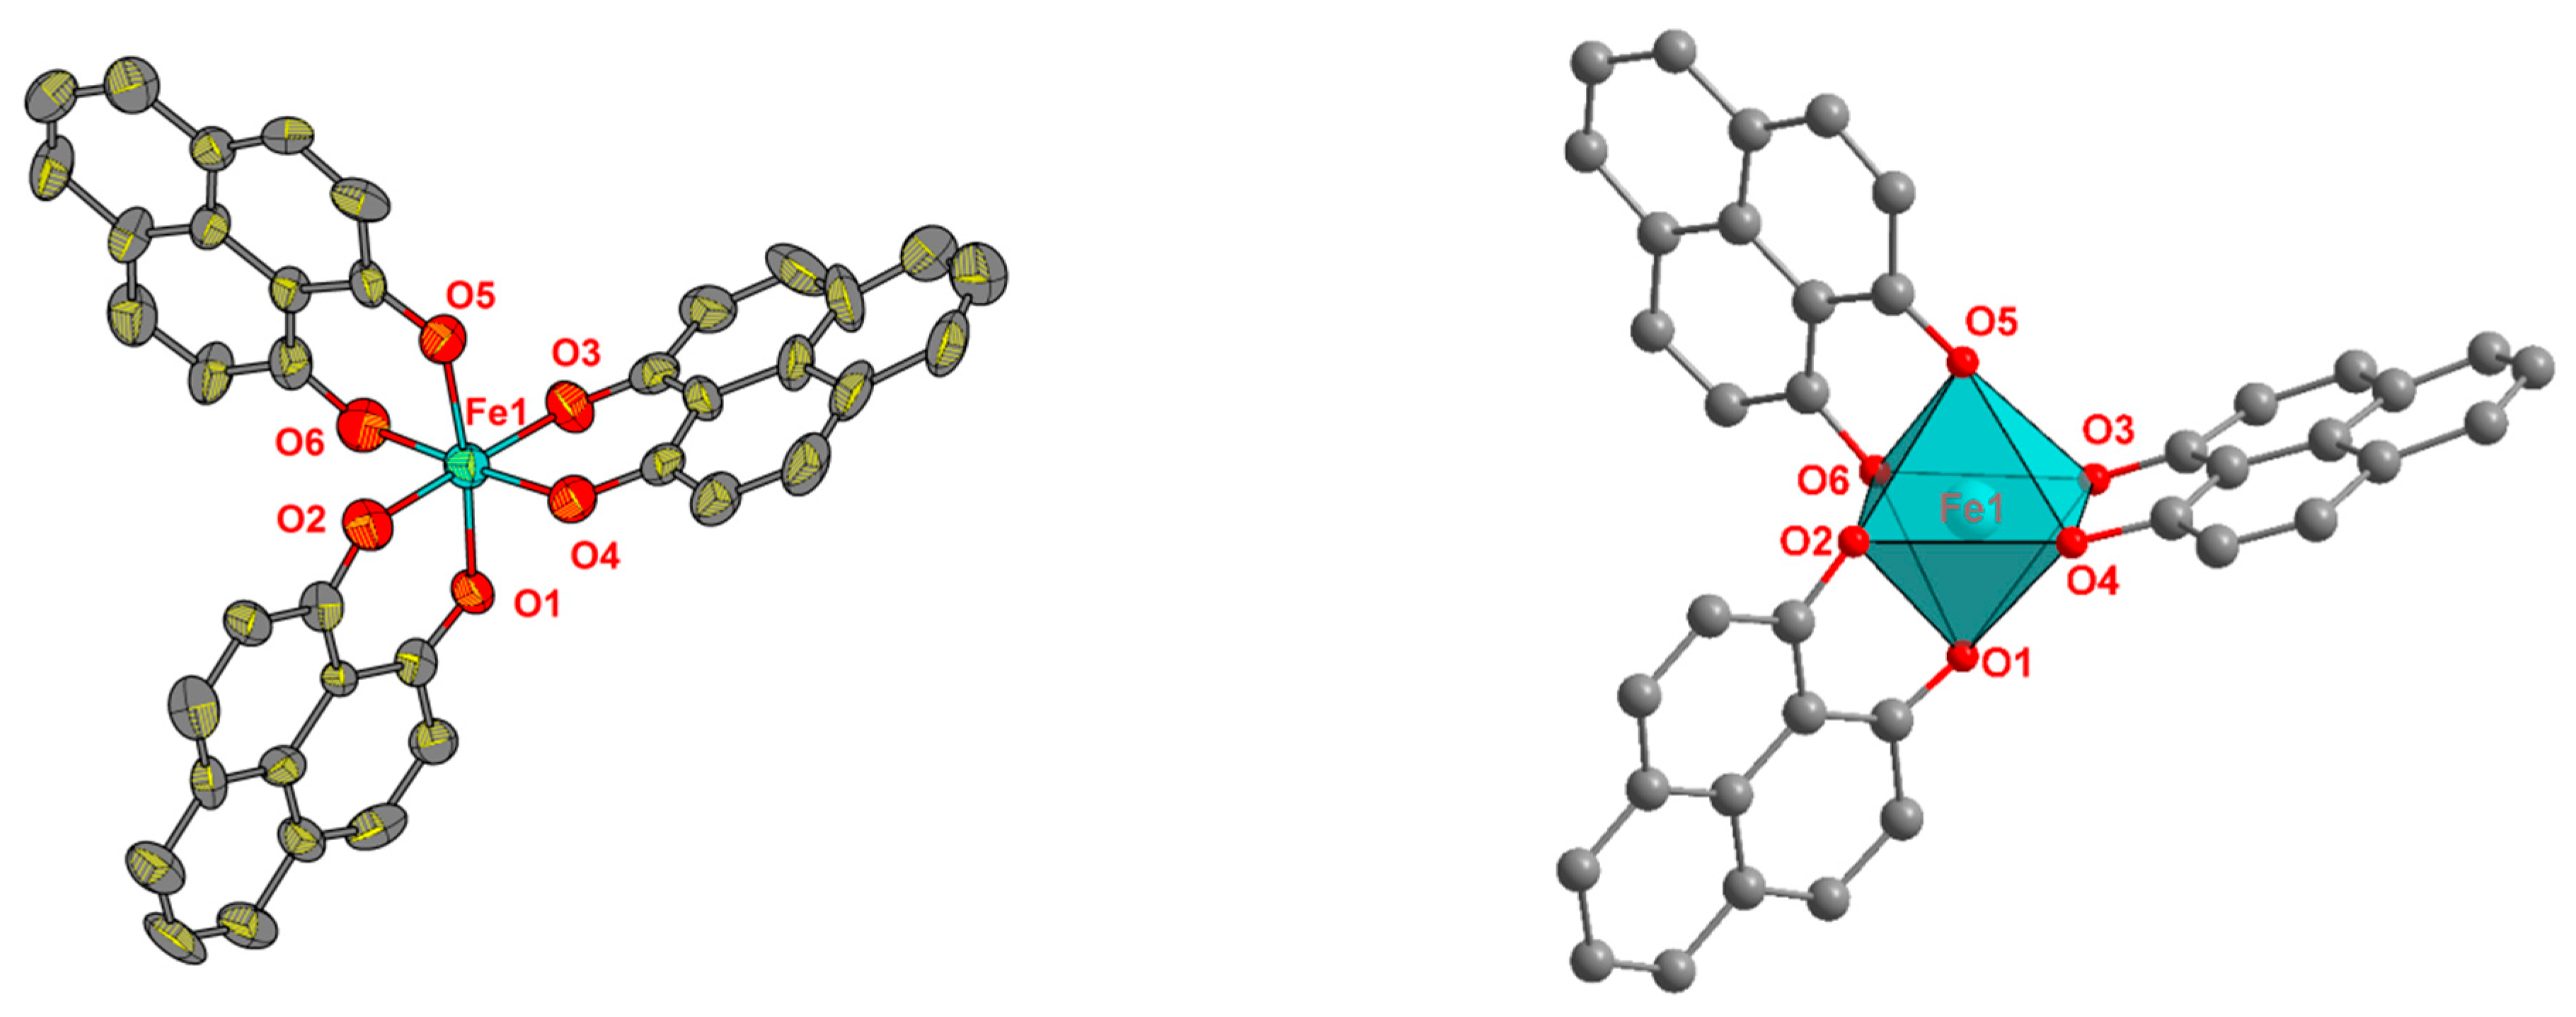
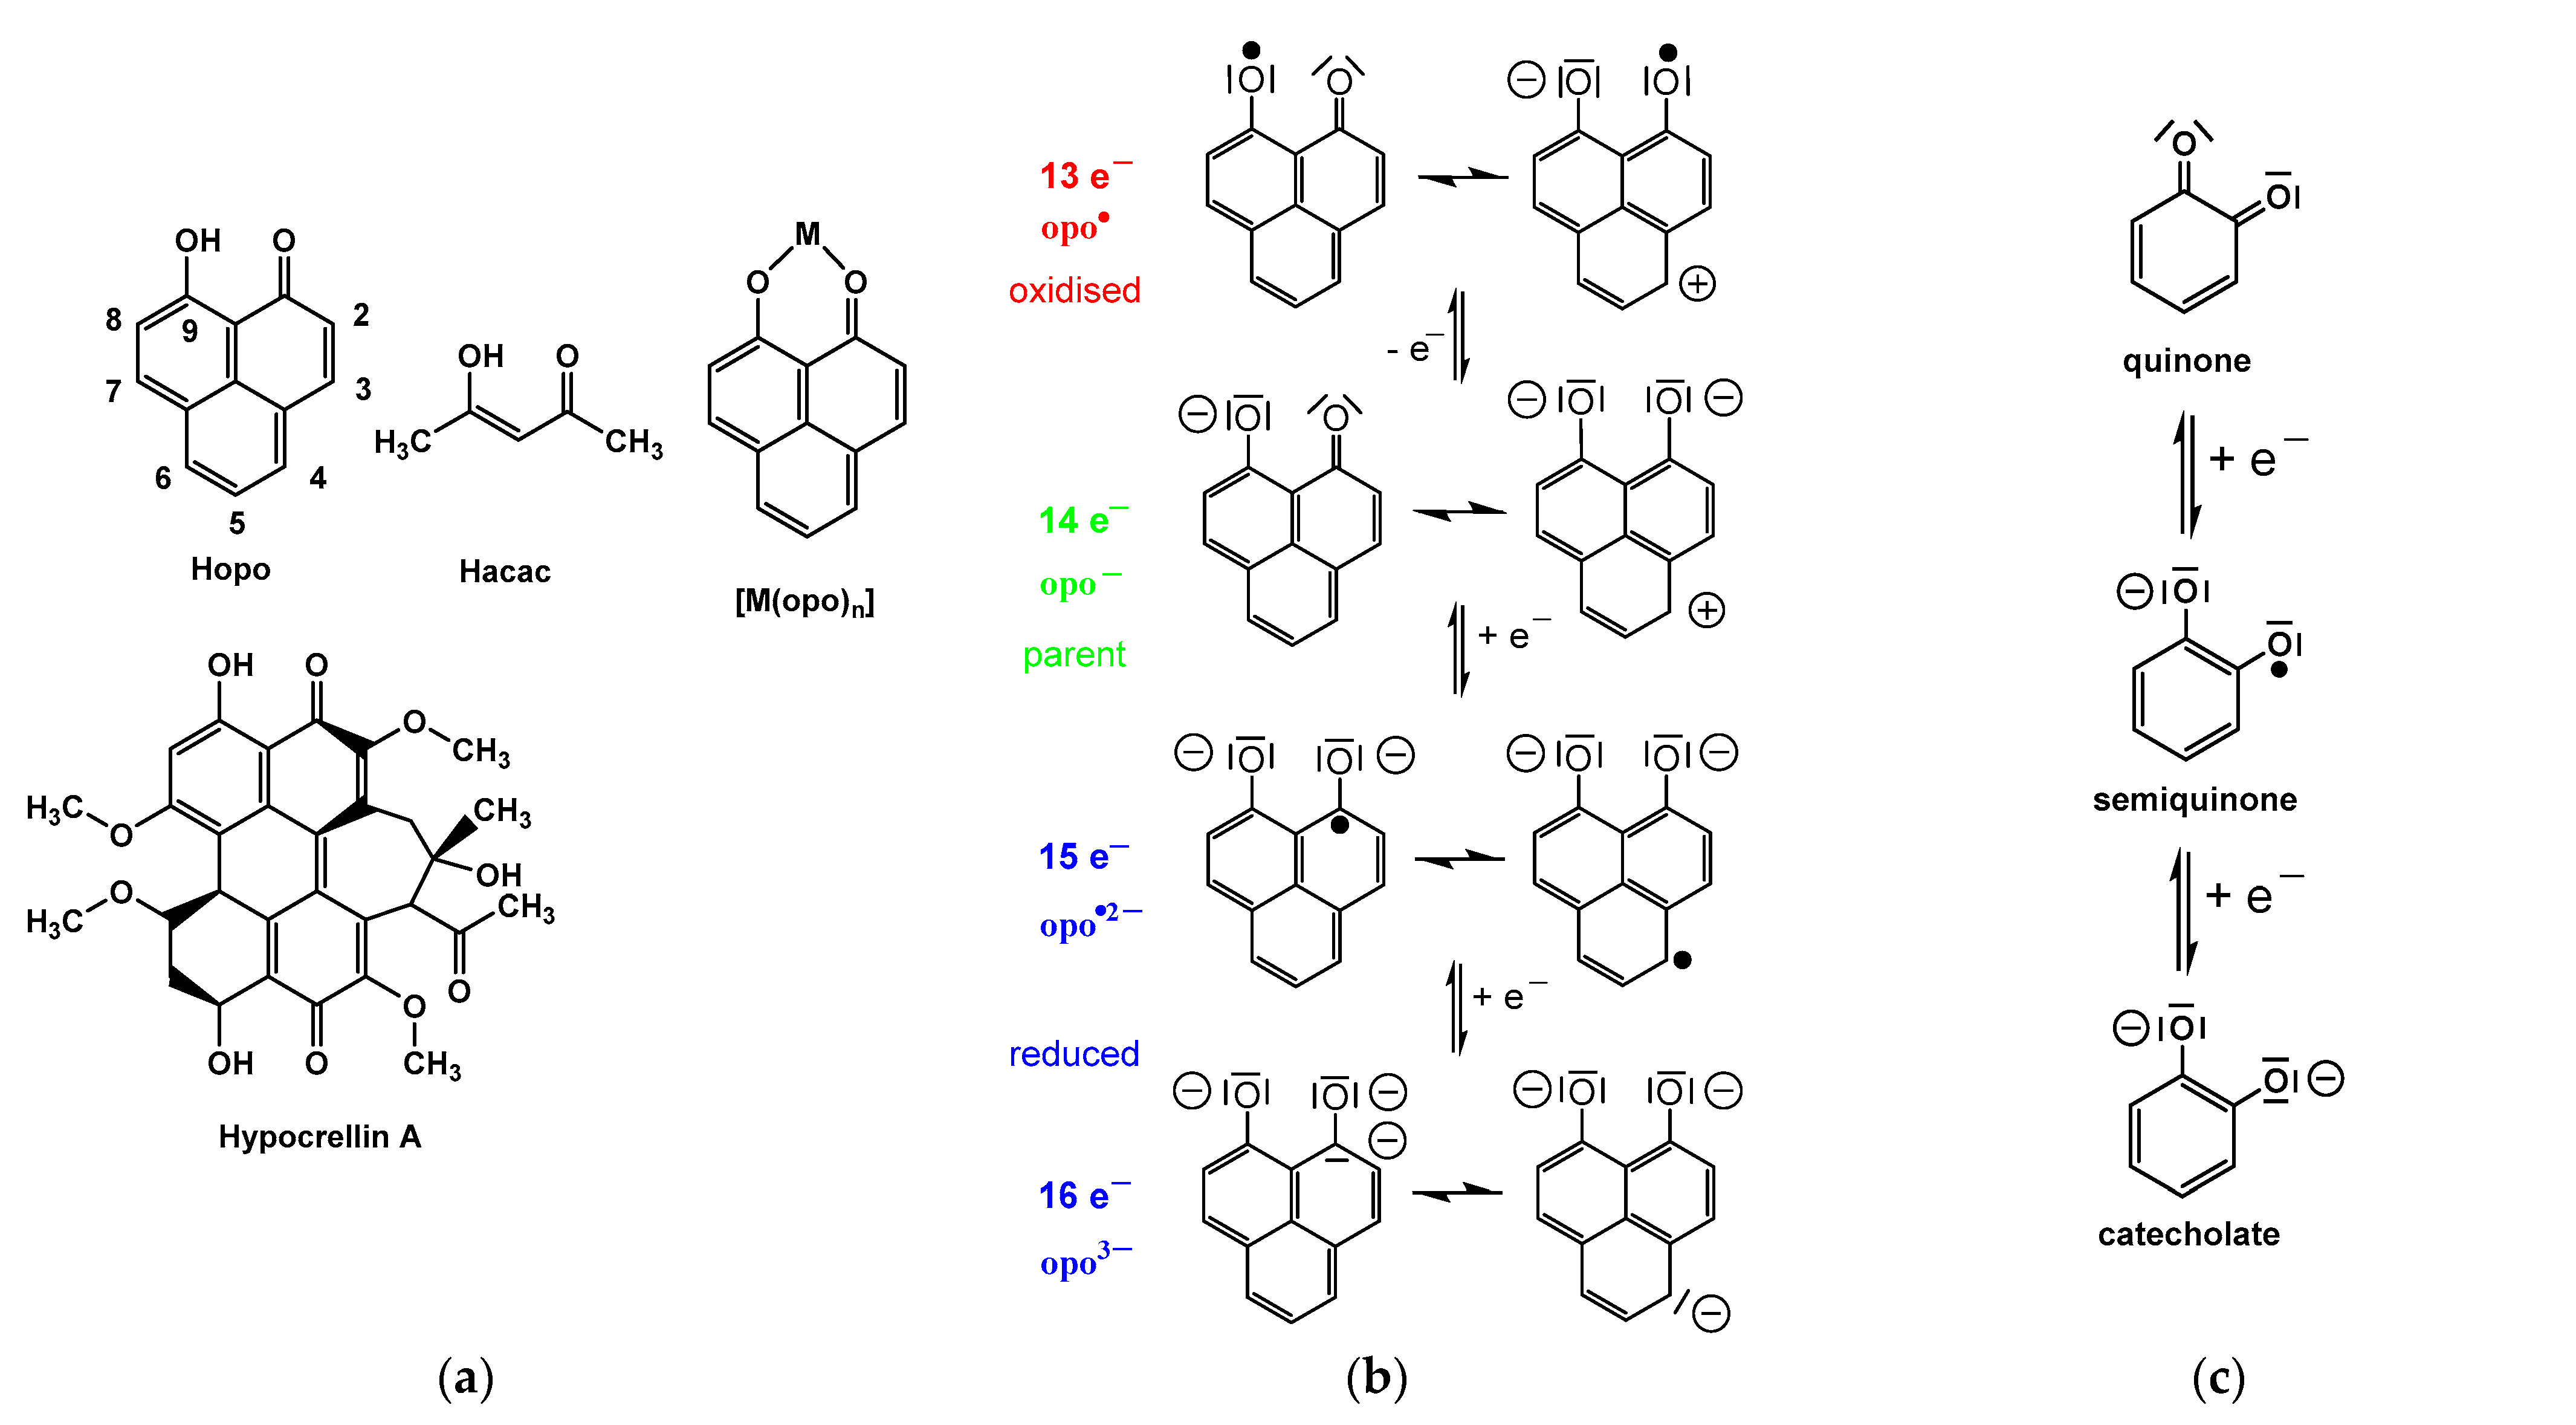
2.2. Synthesis and Structure Analysis of the Opo Complexes

[Fe(opo)3] (dark red), [Cu(opo)2] (brown), and [Zn(opo)2] (yellowish) were obtained by reacting the corresponding acac precursor complexes with Hopo (for details see Section 4) as microcrystalline solids in high yields (78–98%). The driving force of the reaction is probably in the lower solubility of the opo complexes compared with the acac derivatives, which is probably due to intermolecular π-stacking through the opo ligands in the solid state as is frequently observed for opo derivatives and complexes [14,16,56,57,62,68,72]. Elemental analyses are in line with a homoleptic composition of the three complexes as [Fe(opo)3], [Cu(opo)2] and [Zn(opo)2] with no other or additional ligands (= homoleptic) (see Section 4). EI–MS(+) confirmed these compositions. In solutions with coordinating solvents, [Cu(opo)2] and [Zn(opo)2] are suspected to coordinate one or two further ligands.
1H NMR spectroscopy was possible for [Zn(opo)2] (Figure 1), while [Cu(opo)2] and [Fe(opo)3] are paramagnetic, so no unequivocal spectra were obtained. Compared with Hopo [73], the hydroxy proton H9 for the Zn(II) complex is missing, and a general high field-shift of all 1H signals upon coordination was found in agreement with data of the previously isolated complex [Zn(opo)2(THF)2] from the reaction of Hopo with ZnMe2 in tetrahydrofuran (THF) [49].
Our elemental analysis and MS found no evidence of solvent ligands on the isolated Zn opo complex, and the 1H NMR spectrum contained only traces of MeOH from the synthesis. Nevertheless, in the NMR solution, the species [Zn(opo)2(acetone)2] might be present. The shifts for [Zn(opo)2(THF)2] are 7.96, 7.89, 7.40, and 6.95 ppm, respectively, in THF–d8. This was very similar to our data and in line with the finding that in the crystal structure both THF ligands were found in the axial position with very long Zn‒O bonds of 2.143(1) Å [49]. Zn(opo) alkyl complexes were recently reported in the organozinc-catalysed ring-opening polymerisation (ROP) of cyclic esters [68] and intramolecular hydroamination reactions [69].
Single crystals of the dark-red complex [Fe(opo)3] were obtained by slow evaporation of a THF solution and submitted for an XRD study. Unfortunately, the obtained crystals were of low quality and lacked reflexes in the range of high 2θ angles. Nevertheless, the crystal structure could be solved and refined in the triclinic space group P-1. The crystal structure of [Fe(opo)3]·DMSO (DMSO = dimethyl sulfoxide) was recently published in the same space group with Z = 2 representing the two enantiomers of the complex and two co-crystallised DMSO molecules in the unit cell [57]. Our structure solution with Z = 6 showed three enantiomeric pairs of complex molecules, a larger volume V = 4779(2) to 1207.87(7) Å3 and the c axis more than double that of any axis in the structure of [Fe(opo)3]·DMSO. Unfortunately, our refinement parameters were quite poor with an Rint of 36% (Table S1, Supplementary Materials) which we ascribed to the poor quality of the crystal. Nevertheless, the refinement was stable and we found multiple intermolecular π-stacking in the crystal with interplanar distances ranging from 3.54 to 3.75 Å and a staggered graphite-like stacking (Figures S1–S3 in the Supplementary Materials), similar to what has been found for [Fe(opo)3]·DMSO [57] and other opo complexes [14,16,56,57,62,68,72]. The quality of the molecular structure of [Fe(opo)3], as expressed by the thermal ellipsoids and standard deviations, was good enough to assess bond distances and angles. The molecular structure of [Fe(opo)3] is depicted in Figure 2, and the pertinent metrical data is collected in Table S2, Supplementary Materials.
The bond distances and angles are very similar to those reported previously for [Fe(opo)3]·DMSO [57] and also to those of [Fe(acac)3] [74], proving the high similarity of the two ligands.
[Fe(opo)3] has recently turned out to be a very efficient catalyst for C‒H arylation [63] and was also used as cathode material for a H2O2 fuel cell together with the derivative [Fe(opo)(phen)Cl2] (phen = 1,10-phenanthroline) [57].
Synthesis attempts using [Ni(acac)2] to target the [Ni(opo)2] complex were unsuccessful. Yellow materials of unclear stoichiometry were obtained. Elemental analysis gave a 61.12% carbon and 3.73% hydrogen content. This lies between the values expected for [Ni(opo)2] (69.54% C and 3.14% H) and [Ni(acac)2]n (45.56% C and 5.35% H) but did not fit the stoichiometry of [Ni(acac)(opo)] (61.07% C and 4.27% H). The problems with [Ni(opo)2] synthesis might have arisen from the structure of the precursor complex. Anhydrous [Ni(acac)2]3 is trimeric [75,76] and poorly soluble [77]. With two additional axial ligands [Ni(acac)2(L)2], the complexes (L = H2O, MeOH, DMF, Py, acetone) were monomeric [78,79], and the hemihydrate [Ni2(acac)4(H2O)2]·0.5H2O, was dimeric [80]. In addition, Ni(II) acac cluster compounds [Ni2Ti2(acac)4(OEt)8] [77] and [Ni4(OCH3)4(acac)4(CH3OH)4] [81] were reported. Such multinuclear complexes contain terminal and bridging acac ligands, the latter of which might not have been replaced, which means the reaction might have stopped half-way, leaving material with partly exchanged ligands. Leaving the reaction mixture for some time yielded polygonal green crystals which were suitable for XRD. Structure solution and refinement in the monoclinic space group C2/c revealed the structure of a tetranuclear complex of the formula [Ni4(OCH3)4(acac)4(CH3OH)4] (Figure S12 and Tables S3–S4 in the Supplementary Materials). This heterocubane-type compound was already reported [81] as was the phenyl derivative [Ni4(OCH3)4(Phacac)4(CH3OH)4]·½Et2O [82].
The complex [Ni(opo)2(THF)2] was recently synthesised from Ni(OAc)2·4H2O and Hopo and used for hydrosilylation and hydroboration catalysis [60,62].

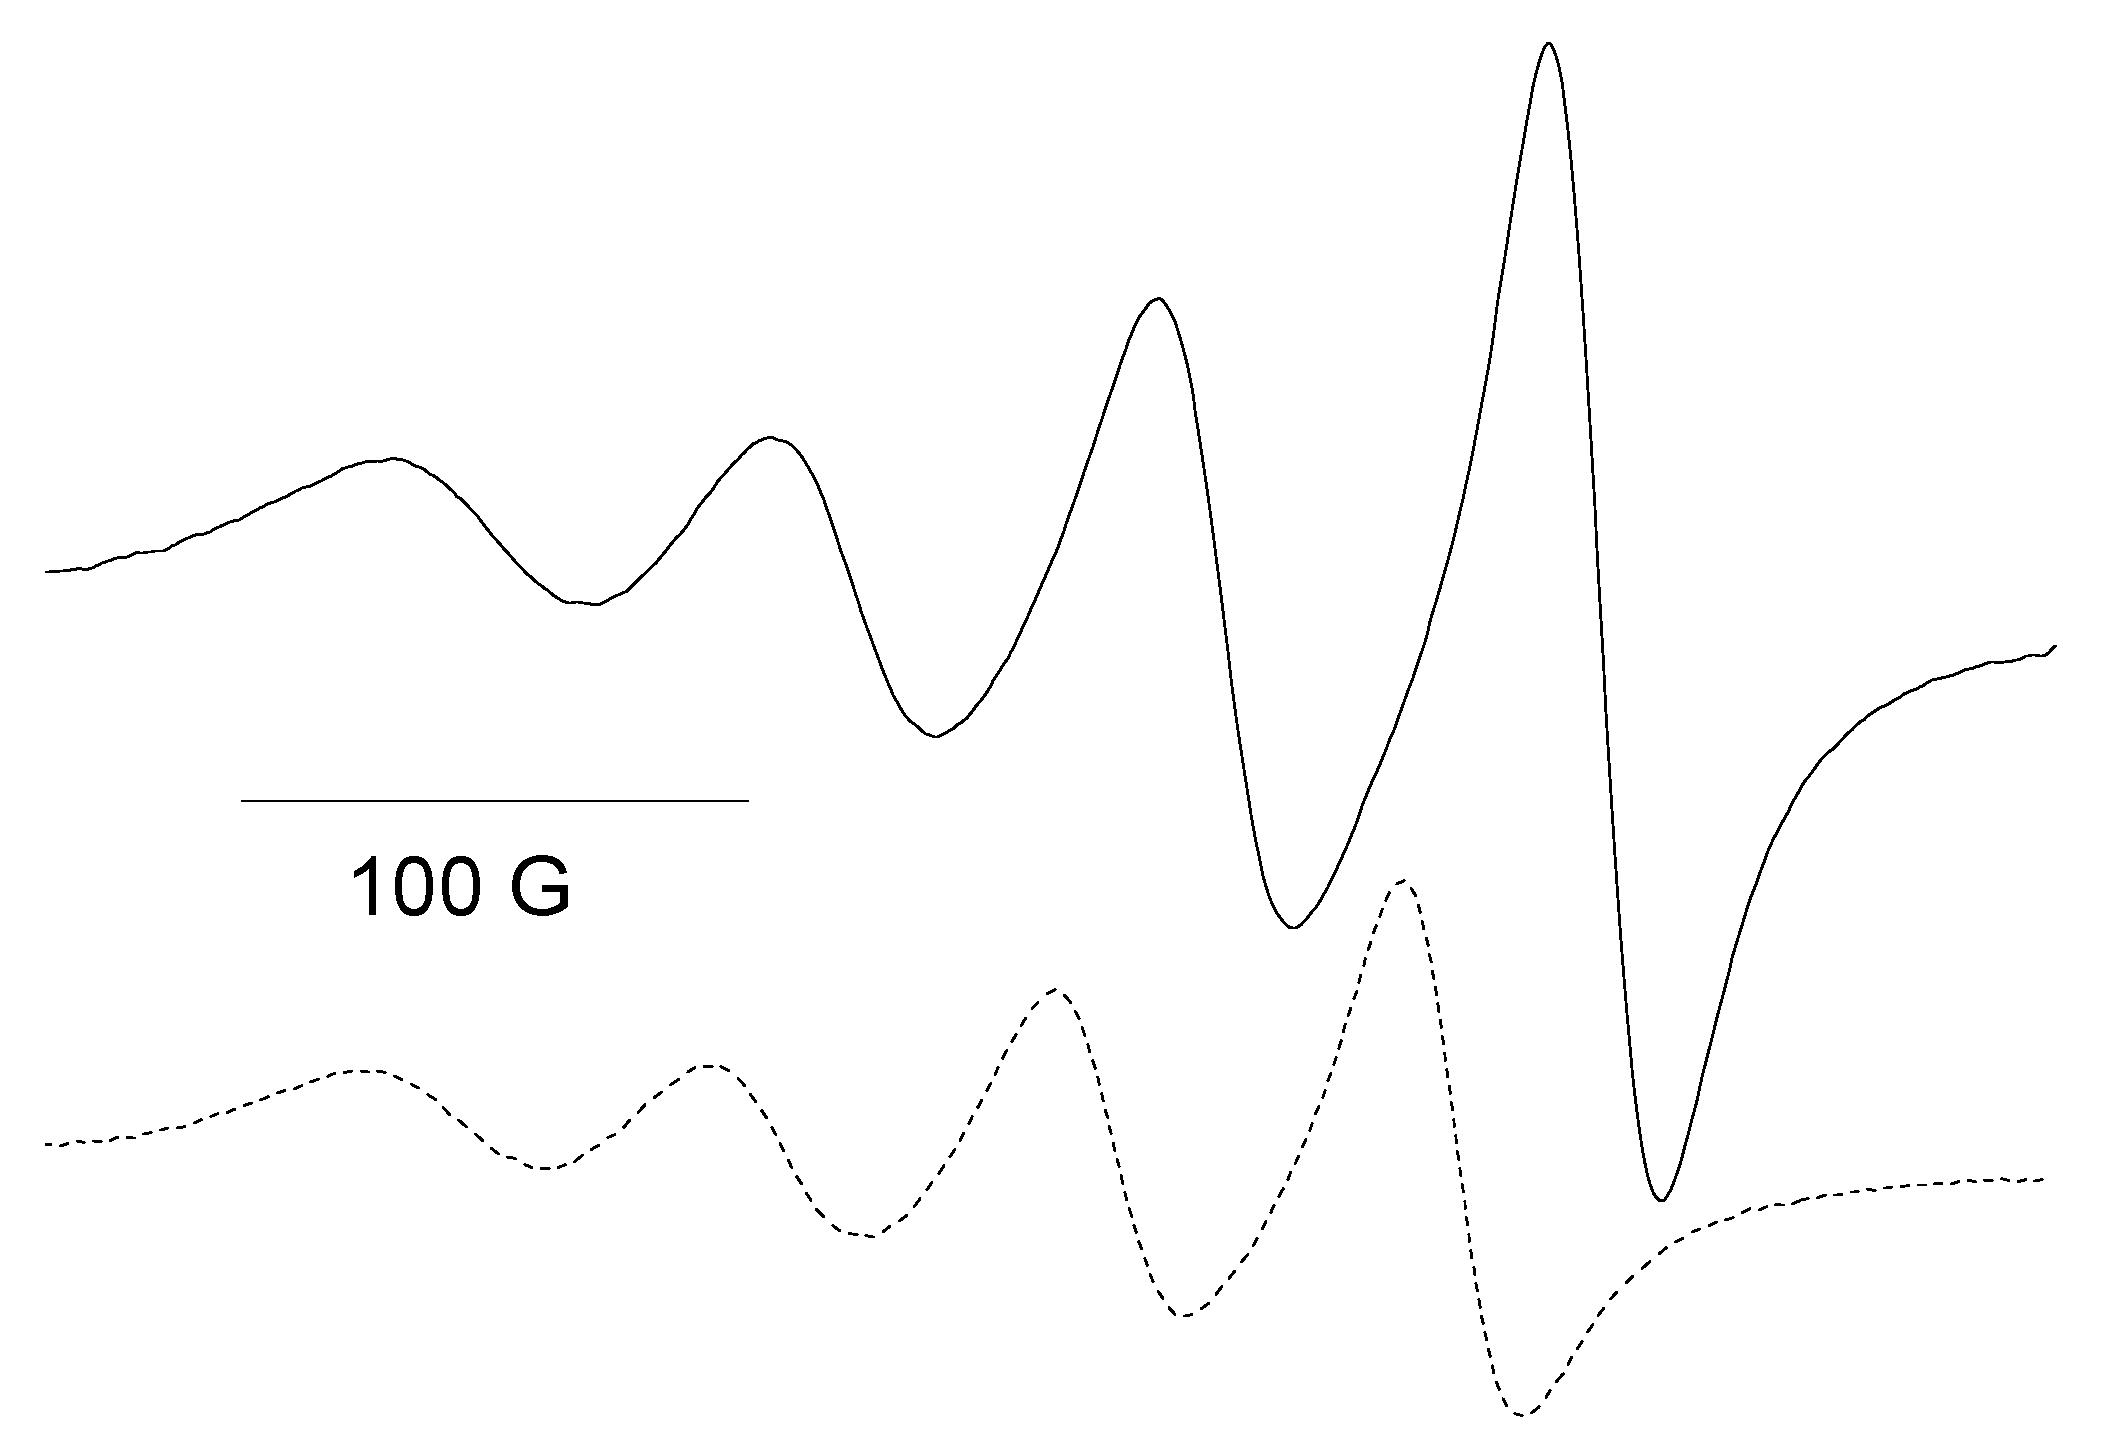
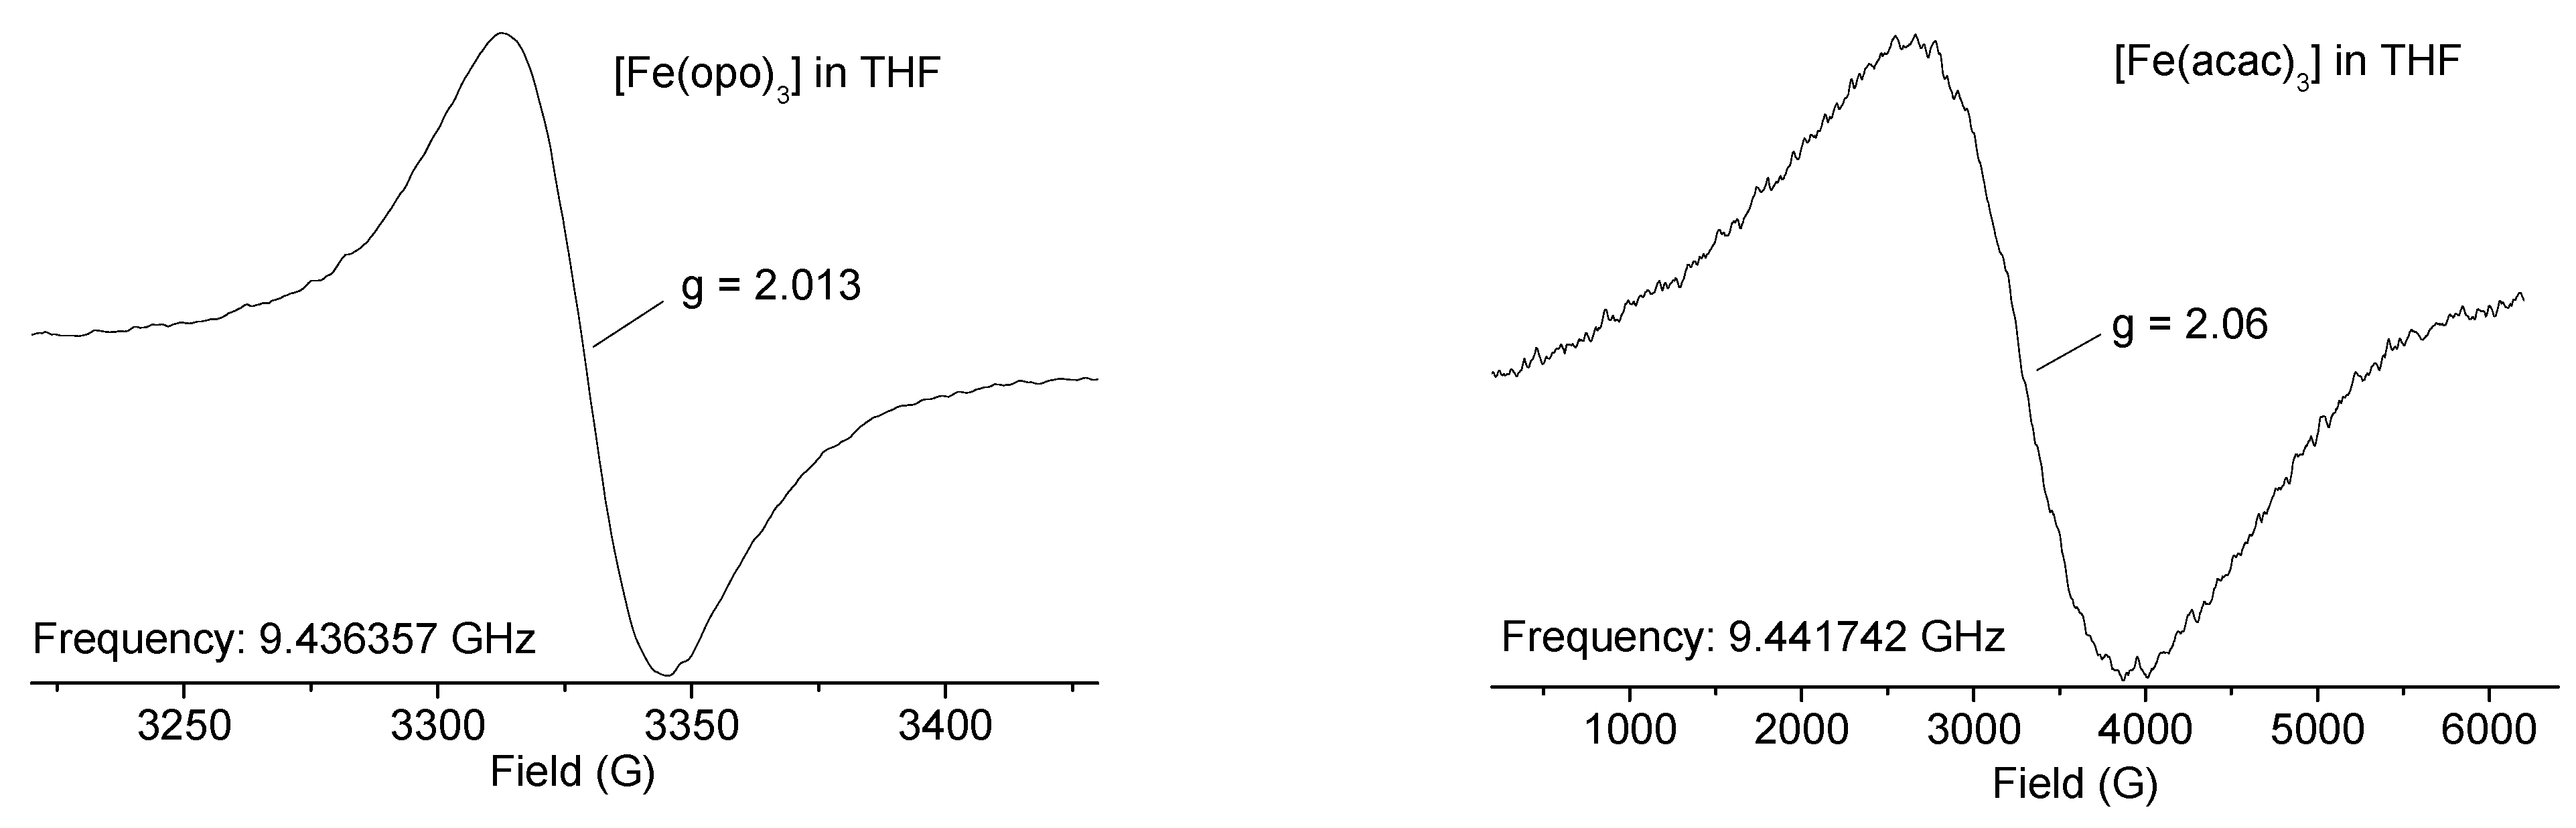
2.3. EPR Spectroscopy for [Cu(opo)2] and [Fe(opo)3]

[Cu(opo)2] is expected to be a square planar complex, similar to [Cu(acac)2] [83,84,85,86,87]. In solution [Cu(acac)2] adds coordinating solvent molecules in the two axial positions to form hexacoordinate species [Cu(acac)2(L)2] what has been studied in detail using EPR spectroscopy [84,85,86] and we assume the same behaviour for [Cu(opo)2]. Very similar spectra were obtained for the opo and acac complexes (Figure 3). The complexes exhibit isotropic EPR signals with g values of 2.124 for [Cu(acac)2] and 2.127 for [Cu(opo)2]. The hyperfine splitting (HFS) is also slightly different with ACu = 76 G for [Cu(opo)2] and ACu = 67 G for [Cu(acac)2] (simulation for [Cu(opo)2] in Figure S4, Supplementary Materials). Our values recorded for [Cu(acac)2] are very similar to those from previous reports [84,85,86,87,88,89]. The higher HFS is in line with a lower degree of spin delocalisation from CuII over the ligand for opo compared with acac.
The solid state EPR spectrum of [Fe(opo)3] in the X-band showed broad resonances with g values of about 4.5 and 2.3 (Figure S5 in the Supplementary Materials), which are in line with the reported values of 4.52 and 2.34, and the magnetic measurements are in agreement with a high-field d5 configuration (µeff = 5.7 µB at 298 K) [57]. [Fe(acac)3] in the solid shows EPR spectra in the X-band with very similar g components [90,91].
The EPR spectrum for [Fe(opo)3] and [Fe(acac)3] in THF solution at 298 K are both isotropic but the spectral width is completely different (Figure 4). [Fe(opo)3] exhibits a g value of 2.013 and a total spectral width of about 150 G, while [Fe(acac)3] exhibits a g value of 2.060 and a spectral width of more than 5000 G. For [Fe(acac)3] a very similar spectrum was reported in a toluene solution at room temperature [91]. The narrow, completely isotropic signal of [Fe(opo)3] disagreed with a metal-centred S = 5/2 spin system. Either this narrow spectrum was due to marked spin delocalisation from Fe to opo or we assumed that we were observing a S = ½ spin system with a contribution from a diamagnetic metal, as inferred from the g value being only slightly higher than 2.0023 for a “free” electron in an organic molecule and from the moderate width of the signal. This would be in line with an opo-to-FeIII electron transfer, yielding a FeII-bound opo radical complex described as [FeII(opo)(opo)2].
The EPR spectrum of [B(opo)2]•+ shows HFS to protons and the B isotopes, and has a total width of about only 10 G [11]. The phenalenyl radical shows a total width of about 40 G [72] which confirms that the metal-contribution of our radical complex increased the overall spectral width, probably by broadening the lines. The reduced complex [FeII(opo)3] is assumed to have a low-spin d6 configuration and is thus diamagnetic [57]. Both support the idea that an opo-centred radical with S = ½ bound to diamagnetic FeII is observed in a THF solution.

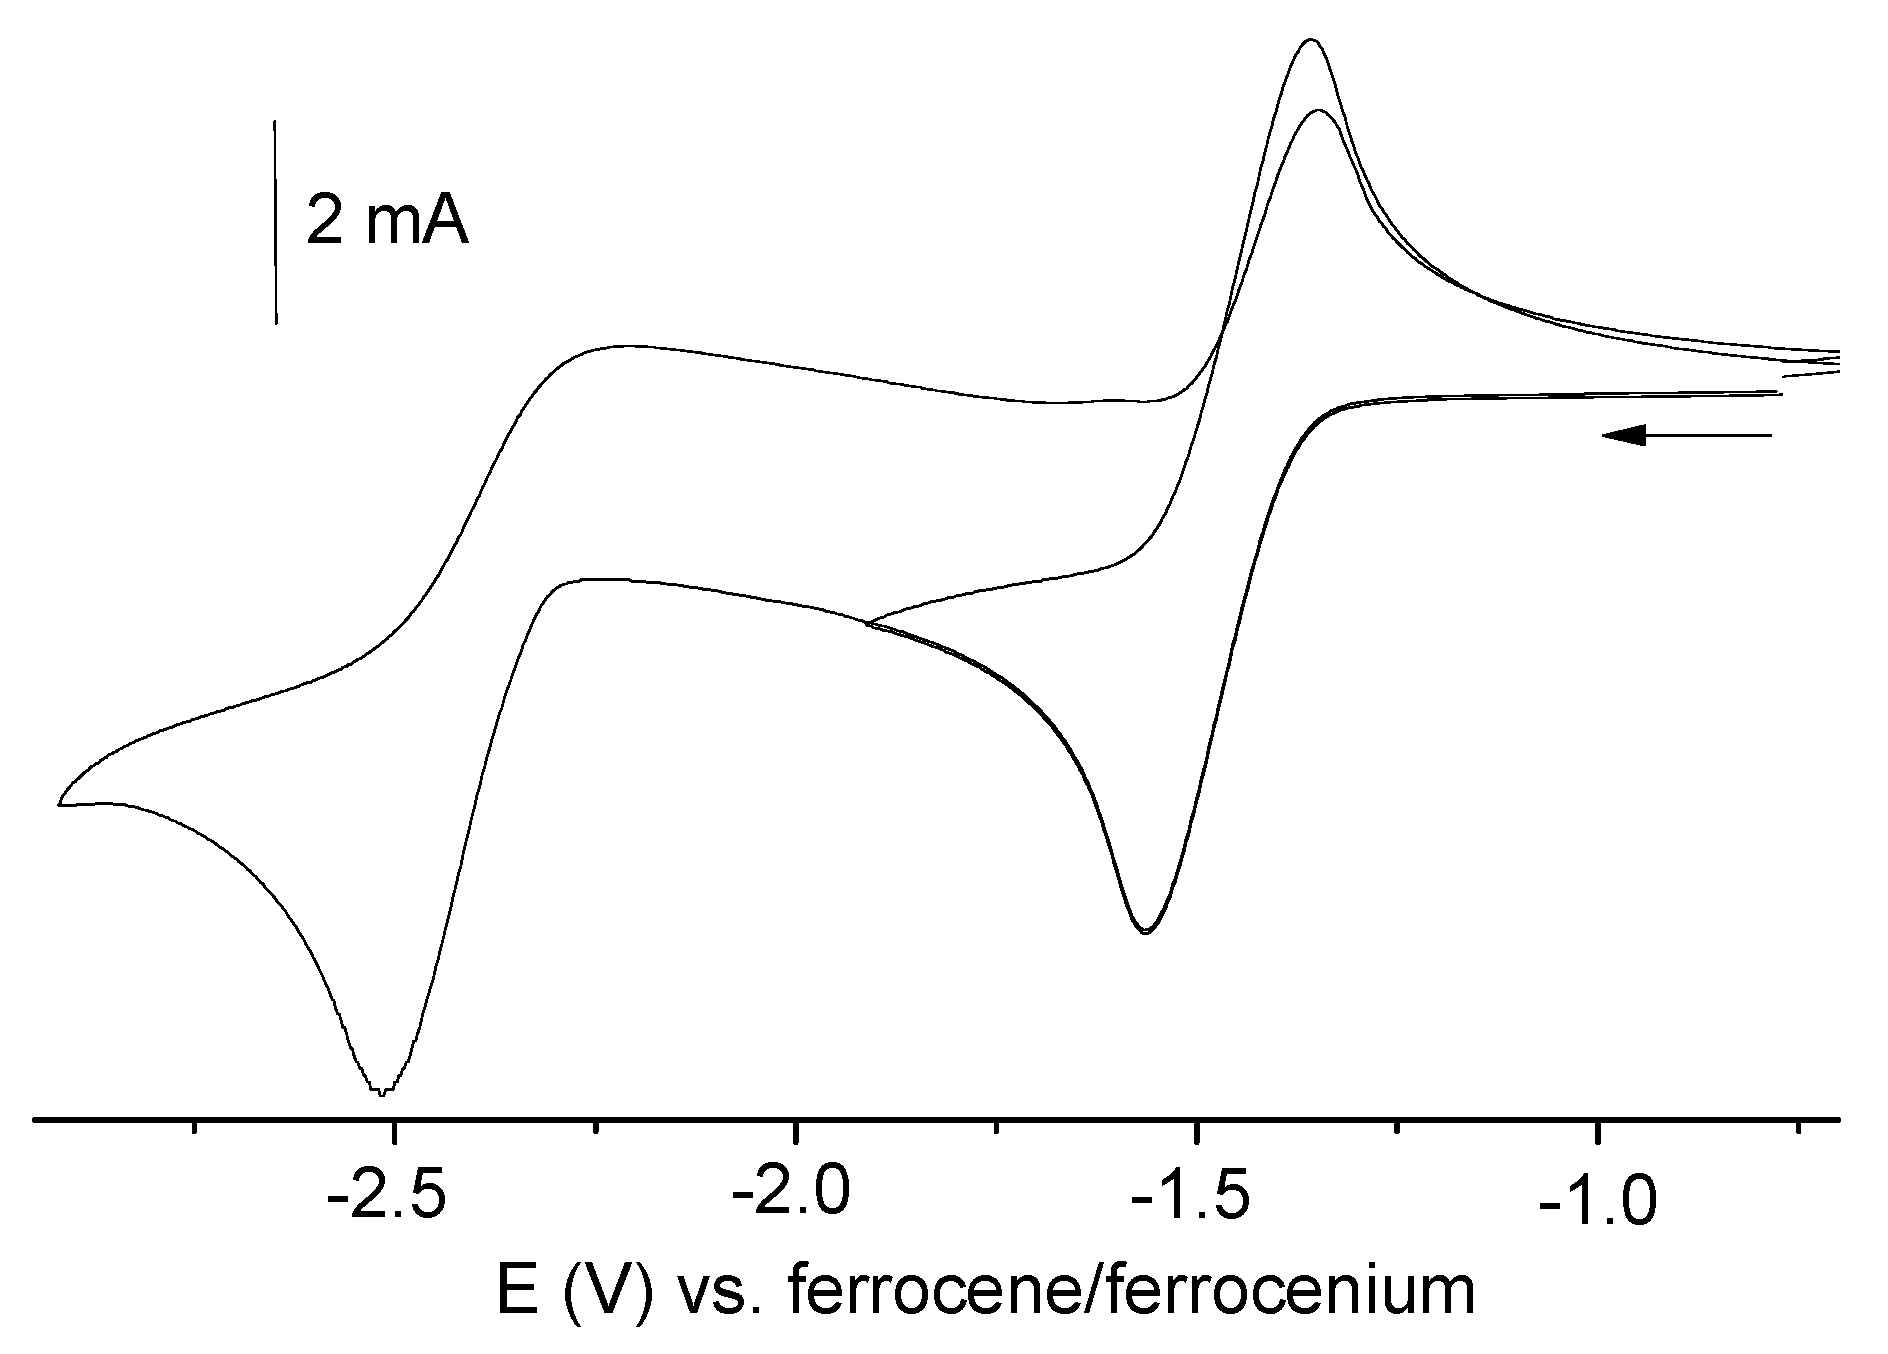
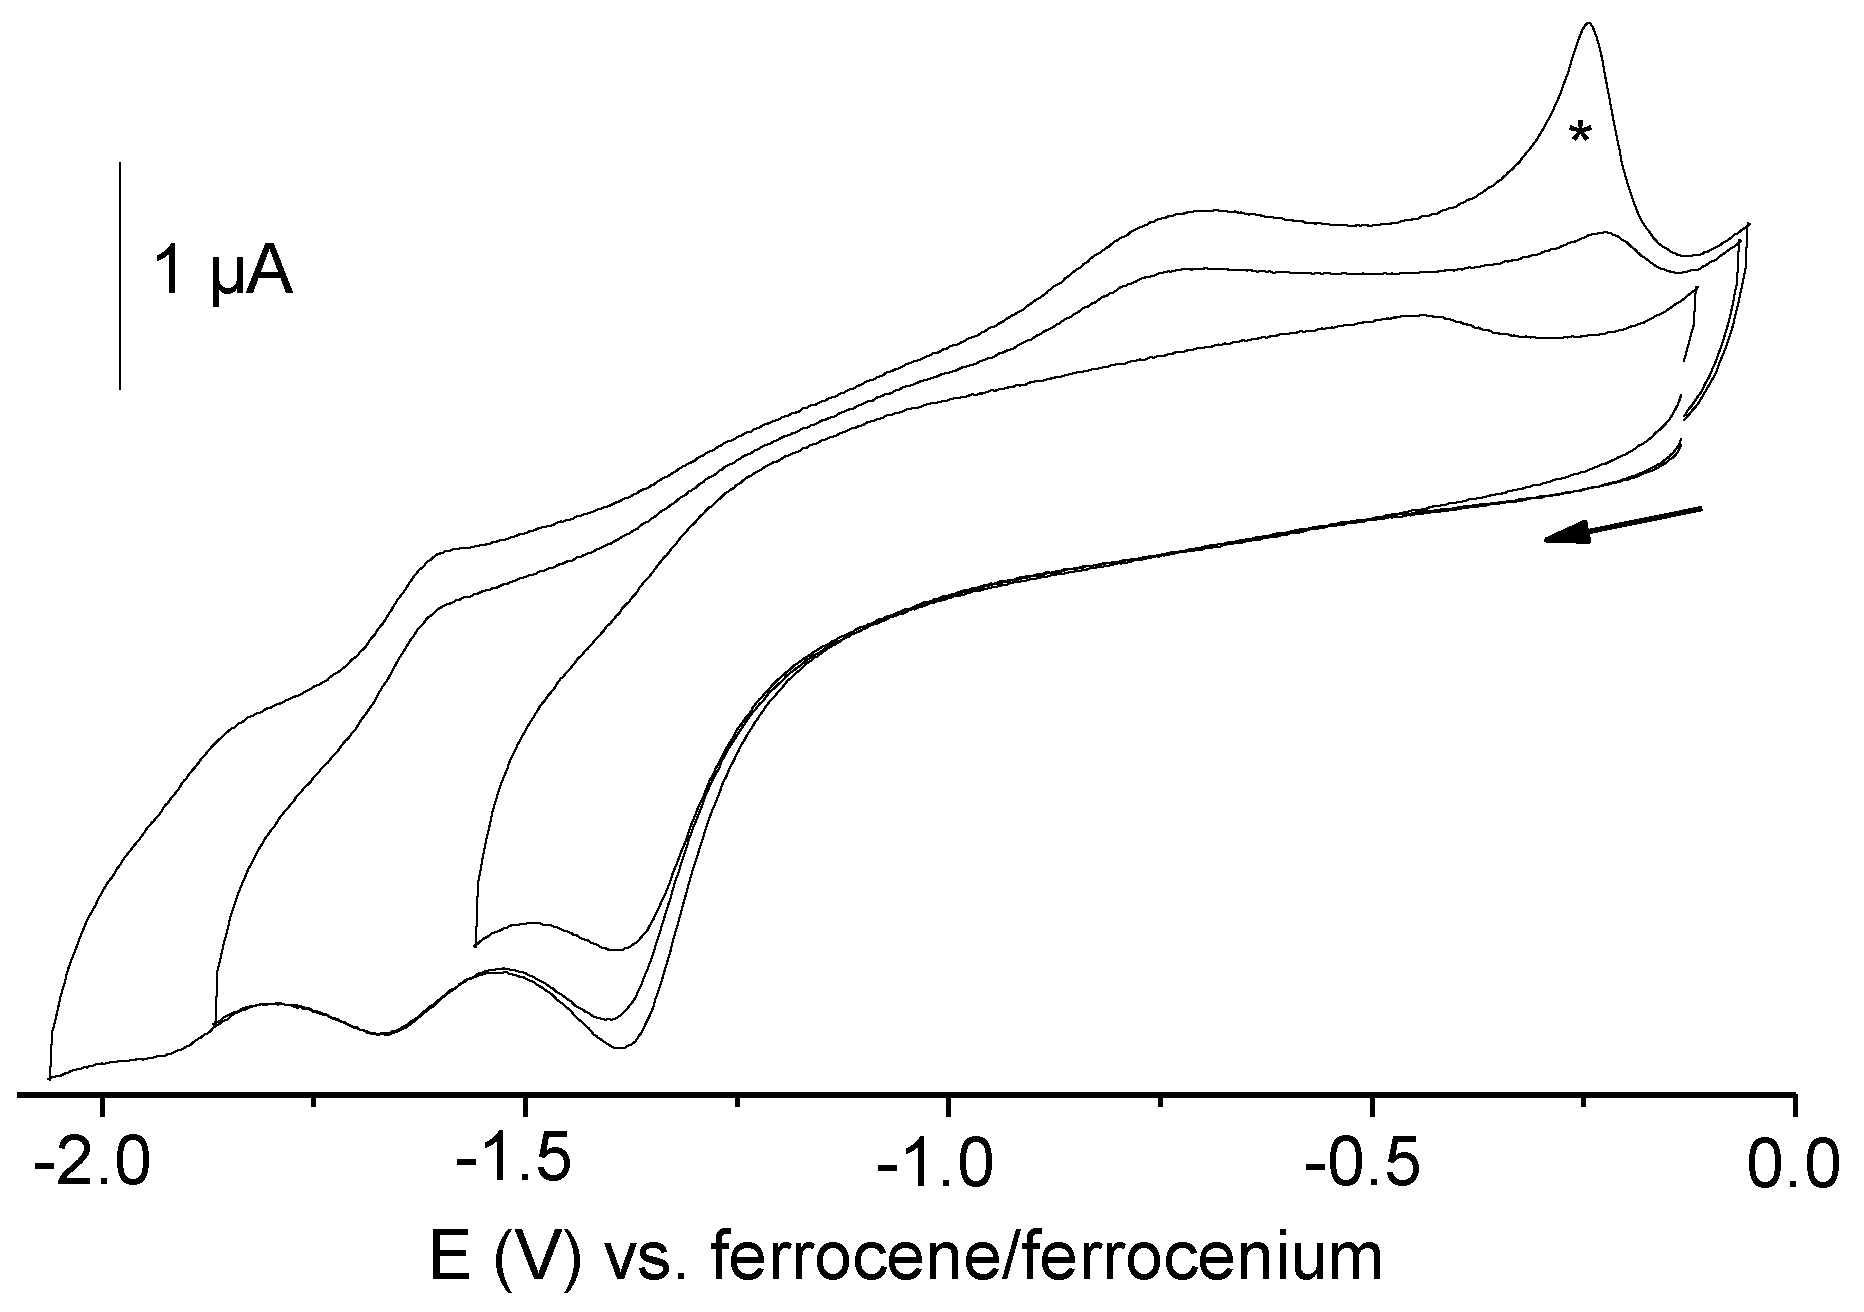
2.4. Electrochemistry

Hopo and the three FeIII, CuII, and ZnII complexes were studied through cyclic voltammetry in parallel with the corresponding acac derivatives. Hopo and the complexes can be reduced twice in the range from −1 to −2.5 V (Figure 5) in line with previous observation on Hopo and opo complexes [1,11,15,16,25,44,45,46,47,48,57,59,62,67] while oxidation was not observed in the range of 0.0 to 3.0 V (Table 1).
For the complex [Zn(opo)2] (Figure 4) no metal centred reduction is expected (ZnII = d10), thus both observed reduction processes are ligand-centred and show potentials similar to those of Hopo (Figure S6, Supplementary Materials). For [Zn(acac)2] only one partially reversible first reduction wave was observed at a slightly more negative potential than for the opo derivative.
For [Cu(opo)2] the first reductive process divides into two largely separated waves at Epc = −1.39 V and Epa = −0.44 V which averaged to −0.92 V (Figure 6). This pair of waves represents the CuII/CuI redox couple. The separation of the two processes is frequently observed for such complexes and is caused by the huge reorganisation which is necessary to change the geometry from square planar for CuII towards tetrahedral for CuI and backwards [92,93,94,95]. The same is observed for [Cu(acac)2] but to a much lesser extent with a separation of Epc = −1.60 V and Epa = −0.78 V and an averaged value of −1.51 V markedly lower than for the opo derivative. Previously reported values of −1.57 V (in MeCN) and −1.61 V (in CH2Cl2) [89] fit perfectly to our measurements. As the axial positions are prone to solvent coordination, the potential of this CuII/CuI couple largely varies with the solvent.
[Fe(opo)3] and [Fe(acac)3] have been studied before and the reported values agree quite well with ours [57]. The first reduction process of both complexes is assigned to a metal-centred process (FeIII/FeII) with a slightly higher value for the acac complex indicating a slightly better σ-donation to the metal. The first opo-centred reduction of [Fe(opo)3] lies at −1.31 and compares to −1.41 V for the acac derivative. A second opo-centred reduction is recorded at −1.60 V. Remarkably, much more negative values of −1.83 and −2.24 V were reported for [Fe(opo)3] from the previous study for these processes and there seems to be a large dependence on the material of the working electrode (WE). We thus repeated our measurement using a glassy carbon (GC) WE using a Pt WE and could confirm the previous values.

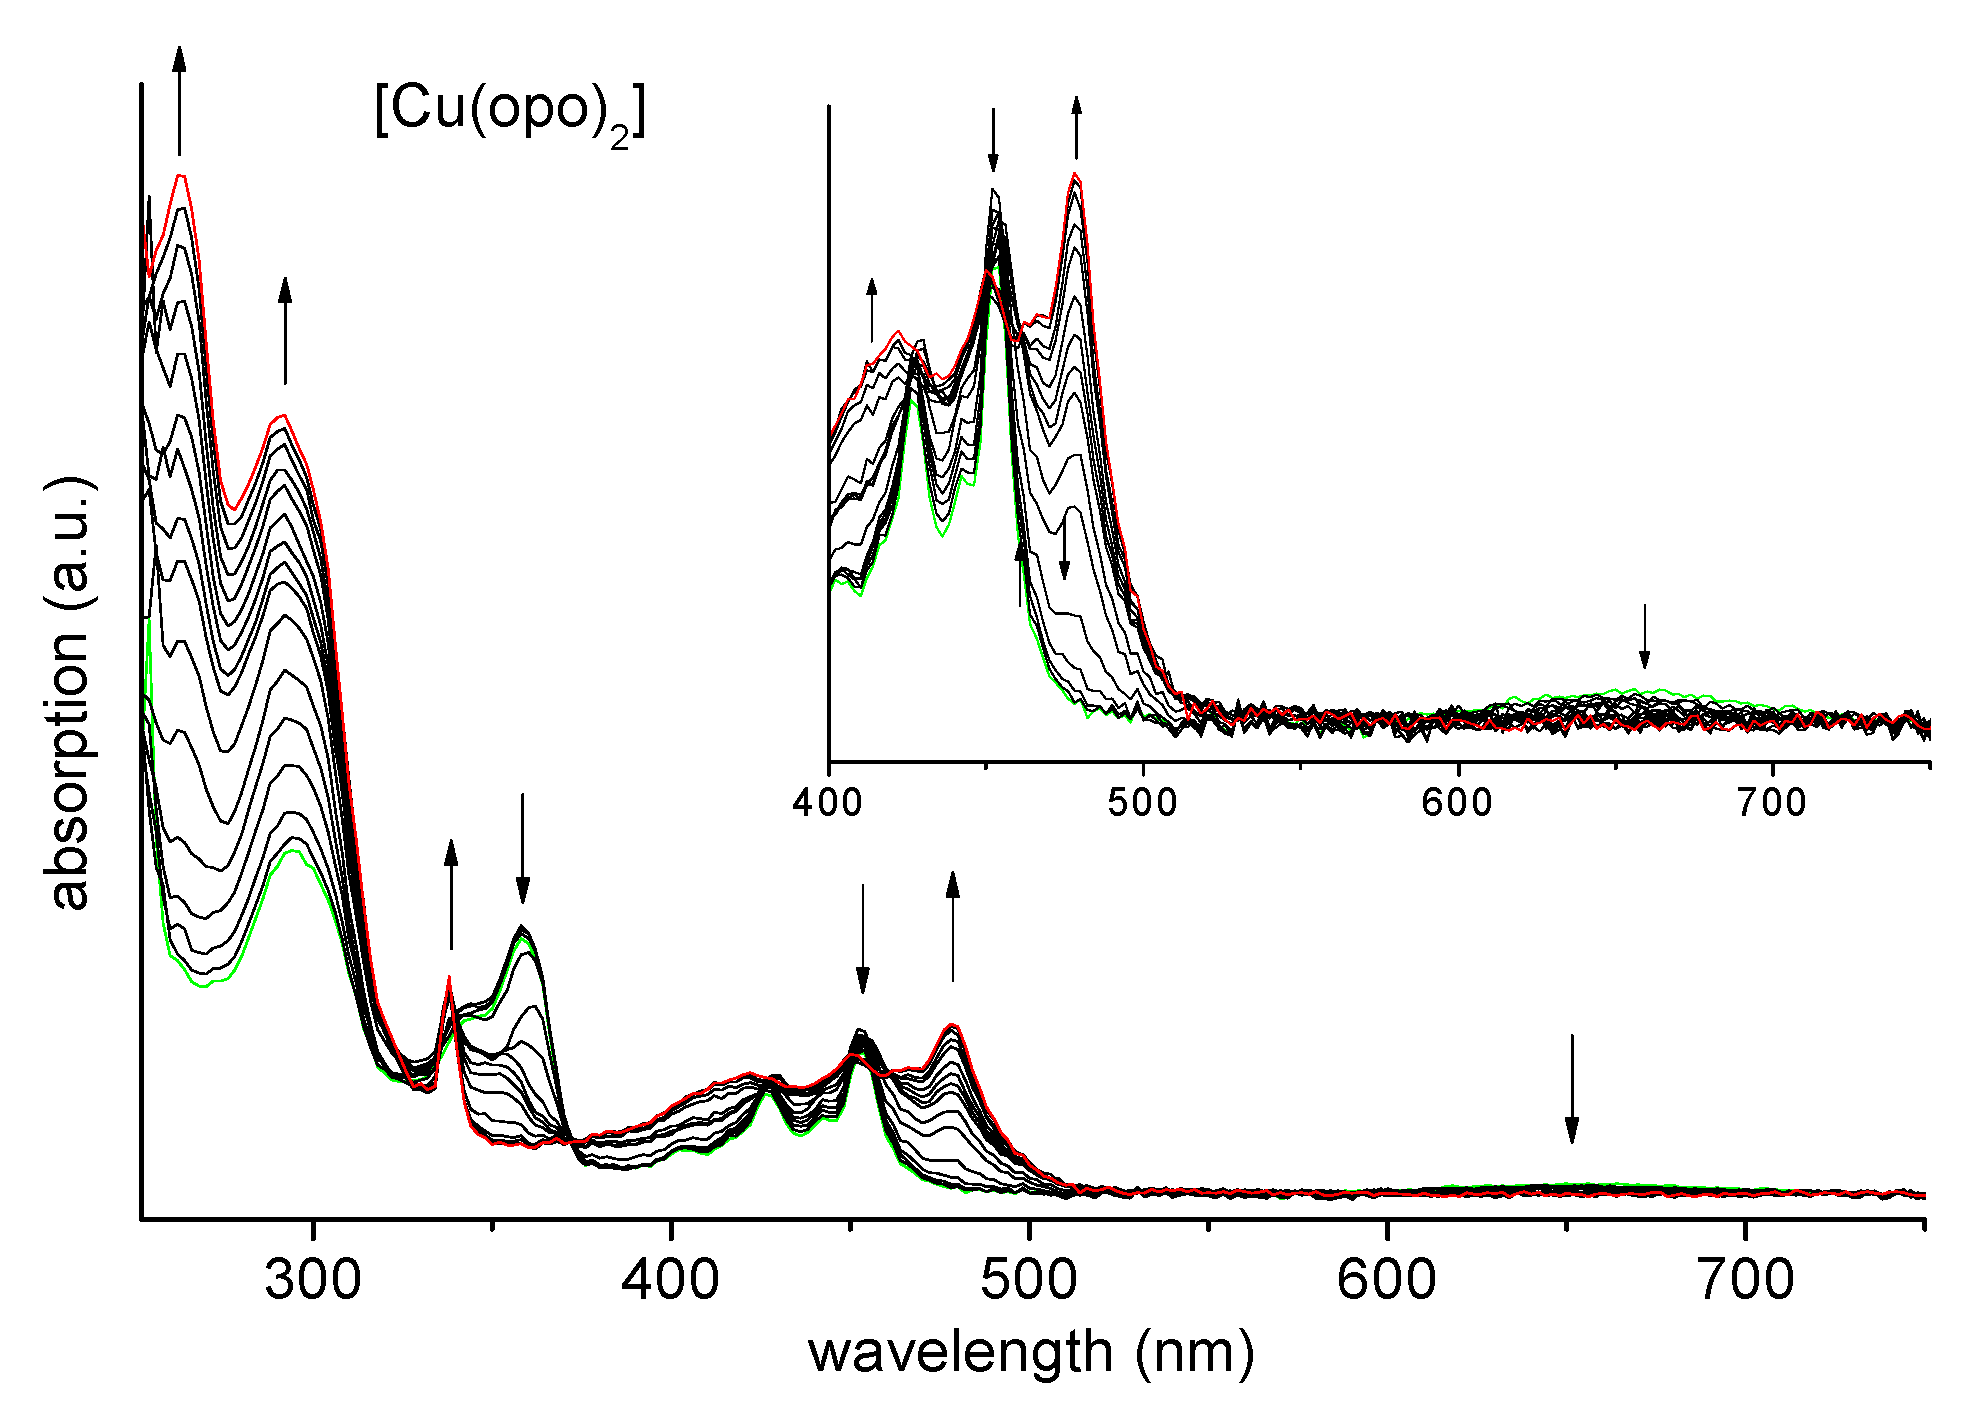
2.5. Absorption Spectroscopy and Spectroelectrochemistry

The absorption spectra of Hopo exhibits absorptions in the range of 300 to 450 nm attributed to π−π* transitions (Table 2) [26,27,29,35,50,52]. For the Zn complex, most of the absorption maxima were almost identical to those of Hopo in keeping with the very similar electrochemical properties (Figure S7 in the Supplementary Materials). In keeping with previous reports on [Zn(acac)2] [96,97], we assumed that the absorbing species were the solvent-coordinated complexes [Zn(opo)2(solvent)x] with x = 1 or 2.
For the CuII complex the UV absorptions up to 380 nm are also very similar to those of Hopo (Figure 7 and Figure S8, Supplementary Materials). The structured band system peaking at 452 nm is also found for Hopo and assigned to the lowest energy π−π* transitions, but the intensity of these bands in the CuII complex is much higher (Table 2). Presumably a metal-to-ligand charge transfer (MLCT) from CuII to the lowest unoccupied molecular orbital (LUMO) of opo is admixing to these transitions in keeping with the rather high (less negative) ligand-centred reduction potentials and reports of such MLCT bands in OsII and RuII complexes of opo [45,46,47,48]. For [Cu(acac)2] this band system is absent, supporting further the mixed π−π*/MLCT assignment. The very long-wavelength broad absorption at 651 nm is attributed to the d–d transition. For [Cu(acac)2] we found this absorption at 642 nm in keeping with a previous report [89]. The lower energy of the ligand field transition for [Cu(opo)2] translated to a weaker ligand field of the opo ligand compared with acac, in line with the poorer stabilisation of the opo anion in aprotic solvents compared with acac and the higher acidity of Hacac (vide supra). As for [Cu(acac)2] [84,85,86], we also assumed for [Cu(opo)2] a solvent-coordinated species [Cu(opo)2(solvent)2] in solution.
The spectrum of [Fe(opo)3] is also dominated by the π−π* transitions of the opo ligand (Figure S9, Supplementary Materials). However, the high absorption bands are markedly shifted and have gained enormously in intensity compared with the free ligand Hopo. Again, the structured π−π*(opo) band system from 400 to 500 nm is far more intense for the FeIII complex and we assign this to mixed π−π*/ligand(πopo)-to-metal(dFe) charge transfer (LMCT) transitions. A weak long wavelength absorption band is observed as a shoulder at 571 nm. Magnetic measurements [57] have previously shown that [Fe(opo)3] represents an FeIII d5 high-spin system and no spin-allowed d–d transitions are thus expected. Nevertheless, this long-wavelength band might be due to a d–d transition with intensity borrowed from the close LMCT bands. The spectrum of [Fe(acac)3] shows an intense band at 435 in THF which can be assigned to an LMCT transition [98]. Compared with [Fe(opo)3] the energy of the band for the acac derivative is higher indicative for a higher lying highest occupied molecular orbital (HOMO) of the opo ligand.
Upon electrochemical reduction of [Cu(opo)2] the visible absorptions are red-shifted and the band at 358 nm bleaches leaving a sharp absorption at 339 nm (Figure 7). Both UV bands are markedly increased in intensity without a change in energy. We assume that the geometry re-organisation from CuII square planar (+ two solvent ligands) to tetrahedral CuI changes the probabilities for the π−π* transitions in the opo ligands, while the π−π*/MLCT bands in the visible get a red-shift from the stabilisation of the Cu HOMO (d9 to d10). The loss of the long-wavelength absorption at 651 nm additionally confirms the CuII/CuI redox couple. The resulting species is best described as [CuI(opo)2]•−. A contribution of the resonance form [CuII(opo•2−)(opo)]•− can be ruled out as a species containing opo•2− is characterised by intense dark colours in the visible range of the spectrum [45,46,47,48,49,50,52,54,55,57].
Upon the reduction of [Fe(opo)3] at −1.0 V the π−π*/LMCT bands from 400 to 500 nm get a slight blue-shift and lose intensity. The band system at 360 nm bleaches leaving a sharp absorption at 339 nm (Figure 8). All absorption bands of the reduced Fe complex look very similar to those of the reduced [Cu(opo)2]•− complex. Only the band at 264 nm is more intense than the 290 nm absorption for Cu, while for Fe these intensities are reversed. Previously, the first reduction of [Fe(opo)3] has been assigned to a FeIII/FeII couple under the assumption that in [Fe(opo)3]•− the FeII is in a low-spin state [57]. Our experiments confirm the underlying FeIII/FeII couple.
As for the Cu complex, no evidence of an opo-based reduction of [Fe(opo)3] leading to species containing the intensely coloured radical dianion opo•2− was found. Both reduced complexes clearly contained only opo ligands and CuI or FeII, respectively. There was also no hint of an opo-to-FeIII electron transfer in the parent complex found in our UV-vis experiments, leaving the narrow EPR signal of [Fe(opo)3] in solution without an unequivocal explanation.
When reducing the complex [Zn(opo)2] at about −0.7 and at −1.3 V which both lie higher than the first reduction wave observed in CV we recorded slight shifts in the two main band systems at 350 and 450 nm. At ‒0.7 these were only slight red-shifts of both bands, while at −1.3 V the 350 nm band disappeared leaving the sharp feature at 339 nm as observed for the CuII and FeIII complex after metal-centred reduction (Figure S10, Supplementary Materials). Furthermore, the long-wavelength band system shifted further to slightly lower energies. We assigned these spectroscopic features to geometry changes through the polarisation effects on the working electrode comparable to what had been observed for the reduced CuI and FeII complexes, which contained the parent opo ligand. Upon reduction at −2 V corresponding to the potential of the first reduction wave observed in the CV, the sharp 339 band and the structured absorption centred at 460 nm disappeared and broad bands at 420 and 630 nm grew in (Figure S11, Supplementary Materials). We assigned these bands to typical transitions involving a reduced opo•2− ligand [45,46,47,48,49,50,52,54,55,57] and describe the complex as [ZnII(opo•2−)(opo)]•−.

2.6. Antiproliferative Properties

In a benchmarking study, [Rh(opo)(CO)2], [Pt(opo)(NH3)2](NO3) and (Bu4N)[Pt(opo)Cl2] were found to have high antiproliferative activity towards human acute myeloid leukemia cells with IC50 values ranging from 1.7 to 3.4 µM [29]. Very recently [Pt(opo)(dach)](NO3) (dach = 1,2-diaminocyclohexane) was found to be active against an A549 human lung cancer cell line with activities two times higher than oxaliplatin [31]. This called for a study of Hopo and the three complexes against the common cancer cell lines HT-29 (colon cancer) and MCF-7 (breast cancer). For Hopo and the complexes, we found quite low IC50 values in the range of cisplatin (Table 3).
Remarkably, already the Hopo molecule shows quite high activity in line with other high antiproliferative activities of Hopo derivatives, e.g., against Leishmania [32,33]. The activities of the Fe and Zn complexes are only gradually higher but lie in the range of the reported RhI, and PtII complexes [29,30,31]. While for the previously studied opo PtII complexes DNA intercalation and cisplatin-like behaviour was assumed [29,31], the apoptosis resulting from the Hopo and the FeIII, CuII and ZnII complexes might be also caused by oxidative damage. Our spectroscopic and electrochemical findings are in line with such redox behaviour in the cell leading to reactive oxygen species, thus inducing cell damage. But in all cases, the de-coordinated ligand might be the main cause of activity and the observed differences in activity reflect the bio-availability (solubility + de-coordination rate) of Hopo or its anion. To gain more insight, we will head for the so-far unreported homoleptic PtII and PdII complexes of opo and compare their antiproliferative activities and redox chemistry (in the presence and absence of O2) with those of the ZnII, CuII and FeIII derivatives reported here and study their impact on healthy and cancerous cells in further studies.

3. Conclusions

The three homoleptic complexes [Fe(opo)3], [Cu(opo)2], and [Zn(opo)2] containing the redox-active, so-called non-innocent ligand 9-oxido-phenalenone opo (Hopo = 9-hydroxyphenalenone) were synthesised from the corresponding acetylacetonates. [Zn(opo)2] was studied using 1H NMR spectroscopy, the paramagnetic [Fe(opo)3] and [Cu(opo)2] by EPR spectroscopy. While the EPR spectra of [Cu(opo)2] and [Cu(acac)2] in the DMF solution are very similar, a rather narrow spectrum was observed for [Fe(opo)3] in the THF solution in contrast to the very broad spectrum of [Fe(acac)3] in THF. The narrow, completely isotropic signal of [Fe(opo)3] disagreed with a metal-centred S = 5/2 spin system that is observed in the solid state. We assume spin-delocalisation from the Fe to the opo ligand through an opo-to-FeIII electron transfer. All compounds show several electrochemical reduction waves in the range of −1 to −3 V vs. the ferrocene/ferrocenium couple. While for Hopo and the ZnII complex all of them are opo-centred, for CuII and FeIII the very first one-electron reductions are metal-centred. Electronic absorption in the UV to vis range are due to π−π* transitions in the opo core, giving Hopo and [Zn(opo)2] a yellow-to-orange colour. The structured bands ranging from 400 to 500 for all compounds are assigned to the lowest energy π−π* transitions. They show markedly higher intensities and slight shifts for the CuII (brown) and FeIII (red) complexes and we assume admixing metal contributions (MLCT for CuII, LMCT for FeIII). For both complexes long-wavelength absorptions assignable to d–d transitions were detected. Detailed spectroelectrochemical experiments confirm both the electrochemical and the optical assignments but cannot find any evidence for electron transfer in the parent [Fe(opo)3] (described as [FeII(opo)(opo)2]) as was inferred from the narrow EPR signal in solution nor for species containing the reduced opo radical opo•2−. UV-vis spectroelectrochemistry revealed typical absorption bands for the reduced ligand opo•2− in the reduced complex [ZnII(opo•2−)(opo)]•‒. The failure to observe these bands at 460 and 630 nm when reducing the CuII and FeIII complexes confirmed the metal-centred CuII/CuI and FeIII/FeII redox pairs. In contrast to the similar acetylacetonate ligand acac, the 14-electron aromatic core of opo led to interesting optical features, while it reduced the acidity of Hopo compared with Hacac in organic solvents. Hopo and the ZnII, CuII and FeIII complex showed high antiproliferative activity against the human cancer cell lines HT-29 and MCF-7.

4. Experimental Section

4.1. Instrumentation

NMR spectra were recorded on a Bruker Avance II 300 MHz spectrometer, using a triple resonance 1H, nBB inverse probe head. The unambiguous assignment of the 1H and 13C resonances was obtained from 1H NOESY, 1H COSY, gradient selected 1H, 13C HSQC and HMBC experiments. All 2D NMR experiments were performed using standard pulse sequences from the Bruker pulse program library (Bruker, Rheinhausen, Germany). Chemical shifts were relative to TMS. UV-vis absorption spectra were measured on Varian Cary50 Scan (Varian Medical Systems, Darmstadt, Germany) or Shimadzu UV-3600 photo spectrometers (Shimadzu Europe, Duisburg, Germany). Elemental analyses were carried out using a HEKAtech CHNS EuroEA 3000 Analyzer (HEKAtech, Wegberg, Germany). EPR spectra were recorded in the X-band on a Bruker System ELEXSYS 500E (Bruker, Rheinhausen, Germany) equipped with a Bruker Variable Temperature Unit ER 4131VT (500 to 100 K or an Oxford Instruments helium-cryostat (300 to 4 K); the g values were calibrated using a dpph sample. Simulation of the EPR spectra were performed using the PEST Winsim software [100]. Electrochemical experiments were carried out in 0.1 M nBu4NPF6 solutions using a three-electrode configuration (glassy-carbon working electrode, Pt counter electrode, Ag/AgCl pseudo reference) and an Autolab PGSTAT30 potentiostat and function generator (Metrohm, Filderstadt, Germany). The ferrocene/ferrocenium couple served as internal reference. The voltammetric determination of pKa values was carried out as described in the literature [71] using freshly sublimed 2,4-benzoquinone. UV-vis spectroelectrochemical measurements were performed with an optical transparent thin-layer electrochemical (OTTLE) cell [101,102].

4.2. Crystal Structure Determination

Measurements were performed at 293(2) K using graphite-monochromatised Mo–Ka radiation (λ = 0.71073 Å) on a IPDS I diffractometer (STOE and Cie., Darmstadt, Germany). The structures were solved by dual space methods (SHELXT-2015) [103] and refined by full-matrix least-squares techniques against (SHELXL-2017/1) [104,105]. The non-hydrogen atoms were refined with anisotropic displacement parameters without any constraints. The hydrogen atoms were included by using appropriate riding models. The numerical absorption corrections (X-RED V1.31; STOE and Cie., 2015) [106] were performed after optimising the crystal shapes using X-SHAPE V1.06 (STOE and Cie., 1999) [107]. More details on the crystal structures provided in the SI. CCDC 2071044 contain the full crystallographic data for [Fe(opo)3]. These data can be obtained free of charge at www.ccdc.cam.ac.uk/conts/retrieving.html (accessed on 30 March 2021) or from the Cambridge Crystallographic Data Centre, 12 Union Road, Cambridge, CB2 1EZ UK. Fax: +44-1223-336-033; Email: [email protected].

4.3. Antiproliferative Activities.

The antiproliferative effects of the compounds were determined following an established procedure [99]. In short, cells were suspended in a cell culture medium (HT-29: 2850 cells/mL, MCF-7: 10000 cells/mL), and 100 mL aliquots thereof were plated in well plates and incubated at 37 °C: 5% CO2 for 48 h (HT-29) or 72 h (MCF-7). Stock solutions of the compounds in dimethylformamide (DMF) were freshly prepared and diluted with cell culture medium to the desired concentrations (final DMF concentration: 0.1% v/v). The medium in the plates was replaced with medium containing the compounds in graded concentrations (six replicates). After further incubation for 72 h (HT-29) or 96 h (MCF-7) the cell biomass was determined by crystal violet staining and the IC50 values were determined as those concentrations causing 50% inhibition of cell proliferation. Results were calculated from two independent experiments.

4.4. Materials and Syntheses

Water-free reactions were carried out under inert gas conditions and performed using Schlenk techniques. Solvents were dried using a MBRAUN MB SPS-800 solvent purification system. 9-Hydroxyphenalenone (Hopo) was synthesised from cinnamoyl chloride and 2-methoxynaphthalene in 92% yield following a literature procedure [108]. The acac complexes [M(acac)2] (M = Ni, Cu, Zn) and [Fe(acac)3] were synthesised as published [109].

4.5. Synthesis of the Opo Complexes

[Fe(opo)3]. 200 mg (0.57 mmol) [Fe(acac)3] was ‒issolved in MeOH, a suspension of 294 mg (1.71 mmol) Hopo in MeOH was added, and the mixture was stirred at an ambient temperature for 16 h. The resulting precipitate was filtered off, washed with acetone and dried in vacuo to yield 288 mg (0.45 mmol, 78%) of a dark red solid. Elemental analyses: calc for C39H21O6Fe (M = 641.43 g mol−1) C 73.03; H 3.30; found: C 73.09; H 3.33. EI-MS(+): 641 [M]+, 446 [Fe(opo)2]+ m/z.
[Cu(opo)2]. 0.50 g (1.9 mmol) [Cu(acac)2] was dissolved in MeOH, a suspension of 0.65 g (3.8 mmol) Hopo in MeOH was added, and the mixture was stirred at an ambient temperature for 16 h. The resulting precipitate was filtered off and washed with acetone to yield 0.82 mg (1.8 mmol, 98%) of a brown solid which was dried in vacuo. Elemental analyses: calc for C26H14O4Cu (M = 453.93 g mol−1) C 68.79; H 3.11; found: C 68.72; H 3.13. EI-MS(+): 453 [M]+. m/z.
[Zn(opo)2]. 200 mg (0.76 mmol) anhydrous [Zn(acac)2] was suspended in MeOH. a suspension of 261 mg (1.52 mmol) Hopo in MeOH was added, and the mixture was stirred at an ambient temperature for 4 h. The resulting voluminous precipitate was filtered off, washed with acetone and dried in vacuo to yield 283 mg (0.62 mmol, 81%) of a yellowish solid. 1H NMR (300 MHz, acetone-d6): δ = 8.13 (d, 2H, H2,8), 8.07 (d, 2H, H3,7), 7.52 (t, 1H, H5), 7.08 (d, 2H, H4,6) ppm. Elemental analyses: calc for C26H14O4Zn (M = 455.78 g mol−1) C 68.52; H 3.10; found: C 69.07; H 3.15. EI-MS(+): 454 [M]+ m/z.
Reaction of Hopo with [Ni(acac)2]. 200 mg (0.68 mmol) [Ni(acac)2] was dissolved in MeOH, a suspension of 234 mg (1.36 mmol) Hopo in MeOH was added, and the mixture was stirred overnight. The resulting yellow precipitate was filtered off and washed with acetone to yield 305 mg of a yellow-brown solid. Elemental analyses found: C 61.12; H 3.73.

Supplementary Materials

The following are available online at https://0-www-mdpi-com.brum.beds.ac.uk/article/10.3390/ijms22083976/s1, Figure S1: View on the crystal structure of [Fe(opo)3] along the crystallographic a and b axes., Figure S2: π-stacking interactions in the crystal of [Fe(opo)3], Figure S3: Further π-stacking in the crystal of [Fe(opo)3], Figure S4: X-band EPR spectrum of [Cu(opo)2] in DMF at 298 K with simulation, Figure S5: X-band EPR spectrum of solid [Fe(opo)3] at 298 K, Figure S6: Cyclic voltammogramms of Hopo, Figure S7: UV-vis absorption spectrum of [Zn(opo)2] in MeOH, Figure S8: UV-vis absorption spectrum of [Cu(opo)2] in DMF, Figure S9: UV-vis absorption spectrum of [Fe(opo)3] in DMF, Figure S10: Absorption spectra of [Zn(opo)2] recorded during reduction, Figure S11: Absorption spectra of [Zn(opo)2] recorded during reduction, Table S1: Crystallographic and structure refinement data of [Fe(opo)3], Table S2: Selected metrical data of [Fe(opo)3], Figure S12: ORTEP-representations of [Ni4(OCH3)4(acac)4(CH3OH)4], Table S3: Selected distances and angles of the two cluster type compounds, Table S4: FIR vibration frequencies for the nickel cluster and [Ni(acac)2].

Author Contributions

K.B. designed the project and carried out the syntheses. A.H. carried out EPR experiments and simulation, did the data management and provided figures. S.S. refined the crystal structure and provided data and figures. I.O. and J.S. carried out the antiproliferative experiments. A.K. designed and supervised the project and wrote the manuscript. All authors have read and agreed to the published version of the manuscript.

Funding

This research received no external funding.

Acknowledgments

A.H. and A.K. thank Bernd Neumeier Department of Chemistry, Institute for Nuclear Chemistry, Cologne University Clinics, Institute of Radiochemistry, and Research Center Jülich for financial support.

Conflicts of Interest

The authors declare no conflict of interest.

References

  1. Koelsch, C.F.; Antes, J.A. Studies in the perinaphthalene series. IV. Some attempts to synthesize 9-phenyl-perinaphthanone-7. J. Org. Chem. 1941, 6, 558–565. [Google Scholar] [CrossRef]
  2. Jackman, L.M.; Trewella, J.C.; Haddon, R.C. Studies in Nuclear Magnetic Resonance Spectroscopy. 17. Deuteron Quadrupole Coupling Constants in Intramolecularly Hydrogen Bonded Systems. J. Am. Chem. Soc. 1980, 102, 2519–2525. [Google Scholar] [CrossRef]
  3. Rossetti, R.; Rayford, R.; Haddon, R.C.; Brus, L.E. Proton Localization in an Asymmetric Double-Minimum Potential: 2-Methyl-9-hydroxyphenalenone. J. Am. Chem. Soc. 1981, 103, 4303–4307. [Google Scholar] [CrossRef]
  4. Kunze, K.L.; de la Vega, J.R. Intramolecular Proton Exchange in 9-Hydroxyphenalen-1-one and Methyl-9-hydroxyphenalen-1-one. J. Am. Chem. Soc. 1984, 106, 6528–6537. [Google Scholar] [CrossRef]
  5. Engdahl, C.; Gogoll, A.; Edlund, U. Long-Range Deuterium Isotope Effects on 13C NMR Shifts of Intramolecularly Hydrogen-Bonded 9-Hydroxyphenalen-1-ones. Magn. Reson. Chem. 1991, 29, 54–62. [Google Scholar] [CrossRef]
  6. Nakai, H.; Sodeyama, K. Energy density analysis (EDA) of proton transfer reactions in malonaldehyde, tropolone, and 9-hydroxyphenalenone. J. Mol. Struct. (Theochem.) 2003, 637, 27–35. [Google Scholar] [CrossRef]
  7. Wang, D.-P.; Chen, S.-G.; Chen, D.-Z. Theoretical studies of conjugate and substituent effects on the intramolecular proton transfer: An HF/CIS study. J. Photochem. Photobiol. A 2004, 162, 407–414. [Google Scholar] [CrossRef]
  8. Kuwahara, D.; Koyano, H.; Manaka, T.; Nakamura, H.; Mochida, T.; Sugawara, T. Dynamics of 9-Hydroxyphenalenone Studied by One-Dimensional Solid-State Spin Exchange NMR. J. Phys. Chem. A 2006, 110, 13731–13735. [Google Scholar] [CrossRef] [PubMed]
  9. Müller, C.; Schroeder, J.; Troe, J. Intramolecular Hydrogen Bonding in 1,8-Dihydroxyanthraquinone, 1-Aminoanthraquinone, and 9-Hydroxyphenalenone Studied by Picosecond Time-Resolved Fluorescence, Spectroscopy in a Supersonic Jet. J. Phys. Chem. B 2006, 110, 19820–19832. [Google Scholar] [CrossRef] [PubMed]
  10. Weihrich, R.; Limage, M.H.; Parker, F.; Fillaux, F. Proton tunnelling in the intramolecular hydrogen bond of 9-Hydroxyphenalenone. J. Mol. Struct. 2004, 700, 147–149. [Google Scholar] [CrossRef]
  11. Haddon, R.C.; Chichester, S.V.; Marshall, J.H. Electron Delocalization in 9-Oxidophenalenone Complexes of Boron and Beryllium. Tetrahedron 1986, 42, 6293–6300. [Google Scholar] [CrossRef]
  12. Chi, X.; Itkis, M.E.; Kirschbaum, K.; Pinkerton, A.A.; Oakley, R.T.; Cordes, A.W.; Haddon, R.C. Dimeric Phenalenyl-Based Neutral Radical Molecular Conductors. J. Am. Chem. Soc. 2001, 123, 4041–4048. [Google Scholar] [CrossRef] [PubMed]
  13. Chi, X.; Itkis, M.E.; Tham, F.S.; Oakley, R.T.; Corders, A.W.; Haddon, R.C. Synthesis, Structure, and Physical Properties of a New Phenalenyl-Based Neutral Radical Crystal: Correlation between Structure and Transport Properties in Carbon-Based Molecular Conductors. Int. J. Quantum Chem. 2003, 95, 853–865. [Google Scholar] [CrossRef]
  14. Mandal, S.K.; Samanta, S.; Itkis, M.E.; Jensen, D.W.; Reed, R.W.; Oakley, R.T.; Tham, F.S.; Donnadieu, B.; Haddon, R.C. Resonating Valence Bond Ground State in Oxygen-Functionalized Phenalenyl-Based Neutral Radical Molecular Conductors. J. Am. Chem. Soc. 2006, 128, 1982–1994. [Google Scholar] [CrossRef] [PubMed]
  15. Pal, S.K.; Itkis, M.E.; Tham, F.S.; Reed, R.W.; Oakley, R.T.; Donnadieu, B.; Haddon, R.C. Phenalenyl-Based Neutral Radical Molecular Conductors: Substituent Effects on Solid-State Structures and Properties. J. Am. Chem. Soc. 2007, 129, 7163–7174. [Google Scholar] [CrossRef] [PubMed]
  16. Chi, X.; Itkis, M.E.; Patrick, B.O.; Barclay, T.M.; Reed, R.W.; Oakley, R.T.; Cordes, A.W.; Haddon, R.C. The First Phenalenyl-Based Neutral Radical Molecular Conductor. J. Am. Chem. Soc. 1999, 121, 10395–10402. [Google Scholar] [CrossRef]
  17. Stary, J.; Liljenzin, J.O. Critical evaluation of equilibrium constants involving acetylacetone and its metal chelates. Pure Appl. Chem. 1982, 54, 2557–2592. [Google Scholar] [CrossRef]
  18. Kaim, W. Chelate rings of different sizes with non-innocent ligands. Dalton Trans. 2019, 48, 8521–8529. [Google Scholar] [CrossRef]
  19. Vigato, P.A.; Peruzzo, V.; Tamburini, S. The evolution of β-diketone or β-diketophenol ligands and related complexes. Coord. Chem. Rev. 2009, 253, 1099–1201. [Google Scholar] [CrossRef]
  20. Hynes, M.J. Reactions of of β-diketone complexes in solution. Rev. Inorg. Chem. 1990, 11, 21–78. [Google Scholar] [CrossRef]
  21. Demura, Y.; Kawato, T.; Kanatomi, H.; Murase, I. Metal Chelates of 9-Hydroxy-1-phenalenone. Bull. Chem. Soc. Jpn. 1975, 48, 2820–2824. [Google Scholar] [CrossRef] [Green Version]
  22. Neidlein, R.; Behzadi, Z. Synthesis and properties of some metal chelates of 9-hydroxyphenalen-1-one. Chemiker-Zeitung 1976, 100, 388–389. [Google Scholar]
  23. Hofmann, M.; Musso, H. Synthesis of metal complexes with bis(phenalenyl)imine ligands. Liebigs Ann. 1990, 11, 1119–1124. [Google Scholar] [CrossRef]
  24. Pal, S.K.; Tham, F.S.; Reed, R.W.; Oakley, R.T.; Haddon, R.C. Synthesis and characterization of germanium (IV) and silicon (IV) complexes derived from 9-hydroxyphenalenone: X-ray crystal and molecular structure of tris-(9-oxophenalenone)-germanium (IV) and silicon (IV) salts. Polyhedron 2005, 24, 2076–2083. [Google Scholar] [CrossRef]
  25. Zeng, Z.; Zhou, J.; Zhang, Y.; Qiao, R.; Xia, S.; Chen, J.; Wang, X.; Zhang, B. Photodynamic Properties of Hypocrellin A, Complexes with Rare Earth Trivalent Ions:  Role of the Excited State Energies of the Metal Ions. J. Phys. Chem. B 2007, 111, 2688–2696. [Google Scholar] [CrossRef]
  26. Van Deun, R.; Fias, P.; Nockemann, P.; Van Hecke, K.; Van Meervelt, L.; Binnemans, K. Visible-Light-Sensitized Near-Infrared Luminescence from Rare-Earth Complexes of the 9-Hydroxyphenalen-1-one Ligand. Inorg. Chem. 2006, 45, 10416–10418. [Google Scholar] [CrossRef]
  27. Van Deun, R.; Nockemann, P.; Fias, P.; Van Hecke, K.; Van Meervelt, L.; Binnemans, K. Visible light sensitisation of europium(III) luminescence in a 9-hydroxyphenal-1-one complex. Chem. Commun. 2005, 7, 590–592. [Google Scholar] [CrossRef] [PubMed]
  28. Lan, Y.; Magri, A.; Fuhr, O.; Ruben, M. Phenalenyl-based mononuclear dysprosium complexes. Beilstein J. Nanotechnol. 2016, 7, 995–1009. [Google Scholar] [CrossRef] [Green Version]
  29. Mochida, T.; Torigoe, R.; Koinuma, T.; Asano, C.; Satou, T.; Koike, K.; Nikaido, T. Platinum-Group Chelate Complexes with 9-Hydroxyphenalenone Derivatives: Synthesis, Structures, Spectroscopic Properties and Cytotoxic Activities. Eur. J. Inorg. Chem. 2006, 2006, 558–565. [Google Scholar] [CrossRef]
  30. Kokoschka, M.; Galgonek, J.; Vondrasek, J.; Hobza, P. Computational methods for the description of pharmacologically relevant platinum complexes—Molecular structure and bond dissociation. Phys. Chem. Chem. Phys. 2016, 18, 4051–4062. [Google Scholar] [CrossRef]
  31. Dutta, P.K.; Sharma, R.; Kumari, S.; Dubey, R.D.; Sarkar, S.; Paulraj, J.; Vijaykumar, G.; Pandey, M.; Sravanti, L.; Samarla, M.; et al. A safe and efficacious Pt(II) anticancer prodrug: Design, synthesis, in vitro efficacy, the role of carrier ligands and in vivo tumour growth inhibition. Chem. Commun. 2019, 55, 1718–1721. [Google Scholar] [CrossRef] [PubMed]
  32. López-Arencibia, A.; Bethencourt-Estrell, C.J.; Freijo, M.B.; Reyes-Batlle, M.; Sifaoui, I.; Nicolás-Hernández, D.S.; McNaughton-Smith, G.; Lorenzo-Morales, J.; Abad-Grillo, T.; Pinero, J.E. New phenalenone analogues with improved activity against Leishmania species. Biomed. Pharmacother. 2020, 132, 110814. [Google Scholar] [CrossRef] [PubMed]
  33. Freijo, M.B.; Lopez-Arencibia, A.; Pinero, J.E.; McNaughton-Smith, G.; Abad-Grillo, T. Design, synthesis and evaluation of amino-substituted 1H-phenalen-1-ones as anti-leishmanial agents. Eur. J. Med. Chem. 2018, 143, 1312–1324. [Google Scholar] [CrossRef]
  34. O’Brien, E.M.; Morgan, B.J.; Mulrooney, C.A.; Carroll, P.J.; Kozlowski, M.C. Perylenequinone Natural Products: Total Synthesis of Hypocrellin A. J. Org. Chem. 2010, 75, 57–68. [Google Scholar] [CrossRef] [PubMed] [Green Version]
  35. Ma, G.; Khan, S.I.; Jacob, M.R.; Tekwani, B.L.; Li, Z.; Pasco, D.S.; Walker, L.A.; Khan, I.A. Antimicrobial and Antileishmanial Activities of Hypocrellins A and B. Antimicrob. Agents Chemother. 2004, 48, 4450–4452. [Google Scholar] [CrossRef] [PubMed] [Green Version]
  36. Diwu, Z.; Zimmermann, J.; Meyers, T.; Lown, J.W. Design, Synthesis and Investigation of Mechanisms of Action of Novel Protein Kinase C Inhibitors: Perylenequinoid Pigments. Biochem. Pharmacol. 1994, 47, 373–385. [Google Scholar] [CrossRef]
  37. Niu, T.; Tian, Y.; Shi, Y.; Guo, G.; Tong, Y.; Wang, G. Antifibrotic effects of Hypocrellin A combined with LED red light irradiation on keloid fibroblasts by counteracting the TGF-β/Smad/autophagy/apoptosis signalling pathway. Photodiag. Photodyn. Ther. 2021, 34, 102202. [Google Scholar] [CrossRef] [PubMed]
  38. Ding, Y.; Liu, W.; Wu, J.; Zheng, X.; Ge, J.; Ren, H.; Zhang, W.; Lee, C.-S.; Wang, P. Near-Infrared Hypocrellin Derivatives for Synergistic Photodynamic and Photothermal Therapy. Chem.-Asian J. 2020, 15, 3456–3468. [Google Scholar] [CrossRef]
  39. Tian, C.; Xu, S.; Chen, S.; Shen, J.; Zhang, M.; Shen, T. Chelation of Hypocrellin B with Zinc Ions with Electron Paramagnetic Resonance (EPR) Evidence of the Photodynamic Activity of the Resulting Chelate. Free Radic. Res. 2001, 35, 543–554. [Google Scholar] [CrossRef]
  40. Sun, Y.; Hou, Y.-J.; Zhou, Q.-X.; Lei, W.-H.; Chen, J.-R.; Wang, X.-S.; Zhang, B.-W. Dinuclear Cu(II) Hypocrellin B Complexes with Enhanced Photonuclease Activity. Inorg. Chem. 2010, 49, 10108–10116. [Google Scholar] [CrossRef] [PubMed]
  41. Sun, Y.; Hou, Y.-J.; Zhou, Q.-X.; Chen, J.-R.; Zhang, B.-W.; Wang, X.-S. A new Co(III)-hypocrellin B complex with enhanced photonuclease activity. J. Inorg. Biochem. 2011, 105, 978–984. [Google Scholar] [CrossRef]
  42. Zhou, L.; Ge, X.; Liu, J.; Zhou, J.; Wei, S.; Li, F.; Shen, J. Internal heavy atom effect of Au(III) and Pt(IV) on hypocrellin A for enhanced in vitro photodynamic therapy of cancer. Bioorg. Med. Chem. Lett. 2013, 23, 5317–5324. [Google Scholar] [CrossRef] [PubMed]
  43. Zhao, X.; Huang, C.Z. A molecular logic gate for the highly selective recognition of pyrophosphate with a hypocrellin A-Zn(II) complex. Analyst 2010, 135, 2853–2857. [Google Scholar] [CrossRef] [PubMed]
  44. Kaim, W.; Lahiri, G.K. The coordination potential of indigo, anthraquinone and related redox-active dyes. Coord. Chem. Rev. 2019, 393, 1–8. [Google Scholar] [CrossRef]
  45. Hazari, A.S.; Paretzki, A.; Fiedler, J.; Zalis, S.; Kaim, W.; Lahiri, G.K. Different manifestations of enhanced π-acceptor ligation at every redox level of [Os(9-OP)L2]n, n = 2+, +, 0, − (9-OP = 9-oxidophenalenone and L = bpy or pap). Dalton Trans. 2016, 45, 18241–18251. [Google Scholar] [CrossRef] [PubMed] [Green Version]
  46. Agarwala, H.; Scherer, T.M.; Mobin, S.M.; Kaim, W.; Lahiri, G.K. Bidirectional non-innocence of the β-diketonato ligand 9-oxidophenalenone (L) in [Ru([9]aneS3)(L)(dmso)]n, [9]aneS3 = 1,4,7-trithiacyclononane. Dalton Trans. 2014, 43, 3939–3948. [Google Scholar] [CrossRef]
  47. Das, A.; Scherer, T.M.; Mondal, P.; Mobin, S.M.; Kaim, W.; Lahiri, G.K. Experimental and DFT Evidence for the Fractional Non-Innocence of a β-Diketonate Ligand. Chem.-Eur. J. 2012, 18, 14434–14443. [Google Scholar] [CrossRef]
  48. Das, A.; Scherer, T.M.; Mobin, S.M.; Kaim, W.; Lahiri, G.K. 9-Oxidophenalenone: A Noninnocent β-Diketonate Ligand? Inorg. Chem. 2012, 51, 4390–4397. [Google Scholar] [CrossRef] [PubMed]
  49. Mukherjee, A.; Samuel, P.P.; Schulzke, C.; Mandal, S.K. Main group chemistry of 9-hydroxophenalenone: Syntheses and structural characterization of the alkaline earth and zinc complexes. J. Chem. Sci. 2014, 126, 1581–1588. [Google Scholar] [CrossRef]
  50. Lehner, P.; Staudinger, C.; Borisov, S.M.; Klimant, I. Ultra-sensitive optical oxygen sensors for characterization of nearly anoxic systems. Nat. Commun. 2014, 5, 4460. [Google Scholar] [CrossRef] [Green Version]
  51. Yakuschenko, I.K.; Kaplunov, M.G.; Krasnikova, S.S. Some Metal Complexes of 9-Hydroxyphenalenone as Novel Electron Transporting Materials for OLEDs. Mol. Cryst. Liq. Cryst. 2014, 590, 24–28. [Google Scholar] [CrossRef]
  52. Bag, P.; Itkis, M.E.; Stekovic, D.; Pal, S.K.; Tham, F.S.; Haddon, R.C. Band Structure Engineering by Substitutional Doping in Solid-State Solutions of [5-Me-PLY(O,O)]2B(1−x)Bex Radical Crystals. J. Am. Chem. Soc. 2015, 137, 10000–10008. [Google Scholar] [CrossRef]
  53. Mukherjee, A.; Sau, S.C.; Mandal, S.K. Exploring Closed-Shell Cationic Phenalenyl: From Catalysis to Spin Electronics. Acc. Chem. Res. 2017, 50, 1679–1691. [Google Scholar] [CrossRef]
  54. Stekovic, D.; Bag, P.; Shankhari, P.; Fokwa, B.P.T.; Itkis, M.E. Effect of Substitution on the Hysteretic Phase Transition in a Bistable Phenalenyl-Based Neutral Radical Molecular Conductor. Chem. Eur. J. 2019, 25, 4166–4174. [Google Scholar] [CrossRef] [PubMed]
  55. Ahmed, J.; Datta, P.; Das, A.; Jomy, S.; Mandal, S.K. Switching between mono and doubly reduced odd alternant hydrocarbon: Designing a redox catalyst. Chem. Sci. 2021, 12, 3039–3049. [Google Scholar] [CrossRef]
  56. Dey, S.K.; Honecker, A.; Mitra, P.; Mandal, S.K.; Mukherje, A. Magnetostructural Studies on Tetranuclear Manganese [MnIII2MnII2] Complexes of 9-Hydroxyphenalenone with Weak π···π Interactions. Eur. J. Inorg. Chem. 2012, 2012, 5814–5824. [Google Scholar] [CrossRef]
  57. Pariyar, A.; Vijaykumar, G.; Bhunia, M.; Dey, S.K.; Singh, S.K.; Kurungot, S.; Mandal, S.K. Switching Closed-Shell to Open-Shell Phenalenyl: Toward Designing Electroactive Materials. J. Am. Chem. Soc. 2015, 137, 5955–5960. [Google Scholar] [CrossRef]
  58. Tan, C.-M.; Zhou, Y.-H.; Chen, C.-Y.; Yu, J.-F.; Chen, K.-Q. Spin filtering and rectifying effects in the zinc methyl phenalenyl molecule between graphene nanoribbon leads. Org. Electron. 2016, 28, 244–251. [Google Scholar] [CrossRef]
  59. Wahl, I.M.; Westphal, E.; da Costa Gouveia, T.L.; Sousa Santana, F.; Hughes, D.L.; Ribeiro, R.R.; Piccoli, L.H.R.; Winnischofer, H. Methyl Ester Functionalized Phenalenyl Arene- and Bipyridine−Ruthenium-Based Complexes for Electroactive Langmuir−Blodgett Films. Inorg. Chem. 2019, 58, 8408–8418. [Google Scholar] [CrossRef] [PubMed]
  60. Vijaykumar, G.; Bhunia, M.; Mandal, S.K. A phenalenyl-based nickel catalyst for the hydroboration of olefins under ambient conditions. Dalton Trans. 2019, 48, 5779–5784. [Google Scholar] [CrossRef]
  61. Vardhanapu, P.K.; Ahmed, J.; Jose, A.; Shaw, B.K.; Sen, T.K.; Mathews, A.A.; Mandal, S.K. Phenalenyl Based Aluminum Compound for Catalytic C−H Arylation of Arene and Heteroarenes at Room Temperature. J. Org. Chem. 2019, 84, 289–299. [Google Scholar] [CrossRef] [PubMed]
  62. Vijaykumar, G.; Pariyar, A.; Ahmed, J.; Shaw, B.K.; Adhikari, D.; Mandal, S.K. Tuning the redox non-innocence of a phenalenyl ligand toward efficient nickel-assisted catalytic hydrosilylation. Chem. Sci. 2018, 9, 2817–2825. [Google Scholar] [CrossRef] [PubMed] [Green Version]
  63. Chakraborty, S.; Ahmed, J.; Shaw, B.K.; Jose, A.; Mandal, S.K. An Iron-Based Long-Lived Catalyst for Direct C‒H Arylation of Arenes and Heteroarenes. Chem.-Eur. J. 2018, 24, 17651–17655. [Google Scholar] [CrossRef]
  64. Bellan, E.V.; Thevenin, L.; Gayet, F.; Fliedel, C.; Poli, R. Catalyzed Chain Transfer in Vinyl Acetate Polymerization Mediated by 9-Oxyphenalenone Cobalt(II) Complexes. ACS Macro Lett. 2017, 6, 959–962. [Google Scholar] [CrossRef]
  65. Bhunia, M.; Sahoo, S.R.; Shaw, B.K.; Vaidya, S.; Pariyar, A.; Vijaykumar, G.; Adhikari, D.; Mandal, S.K. Storing redox equivalent in the phenalenyl backbone towards catalytic multi-electron reduction. Chem. Sci. 2019, 10, 7433–7441. [Google Scholar] [CrossRef] [Green Version]
  66. Dey, S.K.; Mukherjee, A. Zero-Order Catechol Oxidase Activity by a Mononuclear Manganese(III) Complex Showing High Turnover Comparable to Catechol Oxidase Enzyme. ChemCatChem. 2013, 5, 3533–3537. [Google Scholar] [CrossRef]
  67. Das, A.; Ghosh, T.K.; Chowdhury, A.D.; Mobin, S.M.; Lahiri, G.K. Electronic structure and catalytic aspects of [(trpy)(Cl)Ru(L)]n incorporating potential non-innocent ligands, L: 9-Oxidophenalenone and trpy: 2,2’:6’,2”-terpyridine. Polyhedron 2013, 52, 1130–1137. [Google Scholar] [CrossRef]
  68. Sen, T.K.; Mukherjee, A.; Modak, A.; Mandal, S.K.; Koley, D. Substitution effect on phenalenyl backbone in the rate of organozinc catalyzed ROP of cyclic esters. Dalton Trans. 2013, 42, 1893–1904. [Google Scholar] [CrossRef]
  69. Mukherjee, A.; Sen, T.K.; Ghorai, P.K.; Samuel, P.P.; Schulzke, C.; Mandal, S.K. Phenalenyl-Based Organozinc Catalysts for Intramolecular Hydroamination Reactions: A Combined Catalytic, Kinetic, and Mechanistic Investigation of the Catalytic Cycle. Chem.-Eur. J. 2012, 18, 10530–10545. [Google Scholar] [CrossRef]
  70. Ahmed, J.; Sreejyothi, P.; Vijaykumar, G.; Jose, A.; Raj, M.; Mandal, S.K. A new face of phenalenyl-based radicals in the transition metal-free C–H arylation of heteroarenes at room temperature: Trapping the radical initiator via C–C σ-bond formation. Chem. Sci. 2017, 8, 7798–7806. [Google Scholar] [CrossRef] [Green Version]
  71. Kim, H.-S.; Chung, T.D.; Kim, H. Voltammetric determination of the pKa of various acids in polar aprotic solvents using 1,4-benzoquinone. J. Electroanal. Chem. 2001, 498, 209–215. [Google Scholar] [CrossRef]
  72. Small, D.; Zaitsev, V.; Jung, Y.; Rosokha, S.V.; Head-Gordon, M.; Kochi, J.K. Intermolecular π-to-π Bonding between Stacked Aromatic Dyads. Experimental and Theoretical Binding Energies and Near-IR Optical Transitions for Phenalenyl Radical/Radical versus Radical/Cation Dimerizations. J. Am. Chem. Soc. 2004, 126, 13850–13858. [Google Scholar] [CrossRef] [PubMed]
  73. Caes, B.; Jensen, D., Jr. Synthesis and Characterization of 9-Hydroxyphenalenone Using 2D NMR Techniques. J. Chem. Educ. 2008, 85, 413–415. [Google Scholar] [CrossRef]
  74. Baker, T.M.; Howard, K.M.; Brennessel, W.W.; Neidig, M.L. Crystal structure of a third polymorph of tris(acetylacetonato-κ2-O:O’)iron(III). Acta Cryst. Sect. E Struct. Rep. Online 2015, E71, m228–m229. [Google Scholar] [CrossRef]
  75. Bullen, G.J.; Mason, R.; Pauling, P. The Crystal and Molecular Structure of Bis(acetylacetonato)nickel(II). Inorg. Chem. 1965, 4, 456–462. [Google Scholar] [CrossRef]
  76. Mehrotra, R.C.; Bohra, R.; Gaur, D.P. Metal ß-Diketones and Allied Derivatives; Academic Press: London, UK; New York, NY, USA, 1978. [Google Scholar]
  77. Kessler, V.G.; Spijksma, G.I.; Seisenbaeva, G.A.; Hakansson, S.; Blank, D.H.A.; Bouvmeester, H.J.M. New insight in the role of modifying ligands in the sol-gel processing of metal alkoxide precursors: A possibility to approach new classes of materials. J. Sol-Gel Sci. Technol. 2006, 40, 163–179. [Google Scholar] [CrossRef]
  78. Montgomery, H.; Lingafaelter, E.C. The crystal structure of diaquobisacetylacetonatonickel(II). Acta Cryst. 1964, 17, 1481–1482. [Google Scholar] [CrossRef]
  79. Kudrat-E-Zahan, M.; Nishida, Y.; Sakiyama, H. Identification of cis/trans isomers of bis(acetylacetonato)nickel(II) complexes in solution based on electronic spectra. Inorg. Chim. Acta 2010, 363, 168–172. [Google Scholar] [CrossRef]
  80. Tahir, A.A.; Hamid, M.; Zeller, M.; Mazhar, M.; Hunter, A.D. Bis(µ-acetylacetonato-κ2-O:O’)bis[(acetylacetonato-κ2-O:O’)aquanickel(II)] hemihydrate. Acta Cryst. Sect. E Struct. Rep. Online 2007, E63, m272–m274. [Google Scholar] [CrossRef]
  81. Darensbourg, M.; Buonomo, R.M.; Reibenspies, J.H. Crystal structure of tetrakis[(µ3-methoxo-2,4-pentanedionatomethanolnickel(II)], C28H56Ni4O. Z. Kristallogr. 1995, 210, 469–470. [Google Scholar]
  82. El Fallah, M.S.; Rentschler, E.; Caneschi, A.; Gatteschi, D. Synthesis, crystal structure and magnetic properties of the tetranuclear complex [Ni4(OCH3)4(dbm)4(CH3OH)4]2·(C2H5)2O. Inorg. Chim. Acta 1996, 247, 231–235. [Google Scholar] [CrossRef]
  83. Worthy, A.; Grosjean, A.; Pfrunder, M.C.; Xu, Y.; Yan, C.; Edwards, G.; Clegg, J.K.; McMurtrie, J.C. Atomic resolution of structural changes in elastic crystals of copper(II) acetylacetonate. Nat. Chem. 2018, 10, 65–69. [Google Scholar] [CrossRef]
  84. Moreno, Y.; Arrue, R.; Saavedra, R.; Pivan, J.-Y.; Pena, O.; Roisnell, T. Magnetic and Structural Study of Unsolvated [Cu(acac)2], (acac = acetylacetonate). J. Chil. Chem. Soc. 2013, 58, 2122–2124. [Google Scholar] [CrossRef] [Green Version]
  85. Ritterskamp, N.; Sharples, K.; Richards, E.; Folli, A.; Chiesa, M.; Platts, J.A.; Murphy, D.M. Understanding the Coordination Modes of [Cu(acac)2(imidazole)n=1,2] Adducts by EPR, ENDOR, HYSCORE, and DFT Analysis. Inorg. Chem. 2017, 56, 11862–11875. [Google Scholar] [CrossRef] [PubMed]
  86. Carter, E.; Sharples, K.M.; Platts, J.A.; Murphy, D.M. Structure determination of bound nitrogen-based adducts with copper(II) acetylacetonato; an EPR, ENDOR and DFT study. Phys. Chem. Chem. Phys. 2015, 17, 11445–11454. [Google Scholar] [CrossRef] [PubMed]
  87. Butera, R.A.; Waldeck, D.H. An EPR Experiment for the Undergraduate Physical Chemistry Laboratory. J. Chem. Educ. 2000, 77, 1489–1491. [Google Scholar] [CrossRef]
  88. Yordanov, N.D.; Shopov, D. EPR Spectra of Mixed-Ligand Copper(II) Complexes in Solution. J. Inorg. Nucl. Chem. 1976, 38, 137–140. [Google Scholar] [CrossRef]
  89. Nunes, P.; Nagy, N.V.; Alegria, E.C.B.A.; Pombeiro, A.J.L.; Correia, I. The solvation and electrochemical behavior of copper acetylacetonate complexes in ionic liquids. J. Mol. Struct. 2014, 1060, 142–149. [Google Scholar] [CrossRef] [Green Version]
  90. Collison, D.; Powell, A.K. Electron Spin Resonance Studies of “FeO6” Tris Chelate Complexes: Models for the Effects of Zero-Field Splitting in Distorted S = 5/2 Spin Systems. Inorg. Chem. 1990, 29, 4735–4746. [Google Scholar] [CrossRef]
  91. Hedewy, S.; Hoffmann, K. Electron Paramagnetic Resonance of Ferric Acetyl Acetonate. Phys. Status Solidi A 1986, 97, 129–133. [Google Scholar] [CrossRef]
  92. Mohammadnezhad, G.; Amirian, A.A.; Görls, H.; Plass, W.; Sandleben, A.; Schäfer, S.; Klein, A. Redox Instability of Copper(II) Complexes of a Triazine-Based PNP Pincer. Eur. J. Inorg. Chem. 2021, 2021, 1140–1151. [Google Scholar] [CrossRef]
  93. Bubrin, M.; Kvapilová, H.; Fiedler, J.; Ehret, F.; Záliš, S.; Kaim, W. Hybrid α-Diimine/Bis(chalcogenoether) Ligands for Copper(I) and Copper(II) Complexes. Z. Anorg. Allg. Chem. 2018, 644, 661–670. [Google Scholar] [CrossRef]
  94. Butsch, B.; Klein, A.; Nitsche, S.; Stirnat, K.; Hawkett, J.R.; McInnes, E.J.L.; Bauer, M. Generation and characterisation of the phenoxyl-radical containing Cu(II) complex [Cu(triaz)2]+ (triaz = O,N chelating triazole-phenolate). Dalton Trans. 2012, 41, 11464–11475. [Google Scholar] [CrossRef] [PubMed]
  95. Nagao, H.; Komeda, N.; Mukaida, M.; Suzuki, M.; Tanaka, K. Structural and Electrochemical Comparison of Copper(II) Complexes with Tripodal Ligands. Inorg. Chem. 1996, 35, 6809–6815. [Google Scholar] [CrossRef]
  96. Pladzyk, A.; Ponikiewski, L.; Dołega, A.; Słowy, K.; Sokołowska, A.; Dziubinska, K.; Hnatejko, Z. Structural Variety of Cobalt(II), Nickel(II), Zinc(II), and Cadmium(II) Complexes with 4,4’-Azopyridine:Synthesis, Structure and Luminescence Properties. Chem.-Asian J. 2015, 10, 2388–2396. [Google Scholar] [CrossRef]
  97. Brahma, S.; Shivashankar, A. Zinc acetylacetonate hydrate adducted with nitrogen donor ligands: Synthesis, spectroscopic characterization, and thermal analysis. J. Mol. Struct. 2015, 1101, 41–49. [Google Scholar] [CrossRef]
  98. Carlotto, S.; Floreano, L.; Cossaro, A.; Dominguez, M.; Rancan, M.; Sambia, M.; Casarin, M. The electronic properties of three popular high spin complexes [TM(acac)3, TM = Cr, Mn, and Fe] revisited: An experimental and theoretical study. Phys. Chem. Chem. Phys. 2017, 19, 24840–24854. [Google Scholar] [CrossRef]
  99. Schäfer, S.; Ott, I.; Gust, R.; Sheldrick, W.S. Influence of the Polypyridyl (pp) Ligand Size on the DNA Binding Properties, Cytotoxicity and Cellular Uptake of Organoruthenium(II) Complexes of the Type [(η6-C6Me6)Ru(L)(pp)]n+ [L = Cl, n = 1; L = (NH2)2CS, n = 2]. Eur. J. Inorg. Chem. 2007, 2007, 3034–3046. [Google Scholar] [CrossRef]
  100. Duling, D.R. Simulation of Multiple Isotropic Spin-Trap EPR Spectra (PEST Winsim). J. Magn. Reson. B 1994, 104, 105–110. [Google Scholar] [CrossRef]
  101. Kaim, W.; Fiedler, J. Spectroelectrochemistry: The best of two worlds. Chem. Soc. Rev. 2009, 38, 3373–3382. [Google Scholar] [CrossRef]
  102. Kaim, W.; Klein, A. (Eds.) Spectroelectrochemistry; RSC Publishing: Cambridge, UK, 2008. [Google Scholar]
  103. Sheldrick, G.M. ShelXT—Integrated space-group and crystal-structure determination. Acta Crystallogr. Sect. A Found. Crystallogr. 2015, 71, 3–8. [Google Scholar] [CrossRef] [PubMed] [Green Version]
  104. Sheldrick, G.M. SHELXL-2017/1, Program for the Solution of Crystal Structures; University of Göttingen: Göttingen, Germany, 2017. [Google Scholar]
  105. Sheldrick, G.M. Crystal structure refinement with SHELXL. Acta Crystallogr. Sect. C Struct. Chem. 2015, 71, 3–8. [Google Scholar] [CrossRef] [PubMed]
  106. STOE X-RED. Data Reduction Program, Version 1.31/Windows; STOE & Cie: Darmstadt, Germany, 2005.
  107. STOE X-SHAPE. Crystal Optimisation for Numerical Absorption Correction, Version 1.06/Windows; STOE & Cie: Darmstadt, Germany, 1999.
  108. Haddon, R.C.; Rayford, R.; Hirani, A.M. 2-Methyl- and 5-methyl-9-hydroxyphenalenone. J. Org. Chem. 1981, 46, 4587–4588. [Google Scholar] [CrossRef]
  109. Gmelins Handbuch der Anorganischen Chemie; Verlag Chemie: Weinheim, Germany, 1975; p. 152ff.
Scheme 1. (a) 9-Hydroxyphenalenone (Hopo), a derivative of acetylacetone (Hacac). Both are able to form six-ring chelates when deprotonated. Structure of the cytotoxic Hypocrellin A. (b) Selected resonance structures of the anionic 14 valence electron system 9-oxido-phenaleneone (opo) with reduced and oxidised forms. (c) The o-quinone–semiquinone–catecholate triad.
Ijms 22 03976 sch001
Figure 1. 300 MHz 1H NMR spectra of Hopo (top) and [Zn(opo)2] (bottom) measured in acetone-d6. Assignment of Hopo protons following ref. [73].
Ijms 22 03976 g001
Figure 2. Molecular structure (left: thermal ellipsoids at 30% probability level; right: polyhedron visualisation) of [Fe(opo)3], H atoms omitted for clarity. Shown is the Δ configured enantiomer. The unit cell contains 3 enantiomeric pairs of the complex.
Ijms 22 03976 g002
Figure 3. X-band EPR spectra of [Cu(opo)2] (solid line) and of [Cu(acac)2] (dashed line) both measured in DMF at 298 K at a frequency of 9.442220 GHz.
Ijms 22 03976 g003
Figure 4. X-band EPR spectra of [Fe(opo)3] (left) and [Fe(acac)3] (right) in THF solution at 298 K.
Ijms 22 03976 g004
Figure 5. Cyclic voltammogramms of [Zn(opo)2] in DMF/nBu4NPF6 at 298 K.
Ijms 22 03976 g005
Figure 6. Cyclic voltammogramms of [Cu(opo)2] in DMF/nBu4NPF6 at 298 K, * marks an adsorption process on the electrode.
Ijms 22 03976 g006
Figure 7. Absorption spectra of [Cu(opo)2] recorded during electrochemical reduction at −1.0 V in DMF/nBu4NPF6 solution.
Ijms 22 03976 g007
Figure 8. Absorption spectra of [Fe(opo)3] recorded during electrochemical reduction at −1.0 V in THF/nBu4NPF6 solution.
Ijms 22 03976 g008
Table 1. Electrochemical properties of Hopo and opo complexes a.
CompoundE½(Mn+1/Mn)E½(1ligand)E½(2ligand)
Hopo-−1.52−2.51
[Fe(opo)3] b−1.19−1.31−1.60
[Fe(acac)3]−1.13−1.41-
[Cu(opo)2]−0.92 c−1.61−1.91
[Cu(acac)2]−1.19 d−1.66−2.51
[Zn(opo)2]-−1.42−2.50
[Zn(acac)2]-−1.51-
a Cyclic voltammetry measured in DMF/nBu4NPF6 at 298 K with 100 mV/s scan rate using a glassy-carbon working electrode; potentials in V vs. ferrocene/ferrocenium. E1/2 = half-wave potentials for reversible processes, Epc = cathodic peak potentials, Epa = anodic peak potentials. b Measurements using a Pt working electrode gave −1.25, −1.83, and −2.23 V. c Averaged value from Epc = −1.39 V and Epa = −0.44 V. d Averaged value of Epc = −1.60 V and Epa = −0.78 V.
Table 2. UV-vis absorption data of Hopo, opo, and acac complexes a.
Compoundε/nm (ε/Lmol−1cm−1)Solvent
Hopo350(1230), 393(333), 413(606), 428(504), 438(717), 451(133)CH3OH
[Zn(opo)2]351(1512), 393(328), 414(589), 429(626), 438(705), 453(377)CH3OH
Hopo350(1231), 393(331), 413(607), 428(502), 438(719), 451(131)DMF
[Cu(opo)2]294(8600), 358(6400), 403(1070), 426(2470), 452(3520), 651(260)DMF
[Cu(acac)2]376sh(5480), 639(1120), 642(260)DMF
Hopo235(950), 257(607), 265(567), 350(1230), 393(296), 414 (538), 430(397), 439(607)THF
[Fe(opo)3]265(15690), 327(4610), 361(6310), 368(6280), 453(3470), 480(2930), 571(230)THF
[Fe(acac)3]273(28449), 353(4154), 435(4193)THF
a In the case of the Cu and Zn complexes we assume the species [M(opo)2(solvent)x] to be the absorbing species as in the case for [M(acac)2(solvent)x] (x = 1 or 2) [84,85,86,96,97].
Table 3. Antiproliferative properties—IC50 values/µM.
HT-29MCF-7
cisplatin7.0 ± 2 [99]2.0 ± 0.3 [99]
Hopo6.65 µM ± 0.705.11 µM ± 1.81
[Cu(opo)2]10.40 µM ± 0.365.52 µM ± 1.06
[Fe(opo)3]5.32 µM ± 0.714.73 µM ± 1.06
[Zn(opo)2]4.17 µM ± 0.293.67 µM ± 1.26
Publisher’s Note: MDPI stays neutral with regard to jurisdictional claims in published maps and institutional affiliations.

