
Pathophysiological In Vitro Profile of Neuronal Differentiated Cells Derived from Niemann-Pick Disease Type C2 Patient-Specific iPSCs Carrying the NPC2 Mutations c.58G>T/c.140G>T

 ,
,  and
and 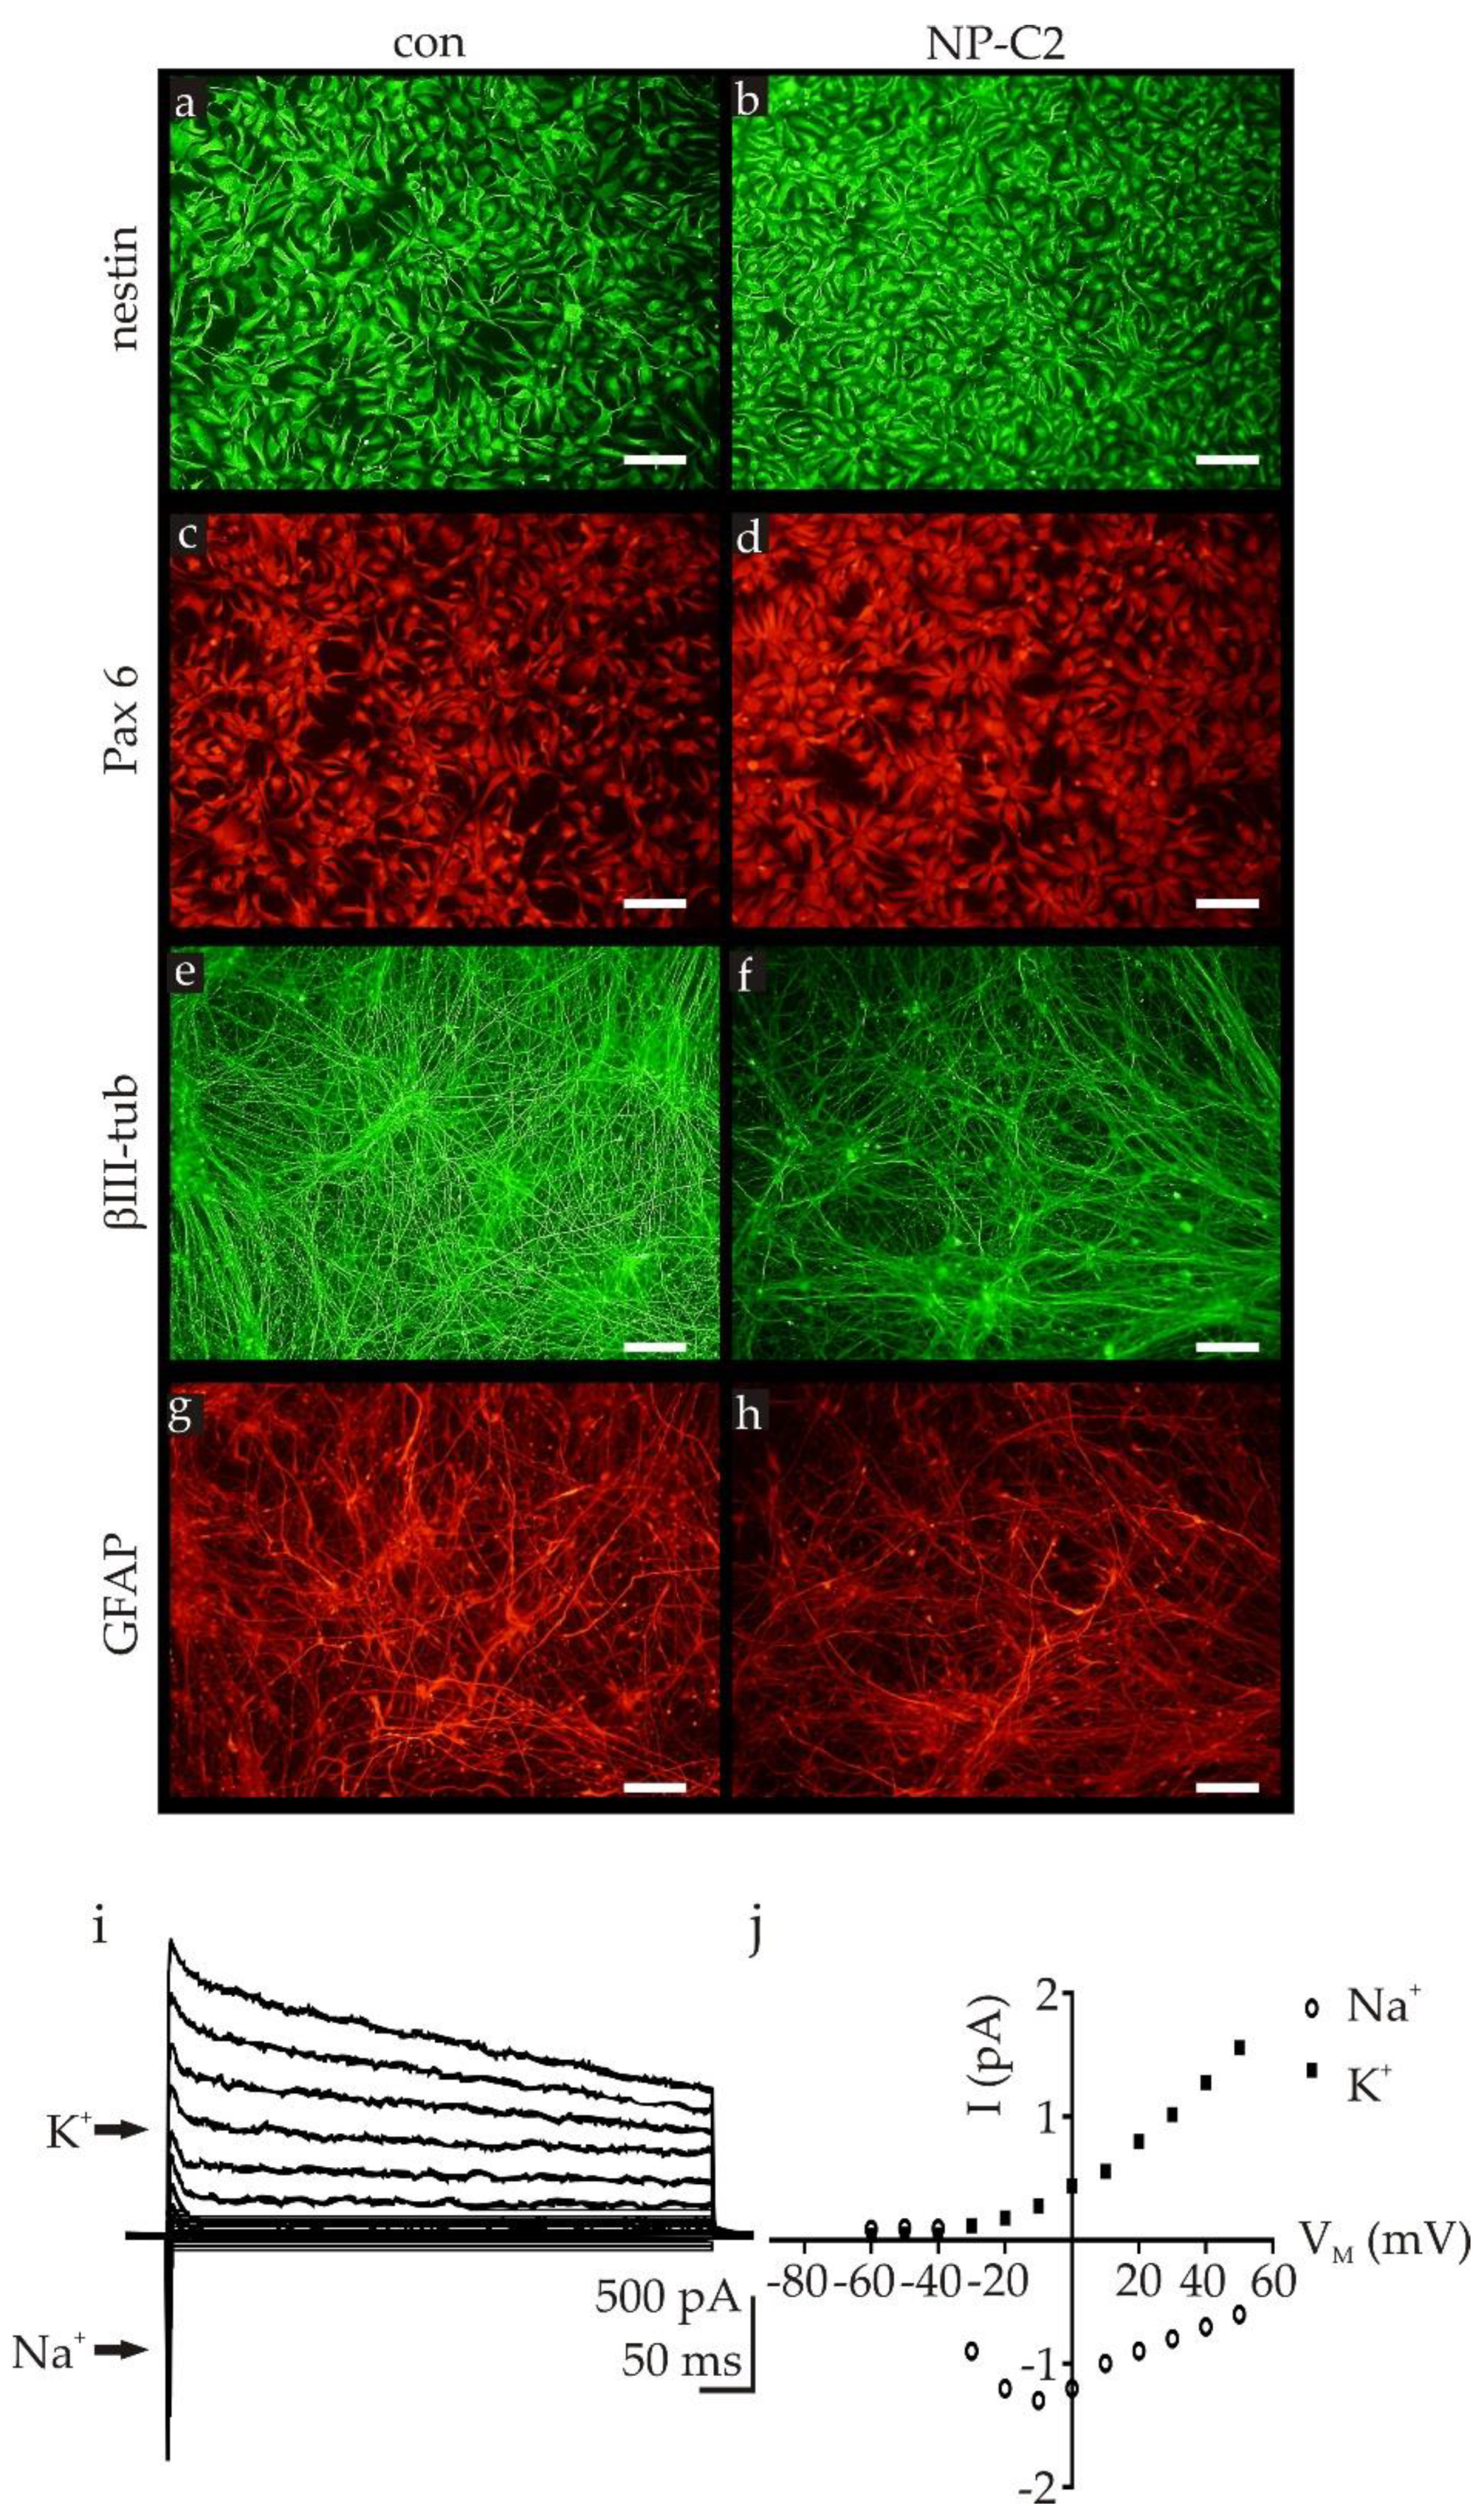
Abstract
:1. Introduction
2. Results
2.1. Differentiation of NPC2-Deficient Neurons and Glia Cells
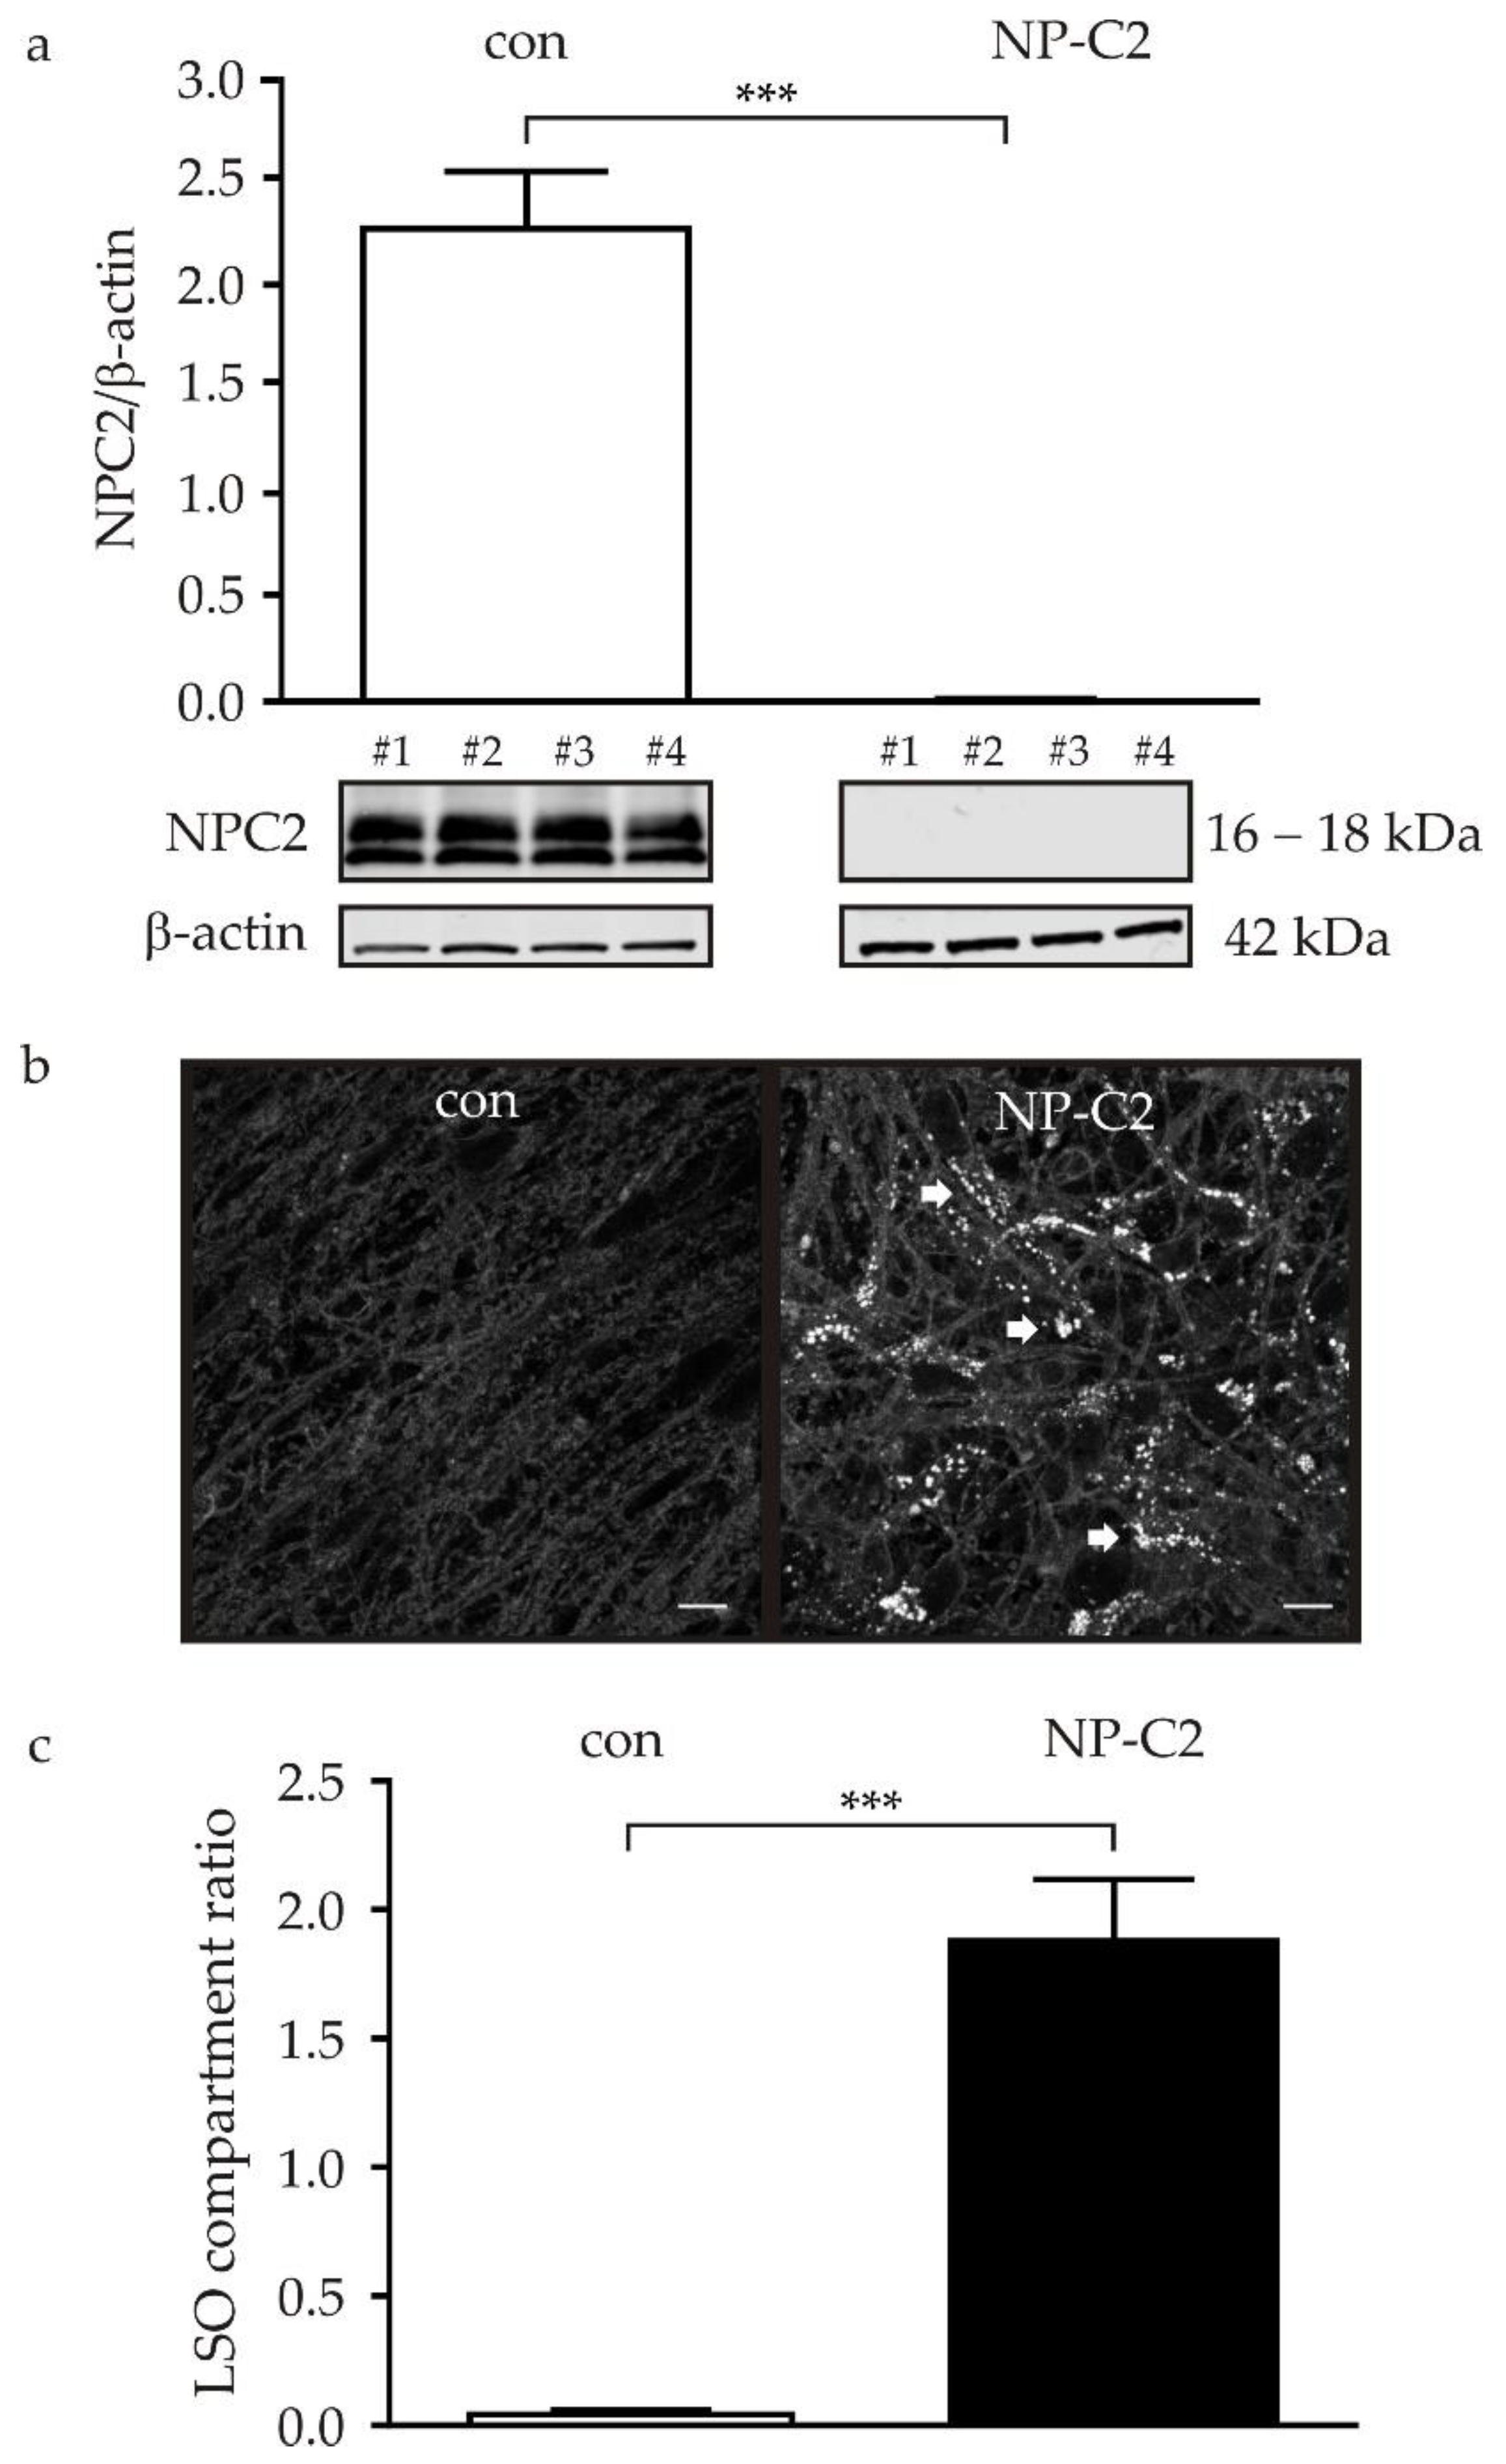
2.2. NPC2 Protein Level and Cholesterol Accumulation in NPC2-Deficient NDCs
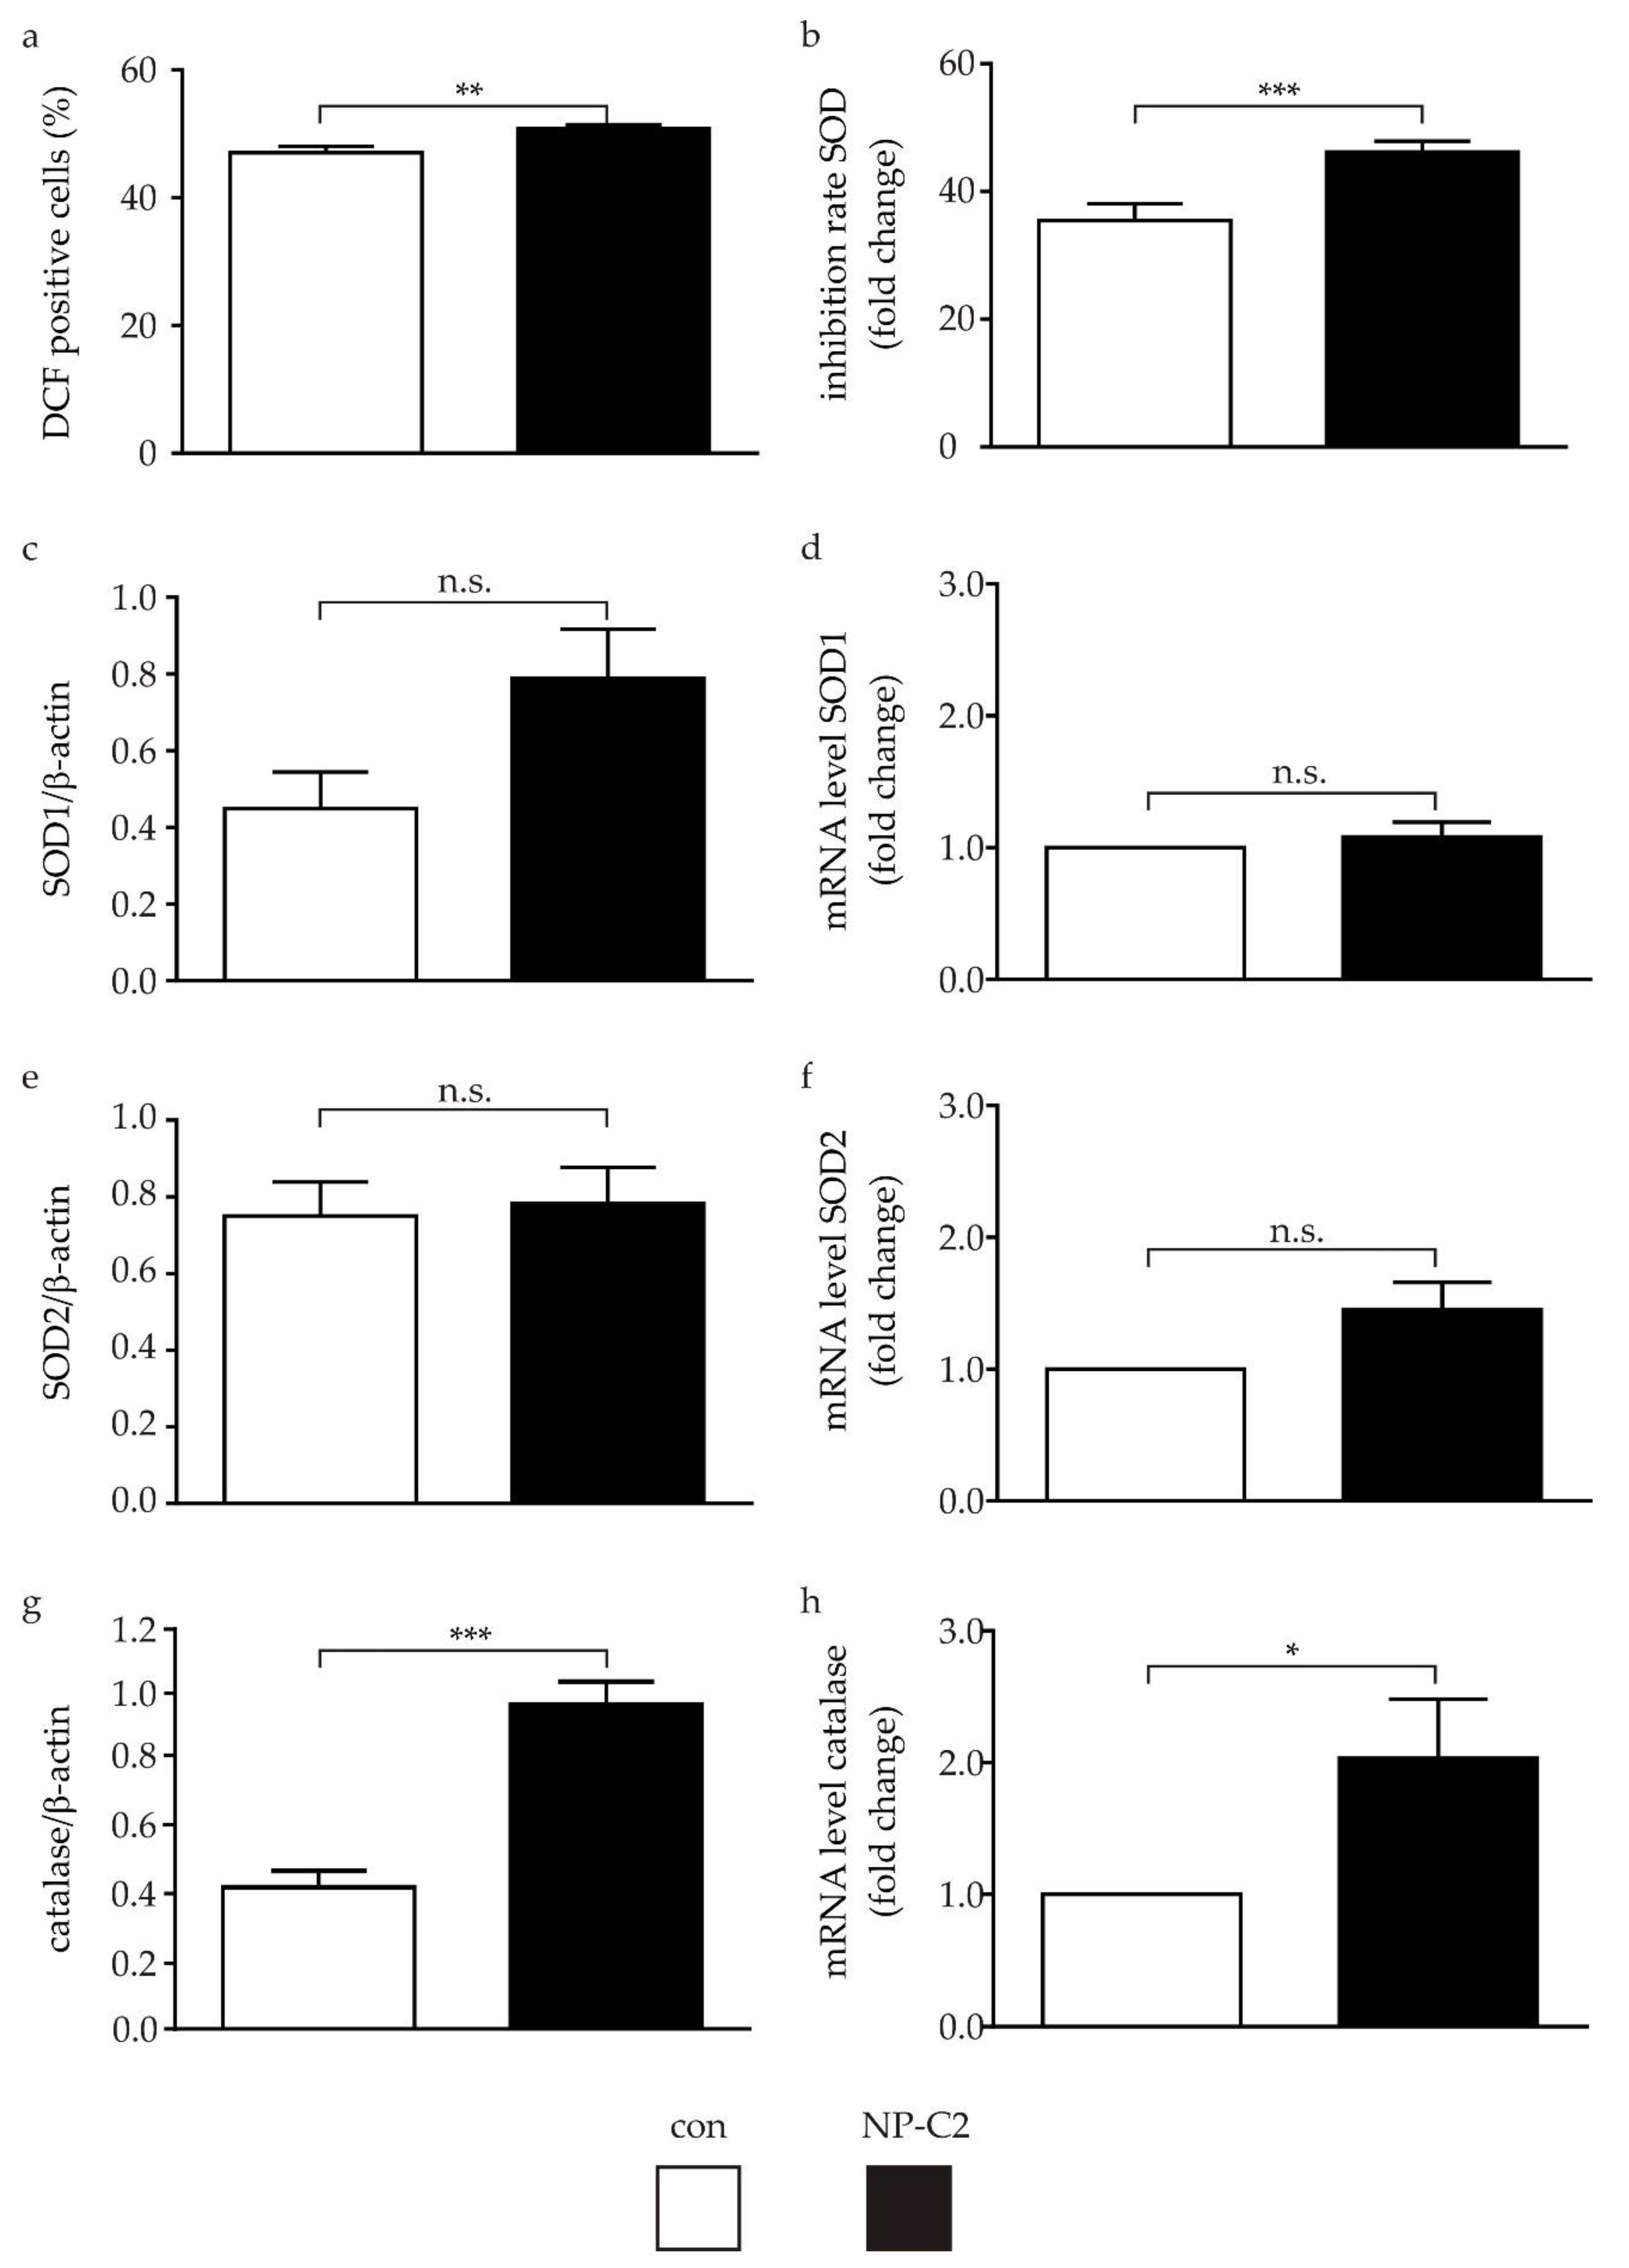
2.3. Determination of ROS and Proteins of the Oxidative Stress Defense System
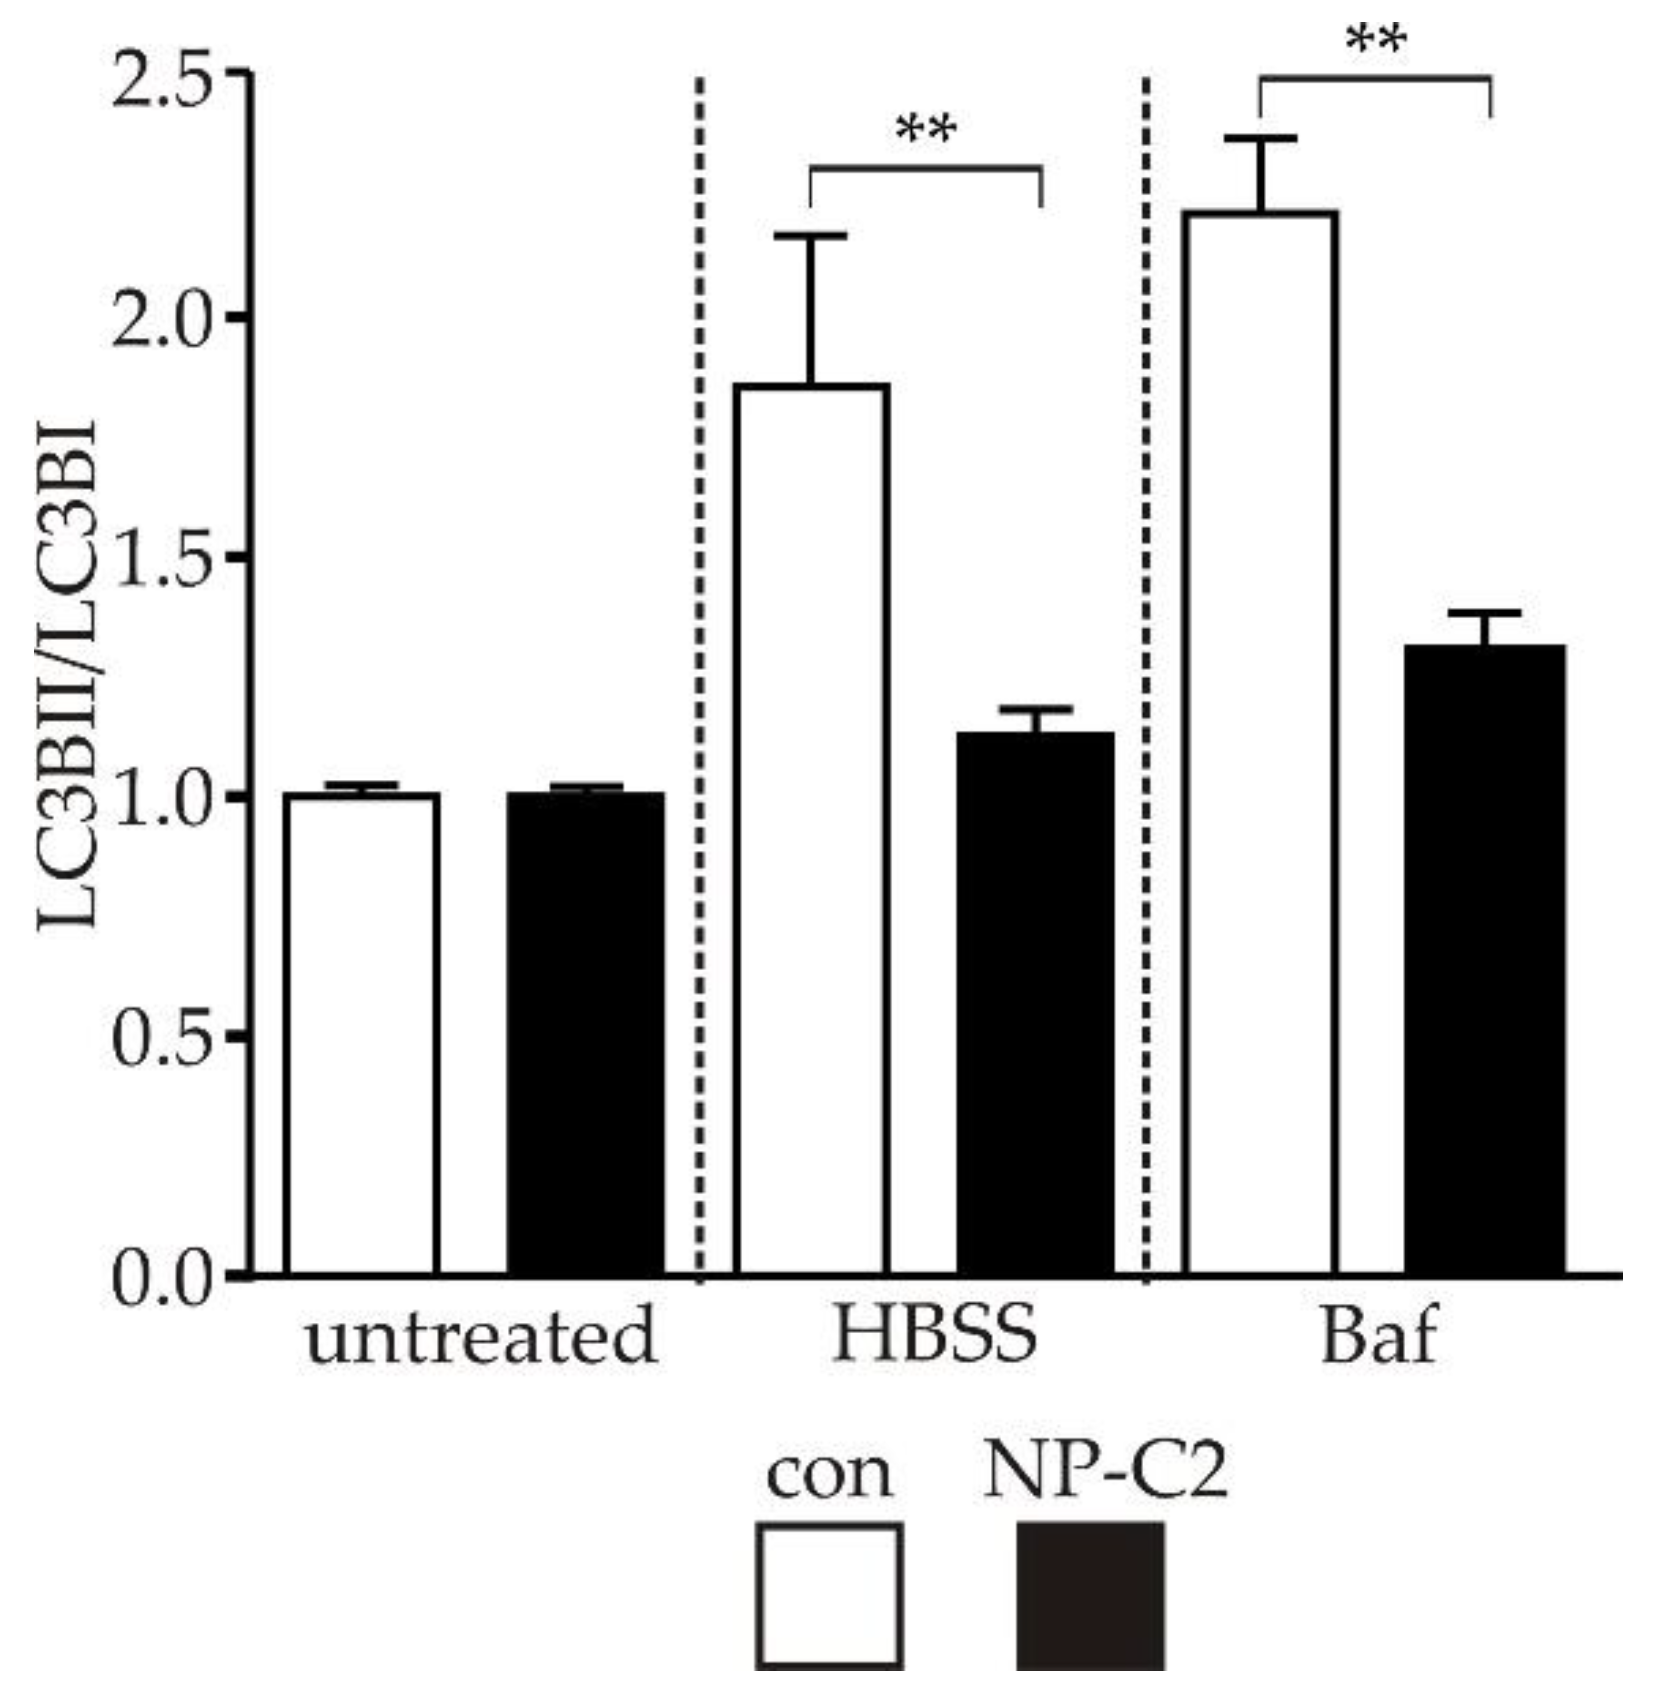
2.4. Evaluation of Autophagy
3. Discussion
3.1. Lipid Accumulation
3.2. Oxidative Stress in NPC2-Deficient Cells
3.3. Autophagy in NPC2-Deficient Cells
4. Materials and Methods
4.1. Culture of Human Fibroblasts
4.2. Generation and Culture of iPSCs
4.3. Neural and Neuronal Differentiation
4.4. Patch Clamp Recordings
4.5. Evaluation of the Autophagic Flux
4.6. Western Blot
4.7. Filipin Staining
4.8. Immunocytochemical Staining
4.9. DCF Fluorescence Measurement of ROS Level
4.10. Measurement of SOD Activity
4.11. RT-qPCR
4.12. Statistical Analysis
5. Conclusions
Supplementary Materials
Author Contributions
Funding
Institutional Review Board Statement
Informed Consent Statement
Data Availability Statement
Acknowledgments
Conflicts of Interest
References
- Pfeffer, S.R. NPC intracellular cholesterol transporter 1 (NPC1)-mediated cholesterol export from lysosomes. J. Biol. Chem. 2019, 294, 1706–1709. [Google Scholar] [CrossRef] [Green Version]
- Cologna, S.M.; Rosenhouse-Dantsker, A. Insights into the Molecular Mechanisms of Cholesterol Binding to the NPC1 and NPC2 Proteins. Adv. Exp. Med. Biol. 2019, 1135, 139–160. [Google Scholar] [CrossRef]
- Vanier, M.T. Niemann-Pick diseases. Handb. Clin. Neurol. 2013, 113, 1717–1721. [Google Scholar] [PubMed]
- Millat, G.; Chikh, K.; Naureckiene, S.; Sleat, D.E.; Fensom, A.H.; Higaki, K.; Elleder, M.; Lobel, P.; Vanier, M.T. Niemann-Pick disease type C: Spectrum of HE1 mutations and genotype/phenotype correlations in the NPC2 group. Am. J. Hum. Genet. 2001, 69, 1013–1021. [Google Scholar] [CrossRef] [PubMed] [Green Version]
- Völkner, C.; Peter, F.; Liedtke, M.; Krohn, S.; Lindner, I.; Murua Escobar, H.; Cimmaruta, C.; Lukas, J.; Hermann, A.; Frech, M.J. Generation of the Niemann-Pick type C2 patient-derived iPSC line AKOSi001-A. Stem Cell Res. 2019, 41, 101606. [Google Scholar] [CrossRef] [PubMed]
- Seker Yilmaz, B.; Baruteau, J.; Rahim, A.A.; Gissen, P. Clinical and Molecular Features of Early Infantile Niemann Pick Type C Disease. Int. J. Mol. Sci. 2020, 21, 5059. [Google Scholar] [CrossRef] [PubMed]
- Trilck, M.; Hübner, R.; Seibler, P.; Klein, C.; Rolfs, A.; Frech, M.J. Niemann-Pick type C1 patient-specific induced pluripotent stem cells display disease specific hallmarks. Orphanet J. Rare Dis. 2013, 8, 144. [Google Scholar] [CrossRef] [Green Version]
- Trilck, M.; Peter, F.; Zheng, C.; Frank, M.; Dobrenis, K.; Mascher, H.; Rolfs, A.; Frech, M.J. Diversity of glycosphingolipid GM2 and cholesterol accumulation in NPC1 patient-specific iPSC-derived neurons. Brain Res. 2017, 1657, 52–61. [Google Scholar] [CrossRef] [PubMed]
- Peter, F.; Trilck, M.; Rabenstein, M.; Rolfs, A.; Frech, M.J. Dataset in support of the generation of Niemann-Pick disease Type C1 patient-specific iPS cell lines carrying the novel NPC1 mutation c.1180TC or the prevalent c.3182TC mutation-Analysis of pluripotency and neuronal differentiation. Data Brief 2017, 12, 123–131. [Google Scholar] [CrossRef]
- Rabenstein, M.; Peter, F.; Joost, S.; Trilck, M.; Rolfs, A.; Frech, M.J. Decreased calcium flux in Niemann-Pick type C1 patient-specific iPSC-derived neurons due to higher amount of calcium-impermeable AMPA receptors. Mol. Cell. Neurosci. 2017. [Google Scholar] [CrossRef]
- Gimpl, G.; Gehrig-Burger, K. Cholesterol reporter molecules. Biosci. Rep. 2007, 27, 335–358. [Google Scholar] [CrossRef] [PubMed]
- Pipalia, N.H.; Huang, A.; Ralph, H.; Rujoi, M.; Maxfield, F.R. Automated microscopy screening for compounds that partially revert cholesterol accumulation in Niemann-Pick C cells. J. Lipid Res. 2006, 47, 284–301. [Google Scholar] [CrossRef] [PubMed] [Green Version]
- Gilgun-Sherki, Y.; Melamed, E.; Offen, D. Oxidative stress induced-neurodegenerative diseases: The need for antioxidants that penetrate the blood brain barrier. Neuropharmacology 2001, 40, 959–975. [Google Scholar] [CrossRef]
- Jürs, A.V.; Völkner, C.; Liedtke, M.; Huth, K.; Lukas, J.; Hermann, A.; Frech, M.J. Oxidative Stress and Alterations in the Antioxidative Defense System in Neuronal Cells Derived from NPC1 Patient-Specific Induced Pluripotent Stem Cells. Int. J. Mol. Sci. 2020, 21, 7667. [Google Scholar] [CrossRef] [PubMed]
- Guo, F.; Liu, X.; Cai, H.; Le, W. Autophagy in neurodegenerative diseases: Pathogenesis and therapy. Brain Pathol. 2018, 28, 3–13. [Google Scholar] [CrossRef] [PubMed]
- Elrick, M.J.; Yu, T.; Chung, C.; Lieberman, A.P. Impaired proteolysis underlies autophagic dysfunction in Niemann-Pick type C disease. Hum. Mol. Genet. 2012, 21, 4876–4887. [Google Scholar] [CrossRef] [Green Version]
- Chikh, K.; Vey, S.; Simonot, C.; Vanier, M.T.; Millat, G. Niemann-Pick type C disease: Importance of N-glycosylation sites for function and cellular location of the NPC2 protein. Mol. Genet. Metab. 2004, 83, 220–230. [Google Scholar] [CrossRef]
- Xu, Y.; Zhang, Q.; Tan, L.; Xie, X.; Zhao, Y. The characteristics and biological significance of NPC2: Mutation and disease. Mutat. Res. 2019, 782, 108284. [Google Scholar] [CrossRef]
- Dardis, A.; Zampieri, S.; Gellera, C.; Carrozzo, R.; Cattarossi, S.; Peruzzo, P.; Dariol, R.; Sechi, A.; Deodato, F.; Caccia, C.; et al. Molecular Genetics of Niemann-Pick Type C Disease in Italy: An Update on 105 Patients and Description of 18 NPC1 Novel Variants. J. Clin. Med. 2020, 9, 679. [Google Scholar] [CrossRef] [Green Version]
- Völkner, C.; Liedtke, M.; Hermann, A.; Frech, M.J. Pluripotent Stem Cells for Disease Modeling and Drug Discovery in Niemann-Pick Type C1. Int. J. Mol. Sci. 2021, 22, 710. [Google Scholar] [CrossRef]
- Geberhiwot, T.; Moro, A.; Dardis, A.; Ramaswami, U.; Sirrs, S.; Marfa, M.P.; Vanier, M.T.; Walterfang, M.; Bolton, S.; Dawson, C.; et al. Consensus clinical management guidelines for Niemann-Pick disease type C. Orphanet J. Rare Dis. 2018, 13, 50. [Google Scholar] [CrossRef] [Green Version]
- Millat, G.; Marçais, C.; Tomasetto, C.; Chikh, K.; Fensom, A.H.; Harzer, K.; Wenger, D.A.; Ohno, K.; Vanier, M.T. Niemann-Pick C1 disease: Correlations between NPC1 mutations, levels of NPC1 protein, and phenotypes emphasize the functional significance of the putative sterol-sensing domain and of the cysteine-rich luminal loop. Am. J. Hum. Genet. 2001, 68, 1373–1385. [Google Scholar] [CrossRef] [Green Version]
- Sun, X.; Marks, D.L.; Park, W.D.; Wheatley, C.L.; Puri, V.; O‘Brien, J.F.; Kraft, D.L.; Lundquist, P.A.; Patterson, M.C.; Pagano, R.E.; et al. Niemann-Pick C variant detection by altered sphingolipid trafficking and correlation with mutations within a specific domain of NPC1. Am. J. Hum. Genet. 2001, 68, 1361–1372. [Google Scholar] [CrossRef] [Green Version]
- Vanier, M.T. Niemann-Pick disease type C. Orphanet J. Rare Dis. 2010, 5, 16. [Google Scholar] [CrossRef] [Green Version]
- Miao, L.; St Clair, D.K. Regulation of superoxide dismutase genes: Implications in disease. Free Radic. Biol. Med. 2009, 47, 344–356. [Google Scholar] [CrossRef] [Green Version]
- Lin, M.T.; Beal, M.F. Mitochondrial dysfunction and oxidative stress in neurodegenerative diseases. Nature 2006, 443, 787–795. [Google Scholar] [CrossRef]
- Min, J.Y.; Lim, S.-O.; Jung, G. Downregulation of catalase by reactive oxygen species via hypermethylation of CpG island II on the catalase promoter. FEBS Lett. 2010, 584, 2427–2432. [Google Scholar] [CrossRef] [PubMed] [Green Version]
- Kennedy, B.E.; LeBlanc, V.G.; Mailman, T.M.; Fice, D.; Burton, I.; Karakach, T.K.; Karten, B. Pre-symptomatic activation of antioxidant responses and alterations in glucose and pyruvate metabolism in Niemann-Pick Type C1-deficient murine brain. PLoS ONE 2013, 8, e82685. [Google Scholar] [CrossRef] [Green Version]
- Bellezza, I.; Riuzzi, F.; Chiappalupi, S.; Arcuri, C.; Giambanco, I.; Sorci, G.; Donato, R. Reductive stress in striated muscle cells. Cell. Mol. Life Sci. 2020, 77, 3547–3565. [Google Scholar] [CrossRef]
- Pierzynowska, K.; Rintz, E.; Gaffke, L.; Węgrzyn, G. Ferroptosis and Its Modulation by Autophagy in Light of the Pathogenesis of Lysosomal Storage Diseases. Cells 2021, 10, 365. [Google Scholar] [CrossRef]
- Lionaki, E.; Markaki, M.; Palikaras, K.; Tavernarakis, N. Mitochondria, autophagy and age-associated neurodegenerative diseases: New insights into a complex interplay. Biochim. Biophys. Acta 2015, 1847, 1412–1423. [Google Scholar] [CrossRef] [PubMed] [Green Version]
- Nixon, R.A.; Wegiel, J.; Kumar, A.; Yu, W.H.; Peterhoff, C.; Cataldo, A.; Cuervo, A.M. Extensive involvement of autophagy in Alzheimer disease: An immuno-electron microscopy study. J. Neuropathol. Exp. Neurol. 2005, 64, 113–122. [Google Scholar] [CrossRef] [Green Version]
- Gan-Or, Z.; Dion, P.A.; Rouleau, G.A. Genetic perspective on the role of the autophagy-lysosome pathway in Parkinson disease. Autophagy 2015, 11, 1443–1457. [Google Scholar] [CrossRef]
- Evans, C.S.; Holzbaur, E.L.F. Autophagy and mitophagy in ALS. Neurobiol. Dis. 2019, 122, 35–40. [Google Scholar] [CrossRef] [PubMed]
- Sengupta, S.; Peterson, T.R.; Sabatini, D.M. Regulation of the mTOR complex 1 pathway by nutrients, growth factors, and stress. Mol. Cell 2010, 40, 310–322. [Google Scholar] [CrossRef] [Green Version]
- Mizushima, N.; Komatsu, M. Autophagy: Renovation of cells and tissues. Cell 2011, 147, 728–741. [Google Scholar] [CrossRef] [Green Version]
- Liao, G.; Yao, Y.; Liu, J.; Yu, Z.; Cheung, S.; Xie, A.; Liang, X.; Bi, X. Cholesterol accumulation is associated with lysosomal dysfunction and autophagic stress in Npc1 −/− mouse brain. Am. J. Pathol. 2007, 171, 962–975. [Google Scholar] [CrossRef] [Green Version]
- Pacheco, C.D.; Kunkel, R.; Lieberman, A.P. Autophagy in Niemann-Pick C disease is dependent upon Beclin-1 and responsive to lipid trafficking defects. Hum. Mol. Genet. 2007, 16, 1495–1503. [Google Scholar] [CrossRef] [PubMed] [Green Version]
- Ordonez, M.P.; Roberts, E.A.; Kidwell, C.U.; Yuan, S.H.; Plaisted, W.C.; Goldstein, L.S.B. Disruption and therapeutic rescue of autophagy in a human neuronal model of Niemann Pick type C1. Hum. Mol. Genet. 2012, 21, 2651–2662. [Google Scholar] [CrossRef]
- Guo, H.; Zhao, M.; Qiu, X.; Deis, J.A.; Huang, H.; Tang, Q.-Q.; Chen, X. Niemann-Pick type C2 deficiency impairs autophagy-lysosomal activity, mitochondrial function, and TLR signaling in adipocytes. J. Lipid Res. 2016, 57, 1644–1658. [Google Scholar] [CrossRef] [Green Version]
- Komatsu, M.; Waguri, S.; Ueno, T.; Iwata, J.; Murata, S.; Tanida, I.; Ezaki, J.; Mizushima, N.; Ohsumi, Y.; Uchiyama, Y.; et al. Impairment of starvation-induced and constitutive autophagy in Atg7-deficient mice. J. Cell Biol. 2005, 169, 425–434. [Google Scholar] [CrossRef]
- Wei, Y.; Pattingre, S.; Sinha, S.; Bassik, M.; Levine, B. JNK1-mediated phosphorylation of Bcl-2 regulates starvation-induced autophagy. Mol. Cell 2008, 30, 678–688. [Google Scholar] [CrossRef] [Green Version]
- Schultz, M.L.; Krus, K.L.; Kaushik, S.; Dang, D.; Chopra, R.; Qi, L.; Shakkottai, V.G.; Cuervo, A.M.; Lieberman, A.P. Coordinate regulation of mutant NPC1 degradation by selective ER autophagy and MARCH6-dependent ERAD. Nat. Commun. 2018, 9, 3671. [Google Scholar] [CrossRef] [PubMed]
- Maetzel, D.; Sarkar, S.; Wang, H.; Abi-Mosleh, L.; Xu, P.; Cheng, A.W.; Gao, Q.; Mitalipova, M.; Jaenisch, R. Genetic and chemical correction of cholesterol accumulation and impaired autophagy in hepatic and neural cells derived from Niemann-Pick Type C patient-specific iPS cells. Stem Cell Rep. 2014, 2, 866–880. [Google Scholar] [CrossRef] [PubMed] [Green Version]
- Meske, V.; Erz, J.; Priesnitz, T.; Ohm, T.-G. The autophagic defect in Niemann-Pick disease type C neurons differs from somatic cells and reduces neuronal viability. Neurobiol. Dis. 2014, 64, 88–97. [Google Scholar] [CrossRef] [PubMed]
- Sarkar, S.; Carroll, B.; Buganim, Y.; Maetzel, D.; Ng, A.H.M.; Cassady, J.P.; Cohen, M.A.; Chakraborty, S.; Wang, H.; Spooner, E.; et al. Impaired autophagy in the lipid-storage disorder Niemann-Pick type C1 disease. Cell Rep. 2013, 5, 1302–1315. [Google Scholar] [CrossRef] [PubMed] [Green Version]
- Abramoff, M.; Magalhães, P.; Ram, S.J. Image Processing with ImageJ. Biophotonics Int. 2003, 11, 36–42. [Google Scholar]
- Pfaffl, M.W. A new mathematical model for relative quantification in real-time RT-PCR. Nucleic Acids Res. 2001, 29, 45. [Google Scholar] [CrossRef]


Publisher’s Note: MDPI stays neutral with regard to jurisdictional claims in published maps and institutional affiliations. |
© 2021 by the authors. Licensee MDPI, Basel, Switzerland. This article is an open access article distributed under the terms and conditions of the Creative Commons Attribution (CC BY) license (https://creativecommons.org/licenses/by/4.0/).
Share and Cite
Liedtke, M.; Völkner, C.; Jürs, A.V.; Peter, F.; Rabenstein, M.; Hermann, A.; Frech, M.J. Pathophysiological In Vitro Profile of Neuronal Differentiated Cells Derived from Niemann-Pick Disease Type C2 Patient-Specific iPSCs Carrying the NPC2 Mutations c.58G>T/c.140G>T. Int. J. Mol. Sci. 2021, 22, 4009. https://0-doi-org.brum.beds.ac.uk/10.3390/ijms22084009
Liedtke M, Völkner C, Jürs AV, Peter F, Rabenstein M, Hermann A, Frech MJ. Pathophysiological In Vitro Profile of Neuronal Differentiated Cells Derived from Niemann-Pick Disease Type C2 Patient-Specific iPSCs Carrying the NPC2 Mutations c.58G>T/c.140G>T. International Journal of Molecular Sciences. 2021; 22(8):4009. https://0-doi-org.brum.beds.ac.uk/10.3390/ijms22084009
Chicago/Turabian StyleLiedtke, Maik, Christin Völkner, Alexandra V. Jürs, Franziska Peter, Michael Rabenstein, Andreas Hermann, and Moritz J. Frech. 2021. "Pathophysiological In Vitro Profile of Neuronal Differentiated Cells Derived from Niemann-Pick Disease Type C2 Patient-Specific iPSCs Carrying the NPC2 Mutations c.58G>T/c.140G>T" International Journal of Molecular Sciences 22, no. 8: 4009. https://0-doi-org.brum.beds.ac.uk/10.3390/ijms22084009