
PET Molecular Imaging: A Holistic Review of Current Practice and Emerging Perspectives for Diagnosis, Therapeutic Evaluation and Prognosis in Clinical Oncology


Abstract
:1. Introduction
2. PET Molecular Imaging: A Powerful Quantitative Imaging Tool with Different Levels of Analysis
2.1. Visual Analysis
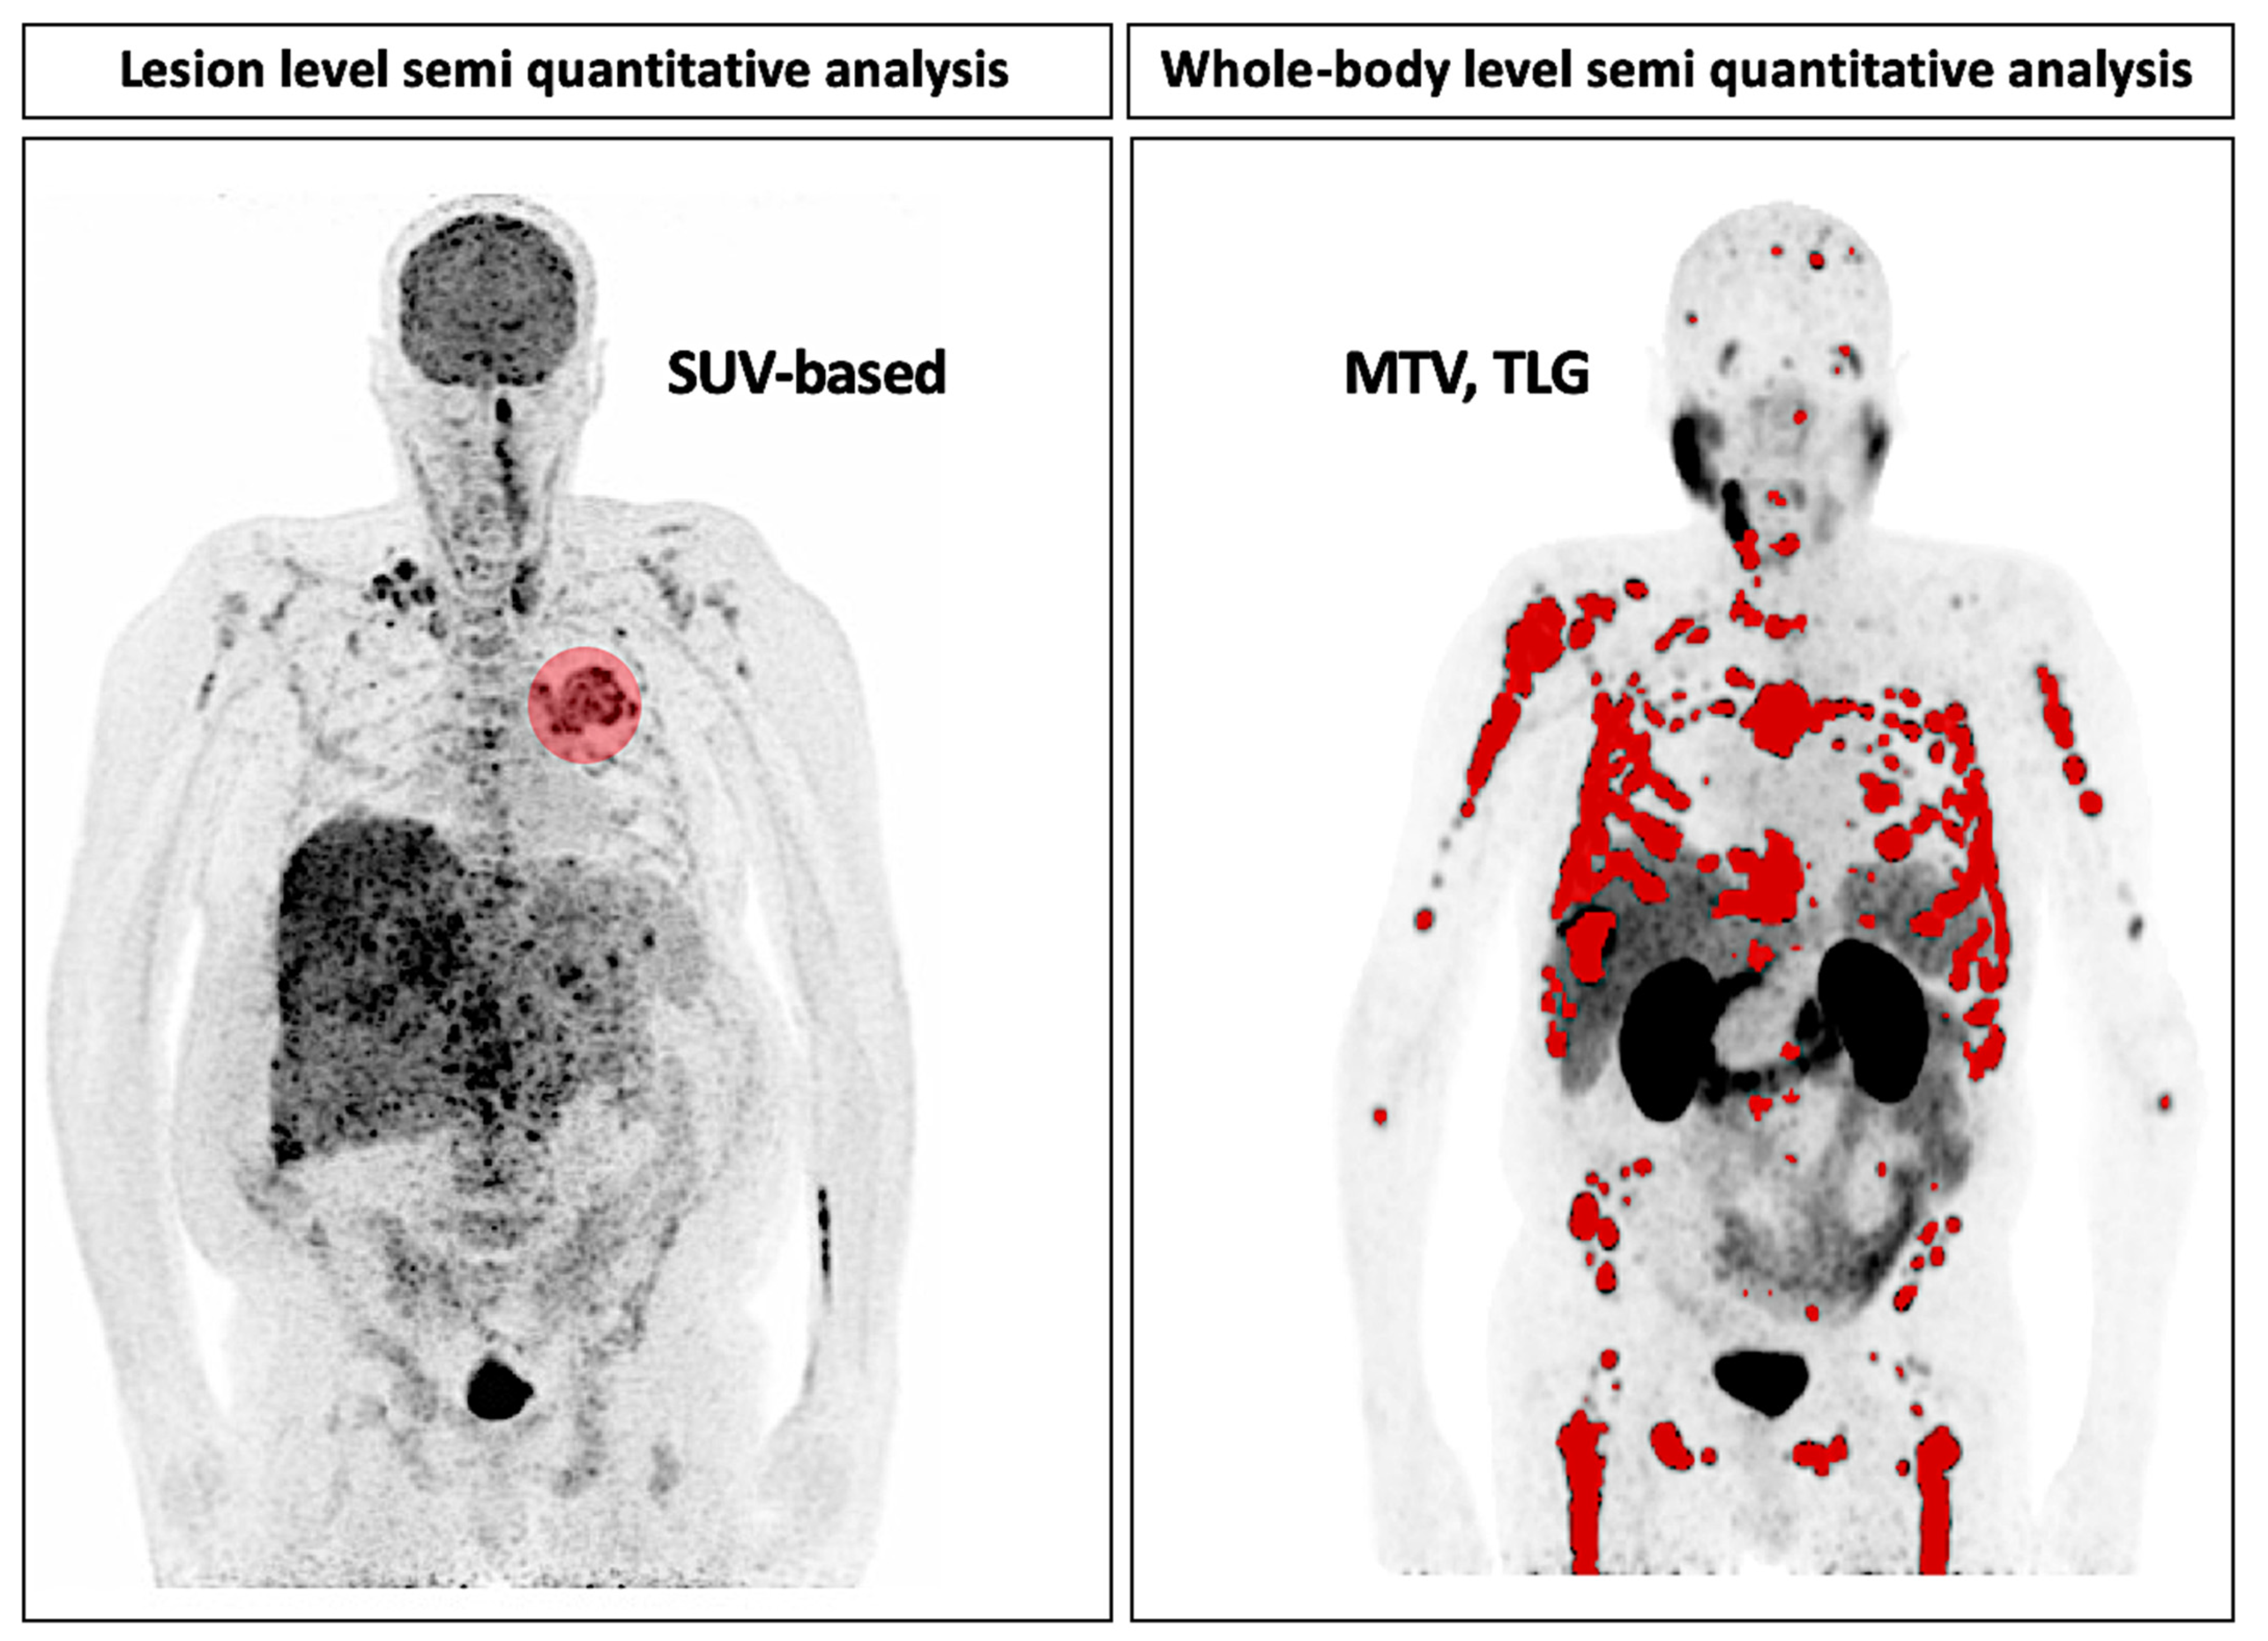
2.2. Semi-Quantitative Analyses
2.3. Kinetic Modeling
3. PET Molecular Imaging: Response Evaluation Criteria in Practice
3.1. Solid Tumors
3.2. Lymphoma
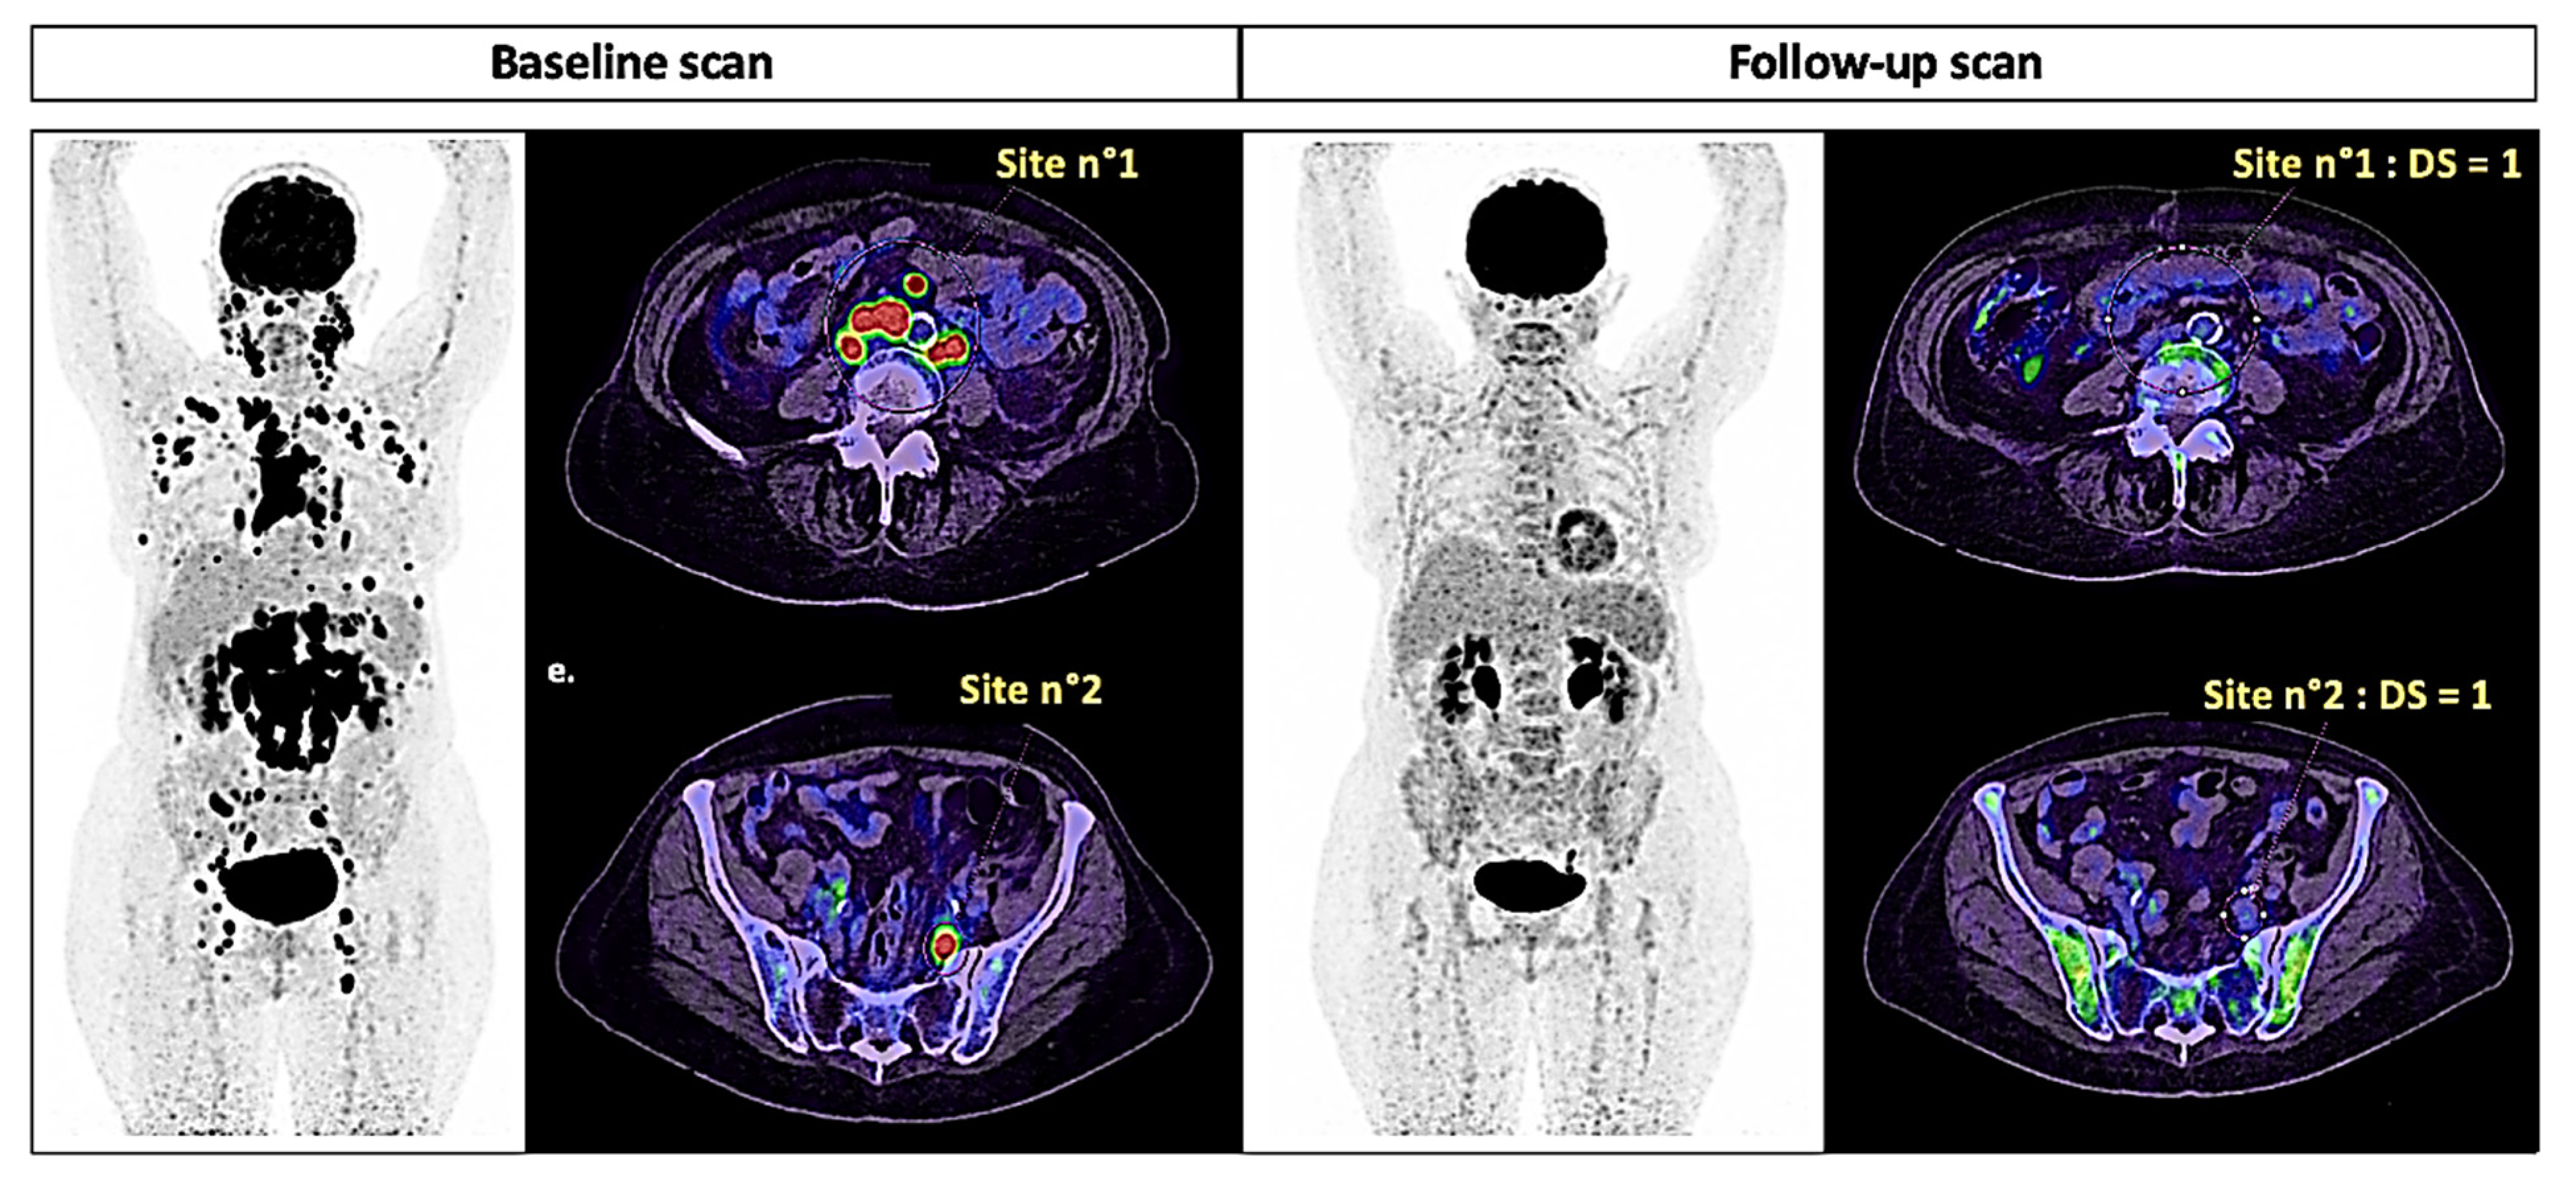
3.3. Multiple Myeloma
4. PET Molecular Imaging: The Promising Clinical Perspective of Radioligand Molecular Imaging and Therapy
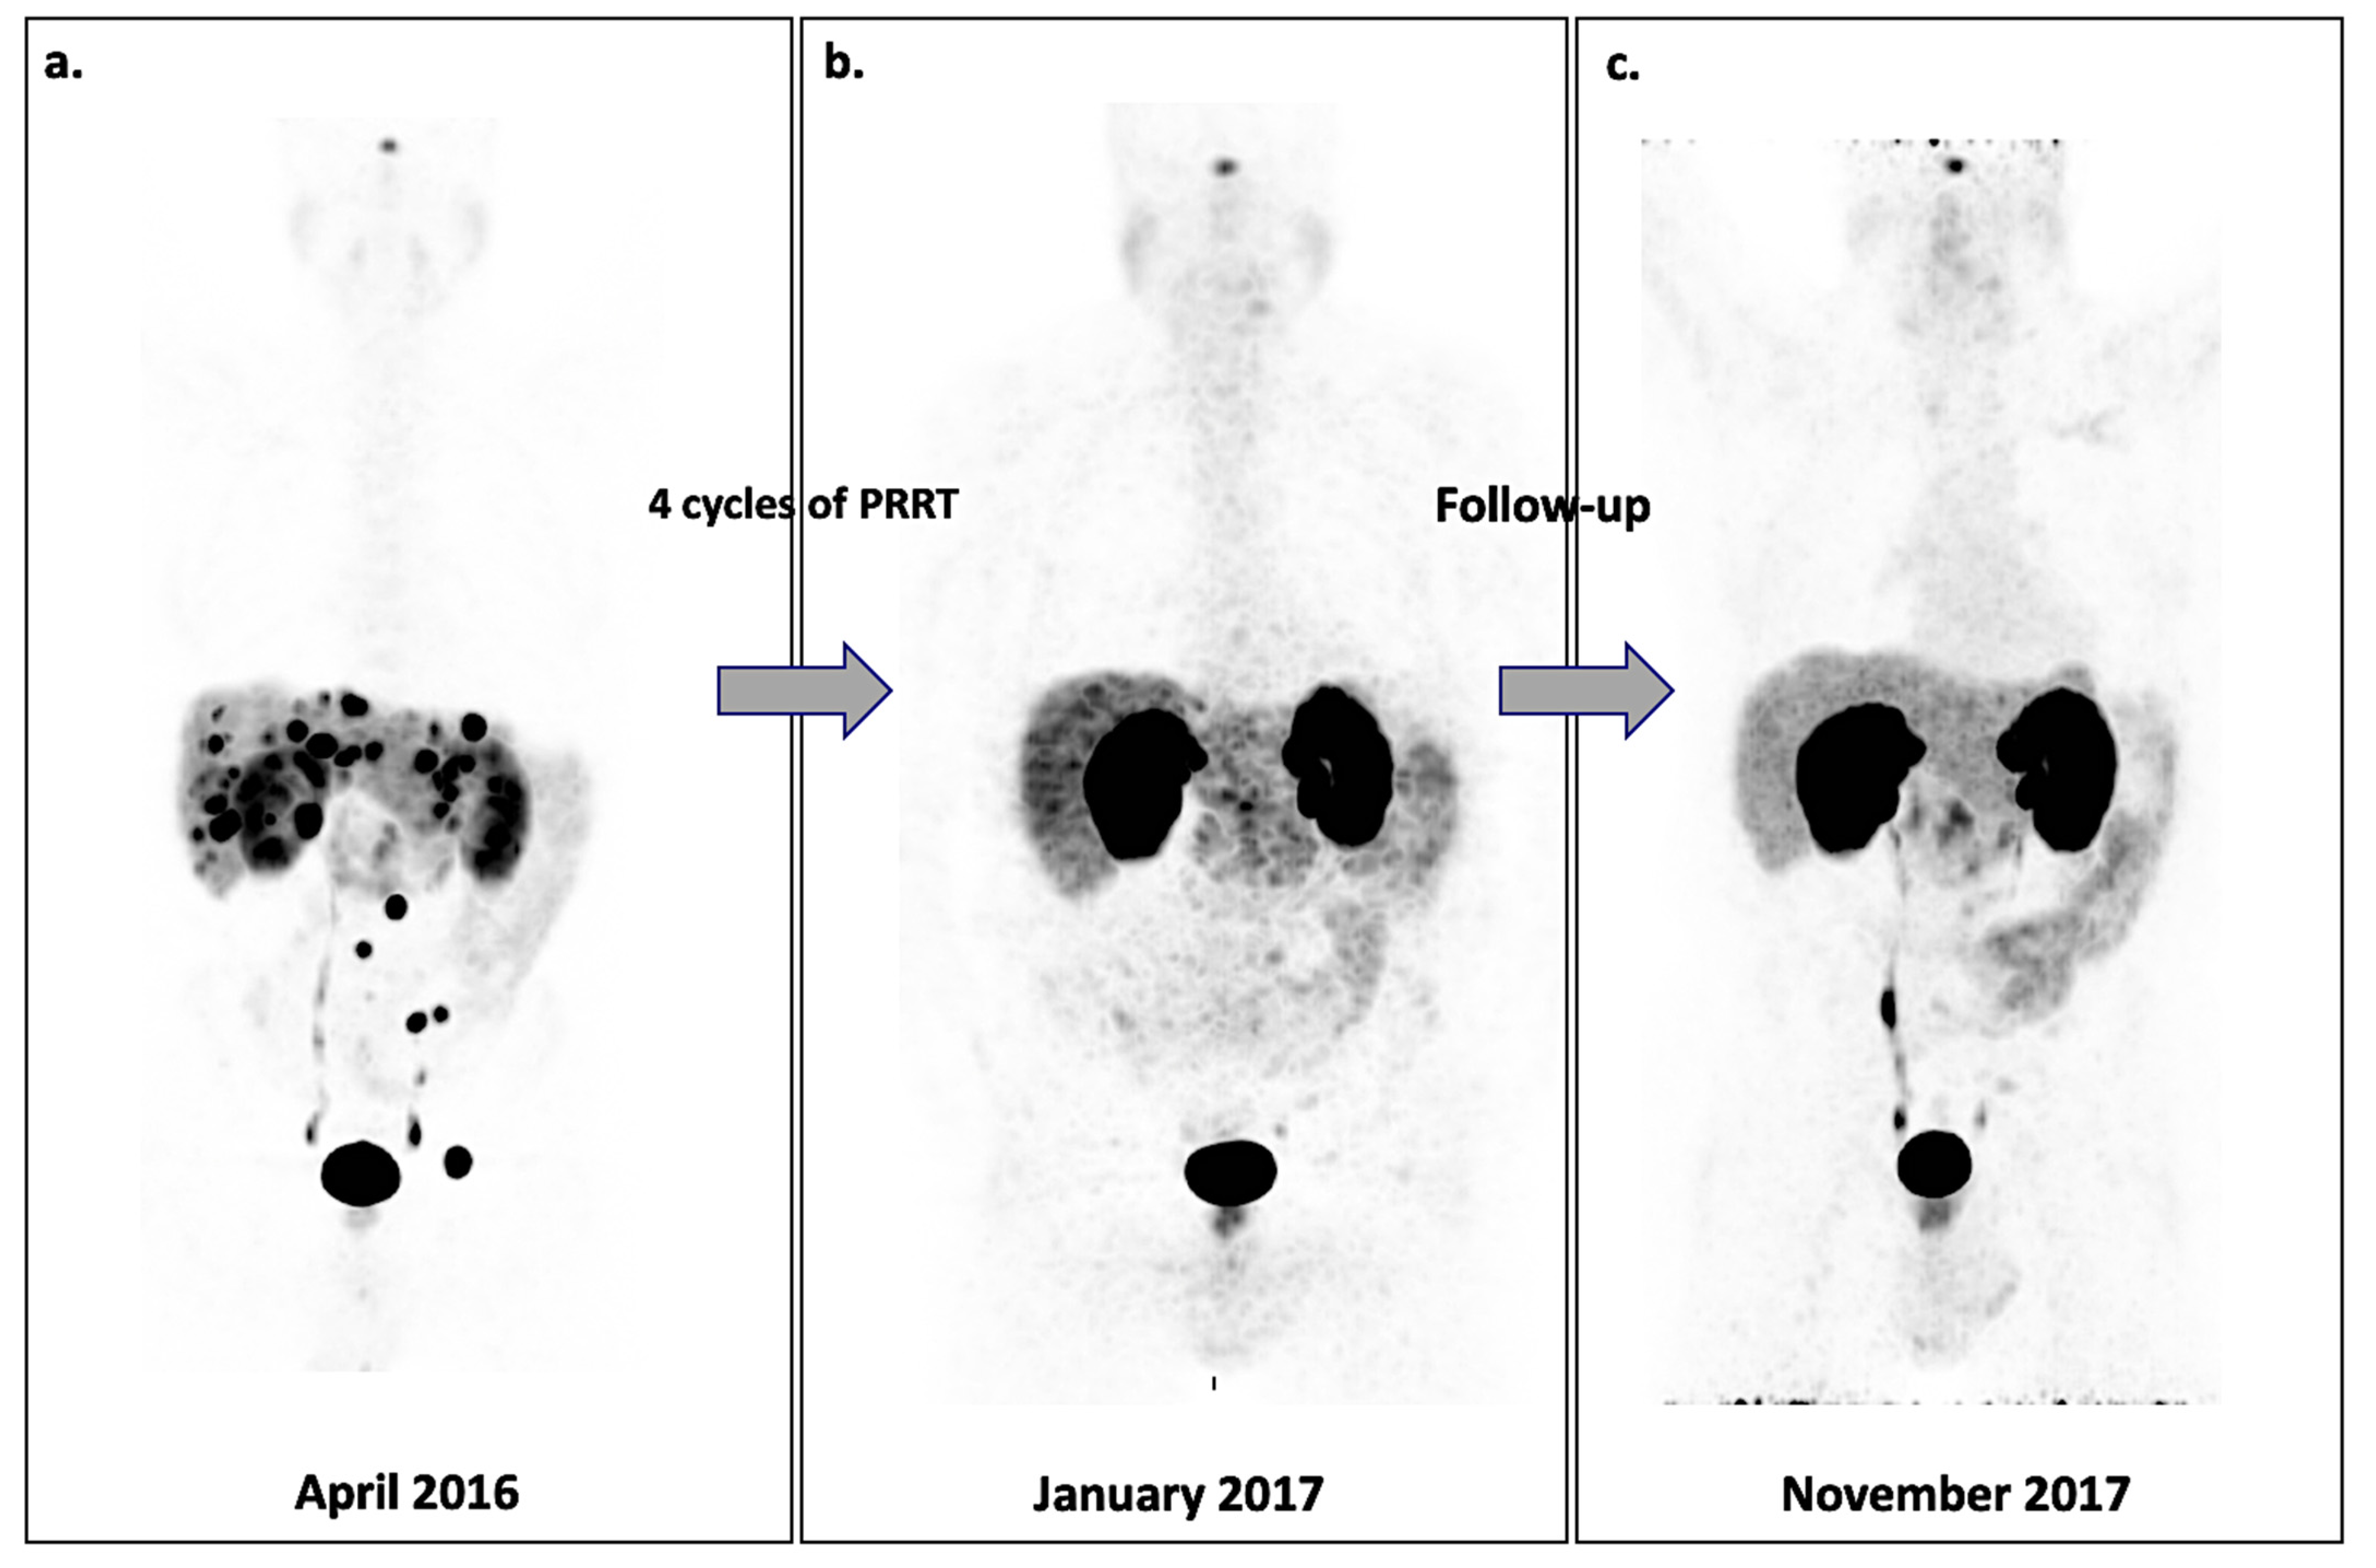
4.1. NETs
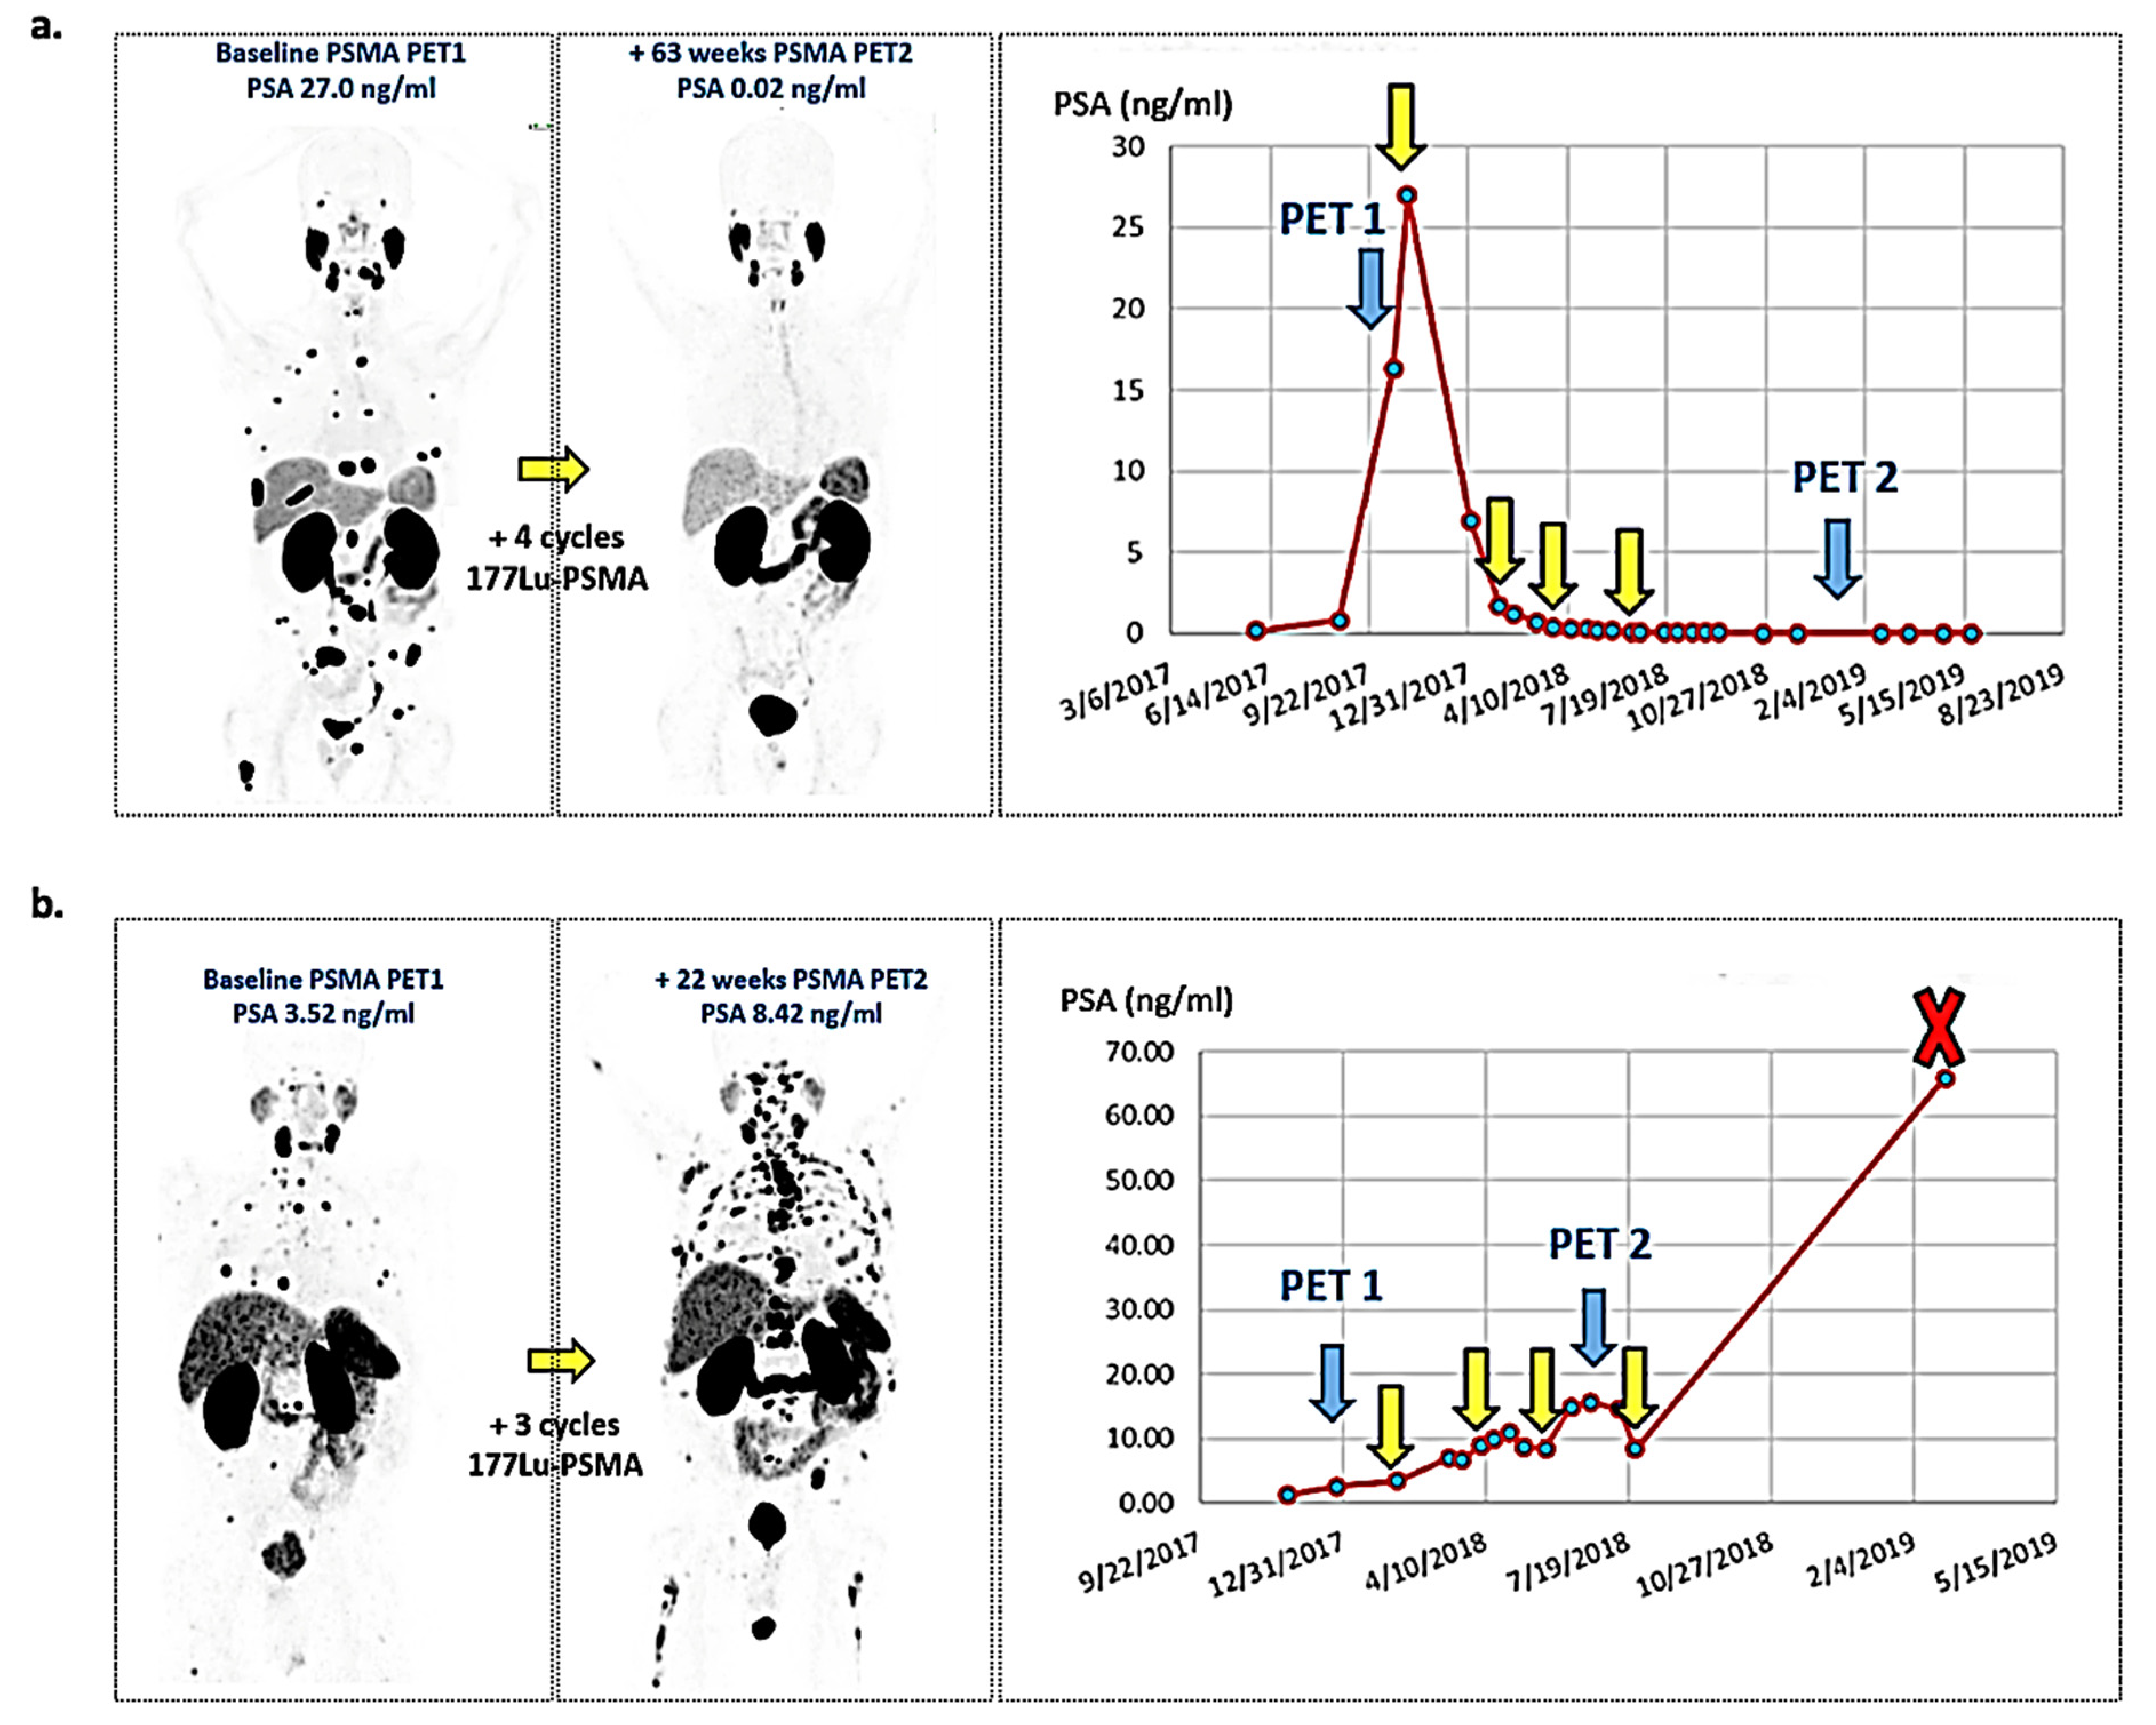
4.2. PCa
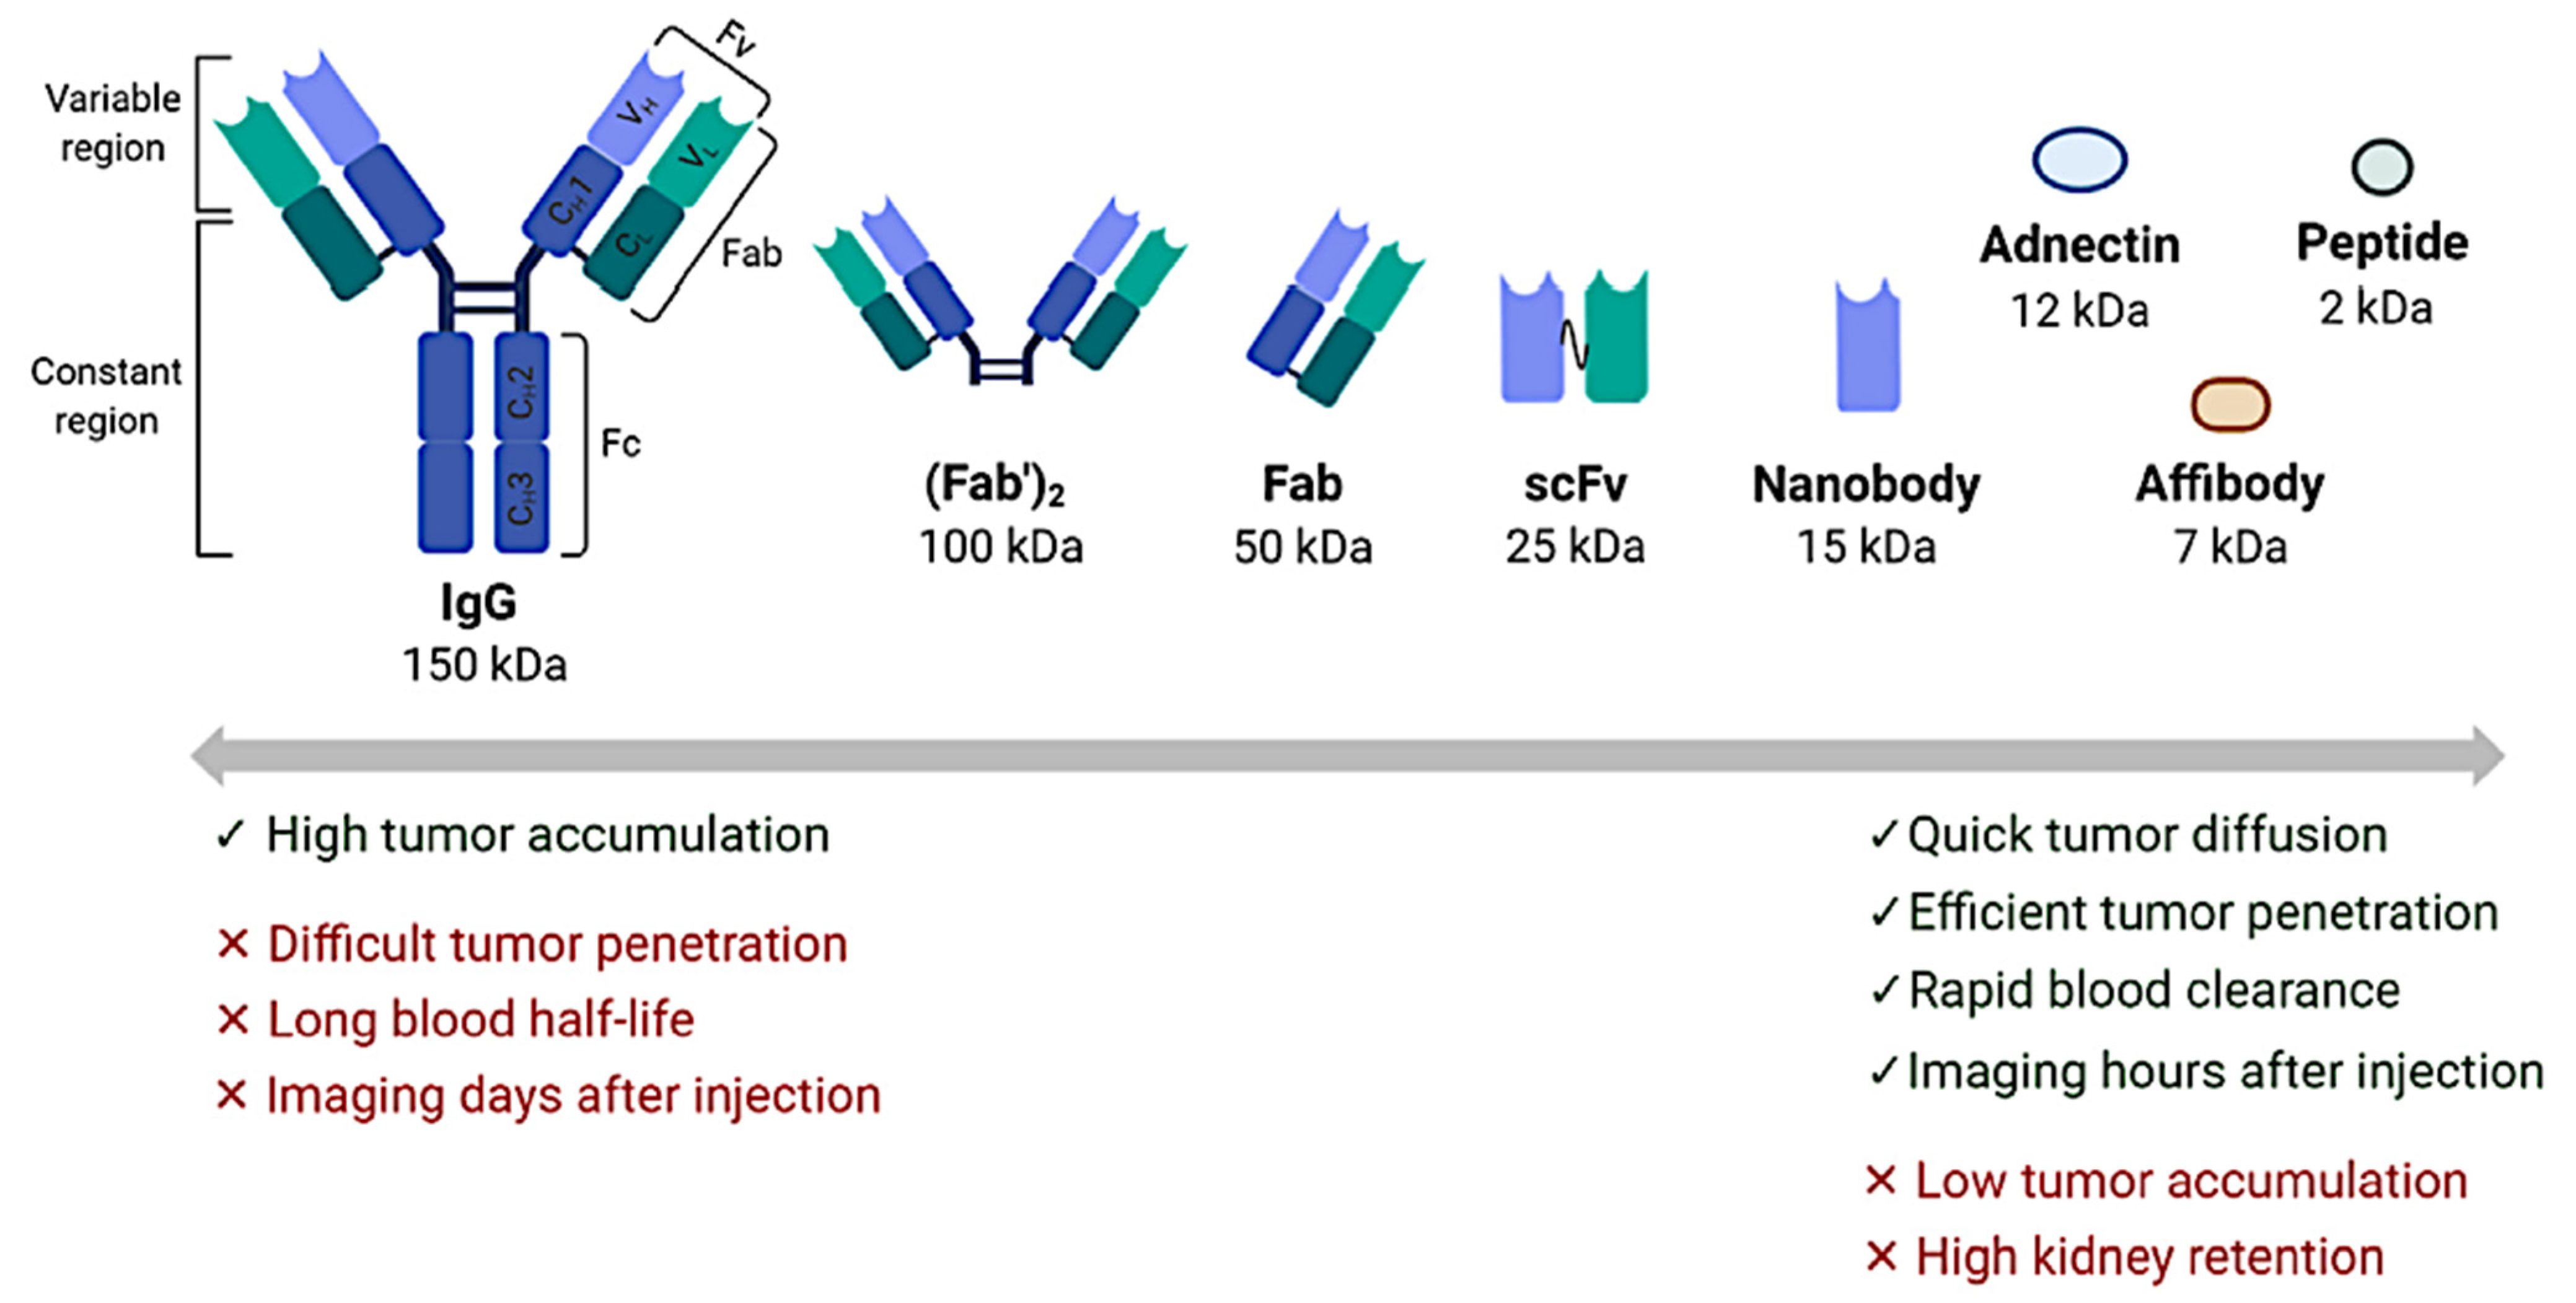
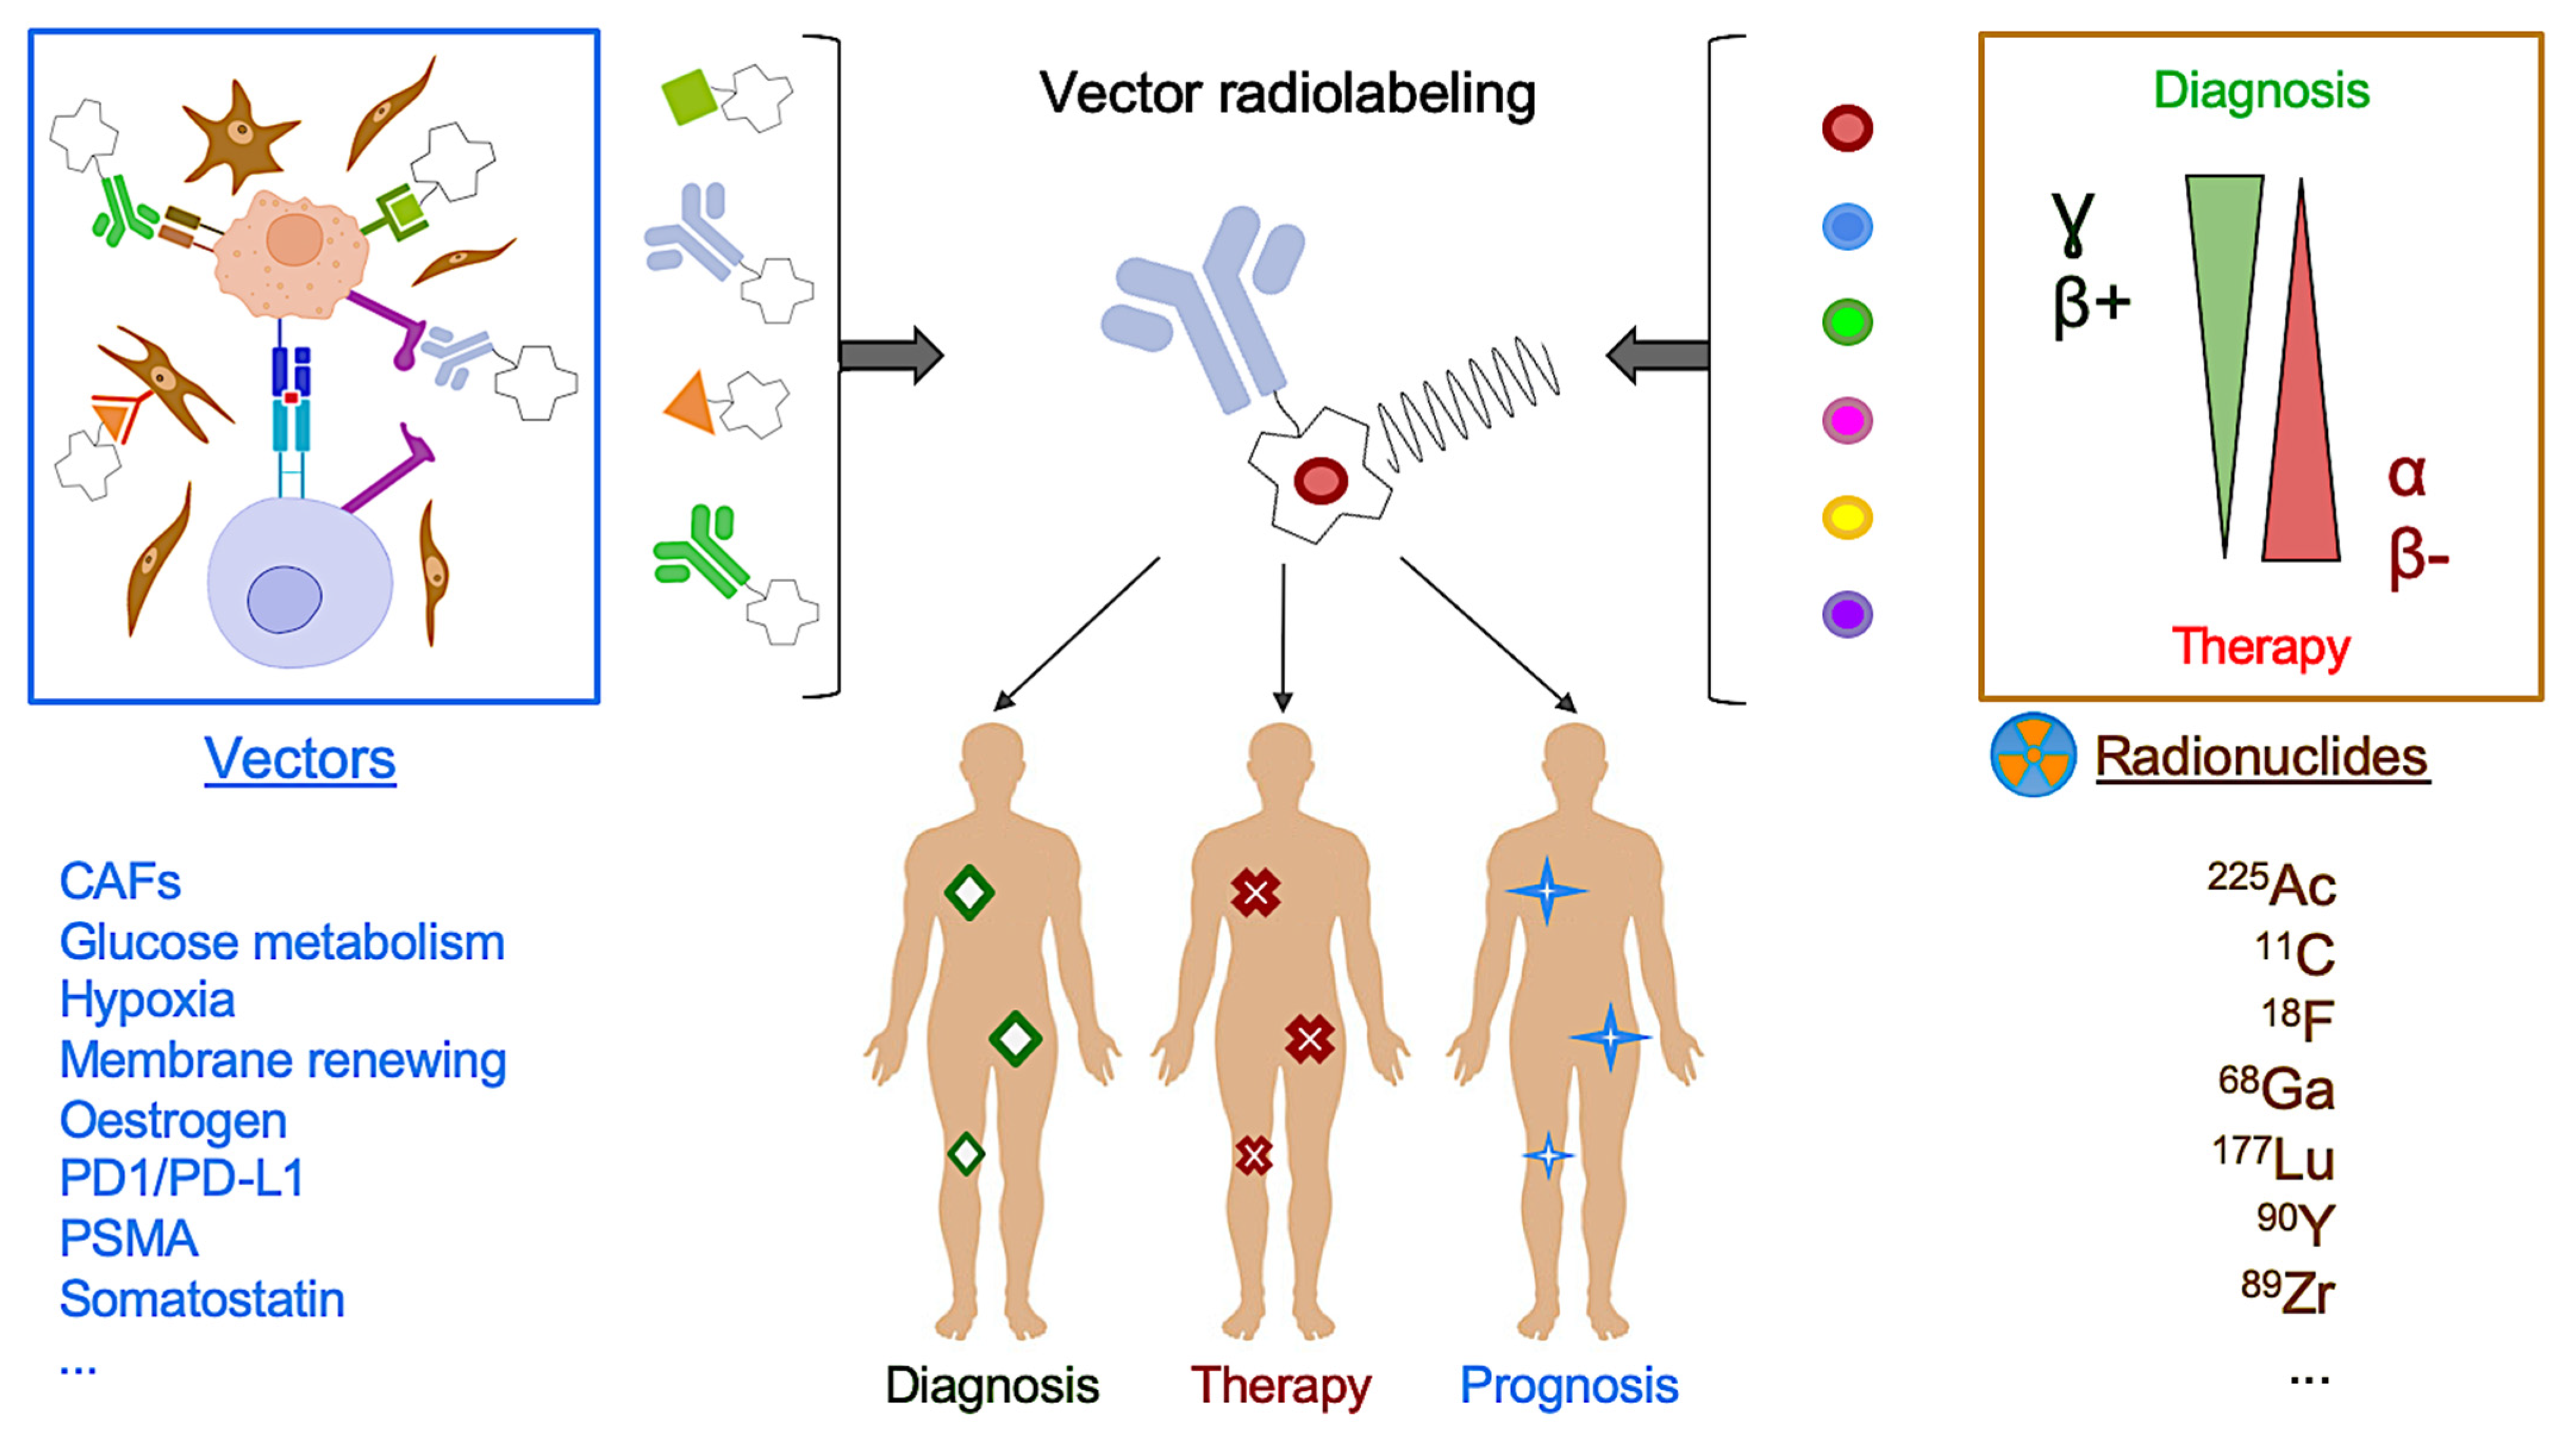
4.3. Other Near-Future Promising Perspectives in Clinical Practice: Immuno-PET and Beyond
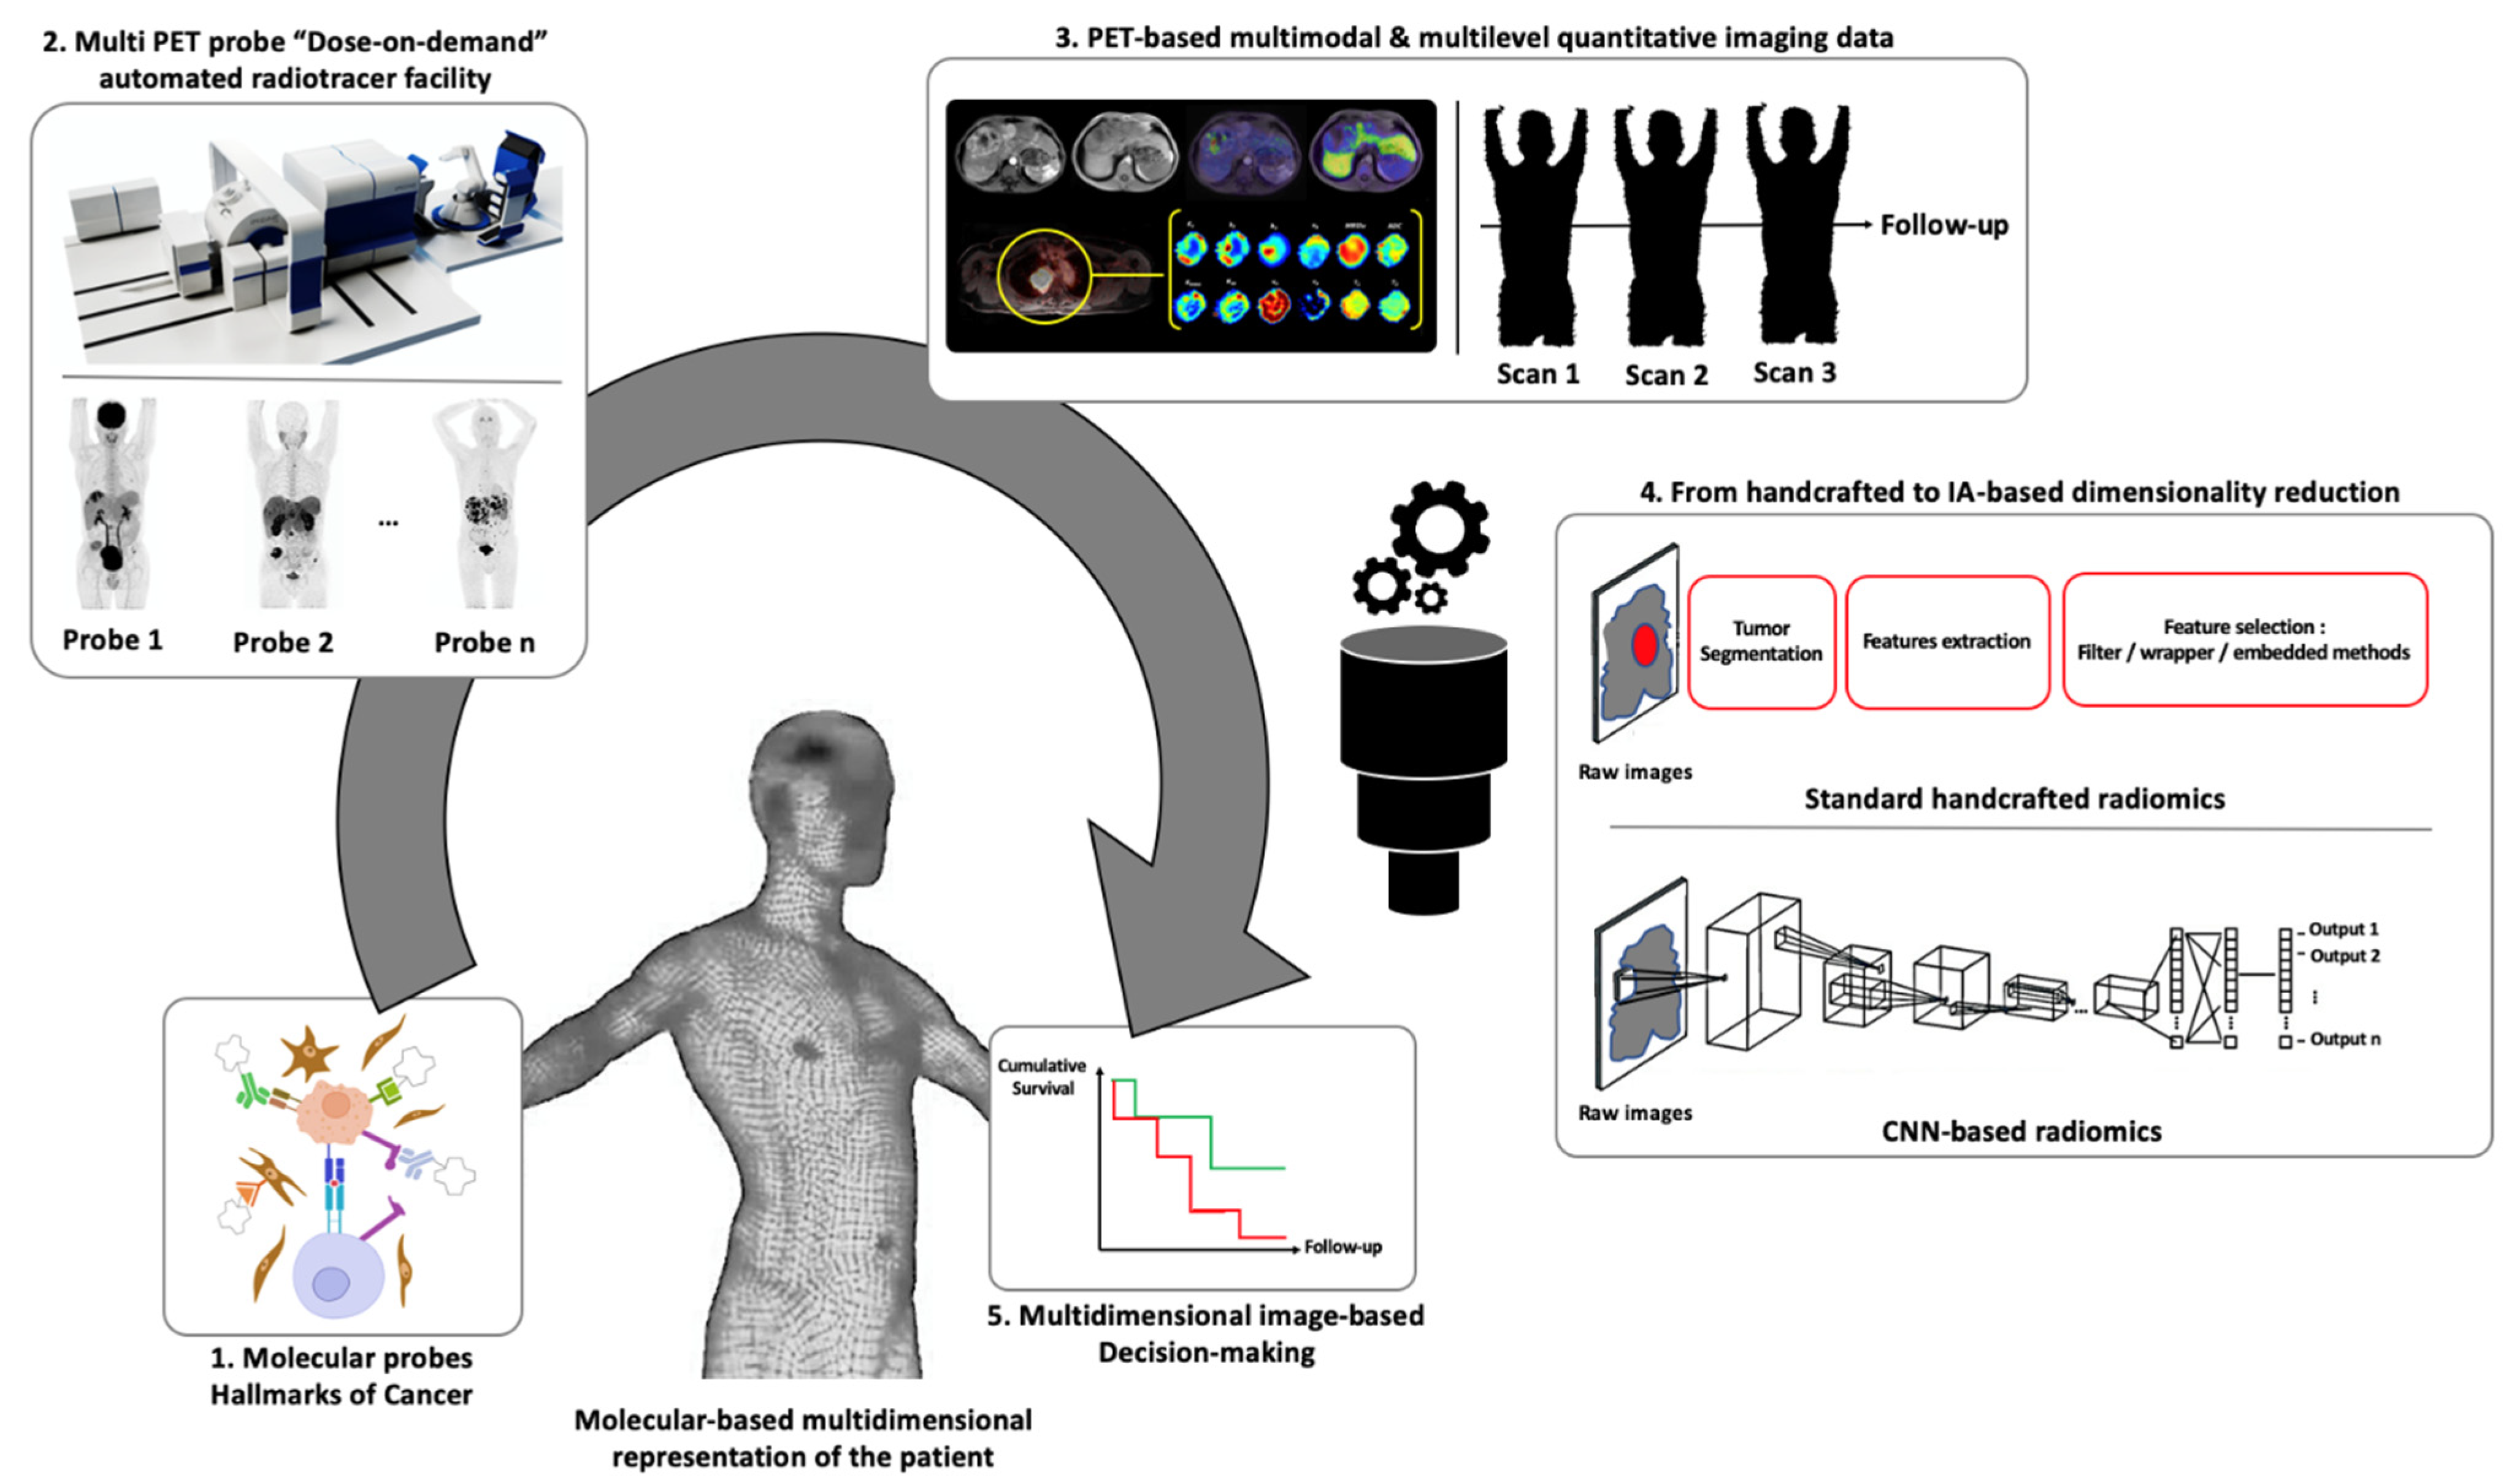
5. PET Molecular Imaging: The Perspectives of Statistical and Computer Sciences for Multidimensional Image-Based Decision Making
6. Conclusions
Author Contributions
Funding
Institutional Review Board Statement
Informed Consent Statement
Data Availability Statement
Acknowledgments
Conflicts of Interest
References
- van Tinteren, H.; Hoekstra, O.S.; Smit, E.F.; van den Bergh, J.H.; Schreurs, A.J.; Stallaert, R.A.; van Velthoven, P.C.; Comans, E.F.; Diepenhorst, F.W.; Verboom, P.; et al. Effectiveness of positron emission tomography in the preoperative assessment of patients with suspected non-small-cell lung cancer: The PLUS multicentre randomised trial. Lancet 2002, 359, 1388–1392. [Google Scholar] [CrossRef]
- Lindsay, M.J.; Siegel, B.A.; Tunis, S.R.; Hillner, B.E.; Shields, A.F.; Carey, B.P.; Coleman, R.E. The National Oncologic PET Registry: Expanded medicare coverage for PET under coverage with evidence development. Am. J. Roentgenol. 2007, 188, 1109–1113. [Google Scholar] [CrossRef] [PubMed]
- Hillner, B.E.; Siegel, B.A.; Liu, D.; Shields, A.F.; Gareen, I.F.; Hanna, L.; Stine, S.H.; Coleman, R.E. Impact of positron emission tomography/computed tomography and positron emission tomography (PET) alone on expected management of patients with cancer: Initial results from the National Oncologic PET Registry. J. Clin. Oncol. 2008, 26, 2155–2161. [Google Scholar] [CrossRef] [PubMed] [Green Version]
- Hricak, H.; Abdel-Wahab, M.; Atun, R.; Lette, M.M.; Paez, D.; Brink, J.A.; Donoso-Bach, L.; Frija, G.; Hierath, M.; Holmberg, O.; et al. Medical imaging and nuclear medicine: A Lancet Oncology Commission. Lancet Oncol. 2021. [Google Scholar] [CrossRef]
- Katsari, K.; Penna, D.; Arena, V.; Polverari, G.; Ianniello, A.; Italiano, D.; Milani, R.; Roncacci, A.; Illing, R.O.; Pelosi, E. Artificial intelligence for reduced dose 18F-FDG PET examinations: A real-world deployment through a standardized framework and business case assessment. EJNMMI Phys. 2021, 8, 25. [Google Scholar] [CrossRef] [PubMed]
- Boellaard, R. Standards for PET image acquisition and quantitative data analysis. J. Nucl. Med. 2009, 50, 11S–20S. [Google Scholar] [CrossRef] [PubMed] [Green Version]
- Aide, N.; Lasnon, C.; Veit-Haibach, P.; Sera, T.; Sattler, B.; Boellaard, R. EANM/EARL harmonization strategies in PET quantification: From daily practice to multicentre oncological studies. Eur. J. Nucl. Med. Mol. Imaging 2017, 44, 17–31. [Google Scholar] [CrossRef]
- Boellaard, R.; Delgado-Bolton, R.; Oyen, W.J.G.; Giammarile, F.; Tatsch, K.; Eschner, W.; Verzijlbergen, F.J.; Barrington, S.F.; Pike, L.C.; Weber, W.A.; et al. FDG PET/CT: EANM procedure guidelines for tumour imaging: Version 2.0. Eur. J. Nucl. Med. Mol. Imaging 2015, 42, 328–354. [Google Scholar] [CrossRef]
- Bar-Sever, Z.; Biassoni, L.; Shulkin, B.; Kong, G.; Hofman, M.S.; Lopci, E.; Manea, I.; Koziorowski, J.; Castellani, R.; Boubaker, A.; et al. Guidelines on nuclear medicine imaging in neuroblastoma. Eur. J. Nucl. Med. Mol. Imaging 2018, 45, 2009–2024. [Google Scholar] [CrossRef]
- Law, I.; Albert, N.L.; Arbizu, J.; Boellaard, R.; Drzezga, A.; Galldiks, N.; la Fougère, C.; Langen, K.J.; Lopci, E.; Lowe, V.; et al. Joint EANM/EANO/RANO practice guidelines/SNMMI procedure standards for imaging of gliomas using PET with radiolabelled amino acids and [18F]FDG: Version 1.0. Eur. J. Nucl. Med. Mol. Imaging 2019, 46, 540–557. [Google Scholar] [CrossRef] [Green Version]
- Shankar, L.K.; Hoffman, J.M.; Bacharach, S.; Graham, M.M.; Karp, J.; Lammertsma, A.A.; Larson, S.; Mankoff, D.A.; Siegel, B.A.; Abbeele, A.V.D.; et al. Consensus recommendations for the use of 18F-FDG PET as an indicator of therapeutic response in patients in National Cancer Institute Trials. J. Nucl. Med. 2006, 47, 1059–1066. [Google Scholar] [PubMed]
- Barrington, S.F.; Mikhaeel, N.G.; Kostakoglu, L.; Meignan, M.; Hutchings, M.; Müeller, S.P.; Schwartz, L.H.; Zucca, E.; Fisher, R.I.; Trotman, J.; et al. Role of Imaging in the Staging and Response Assessment of Lymphoma: Consensus of the International Conference on Malignant Lymphomas Imaging Working Group. J. Clin. Oncol. 2014, 32, 3048–3058. [Google Scholar] [CrossRef]
- Wirth, A.; Foo, M.; Seymour, J.F.; MacManus, M.P.; Hicks, R.J. Impact of [18F] Fluorodeoxyglucose Positron Emission Tomography on Staging and Management of Early-Stage Follicular Non-Hodgkin Lymphoma. Int. J. Radiat. Oncol. Biol. Phys. 2008, 71, 213–219. [Google Scholar] [CrossRef] [PubMed]
- Reinhardt, M.J.; Joe, A.Y.; Jaeger, U.; Hubetr, A.; Matthies, A.; Bucerius, J.; Roedel, R.; Strunk, H.; Bieber, T.; Biersack, H.-J.; et al. Diagnostic Performance of Whole Body Dual Modality 18 F-FDG PET/CT Imaging for N- and M-Staging of Malignant Melanoma: Experience With 250 Consecutive Patients. J. Clin. Oncol. 2006, 24, 1178–1187. [Google Scholar] [CrossRef]
- Gould, M.K.; Maclean, C.C.; Kuschner, W.G.; Rydzak, C.E.; Owens, D.K. Accuracy of Positron Emission Tomography for Diagnosis of Pulmonary Nodules and Mass Lesions: A Meta-analysis. JAMA 2001, 285, 914. [Google Scholar] [CrossRef]
- Kolodziejczyk, M.; Kepka, L.; Dziuk, M.; Zawadzka, A.; Szalus, N.; Gizewska, A.; Bujko, K. Impact of [18F]Fluorodeoxyglucose PET-CT Staging on Treatment Planning in Radiotherapy Incorporating Elective Nodal Irradiation for Non-Small-Cell Lung Cancer: A Prospective Study. Int. J. Radiat. Oncol. Biol. Phys. 2011, 80, 1008–1014. [Google Scholar] [CrossRef]
- King, K.S.; Chen, C.C.; Alexopoulos, D.K.; Whatlety, M.A.; Reynolds, J.C.; Patronas, N.; Ling, A.; Adams, K.T.; Xekouki, P.; Lando, H.; et al. Functional Imaging of SDHx -Related Head and Neck Paragangliomas: Comparison of 18F-Fluorodihydroxyphenylalanine, 18F-Fluorodopamine, 18F-Fluoro-2-Deoxy-d-Glucose PET, 123I-Metaiodobenzylguanidine Scintigraphy, and 111In-Pentetreotide Scintigraphy. J. Clin. Endocrinol. Metab. 2011, 96, 2779–2785. [Google Scholar] [CrossRef] [PubMed] [Green Version]
- Treglia, G.; Cocciolillo, F.; de Waure, C.; Di Nardo, F.; Gualano, M.R.; Castaldi, P.; Rufini, V.; Giordano, A. Diagnostic performance of 18F-dihydroxyphenylalanine positron emission tomography in patients with paraganglioma: A meta-analysis. Eur. J. Nucl. Med. Mol. Imaging 2012, 39, 1144–1153. [Google Scholar] [CrossRef]
- Taieb, D.; Neumann, H.; Rubello, D.; Al-Nahhas, A.; Guillet, B.; Hindie, E. Modern Nuclear Imaging for Paragangliomas: Beyond SPECT. J. Nucl. Med. 2012, 53, 264–274. [Google Scholar] [CrossRef] [Green Version]
- Zamagni, E.; Nanni, C.; Dozza, L.; Carlier, T.; Tacchetti, P.; Versari, A.; Chauvie, S.; Gallamini, A.; Attal, M.; Gamberi, B.; et al. Standardization of 18F-FDG PET/CT According to Deauville Criteria for MRD Evaluation in Newly Diagnosed Transplant Eligible Multiple Myeloma Patients: Joined Analysis of Two Prospective Randomized Phase III Trials. Blood 2018, 132, 257. [Google Scholar] [CrossRef] [Green Version]
- Kubota, K.; Matsuzawa, T.; Ito, M.; Ito, K.; Fujiwara, T.; Albe, Y.; Yoshioka, S.; Fukuda, H.; Hatazawa, J.; Iwata, R. Lung tumor imaging by positron emission tomography using C-11 L-methionine. J. Nucl. Med. 1985, 26, 37–42. [Google Scholar] [PubMed]
- Thie, J.A. Understanding the standardized uptake value, its methods, and implications for usage. J. Nucl. Med. 2004, 45, 1431–1434. [Google Scholar]
- Boellaard, R.; Krak, N.C.; Hoekstra, O.S.; Lammertsma, A.A. Effects of noise, image resolution, and ROI definition on the accuracy of standard uptake values: A simulation study. J. Nucl. Med. 2004, 45, 1519–1527. [Google Scholar]
- Foster, B.; Bagci, U.; Mansoor, A.; Xu, Z.; Mollura, D.J. A review on segmentation of positron emission tomography images. Comput. Biol. Med. 2014, 50, 76–96. [Google Scholar] [CrossRef] [Green Version]
- Ott, K.; Weber, W.A.; Lordick, F.; Becker, K.; Busch, R.; Herrmann, K.; Wieder, H.; Fink, U.; Schwaiger, M.; Siewert, J.-R. Metabolic imaging predicts response, survival, and recurrence in adenocarcinomas of the esophagogastric junction. J. Clin. Oncol. 2006, 24, 4692–4698. [Google Scholar] [CrossRef]
- Cascini, G.L.; Avallone, A.; Delrio, P.; Guida, C.; Tatangetlo, F.; Marone, P.; Aloj, L.; De Martinis, F.; Comella, P.; Parisi, V.; et al. 18F-FDG PET is an early predictor of pathologic tumor response to preoperative radiochemotherapy in locally advanced rectal cancer. J. Nucl. Med. 2006, 47, 1241–1248. [Google Scholar]
- Nols, N.; Mounier, N.; Bouazza, S.; Lhommel, R.; Costantini, S.; Borght, T.V.; Vekemans, M.-C.; Sonet, A.; Bosly, A.; Michaux, L.; et al. Quantitative and qualitative analysis of metabolic response at interim positron emission tomography scan combined with International Prognostic Index is highly predictive of outcome in diffuse large B-cell lymphoma. Leuk. Lymphoma 2014, 55, 773–780. [Google Scholar] [CrossRef]
- Lin, C.; Itti, E.; Haioun, C.; Petegnief, Y.; Luciani, A.; Dupuis, J.; Paone, G.; Talbot, J.-N.; Rahmouni, A.; Meignan, M. Early 18F-FDG PET for Prediction of Prognosis in Patients with Diffuse Large B-Cell Lymphoma: SUV-Based Assessment Versus Visual Analysis. J. Nucl. Med. 2007, 48, 1626–1632. [Google Scholar] [CrossRef] [PubMed] [Green Version]
- Fuertes, S.; Setoain, X.; Lopez-Guillermo, A.; Carrasco, J.-L.; Rodriguetz, S.; Roviral, J.; Pons, F. Interim FDG PET/CT as a prognostic factor in diffuse large B-cell lymphoma. Eur. J. Nucl. Med. Mol. Imaging 2013, 40, 496–504. [Google Scholar] [CrossRef]
- Casasnovas, R.-O.; Meignan, M.; Berriolo-Riedinger, A.; Bardet, S.; Julian, A.; Thieblemont, C.; Vera, P.; Bologna, S.; Brière, J.; Jais, J.-P.; et al. SUVmax reduction improves early prognosis value of interim positron emission tomography scans in diffuse large B-cell lymphoma. Blood 2011, 118, 37–43. [Google Scholar] [CrossRef] [PubMed] [Green Version]
- Stroobants, S.; Goeminne, J.; Seegers, M.; Dimitrijevic, S.; Dupont, P.; Nuyts, J.; Martens, M.; Borne, B.V.D.; Cole, P.; Sciot, R.; et al. 18FDG-Positron emission tomography for the early prediction of response in advanced soft tissue sarcoma treated with imatinib mesylate (Glivec®). Eur. J. Cancer 2003, 39, 2012–2020. [Google Scholar] [CrossRef]
- Prior, J.O.; Montemurro, M.; Orcurto, M.-V.; Michielin, O.; Luthi, F.; Benhattar, J.; Guillou, L.; Elsig, V.; Stupp, R.; Delaloye, A.B.; et al. Early Prediction of Response to Sunitinib After Imatinib Failure by 18F-Fluorodeoxyglucose Positron Emission Tomography in Patients With Gastrointestinal Stromal Tumor. J. Clin. Oncol. 2009, 27, 439–445. [Google Scholar] [CrossRef] [PubMed]
- Usmani, S.Z.; Mitchell, A.; Waheed, S.; Crowley, J.; Hoering, A.; Petty, N.; Brown, T.; Bartel, T.; Anaissie, E.; Van Rhee, F.; et al. Prognostic implications of serial 18-fluoro-deoxyglucose emission tomography in multiple myeloma treated with total therapy 3. Blood 2013, 121, 1819–1823. [Google Scholar] [CrossRef] [PubMed] [Green Version]
- McDonald, J.E.; Kessler, M.M.; Gardner, M.W.; Buros, A.F.; Ntambi, J.A.; Waheed, S.; Van Rhee, F.; Zangari, M.; Heuck, C.J.; Petty, N.; et al. Assessment of Total Lesion Glycolysis by 18F FDG PET/CT Significantly Improves Prognostic Value of GEP and ISS in Myeloma. Clin. Cancer Res. 2017, 23, 1981–1987. [Google Scholar] [CrossRef] [Green Version]
- Patlak, C.S.; Blasberg, R.G. Graphical Evaluation of Blood-to-Brain Transfer Constants from Multiple-Time Uptake Data. Generalizations. J. Cereb. Blood Flow. Metab. 1985, 5, 584–590. [Google Scholar] [CrossRef] [Green Version]
- Morris, E.D.; Endres, C.J.; Schmidt, K.C.; Christian, B.T.; Muzic, R.F.; Fisher, R.E. Kinetic Modeling in Positron Emission Tomography. In Emission Tomography; Elsevier: Amsterdam, The Netherlands, 2004; pp. 499–540. [Google Scholar] [CrossRef]
- Dimitrakopoulou-Strauss, A.; Pan, L.; Sachpekidis, C. Kinetic modeling and parametric imaging with dynamic PET for oncological applications: General considerations, current clinical applications, and future perspectives. Eur. J. Nucl. Med. Mol. Imaging 2021, 48, 21–39. [Google Scholar] [CrossRef]
- Sokoloff, L.; Reivich, M.; Kennedy, C.; Rosiers, M.H.D.; Patlak, C.S.; Pettigrew, K.D.; Salkurada, O.; Shinohara, M. The [14C]Deoxyglucose Method for the Measurement of Local Cerebral Glucose Utilization: Theory, Procedure, and Normal Values in the Conscious and Anesthetized Albino rat. J. Neurochem. 1977, 28, 897–916. [Google Scholar] [CrossRef]
- Badawi, R.D.; Shi, H.; Hu, P.; Chen, S.; Xu, T.; Price, P.M.; Ding, Y.; Spencer, B.A.; Nardo, L.; Liu, W.; et al. First Human Imaging Studies with the EXPLORER Total-Body PET Scanner. J. Nucl. Med. 2019, 60, 299–303. [Google Scholar] [CrossRef]
- Karp, J.S.; Viswanath, V.; Geagan, M.J.; Muehllehner, G.; Pantel, A.R.; Parma, M.J.; Perkins, A.E.; Schmall, J.P.; Werner, M.E.; Daube-Witherspoon, M.E. PennPET Explorer: Design and Preliminary Performance of a Whole-Body Imager. J. Nucl. Med. 2020, 61, 136–143. [Google Scholar] [CrossRef]
- Zhang, X.; Xie, Z.; Berg, E.; Judenhofer, M.S.; Liu, W.; Xu, T.; Ding, Y.; Lv, Y.; Dong, Y.; Deng, Z.; et al. Total-Body Dynamic Reconstruction and Parametric Imaging on the uEXPLORER. J. Nucl. Med. 2020, 61, 285–291. [Google Scholar] [CrossRef] [Green Version]
- Mullani, N.A.; Herbst, R.S.; O’Neil, R.G.; Gould, K.L.; Barron, B.J.; Abbruzzese, J.L. Tumor Blood Flow Measured by PET Dynamic Imaging of First-Pass 18F-FDG Uptake: A Comparison with 15O-Labeled Water-Measured Blood Flow. J. Nucl. Med. 2008, 49, 517–523. [Google Scholar] [CrossRef] [Green Version]
- Cochet, A.; Pigeonnat, S.; Khoury, B.; Vrigneaud, J.-M.; Touzery, C.; Berriolo-Riedinger, A.; Dygai-Cochet, I.; Toubeau, M.; Humbert, O.; Coudert, B.; et al. Evaluation of Breast Tumor Blood Flow with Dynamic First-Pass 18F-FDG PET/CT: Comparison with Angiogenesis Markers and Prognostic Factors. J. Nucl. Med. 2012, 53, 512–520. [Google Scholar] [CrossRef] [Green Version]
- Meikle, S.R.; Sossi, V.; Roncali, E.; Cherry, S.R.; Banati, R.; Mankoff, D.A.; Jones, T.; James, M.L.; Sutcliffe, J.; Ouyang, J.; et al. Quantitative PET in the 2020s: A Roadmap. Phys. Med. Biol. 2020. [Google Scholar] [CrossRef]
- Eisenhauer, E.A.; Therasse, P.; Bogaerts, J.; Schwartz, L.H.; Sargent, D.; Ford, R.; Dancey, J.; Arbuck, S.; Gwyther, S.; Mooney, M. New response evaluation criteria in solid tumours: Revised RECIST guideline (version 1.1). Eur. J. Cancer 2009, 45, 228–247. [Google Scholar] [CrossRef] [PubMed]
- Young, H.; Baum, R.; Cremerius, U.; Herholz, K.; Hoekstra, O.; Lammertsma, A.; Pruim, J.; Price, P. Measurement of clinical and subclinical tumour response using [18F]-fluorodeoxyglucose and positron emission tomography: Review and 1999 EORTC recommendations. Eur. J. Cancer 1999, 35, 1773–1782. [Google Scholar] [CrossRef]
- Tylski, P.; Stute, S.; Grotus, N.; Doyeux, K.; Hapdey, S.; Gardin, I.; Vanderlinden, B.; Buvat, I. Comparative assessment of methods for estimating tumor volume and standardized uptake value in (18)F-FDG PET. J. Nucl. Med. 2010, 51, 268–276. [Google Scholar] [CrossRef] [Green Version]
- Wahl, R.L.; Jacene, H.; Kasamon, Y.; Lodge, M.A. From RECIST to PERCIST: Evolving Considerations for PET Response Criteria in Solid Tumors. J. Nucl. Med. 2009, 50, 122S–150S. [Google Scholar] [CrossRef] [Green Version]
- Riedl, C.C.; Pinker, K.; Ulaner, G.A.; Ong, L.T.; Baltzer, P.; Jochelson, M.S.; McArthur, H.L.; Gönen, M.; Dickler, M.; Weber, W.A. Comparison of FDG-PET/CT and contrast-enhanced CT for monitoring therapy response in patients with metastatic breast cancer. Eur. J. Nucl. Med. Mol. Imaging 2017, 44, 1428–1437. [Google Scholar] [CrossRef]
- Yanagawa, M.; Tatsumi, M.; Miyata, H.; Morii, E.; Tomiyama, N.; Waltabe, T.; Isohashi, K.; Kato, H.; Shimosegawa, E.; Yamasaki, M.; et al. Evaluation of Response to Neoadjuvant Chemotherapy for Esophageal Cancer: PET Response Criteria in Solid Tumors Versus Response Evaluation Criteria in Solid Tumors. J. Nucl. Med. 2012, 53, 872–880. [Google Scholar] [CrossRef] [Green Version]
- Koshkin, V.S.; Bolejack, V.; Schwartz, L.H.; Wahl, R.L.; Chugh, R.; Reinke, D.K.; Zhao, B.; O, J.H.; Patel, S.R.; Schuetze, S.M.; et al. Assessment of Imaging Modalities and Response Metrics in Ewing Sarcoma: Correlation with Survival. J. Clin. Oncol. 2016, 34, 3680–3685. [Google Scholar] [CrossRef] [PubMed]
- Shang, J.; Ling, X.; Zhang, L.; Tang, Y.; Xiao, Z.; Chetng, Y.; Guo, B.; Gong, J.; Huang, L.; Xu, H. Comparison of RECIST, EORTC criteria and PERCIST for evaluation of early response to chemotherapy in patients with non-small-cell lung cancer. Eur. J. Nucl. Med. Mol. Imaging 2016, 43, 1945–1953. [Google Scholar] [CrossRef]
- Ding, Q.; Cheng, X.; Yang, L.; Zhang, Q.; Chen, J.; Li, T.; Shi, H. PET/CT evaluation of response to chemotherapy in non-small cell lung cancer: PET response criteria in solid tumors (PERCIST) versus response evaluation criteria in solid tumors (RECIST). J. Thorac. Dis. 2014, 6, 677–683. [Google Scholar] [CrossRef]
- Champiat, S.; Dercle, L.; Ammari, S.; Massard, C.; Hollebecque, A.; Postel-Vinay, S.; Chaput, N.; Eggermont, A.M.; Marabelle, A.; Soria, J.-C. Hyperprogressive Disease Is a New Pattern of Progression in Cancer Patients Treated by Anti-PD-1/PD-L1. Clin. Cancer Res. 2017, 23, 1920–1928. [Google Scholar] [CrossRef] [Green Version]
- Goldfarb, L.; Duchemann, B.; Chouahnia, K.; Zelek, L.; Soussan, M. Monitoring anti-PD-1-based immunotherapy in non-small cell lung cancer with FDG PET: Introduction of iPERCIST. EJNMMI Res. 2019, 9, 8. [Google Scholar] [CrossRef] [PubMed]
- Cho, S.Y.; Lipson, E.J.; Im, H.-J.; Rowet, S.P.; Gonzalez, E.M.; Blackford, A.; Chirindel, A.; Pardoll, D.M.; Topalian, S.L.; Wahl, R.L. Prediction of Response to Immune Checkpoint Inhibitor Therapy Using Early-Time-Point 18 F-FDG PET/CT Imaging in Patients with Advanced Melanoma. J. Nucl. Med. 2017, 58, 1421–1428. [Google Scholar] [CrossRef] [PubMed] [Green Version]
- Anwar, H.; Sachpekidis, C.; Winkler, J.; Kopp-Schnetider, A.; Haberkorn, U.; Hassel, J.C.; Dimitrakopoulou-Strauss, A. Absolute number of new lesions on 18F-FDG PET/CT is more predictive of clinical response than SUV changes in metastatic melanoma patients receiving ipilimumab. Eur. J. Nucl. Med. Mol. Imaging 2018, 45, 376–383. [Google Scholar] [CrossRef] [PubMed]
- Sachpekidis, C.; Anwar, H.; Winkler, J.; Kopp-Schnetider, A.; Larribere, L.; Haberkorn, U.; Hassel, J.C.; Dimitrakopoulou-Strauss, A. The role of interim 18F-FDG PET/CT in prediction of response to ipilimumab treatment in metastatic melanoma. Eur. J. Nucl. Med. Mol. Imaging 2018, 45, 1289–1296. [Google Scholar] [CrossRef]
- Aide, N.; Hicks, R.J.; Le Tourneau, C.; Lheureux, S.; Fanti, S.; Lopci, E. FDG PET/CT for assessing tumour response to immunotherapy: Report on the EANM symposium on immune modulation and recent review of the literature. Eur. J. Nucl. Med. Mol. Imaging 2019, 46, 238–250. [Google Scholar] [CrossRef] [Green Version]
- Martin de Fremont, G.; Belkhir, R.; Henry, J.; Voisin, A.L.; Lambotte, O.; Besson, F.L.; Mariette, X.; Nocturne, G. Features of polymyalgia rheumatica–like syndrome after immune checkpoint inhibitor therapy. Ann. Rheum. Dis. 2020. [Google Scholar] [CrossRef] [Green Version]
- Seban, R.-D.; Nemer, J.S.; Marabelle, A.; Yeh, R.; Deutsch, E.; Ammari, S.; Moya-Plana, A.; Mokrane, F.-Z.; Gartrell, R.D.; Finkel, G.; et al. Prognostic and theranostic 18F-FDG PET biomarkers for anti-PD1 immunotherapy in metastatic melanoma: Association with outcome and transcriptomics. Eur. J. Nucl. Med. Mol. Imaging 2019, 46, 2298–2310. [Google Scholar] [CrossRef]
- Friedman, C.F.; Proverbs-Singh, T.A.; Postow, M.A. Treatment of the Immune-Related Adverse Effects of Immune Checkpoint Inhibitors: A Review. JAMA Oncol. 2016, 2, 1346. [Google Scholar] [CrossRef]
- Haratani, K.; Hayashi, H.; Chiba, Y.; Kudo, K.; Yonesaka, K.; Kato, R.; Kalneda, H.; Hasegawa, Y.; Tanaka, K.; Takeda, M.; et al. Association of Immune-Related Adverse Events with Nivolumab Efficacy in Non–Small-Cell Lung Cancer. JAMA Oncol. 2018, 4, 374. [Google Scholar] [CrossRef] [PubMed]
- Cheson, B.D.; Pfistner, B.; Juweid, M.E.; Gascoyne, R.D.; Specht, L.; Horning, S.J.; Coiffier, B.; Fisher, R.I.; Hagenbeek, A.; Zucca, E.; et al. Revised Response Criteria for Malignant Lymphoma. J. Clin. Oncol. 2007, 25, 579–586. [Google Scholar] [CrossRef] [PubMed]
- Cheson, B.D.; Horning, S.J.; Coiffier, B.; Shipp, M.A.; Fisher, R.I.; Connors, J.M.; Lister, T.A.; Vose, J.; Grillo-López, A.; Hagenbeek, A.; et al. Report of an International Workshop to Standardize Response Criteria for Non-Hodgkin’s Lymphomas. J. Clin. Oncol. 1999, 17, 1244. [Google Scholar] [CrossRef] [PubMed]
- Cheson, B.D.; Fisher, R.I.; Barrington, S.F.; Cavalli, F.; Schwartz, L.H.; Zucca, E.; Lister, T.A. Recommendations for Initial Evaluation, Staging, and Response Assessment of Hodgkin and Non-Hodgkin Lymphoma: The Lugano Classification. J. Clin. Oncol. 2014, 32, 3059–3067. [Google Scholar] [CrossRef]
- Itti, E.; Meignan, M.; Berriolo-Riedinger, A.; Biggi, A.; Cashen, A.F.; Véra, P.; Tilly, H.; Siegel, B.A.; Gallamini, A.; Casasnovas, R.-O.; et al. An international confirmatory study of the prognostic value of early PET/CT in diffuse large B-cell lymphoma: Comparison between Deauville criteria and ΔSUVmax. Eur. J. Nucl. Med. Mol. Imaging 2013, 40, 1312–1320. [Google Scholar] [CrossRef]
- Yuan, L.; Kreissl, M.C.; Su, L.; Wu, Z.; Hacker, M.; Liu, J.; Zhang, X.; Bo, Y.; Zhang, H.; Li, X.; et al. Prognostic Analysis of Interim 18F-FDG PET/CT in Patients with Diffuse Large B Cell Lymphoma after One Cycle versus Two Cycles of Chemotherapy. Eur. J. Nucl. Med. Mol. Imaging 2019, 46, 478–488. [Google Scholar] [CrossRef] [PubMed] [Green Version]
- Schöder, H.; Polley, M.-Y.C.; Knopp, M.V.; Hall, N.C.; Kostakoglu, L.; Zhang, J.; Higley, H.R.; Kelloff, G.; Liu, H.; Zelenetz, A.D.; et al. Prognostic value of interim FDG-PET in diffuse large cell lymphoma: Results from the CALGB 50303 Clinical Trial. Blood 2020, 135, 2224–2234. [Google Scholar] [CrossRef]
- Casasnovas, R.-O.; Ysebaert, L.; Thieblemont, C.; Bachy, E.; Feugier, P.; Delmer, A.; Tricot, S.; Gabarre, J.; Andre, M.; Fruchart, C.; et al. FDG-PET–driven consolidation strategy in diffuse large B-cell lymphoma: Final results of a randomized phase 2 study. Blood 2017, 130, 1315–1326. [Google Scholar] [CrossRef] [Green Version]
- Dührsen, U.; Müller, S.; Hertenstein, B.; Thomssen, H.; Kotzerke, J.; Mesters, R.; Berdel, W.E.; Franzius, C.; Kroschinsky, F.; Weckesser, M.; et al. Positron Emission Tomography–Guided Therapy of Aggressive Non-Hodgkin Lymphomas (PETAL): A Multicenter, Randomized Phase III Trial. J. Clin. Oncol. 2018, 36, 2024–2034. [Google Scholar] [CrossRef]
- Cheson, B.D.; Ansell, S.; Schwartz, L.; Gordon, L.I.; Aldvani, R.; Jacene, H.A.; Hoos, A.; Barrington, S.F.; Armand, P. Refinement of the Lugano Classification lymphoma response criteria in the era of immunomodulatory therapy. Blood 2016, 128, 2489–2496. [Google Scholar] [CrossRef] [PubMed] [Green Version]
- Younes, A.; Hilden, P.; Coiffier, B.; Hagenbeek, A.; Salles, G.; Wilson, W.; Seymour, J.F.; Kelly, K.; Gribben, J.; Pfreunschuh, M.; et al. International Working Group consensus response evaluation criteria in lymphoma (RECIL 2017). Ann. Oncol. 2017, 28, 1436–1447. [Google Scholar] [CrossRef]
- Beksac, M.; Gunduz, M.; Ozen, M.; Bakanay Ozturk, S.M.; Kucuk, O.; Ozkan, E. Impact of PET-CT Response on Survival Parameters Following Autologous Stem Cell Transplantation Among Patients with Multiple Myeloma: Comparison of Two Cut-Off Values. Blood 2014, 124, 3983. [Google Scholar] [CrossRef]
- Rajkumar, S.V.; Dimopoulos, M.A.; Palumbo, A.; Blade, J.; Merlini, G.; Mateos, M.-V.; Kumar, S.; Hillengass, J.; Kastritis, E.; Richardson, P.; et al. International Myeloma Working Group updated criteria for the diagnosis of multiple myeloma. Lancet Oncol. 2014, 15, e538–e548. [Google Scholar] [CrossRef]
- Fonti, R.; Larobina, M.; Del Vecchio, S.; De Luca, S.; Fabbricini, R.; Catalano, L.; Pane, F.; Salvatore, M.; Pace, L. Metabolic Tumor Volume Assessed by 18F-FDG PET/CT for the Prediction of Outcome in Patients with Multiple Myeloma. J. Nucl. Med. 2012, 53, 1829–1835. [Google Scholar] [CrossRef] [PubMed] [Green Version]
- Nanni, C.; Zamagni, E.; Versari, A.; Chauviet, S.; Bianchi, A.; Rensi, M.; Bellò, M.; Rambaldi, I.; Gallamini, A.; Patriarca, F.; et al. Image interpretation criteria for FDG PET/CT in multiple myeloma: A new proposal from an Italian expert panel. IMPeTUs (Italian Myeloma criteria for PET USe). Eur. J. Nucl. Med. Mol. Imaging 2016, 43, 414–421. [Google Scholar] [CrossRef]
- Modlin, I.M.; Lye, K.D.; Kidd, M. A 5-decade analysis of 13,715 carcinoid tumors. Cancer 2003, 97, 934–959. [Google Scholar] [CrossRef]
- Krenning, E.P.; Breeman, W.A.P.; Kooij, P.P.M.; Lameris, J.; Bakketr, W.; Koper, J.; Ausema, L.; Reubi, J.; Lamberts, S. Localisation of endocrine-related tumours with radioiodinated analogue of somatostatin. Lancet 1989, 333, 242–244. [Google Scholar] [CrossRef]
- Krenning, E.P.; Kwekkeboom, D.J.; Bakker, W.H.; Van Hagen, M.; Postema, P.; De Jong, M.; Reubi, J.-C.; Visser, T.; Reijs, A.; Hofland, L.; et al. Somatostatin receptor scintigraphy with [111In-DTPA-d-Phe1]- and [123I-Tyr3]-octreotide: The Rotterdam experience with more than 1000 patients. Eur. J. Nucl. Med. 1993, 20, 716–731. [Google Scholar] [CrossRef] [Green Version]
- Hofmann, M.; Maecke, H.; Börner, A.; Wetckesser, E.; Schöffski, P.; Oei, M.; Schumacher, J.; Henze, M.; Heppeler, A.; Meyer, J.; et al. Biokinetics and imaging with the somatostatin receptor PET radioligand 68Ga-DOTATOC: Preliminary data. Eur. J. Nucl. Med. 2001, 28, 1751–1757. [Google Scholar] [CrossRef]
- Poeppel, T.D.; Binse, I.; Petersenn, S.; Lahner, H.; Schott, M.; Alntoch, G.; Brandau, W.; Bockisch, A.; Boy, C. 68Ga-DOTATOC Versus 68Ga-DOTATATE PET/CT in Functional Imaging of Neuroendocrine Tumors. J. Nucl. Med. 2011, 52, 1864–1870. [Google Scholar] [CrossRef] [PubMed] [Green Version]
- Velikyan, I.; Sundin, A.; Sorensen, J.; Lubberink, M.; Sandström, M.; Garske-Román, U.; Lundqvist, H.; Granberg, D.; Eriksson, B. Quantitative and Qualitative Intrapatient Comparison of 68Ga-DOTATOC and 68Ga-DOTATATE: Net Uptake Rate for Accurate Quantification. J. Nucl. Med. 2014, 55, 204–210. [Google Scholar] [CrossRef] [PubMed] [Green Version]
- Geijer, H.; Breimer, L.H. Somatostatin receptor PET/CT in neuroendocrine tumours: Update on systematic review and meta-analysis. Eur. J. Nucl. Med. Mol. Imaging 2013, 40, 1770–1780. [Google Scholar] [CrossRef] [PubMed]
- Van Binnebeek, S.; Vanbilloen, B.; Baete, K.; Terwinghe, C.; Koole, M.; Mottaghy, F.M.; Clement, P.M.; Mortelmans, L.; Bogaerts, K.; Haustermans, K.; et al. Comparison of diagnostic accuracy of 111In-pentetreotide SPECT and 68Ga-DOTATOC PET/CT: A lesion-by-lesion analysis in patients with metastatic neuroendocrine tumours. Eur. Radiol. 2016, 26, 900–909. [Google Scholar] [CrossRef] [PubMed]
- Sundin, A.; Arnold, R.; Baudin, E.; Cwikla, J.B.; Eriksson, B.; Fanti, S.; Fazio, N.; Giammarile, F.; Hicks, R.J.; Kjaer, A. ENETS Consensus Guidelines for the Standards of Care in Neuroendocrine Tumors: Radiological, Nuclear Medicine and Hybrid Imaging. Neuroendocrinology 2017, 105, 212–244. [Google Scholar] [CrossRef]
- Shah, M.H.; Goldner, W.S.; Halfdanarson, T.R.; Bergsland, E.; Berlin, J.D.; Halperin, D.; Chan, J.; Kulke, M.H.; Benson, A.B.; Blaszkowsky, L.S.; et al. NCCN Guidelines Insights: Neuroendocrine and Adrenal Tumors, Version 2.2018. J. Natl. Compr. Cancer Netw. 2018, 16, 693–702. [Google Scholar] [CrossRef]
- Strosberg, J.; El-Haddad, G.; Wolin, E.; Hendifar, A.; Yao, J.; Chasen, B.; Mittra, E.; Kunz, P.L.; Kulke, M.H.; Jacene, H.; et al. Phase 3 Trial of 177Lu-Dotatate for Midgut Neuroendocrine Tumors. N. Engl. J. Med. 2017, 376, 125–135. [Google Scholar] [CrossRef]
- Garcia-Carbonero, R.; Sorbye, H.; Baudin, E.; Raymond, E.; Wiedenmann, B.; Niederle, B.; Sedlackova, E.; Toumpanakis, C.; Anlauf, M.; Cwikla, J.B.; et al. ENETS Consensus Guidelines for High-Grade Gastroenteropancreatic Neuroendocrine Tumors and Neuroendocrine Carcinomas. Neuroendocrinology 2016, 103, 186–194. [Google Scholar] [CrossRef] [Green Version]
- Basturk, O.; Yang, Z.; Tang, L.H.; Hruban, R.H.; Adsay, V.; McCall, C.M.; Krasinskas, A.M.; Jang, K.-T.; Frankel, W.L.; Balci, S.; et al. The High-grade (WHO G3) Pancreatic Neuroendocrine Tumor Category Is Morphologically and Biologically Heterogenous and Includes Both Well Differentiated and Poorly Differentiated Neoplasms. Am. J. Surg. Pathol. 2015, 39, 683–690. [Google Scholar] [CrossRef] [Green Version]
- Demirci, E.; Kabasakal, L.; Toklu, T.; Ocak, M.; Şahin, O.E.; Alan-Selcuk, N.; Araman, A. 177Lu-DOTATATE therapy in patients with neuroendocrine tumours including high-grade (WHO G3) neuroendocrine tumours: Response to treatment and long-term survival update. Nucl. Med. Commun. 2018, 39, 789–796. [Google Scholar] [CrossRef]
- Severi, S.; Nanni, O.; Bodei, L.; Sansovini, M.; Ianniello, A.; Nicoletti, S.; Scarpi, E.; Matteucci, F.; Gilardi, L.; Paganelli, G. Role of 18FDG PET/CT in patients treated with 177Lu-DOTATATE for advanced differentiated neuroendocrine tumours. Eur. J. Nucl. Med. Mol. Imaging 2013, 40, 881–888. [Google Scholar] [CrossRef] [PubMed]
- Bahri, H.; Laurence, L.; Edeline, J.; Leghzali, H.; Devillers, A.; Raoul, J.-L.; Cuggia, M.; Mesbah, H.; Clement, B.; Boucher, E.; et al. High Prognostic Value of 18F-FDG PET for Metastatic Gastroenteropancreatic Neuroendocrine Tumors: A Long-Term Evaluation. J. Nucl. Med. 2014, 55, 1786–1790. [Google Scholar] [CrossRef] [PubMed] [Green Version]
- Bray, F.; Ferlay, J.; Soerjomataram, I.; Siegel, R.L.; Torre, L.A.; Jemal, A. Global cancer statistics 2018: GLOBOCAN estimates of incidence and mortality worldwide for 36 cancers in 185 countries. CA Cancer J. Clin. 2018, 68, 394–424. [Google Scholar] [CrossRef] [PubMed] [Green Version]
- Evangelista, L.; Zattoni, F.; Guttilla, A.; Saladini, G.; Zattoni, F.; Colletti, P.M.; Rubello, D. Choline PET or PET/CT and Biochemical Relapse of Prostate Cancer: A Systematic Review and Meta-Analysis. Clin. Nucl. Med. 2013, 38, 305–314. [Google Scholar] [CrossRef] [PubMed]
- Chiaravalloti, A.; Di Biagio, D.; Tavolozza, M.; Calabria, F.; Schillaci, O. PET/CT with 18F-choline after radical prostatectomy in patients with PSA ≤2 ng/ml. Can PSA velocity and PSA doubling time help in patient selection? Eur. J. Nucl. Med. Mol. Imaging 2016, 43, 1418–1424. [Google Scholar] [CrossRef] [PubMed]
- Graziani, T.; Ceci, F.; Castellucci, P.; Polverari, G.; Lima, G.M.; Lodi, F.; Morganti, A.G.; Ardizzoni, A.; Schiavina, R.; Fanti, S. 11C-Choline PET/CT for restaging prostate cancer. Results from 4,426 scans in a single-centre patient series. Eur. J. Nucl. Med. Mol. Imaging 2016, 43, 1971–1979. [Google Scholar] [CrossRef]
- Silver, D.A.; Pellicer, I.; Fair, W.R.; Heston, W.D.; Cordon-Cardo, C. Prostate-specific membrane antigen expression in normal and malignant human tissues. Clin. Cancer Res. 1997, 3, 81–85. [Google Scholar]
- Sweat, S.D.; Pacelli, A.; Murphy, G.P.; Bostwick, D.G. Prostate-specific membrane antigen expression is greatest in prostate adenocarcinoma and lymph node metastases. Urology 1998, 52, 637–640. [Google Scholar] [CrossRef]
- Mannweiler, S.; Amersdorfer, P.; Trajanoski, S.; Terrett, J.A.; King, D.; Mehes, G. Heterogeneity of Prostate-Specific Membrane Antigen (PSMA) Expression in Prostate Carcinoma with Distant Metastasis. Pathol. Oncol. Res. 2009, 15, 167–172. [Google Scholar] [CrossRef]
- Hövels, A.M.; Heesakkers, R.A.M.; Adang, E.M.; Jager, G.; Strum, S.; Hoogeveen, Y.; Severens, J.; Barentsz, J. The diagnostic accuracy of CT and MRI in the staging of pelvic lymph nodes in patients with prostate cancer: A meta-analysis. Clin. Radiol. 2008, 63, 387–395. [Google Scholar] [CrossRef]
- Bakht, M.K.; Derecichei, I.; Li, Y.; Ferraiuolo, R.-M.; Dunning, M.J.; Oh, S.W.; Hussein, A.; Youn, H.; Stringer, K.F.; Jeong, C.W.; et al. Neuroendocrine differentiation of prostate cancer leads to PSMA suppression. Endocr.-Relat. Cancer 2019, 26, 131–146. [Google Scholar] [CrossRef] [PubMed]
- Tan, N.; Bavadian, N.; Calais, J.; Oyoyo, U.; Kim, J.; Turkbey, I.B.; Mena, E.; Davenport, M.S. Imaging of Prostate Specific Membrane Antigen Targeted Radiotracers for the Detection of Prostate Cancer Biochemical Recurrence after Definitive Therapy: A Systematic Review and Meta-Analysis. J. Urol. 2019, 202, 231–240. [Google Scholar] [CrossRef] [PubMed]
- Evans, J.D.; Jethwa, K.R.; Ost, P.; Williams, S.; Kwon, E.D.; Lowe, V.J.; Davis, B.J. Prostate cancer–specific PET radiotracers: A review on the clinical utility in recurrent disease. Pract. Radiat. Oncol. 2018, 8, 28–39. [Google Scholar] [CrossRef] [PubMed] [Green Version]
- Tan, N.; Oyoyo, U.; Bavadian, N.; Ferguson, N.; Mukkamala, A.; Calais, J.; Davenport, M.S. PSMA-targeted Radiotracers versus 18F Fluciclovine for the Detection of Prostate Cancer Biochemical Recurrence after Definitive Therapy: A Systematic Review and Meta-Analysis. Radiology 2020, 296, 44–55. [Google Scholar] [CrossRef]
- Hope, T.A.; Goodman, J.Z.; Allen, I.E.; Calais, J.; Fendler, W.P.; Carroll, P.R. Metaanalysis of 68Ga-PSMA-11 PET Accuracy for the Detection of Prostate Cancer Validated by Histopathology. J. Nucl. Med. 2019, 60, 786–793. [Google Scholar] [CrossRef] [PubMed] [Green Version]
- Ferraro, D.A.; Becker, A.S.; Kranzbühler, B.; Mebert, I.; Baltensperger, A.; Zeimpekis, K.G.; Grünig, H.; Messerli, M.; Rupp, N.J.; Rueschoff, J.H.; et al. Diagnostic performance of 68Ga-PSMA-11 PET/MRI-guided biopsy in patients with suspected prostate cancer: A prospective single-center study. Eur. J. Nucl. Med. Mol. Imaging 2021. [Google Scholar] [CrossRef]
- Fendler, W.P.; Schmidt, D.F.; Wenter, V.; Thierfelder, K.M.; Zach, C.; Stief, C.; Bartenstein, P.; Kirchner, T.; Gildehaus, F.J.; Gratzke, C.; et al. 68Ga-PSMA PET/CT Detects the Location and Extent of Primary Prostate Cancer. J. Nucl. Med. 2016, 57, 1720–1725. [Google Scholar] [CrossRef] [Green Version]
- Cytawa, W.; Seitz, A.K.; Kircher, S.; Fukushima, K.; Tran-Gia, J.; Schirbetl, A.; Bandurski, T.; Lass, P.; Krebs, M.; Połom, W.; et al. 68Ga-PSMA I&T PET/CT for primary staging of prostate cancer. Eur. J. Nucl. Med. Mol. Imaging 2020, 47, 168–177. [Google Scholar] [CrossRef]
- Ma, T.M.; Gafita, A.; Shabsovich, D.; Juarez, J.; Grogan, T.R.; Thin, P.; Armstrong, W.; Sonni, I.; Nguyen, K.; Lok, V.; et al. Identifying the Best Candidates for Prostate-specific Membrane Antigen Positron Emission Tomography/Computed Tomography as the Primary Staging Approach among Men with High-risk Prostate Cancer and Negative Conventional Imaging. Eur. Urol. Oncol. 2021. [Google Scholar] [CrossRef]
- Fendler, W.P.; Calais, J.; Eiber, M.; Flavell, R.R.; Mishoe, A.; Feng, F.Y.; Nguyen, H.G.; Reiter, R.E.; Rettig, M.B.; Okamoto, S.; et al. Assessment of 68Ga-PSMA-11 PET Accuracy in Localizing Recurrent Prostate Cancer: A Prospective Single-Arm Clinical Trial. JAMA Oncol. 2019, 5, 856. [Google Scholar] [CrossRef] [Green Version]
- Calais, J.; Ceci, F.; Eiber, M.; Hope, T.A.; Hofman, M.S.; Rischpler, C.; Bach-Gansmo, T.; Nanni, C.; Savir-Baruch, B.; Elashoff, D.; et al. 18F-fluciclovine PET-CT and 68Ga-PSMA-11 PET-CT in patients with early biochemical recurrence after prostatectomy: A prospective, single-centre, single-arm, comparative imaging trial. Lancet Oncol. 2019, 20, 1286–1294. [Google Scholar] [CrossRef]
- Fendler, W.P.; Ferdinandus, J.; Czernin, J.; Eiber, M.; Flavell, R.R.; Behr, S.C.; Wu, I.-W.K.; Lawhn-Heath, C.; Pampaloni, M.H.; Reiter, R.E.; et al. Impact of 68Ga-PSMA-11 PET on the Management of Recurrent Prostate Cancer in a Prospective Single-Arm Clinical Trial. J. Nucl. Med. 2020, 61, 1793–1799. [Google Scholar] [CrossRef]
- Hofman, M.S.; Lawrentschuk, N.; Francis, R.J.; Tang, C.; Vela, I.; Thomas, P.; Rutherford, N.; Martin, J.M.; Frydenberg, M.; Shakher, R.; et al. Prostate-specific membrane antigen PET-CT in patients with high-risk prostate cancer before curative-intent surgery or radiotherapy (proPSMA): A prospective, randomised, multicentre study. Lancet 2020, 395, 1208–1216. [Google Scholar] [CrossRef]
- Rowe, S.P.; Macura, K.J.; Mena, E.; Blackford, A.L.; Nadal, R.; Antonarakis, E.S.; Eisenberger, M.; Carducci, M.; Fan, H.; Dannals, R.F.; et al. PSMA-Based [18F]DCFPyL PET/CT Is Superior to Conventional Imaging for Lesion Detection in Patients with Metastatic Prostate Cancer. Mol. Imaging Biol. 2016, 18, 411–419. [Google Scholar] [CrossRef] [Green Version]
- Kelly, J.; Amor-Coarasa, A.; Nikolopoulou, A.; Kim, D.; Williams, C.; Ponnala, S.; Babich, J.W. Synthesis and pre-clinical evaluation of a new class of high-affinity 18F-labeled PSMA ligands for detection of prostate cancer by PET imaging. Eur. J. Nucl. Med. Mol. Imaging 2017, 44, 647–661. [Google Scholar] [CrossRef] [PubMed] [Green Version]
- Cardinale, J.; Schäfer, M.; Benešová, M.; Bauder-Wüst, U.; Leotta, K.; Eder, M.; Neels, O.C.; Haberkorn, U.; Giesel, F.L.; Kopka, K. Preclinical Evaluation of 18F-PSMA-1007, a New Prostate-Specific Membrane Antigen Ligand for Prostate Cancer Imaging. J. Nucl. Med. 2017, 58, 425–431. [Google Scholar] [CrossRef] [PubMed] [Green Version]
- Harada, N.; Kimura, H.; Onoe, S.; Watanabe, H.; Matsuoka, D.; Alrimitsu, K.; Ono, M.; Saji, H. Synthesis and Biologic Evaluation of Novel 18F-Labeled Probes Targeting Prostate-Specific Membrane Antigen for PET of Prostate Cancer. J. Nucl. Med. 2016, 57, 1978–1984. [Google Scholar] [CrossRef] [Green Version]
- Jones, W.; Griffiths, K.; Barata, P.C.; Paller, C.J. PSMA Theranostics: Review of the Current Status of PSMA-Targeted Imaging and Radioligand Therapy. Cancers 2020, 12, 1367. [Google Scholar] [CrossRef]
- Hofman, M.S.; Violet, J.; Hicks, R.J.; Ferdinandus, J.; Thang, S.P.; Akhurst, T.; Iravani, A.; Kong, G.; Kumar, A.R.; Murphy, D.G.; et al. [177 Lu]-PSMA-617 radionuclide treatment in patients with metastatic castration-resistant prostate cancer (LuPSMA trial): A single-centre, single-arm, phase 2 study. Lancet Oncol. 2018, 19, 825–833. [Google Scholar] [CrossRef]
- Hofman, M.S.; Emmett, L.; Sandhu, S.; Iravani, A.; Joshua, A.M.; Goh, J.C.; Pattison, D.A.; Tan, T.H.; Kirkwood, I.D.; Ng, S.; et al. [177Lu]Lu-PSMA-617 versus cabazitaxel in patients with metastatic castration-resistant prostate cancer (TheraP): A randomised, open-label, phase 2 trial. Lancet 2021, 397, 797–804. [Google Scholar] [CrossRef]
- Ceci, F.; Oprea-Lager, D.E.; Emmett, L.; Adam, J.A.; Bomanji, J.; Czernin, J.; Eiber, M.; Haberkorn, U.; Hofman, M.S.; Hope, T.A.; et al. E-PSMA: The EANM standardized reporting guidelines v1.0 for PSMA-PET. Eur. J. Nucl. Med. Mol. Imaging 2021. [Google Scholar] [CrossRef]
- Chiro, G.D. Positron Emission Tomography Using [18F] Fluorodeoxyglucose in Brain Tumors A Powerful Diagnostic and Prognostic Tool. Investig. Radiol. 1987, 22, 360–371. [Google Scholar] [CrossRef] [PubMed]
- Vander Heiden, M.G.; Cantley, L.C.; Thompson, C.B. Understanding the Warburg Effect: The Metabolic Requirements of Cell Proliferation. Science 2009, 324, 1029–1033. [Google Scholar] [CrossRef] [Green Version]
- Farwell, M.D.; Pryma, D.A.; Mankoff, D.A. PET/CT imaging in cancer: Current applications and future directions: PET-CT Imaging in Cancer. Cancer 2014, 120, 3433–3445. [Google Scholar] [CrossRef] [PubMed]
- Hanahan, D.; Weinberg, R.A. Hallmarks of Cancer: The Next Generation. Cell 2011, 144, 646–674. [Google Scholar] [CrossRef] [Green Version]
- West, H. Immune Checkpoint Inhibitors. JAMA Oncol. 2015, 1, 115. [Google Scholar] [CrossRef] [PubMed] [Green Version]
- Binnewies, M.; Roberts, E.W.; Kersten, K.; Chan, V.; Fearon, D.F.; Merad, M.; Coussens, L.M.; Gabrilovich, D.I.; Ostrand-Rosenberg, S.; Hedrick, C.C.; et al. Understanding the tumor immune microenvironment (TIME) for effective therapy. Nat. Med. 2018, 24, 541–550. [Google Scholar] [CrossRef]
- Haslam, A.; Prasad, V. Estimation of the Percentage of US Patients With Cancer Who Are Eligible for and Respond to Checkpoint Inhibitor Immunotherapy Drugs. JAMA Netw. Open 2019, 2, e192535. [Google Scholar] [CrossRef] [Green Version]
- Valero, C.; Lee, M.; Hoen, D.; Zehir, A.; Berger, M.F.; Seshan, V.E.; Chan, T.A.; Morris, L.G.T. Response Rates to Anti–PD-1 Immunotherapy in Microsatellite-Stable Solid Tumors with 10 or More Mutations per Megabase. JAMA Oncol. 2021. [Google Scholar] [CrossRef]
- Haslam, A.; Gill, J.; Prasad, V. Estimation of the Percentage of US Patients With Cancer Who Are Eligible for Immune Checkpoint Inhibitor Drugs. JAMA Netw. Open 2020, 3, e200423. [Google Scholar] [CrossRef] [PubMed]
- Datta, M.; Coussens, L.M.; Nishikawa, H.; Hodi, F.S.; Jain, R.K. Reprogramming the Tumor Microenvironment to Improve Immunotherapy: Emerging Strategies and Combination Therapies. Am. Soc. Clin. Oncol. Educ. Book 2019, 39, 165–174. [Google Scholar] [CrossRef] [PubMed]
- Popel, A.S. Immunoactivating the tumor microenvironment enhances immunotherapy as predicted by integrative computational model. Proc. Natl. Acad. Sci. USA 2020, 117, 4447–4449. [Google Scholar] [CrossRef] [PubMed] [Green Version]
- Bouleau, A.; Lebon, V.; Truillet, C. PET imaging of immune checkpoint proteins in oncology. Pharmacol. Ther. 2021, 222, 107786. [Google Scholar] [CrossRef] [PubMed]
- Bensch, F.; van der Veen, E.L.; Lub-de Hooge, M.N.; Jorritsma-Smit, A.; Boellaard, R.; Kok, I.C.; Oosting, S.F.; Schröder, C.P.; Hiltermann, T.J.N.; Van Der Wekken, A.J.; et al. 89Zr-atezolizumab imaging as a non-invasive approach to assess clinical response to PD-L1 blockade in cancer. Nat. Med. 2018, 24, 1852–1858. [Google Scholar] [CrossRef]
- Niemeijer, A.N.; Leung, D.; Huisman, M.C.; Bahce, I.; Hoekstra, O.S.; Van Dongen, G.A.M.S.; Boellaard, R.; Du, S.; Hayes, W.; Smith, R.; et al. Whole body PD-1 and PD-L1 positron emission tomography in patients with non-small-cell lung cancer. Nat. Commun. 2018, 9, 4664. [Google Scholar] [CrossRef]
- Loktev, A.; Lindner, T.; Mier, W.; Debus, J.; Altmann, A.; Jäger, D.; Giesel, F.; Kratochwil, C.; Barthe, P.; Roumestand, C.; et al. A Tumor-Imaging Method Targeting Cancer-Associated Fibroblasts. J. Nucl. Med. 2018, 59, 1423–1429. [Google Scholar] [CrossRef]
- Giesel, F.L.; Kratochwil, C.; Lindner, T.; Marschalek, M.M.; Loktev, A.; Lehnert, W.; Debus, J.; Jäger, D.; Flechsig, P.; Altmann, A.; et al. 68Ga-FAPI PET/CT: Biodistribution and Preliminary Dosimetry Estimate of 2 DOTA-Containing FAP-Targeting Agents in Patients with Various Cancers. J. Nucl. Med. 2019, 60, 386–392. [Google Scholar] [CrossRef] [Green Version]
- Kratochwil, C.; Flechsig, P.; Lindner, T.; Abderrahim, L.; Altmann, A.; Mier, W.; Adeberg, S.; Rathke, H.; Röhrich, M.; Winter, H.; et al. 68Ga-FAPI PET/CT: Tracer Uptake in 28 Different Kinds of Cancer. J. Nucl. Med. 2019, 60, 801–805. [Google Scholar] [CrossRef] [Green Version]
- Barrett, R.L.; Puré, E. Cancer-associated fibroblasts and their influence on tumor immunity and immunotherapy. eLife 2020, 9, e57243. [Google Scholar] [CrossRef] [PubMed]
- Chen, X.; Song, E. Turning foes to friends: Targeting cancer-associated fibroblasts. Nat. Rev. Drug Discov. 2019, 18, 99–115. [Google Scholar] [CrossRef] [PubMed]
- Chen, H.; Zhao, L.; Ruan, D.; Pang, Y.; Hao, B.; Dai, Y.; Wu, X.; Guo, W.; Fan, C.; Wu, J.; et al. Usefulness of [68Ga]Ga-DOTA-FAPI-04 PET/CT in patients presenting with inconclusive [18F]FDG PET/CT findings. Eur. J. Nucl. Med. Mol. Imaging 2021, 48, 73–86. [Google Scholar] [CrossRef]
- Zhao, L.; Chen, S.; Chen, S.; Pang, Y.; Dai, Y.; Hu, S.; Lin, L.; Fu, L.; Sun, L.; Wu, H.; et al. 68Ga-fibroblast activation protein inhibitor PET/CT on gross tumour volume delineation for radiotherapy planning of oesophageal cancer. Radiother. Oncol. 2021, 158, 55–61. [Google Scholar] [CrossRef] [PubMed]
- Watabe, T.; Liu, Y.; Kaneda-Nakashima, K.; Shirakami, Y.; Lindner, T.; Ooe, K.; Toyoshima, A.; Nagata, K.; Shimosegawa, E.; Haberkorn, U.; et al. Theranostics Targeting Fibroblast Activation Protein in the Tumor Stroma: 64 Cu- and 225 Ac-Labeled FAPI-04 in Pancreatic Cancer Xenograft Mouse Models. J. Nucl. Med. 2020, 61, 563–569. [Google Scholar] [CrossRef] [PubMed]
- Meyer, C.; Dahlbom, M.; Lindner, T.; Vauclin, S.; Mona, C.; Slavik, R.; Czernin, J.; Haberkorn, U.; Calais, J. Radiation Dosimetry and Biodistribution of 68Ga-FAPI-46 PET Imaging in Cancer Patients. J. Nucl. Med. 2020, 61, 1171–1177. [Google Scholar] [CrossRef]
- Gerlinger, M.; Rowan, A.J.; Horswell, S.; Larkin, J.; Endesfelder, D.; Gronroos, E.; Martinez, P.; Matthews, N.; Stewart, A.; Tarpey, P.; et al. Intratumor Heterogeneity and Branched Evolution Revealed by Multiregion Sequencing. N. Engl. J. Med. 2012, 366, 883–892. [Google Scholar] [CrossRef] [Green Version]
- Easwaran, H.; Tsai, H.-C.; Baylin, S.B. Cancer Epigenetics: Tumor Heterogeneity, Plasticity of Stem-like States, and Drug Resistance. Mol. Cell 2014, 54, 716–727. [Google Scholar] [CrossRef] [Green Version]
- Tirkes, T.; Hollar, M.A.; Tann, M.; Kohli, M.D.; Akisik, F.; Sandrasegaran, K. Response criteria in oncologic imaging: Review of traditional and new criteria. Radiographics 2013, 33, 1323–1341. [Google Scholar] [CrossRef] [PubMed]
- Borcoman, E.; Kanjanapan, Y.; Champiat, S.; Kato, S.; Servois, V.; Kurzrock, R.; Goel, S.; Bedard, P.; Le Tourneau, C. Novel patterns of response under immunotherapy. Ann. Oncol. 2019, 30, 385–396. [Google Scholar] [CrossRef] [PubMed]
- Lambin, P.; Rios-Velazquez, E.; Leijenaar, R.; Carvalho, S.; van Stiphout, R.G.; Granton, P.; Zegers, C.M.; Gillies, R.; Boellard, R.; Dekker, A.; et al. Radiomics: Extracting more information from medical images using advanced feature analysis. Eur. J. Cancer 2012, 48, 441–446. [Google Scholar] [CrossRef] [Green Version]
- O’Sullivan, F. A statistical measure of tissue heterogeneity with application to 3D PET sarcoma data. Biostatistics 2003, 4, 433–448. [Google Scholar] [CrossRef] [Green Version]
- El Naqa, I.; Grigsby, P.W.; Apte, A.; Kidd, E.; Donnelly, E.; Khullar, D.; Chaudhari, S.; Yang, D.; Schmitt, M.; Laforest, R.; et al. Exploring feature-based approaches in PET images for predicting cancer treatment outcomes. Pattern Recognit. 2009, 42, 1162–1171. [Google Scholar] [CrossRef] [Green Version]
- Pinto dos Santos, D.; Dietzel, M.; Baessler, B. A decade of radiomics research: Are images really data or just patterns in the noise? Eur. Radiol. 2021, 31, 1–4. [Google Scholar] [CrossRef]
- Yip, S.S.F.; Aerts, H.J.W.L. Applications and limitations of radiomics. Phys. Med. Biol. 2016, 61, R150–R166. [Google Scholar] [CrossRef] [PubMed] [Green Version]
- Traverso, A.; Wee, L.; Dekker, A.; Gillies, R. Repeatability and Reproducibility of Radiomic Features: A Systematic Review. Int. J. Radiat. Oncol. Biol. Phys. 2018, 102, 1143–1158. [Google Scholar] [CrossRef] [PubMed] [Green Version]
- Zwanenburg, A.; Vallières, M.; Abdalah, M.A.; Aerts, H.J.W.L.; Andrearczyk, V.; Apte, A.; Ashrafinia, S.; Bakas, S.; Beukinga, R.J.; Boellaard, R.; et al. The Image Biomarker Standardization Initiative: Standardized Quantitative Radiomics for High-Throughput Image-based Phenotyping. Radiology 2020, 295, 328–338. [Google Scholar] [CrossRef] [PubMed] [Green Version]
- Mayo, C.S.; Kessler, M.L.; Eisbruch, A.; Weyburne, G.; Feng, M.; Hayman, J.A.; Jolly, S.; El Naqa, I.; Moran, J.M.; Matuszak, M.M.; et al. The big data effort in radiation oncology: Data mining or data farming? Adv. Radiat. Oncol. 2016, 1, 260–271. [Google Scholar] [CrossRef]
- Orlhac, F.; Boughdad, S.; Philippe, C.; Stalla-Bourdillon, H.; Nioche, C.; Champion, L.; Soussan, M.; Frouin, F.; Frouin, V.; Buvat, I. A Postreconstruction Harmonization Method for Multicenter Radiomic Studies in PET. J. Nucl Med. 2018, 59, 1321–1328. [Google Scholar] [CrossRef]
- Da-Ano, R.; Visvikis, D.; Hatt, M. Harmonization strategies for multicenter radiomics investigations. Phys. Med. Biol. 2020, 65, 24TR02. [Google Scholar] [CrossRef]
- Chalkidou, A.; O’Doherty, M.J.; Marsden, P.K. False Discovery Rates in PET and CT Studies with Texture Features: A Systematic Review. PLoS ONE 2015, 10, e0124165. [Google Scholar] [CrossRef] [Green Version]
- Collins, G.S.; Reitsma, J.B.; Altman, D.G.; Moons, K. Transparent reporting of a multivariable prediction model for individual prognosis or diagnosis (TRIPOD): The TRIPOD Statement. BMC Med. 2015, 13. [Google Scholar] [CrossRef] [Green Version]
- Chicco, D. Ten quick tips for machine learning in computational biology. Biodata Min. 2017, 10, 35. [Google Scholar] [CrossRef] [PubMed]
- Padhani, A.R.; Miles, K.A. Multiparametric Imaging of Tumor Response to Therapy. Radiology 2010, 256, 348–364. [Google Scholar] [CrossRef] [PubMed]
- O’Connor, J.P.B.; Rose, C.J.; Waterton, J.C.; Carano, R.A.D.; Parker, G.J.M.; Jackson, A. Imaging intratumor heterogeneity: Role in therapy response, resistance, and clinical outcome. Clin. Cancer Res. 2015, 21, 249–257. [Google Scholar] [CrossRef] [PubMed] [Green Version]
- Vallières, M.; Freeman, C.R.; Skamene, S.R.; El Naqa, I. A radiomics model from joint FDG-PET and MRI texture features for the prediction of lung metastases in soft-tissue sarcomas of the extremities. Phys. Med. Biol. 2015, 60, 5471–5496. [Google Scholar] [CrossRef] [PubMed]
- Mu, W.; Tunali, I.; Gray, J.E.; Qi, J.; Schabath, M.B.; Gillies, R.J. Radiomics of 18F-FDG PET/CT images predicts clinical benefit of advanced NSCLC patients to checkpoint blockade immunotherapy. Eur. J. Nucl. Med. Mol. Imaging 2020, 47, 1168–1182. [Google Scholar] [CrossRef] [PubMed]
- Delso, G.; Furst, S.; Jakoby, B.; Ladebeck, R.; Ganter, C.; Nekolla, S.G.; Schwaiger, M.; Ziegler, S.I. Performance Measurements of the Siemens mMR Integrated Whole-Body PET/MR Scanner. J. Nucl. Med. 2011, 52, 1914–1922. [Google Scholar] [CrossRef] [Green Version]
- Besson, F.L.; Fernandez, B.; Faure, S.; Mercier, O.; Seferian, A.; Mignard, X.; Mussot, S.; Le Pechoux, C.; Caramella, C.; Botticella, A.; et al. 18F-FDG PET and DCE kinetic modeling and their correlations in primary NSCLC: First voxel-wise correlative analysis of human simultaneous [18F] FDG PET-MRI data. EJNMMI Res. 2020, 10, 88. [Google Scholar] [CrossRef]
- Ypsilantis, P.-P.; Siddique, M.; Sohn, H.-M.; Davies, A.; Cook, G.; Goh, V.; Montana, G. Predicting Response to Neoadjuvant Chemotherapy with PET Imaging Using Convolutional Neural Networks. PLoS ONE 2015, 10, e0137036. [Google Scholar] [CrossRef]
- Wang, H.; Zhou, Z.; Li, Y.; Chen, Z.; Lu, P.; Wang, W.; Liu, W.; Yu, L. Comparison of machine learning methods for classifying mediastinal lymph node metastasis of non-small cell lung cancer from 18F-FDG PET/CT images. EJNMMI Res. 2017, 7, 11. [Google Scholar] [CrossRef]
- Sibille, L.; Seifert, R.; Avramovic, N.; Vehren, T.; Spottiswoode, B.; Zuehlsdorff, S.; Schäfers, M. 18F-FDG PET/CT Uptake Classification in Lymphoma and Lung Cancer by Using Deep Convolutional Neural Networks. Radiology 2020, 294, 445–452. [Google Scholar] [CrossRef] [PubMed] [Green Version]
- Kawauchi, K.; Furuya, S.; Hirata, K.; Katoh, C.; Manabe, O.; Kobayashi, K.; Watanabe, S.; Shiga, T. A convolutional neural network-based system to classify patients using FDG PET/CT examinations. BMC Cancer 2020, 20, 227. [Google Scholar] [CrossRef] [Green Version]
- Pinochet, P.; Eude, F.; Becker, S.; Shah, V.; Sibille, L.; Toledano, M.N.; Modzelewski, R.; Vera, P.; Decazes, P. Evaluation of an Automatic Classification Algorithm Using Convolutional Neural Networks in Oncological Positron Emission Tomography. Front. Med. 2021, 8, 628179. [Google Scholar] [CrossRef] [PubMed]
- Guo, Z.; Li, X.; Huang, H.; Guo, N.; Li, Q. Deep Learning-Based Image Segmentation on Multimodal Medical Imaging. IEEE Trans. Radiat. Plasma Med. Sci. 2019, 3, 162–169. [Google Scholar] [CrossRef]


| Response to Treatment | ||||
|---|---|---|---|---|
| Criteria | CR | PR | SD | PD |
| EORTC (1999) |
Reduction of 18F-FDG uptake to background |
≥15% reduction of 18F-FDG uptake |
Neither CR, PR nor PD | ≥25% increase in 18F-FDG uptake |
| PERCIST (2009) |
Reduction of 18F-FDG uptake to background |
≥ 30% reduction in SULpeak |
Neither CR, PR nor PD | >30% increase in SUL peak |
| PECRIT (2017) | Metabolic disappearance of target; SAD reduction of LN |
≥30% reduction in SULpeak ≥30% decrease in TL diameter sum |
Neither CR, PR nor PD |
>30% increase in SUL peak Or new metabolically active lesion ≥20% increase in TL diameter Or new lesions |
| PERCIMT (2018) | Complete resolution of all 18F-FDG-avid lesions | Complete resolution of some 18F-FDG- lesions |
Neither CR, PR nor PD |
≥4 new lesions ≤ 10 mm Or ≥3 new lesions > 10 mm Or ≥2 new lesions > 15 mm |
| iPERCIST (2019) | Complete resolution of 18F-FDG uptake | ≥30% decrease in the target tumor 18F-FDG |
Neither CR, PR nor PD |
≥30% 18F-FDG uptake Or new 18F-FDG target (UPMD). Need second PET at 4–8 weeks later (CPMD); if progression is followed by PMR or SMD, the bar is reset. |
| Response to Treatment | ||||
|---|---|---|---|---|
| Criteria | CR | PR | SD | PD |
| LUGANO (2014) |
|
|
|
|
| LYRIC (2016) |
|
|
|
Adapted from Lugano to indeterminate response (IR) categories:
|
| RECIL (2017) |
|
Partial response
|
|
|
| Lesion Type | Site | Number of Lesions (x) | Grading |
| Diffuse | Bone marrow | Deauville scale (five points) | |
| Focal (F) | Skull (S) Spine (SP) Extraspinal (ExP) | x = 1 (no lesions) x = 2 (1 to 3 lesions) x = 3 (4 to 10 lesions) x = 4 (>10 lesions) | Deauville scale (five points) |
| Lytic (L) | x = 1 (no lesions) x = 2 (1 to 3 lesions) x = 3 (4 to 10 lesions) x = 4 (>10 lesions) | ||
| Fracture (Fr) | At least one | ||
| Paramedullary (PM) | At least one | ||
| Extramedullary (EM) | At least one | N/EN (Nodal/ExtraNodal) * | Deauville scale (five points) |
Publisher’s Note: MDPI stays neutral with regard to jurisdictional claims in published maps and institutional affiliations. |
© 2021 by the authors. Licensee MDPI, Basel, Switzerland. This article is an open access article distributed under the terms and conditions of the Creative Commons Attribution (CC BY) license (https://creativecommons.org/licenses/by/4.0/).
Share and Cite
Duclos, V.; Iep, A.; Gomez, L.; Goldfarb, L.; Besson, F.L. PET Molecular Imaging: A Holistic Review of Current Practice and Emerging Perspectives for Diagnosis, Therapeutic Evaluation and Prognosis in Clinical Oncology. Int. J. Mol. Sci. 2021, 22, 4159. https://0-doi-org.brum.beds.ac.uk/10.3390/ijms22084159
Duclos V, Iep A, Gomez L, Goldfarb L, Besson FL. PET Molecular Imaging: A Holistic Review of Current Practice and Emerging Perspectives for Diagnosis, Therapeutic Evaluation and Prognosis in Clinical Oncology. International Journal of Molecular Sciences. 2021; 22(8):4159. https://0-doi-org.brum.beds.ac.uk/10.3390/ijms22084159
Chicago/Turabian StyleDuclos, Valentin, Alex Iep, Léa Gomez, Lucas Goldfarb, and Florent L. Besson. 2021. "PET Molecular Imaging: A Holistic Review of Current Practice and Emerging Perspectives for Diagnosis, Therapeutic Evaluation and Prognosis in Clinical Oncology" International Journal of Molecular Sciences 22, no. 8: 4159. https://0-doi-org.brum.beds.ac.uk/10.3390/ijms22084159