Review

Genetics of Cardiovascular Disease: How Far Are We from Personalized CVD Risk Prediction and Management?

1
3rd Department of Internal Medicine, General University Hospital and 1st Faculty of Medicine, Charles University, 11636 Prague, Czech Republic
2
Experimental Medicine Centre, Institute for Clinical and Experimental Medicine, 14021 Prague, Czech Republic
3
Department of Epidemiology and Public Health, Institute of Epidemiology and Health Care, University College London, London WC1E 7HB, UK
*
Author to whom correspondence should be addressed.
Int. J. Mol. Sci. 2021, 22(8), 4182; https://0-doi-org.brum.beds.ac.uk/10.3390/ijms22084182
Submission received: 14 March 2021 / Revised: 9 April 2021 / Accepted: 12 April 2021 / Published: 17 April 2021
(This article belongs to the Special Issue Metabolic Syndrome: From Molecular Mechanisms to Novel Therapies)

Abstract

:
Despite the rapid progress in diagnosis and treatment of cardiovascular disease (CVD), this disease remains a major cause of mortality and morbidity. Recent progress over the last two decades in the field of molecular genetics, especially with new tools such as genome-wide association studies, has helped to identify new genes and their variants, which can be used for calculations of risk, prediction of treatment efficacy, or detection of subjects prone to drug side effects. Although the use of genetic risk scores further improves CVD prediction, the significance is not unambiguous, and some subjects at risk remain undetected. Further research directions should focus on the “second level” of genetic information, namely, regulatory molecules (miRNAs) and epigenetic changes, predominantly DNA methylation and gene-environment interactions.

1. Introduction

Cardiovascular disease (CVD) remains the most common cause of death in the majority of countries worldwide [1]. It includes coronary heart disease, cerebrovascular disease, peripheral arterial disease, rheumatic and congenital heart diseases, and venous thromboembolism (www.who.int/cardiovascular-disease#tab=tab_1/ accessed on 5 March 2021). Death rates from coronary heart disease (CHD) and stroke have generally been higher in Central and Eastern Europe (CEE) [2]. A decline in CVD mortality has been reported in most European countries; however, the decline in CVD mortality in CEE countries started substantially later [3]. Molecular genetics and pharmacogenetics play a key role in the diagnosis, prevention, and treatment of CVD. Genetic testing is used to identify the underlying genetic etiology in patients with suspected cardiovascular disease such as hypertrophic cardiomyopathy or familial hypercholesterolemia, and to determine who in the family has inherited the causal variant and is therefore at risk of developing CVD. Genetic testing should be carried out in well-phenotyped individuals and coupled with comprehensive family evaluation to aid in interpretation and application of the results [4]. Molecular genetics technologies applied to cardiovascular studies have enabled chromosome mapping and the identification of many genes involved in primary etiology (Figure 1).
Coronary artery disease and other common, complex cardiovascular diseases are heritable to variable extents. Our understanding of how DNA variants connect to function and how genetics may translate to the clinic has increased significantly over the past two decades [5]. In the following review, we present important examples of the genetic modification of CVD risk as well as the gene-environment and gene-pharmacotherapy relationships with regard to future use of these findings in personalized medicine.

2. Monogenic vs. Polygenic Determination

The majority of CVDs and CVD risk factors have polygenic backgrounds; thus, the interplay between environmental and lifestyle risk factors with risk alleles of dozens of polymorphisms is involved. However, monogenetic conditions can lead to severe premature CVD and early death if unrecognized and untreated.
The most common monogenic disease leading to premature CVD is familial hypercholesterolemia (FH). FH has a frequency of approximately 1:200 and is caused primarily by mutations within the LDL receptor (LDLR), apolipoprotein B (APOB), and PCSK-9 genes [6]. The relative frequencies of monogenic variants might vary slightly among different populations, but the most frequent are mutations in LDLR [7,8]. Although more than 2900 LDLR mutations have been identified, approximately one-thousand mutations are considered to be the cause of FH. In contrast with single missense mutations in the APOB gene, pathogenic and likely pathogenic mutations in the LDLR gene are mostly exonic substitutions and missense rearrangements [9,10].
Hypertrophic cardiomyopathy (HCM) is the most common familial heart disease with vast genetic heterogeneity. Mutations in 11 or more genes encoding proteins of the cardiac sarcomere (>1400 variants) are responsible for (or associated with) HCM. Genetic testing also allows expansion of the broad HCM disease spectrum and diagnosis of HCM phenocopies with different natural history and treatment options, but is not a reliable strategy for predicting prognosis [11].
Other monogenic CVDs are rather rare in comparison to FH, such as sitosterolemia or Marfan syndromes, which occur with frequencies of less than 1:1000, and the frequencies of many other diseases are so rare that they have not even been determined (Table 1) (for a detailed review, see [11]).
Table 1. Selected examples of monogenic cardiovascular diseases.
Gene(s)CVDManifestationFrequency
LDLR, APOB, PCSK9Familial hypercholesterolemiaHigh concentrations of LDL and total cholesterol; xanthomas; arcus lipoides cornae; xanthalesmas; coronary heart disease1:200–250
ABCG5, ABCG8SitosterolemiaHigh plasma sitosterol, campesterol; hypercholesterolemia; premature coronary heart disease; xanthomas1:2000
MYH7, MYBPC3, TNNT2, TPM1, MYL2, MYL3, PLN,Hypertrophic cardiomyopathyHypertrophy of left ventricle, shortness of breath, diastolic dysfunction, left ventricular outflow ischemia1:500
PKP2, DSP, DSG2, JUP, TMEM43Arrhythmogenic right ventricular cardiomyopathyVentricular arrhythmias, right ventricular cardiomyopathy1:5000
MYH7, MYBPC3, TNNT2, MYH6, MYPN, ANKRD1, RAF1, DES, DMDFamilial dilated cardiomyopathyDiastolic dysfunction, left ventricular hypertrophy, atrial fibrillation, congestive heart failure1:2500
FBN1, TGFBR1, TGFBR2, SMAD3, TGFB2, TGFB3, SKIMarfan’s syndromeAortic aneurysm or dissection, valvular heart disease, enlargement of the proximal pulmonary artery, congestive heart failure, arrhythmias1:5000
ACTA2, FBN1, MYH11, TGFBR1/2, LOX, COL3A1, TGFB2/3Thoracic aortic aneurysm and dissectionChest pain, renal cysts, thumb-palm sign, temporal arteritis, bicuspid aortic valve, abdominal aneurysm, intracranial aneurysm,unknown
BMPR2, BMPR1B, CAV1, KCNK3, SMAD9, ACVRL1, ENG, EIF2AK4Pulmonary arterial hypertensionRight ventricular failure, impaired brachial artery flow-mediated dilation, increased pulmonary vascular resistance15:1,000,000
KCNQ1/H2/E1/J2, SCN5A, CAV3, CALM1/2Long QT syndromeMalignant arrhythmia, palpitations, syncope, anoxic seizures secondary to ventricular arrhythmia1:2000
KCNH2Short QT syndromeAbbreviated QTc interval on the ECG, propensity for atrial and ventricular arrhythmias,unknown
SCN5ABrugada syndromeElevation of the ST, ventricular fibrillation, syncope, arrhythmia1:2000
For more details, see [11].
Sitosterolemia is a rare autosomal recessive disorder that is clinically similar to FH. Homozygous or compound heterozygous mutations in either ABCG5 or ABCG8 genes that lead to increased plant sterol (primarily sitosterol) absorption and plasma concentrations, xanthomas and accelerated atherosclerosis have been recognized as the molecular basis of the disease [12,13].
Marfan’s syndrome is an autosomal dominant disorder that has high penetrance with variable expression. It is caused by many different types of mutations in fibrillin 1 (FBN1) and manifests mostly as cardiovascular but also skeletal and ocular abnormalities. Affected individuals are usually very tall, and they have long limbs, long faces, long fingers and toes, hypomusculature, and chest, spine, hip, and foot deformities [14].
More than 100 monogenic CVDs have been identified, and at least 10 million people worldwide may have some of them [11] (for some examples see Table 1). Monogenic CVDs are characterized by early onset, usually severe symptoms, poor prognosis, and high mortality and disability rates. Therefore, monogenic CVDs cannot be underestimated, underdiagnosed, or undertreated. Fortunately, advances in gene testing technology, particularly next-generation sequencing, have triggered increased attention on the genetic diagnosis of “pre-symptomatic” subjects.

3. Association Studies

During the era of candidate gene studies, the genes and polymorphisms for analyses were selected according to our knowledge about the pathophysiology of the disease. This pioneering era was prone to many false positive (as well as false negative) results, and this was mainly due to the low numbers of examined subjects, which was often just a couple of dozen samples. Moreover, highly significant results were not confirmed in the following replication (often also small) studies.
However, some single genes/variants of unambiguous and high importance have been detected by this approach. Among them, polymorphisms within apolipoprotein E (APOE; OMIM acc. No. 107741) [15] as the determinant of plasma cholesterol levels, apolipoprotein A5 (APOA5; OMIM acc. No 606368) [16] as the determinant of plasma triglycerides, or melanocortin receptor type 4 as the determinant of body weight (MC4R; OMIM acc. No 155541) [17] shall be mentioned as successful and important examples of those days’ achievements.

4. Genome Wide Association Studies (GWAS)

After the era of candidate gene studies and chromosome mapping, GWAS significantly improved and extended our understanding of the genetic background of many noncommunicable diseases, including CVD and CVD risk factors [18]. The GWAS principle is “hypothesis free” [19]. This approach has led to the detection of many significant variants (followed by the identification of new genes) with completely unknown clinical importance.
The first GWAS dealing with CVD risk or CVD risk factors were published approximately 15 years ago [20,21,22], for review see [23].
GWAS have led to the detection of the most powerful genetic determinants of CVD, which are represented by SNPs (single nucleotide polymorphisms) within the human chromosome 9p21.3 region [24]. Variants were detected in a “gene-free” region (“gene desert”) later recognized as long noncoding regulatory RNA ANRIL (antisense noncoding RNA in the INK4 locus; located within the p15/CDKN2B-p16/CDKN2A-p14/ARF gene cluster) (OMIM acc. No. 613149) loci. The risk allele is associated with an increased risk of myocardial infarction (MI) by approximately 30–35%, and this effect is relatively homogenous in different populations and ethnic groups. Importantly, the detected variants are not associated with any of the traditional CVD risk factors (with the exception of diabetes), pointing at so far unknown mechanisms leading to atherosclerosis.
Interestingly, variants at these loci are associated with a wider spectrum of noncommunicable diseases. For example, associations have been shown for different types of cancer [25], glaucoma [26], or even autism [27]. These findings highlight the importance of these loci and the clustered SNPs as an exceptional genetic hotspot as a base of different diseases associated SNPs.
The second example of the “new” gene, which was detected due to GWAS, is sortilin (OMIM acc. No. 602458). GWAS signals within the CELSR2/PSRC1/SORT1 gene cluster were among the strongest signals associated with the risk of CVD [21] and plasma levels of LDL cholesterol [28]. Additionally, in this case, the mechanisms by which SORT1 influences plasma cholesterol levels were (and remain in detail so far) unknown. SORT1 encodes a multiligand sorting receptor that is expressed mainly in the liver and plays a role in intracellular trafficking. It binds to apolipoproteins E, B, and A5, which are important proteins acting in lipid metabolism (reviewed by [29]). SORT1 influences VLDL transport through the hepatic Golgi apparatus and simultaneously interacts with PCSK9 and influences LDLR degradation. Finally, it could serve as a low-capacity alternative LDL receptor (reviewed by [30]). However, although the effects of SORT1 on plasma cholesterol levels and MI risk have been well proven and repeatedly confirmed, the results from animal models [31,32] are not uniform and sometimes show conflicting results. The roles of SORT1 seem to be very complex and controversial, and the exact molecular mechanism remains unclear. Thus, the essential answer has not been provided regarding the association of increased or decreased liver expression with an increased risk of hypercholesterolemia and higher CVD risk.
Despite the important role of SORT1 in the determination of plasma cholesterol levels at the population level, a large study failed to detect any FH-associated mutation within this gene [33]. As the gene codes for the protein responsible for intracellular cholesterol transport, mutations within this gene may be severely deleterious and lead to lethal consequences in utero. This might explain why these mutations do not occur in the population.
At this point, we cannot omit FTO, which is probably the most interesting GWAS-detected gene and has gained multidisciplinary interest. GWAS demonstrated that FTO (“fat mass and obesity associated gene”; OMIM acc. No. 610966) was simultaneously associated with obesity [34,35] and an increased risk of type 2 diabetes mellitus (T2DM) development [36]. Variants in strong linkage disequilibrium clustering within the first intron of the gene are responsible for the increased risk. The associations with body mass index (BMI) and T2DM were quickly confirmed in later studies, and the association with BMI was described in all major ethnicities with the exception of black Africans, in whom the frequency of the risky allele and the proportion of BMI variation explained (reviewed by [37]) were much lower. The contribution of FTO variants to the risk of myocardial infarction was described shortly after the abovementioned first associations [38,39], followed by recognition of its role in renal failure [40], Alzheimer’s disease [41], diabetes complications [42], and even in the determination of total mortality [43].
Similar to ANRIL, the function of FTO is regulatory rather than structural or transport. A recent review [44] suggested that the variants exert their effects through another gene located in a cluster (RPGRIP1-l/FTO/IRX3) with FTO, namely, IRX3 (Iroquois homeobox protein 3). IRX3, whose promoter binds to enhancers located within the 1st intron of FTO and whose expression is influenced by tagging FTO variants, has also been associated with body weight in animal models. IRX3 is highly expressed in the pancreas, suggesting susceptibility to FTO/IRX3 through the potential effect of insulin secretion.
Nevertheless, the roles of FTO as an important epigenetic modifier influencing nucleic acid methylation [45], telomere length determination [46,47], and serving as a transcriptional coactivator [48] have been described in the literature.
It can be concluded that the variants within the FTO 1st intron region are among the most important and interesting hits from the era of GWA studies.
It is important to note that the GWAS-detected variants within the known candidate genes from the “association studies” era are often different (and more powerful) than the original variants identified in association studies.
The selected examples of the most powerful and most interesting genes/SNPs playing a role in CVD determination or in the determination of CVD risk factors are listed in Table 2.
Table 2. Examples of genes which SNPs are associated with increased risk of cardiovascular disease (CVD) or with strong effect on CVD risk factors.
GeneEffect onRef
ANRILRisk of myocardial infarction[24]
SORT1Plasma cholesterol levels[21,28]
APOA5Plasma triglyceride levels[16,49]
FTOBMI values, risk of T2DM and myocardial infarction[34,35,36,38,39]
TCF7L2Risk of T2DM[50]
APOEPlasma cholesterol levels[15]
MC4RBMI values[51]
CHRNA5-A3-B4Smoking addiction[52]
UMODHypertension[53]

5. Gene Score

5.1. Polygenic Predisposition

As mentioned above, single SNPs have a relatively minor effect on disease risk (usually with OR between 1.05–1.50 per allele) or just a slight effect on biochemical/anthropometrical parameters. For example, they are associated with increasing plasma total cholesterol by approximately 0.10–0.35 mmol/L; body weight by max. approximately 500–700 g per risky allele or blood pressure by 2–5 mmHg.
Although it is clear that noncommunicable diseases have polygenic backgrounds [54], the number of studies focused on polygenic determination of CVD is limited. Nonetheless, the published results show that polygenic scores represent the right approach for the personalized management of diseases (Figure 2).
An analysis of “only” one SNP is undoubtedly important to describe its potential in the determination of human phenotype/disease. However, such analyses, albeit of importance and interest, do not represent unquestionable proof and are not sufficient for identifying the risk factors leading to disease development. To overcome this problem, simultaneous analysis of more SNPs and the calculation of so-called gene risk scores or genetic risk scores (GRSs) or polygenic risk scores (PRSs) seem to be a reasonable approach [55,56]. A variable number of polymorphisms are being used for gene score construction, from a few to thousands.

5.2. Unweighted and Weighted Genetic Risk Score
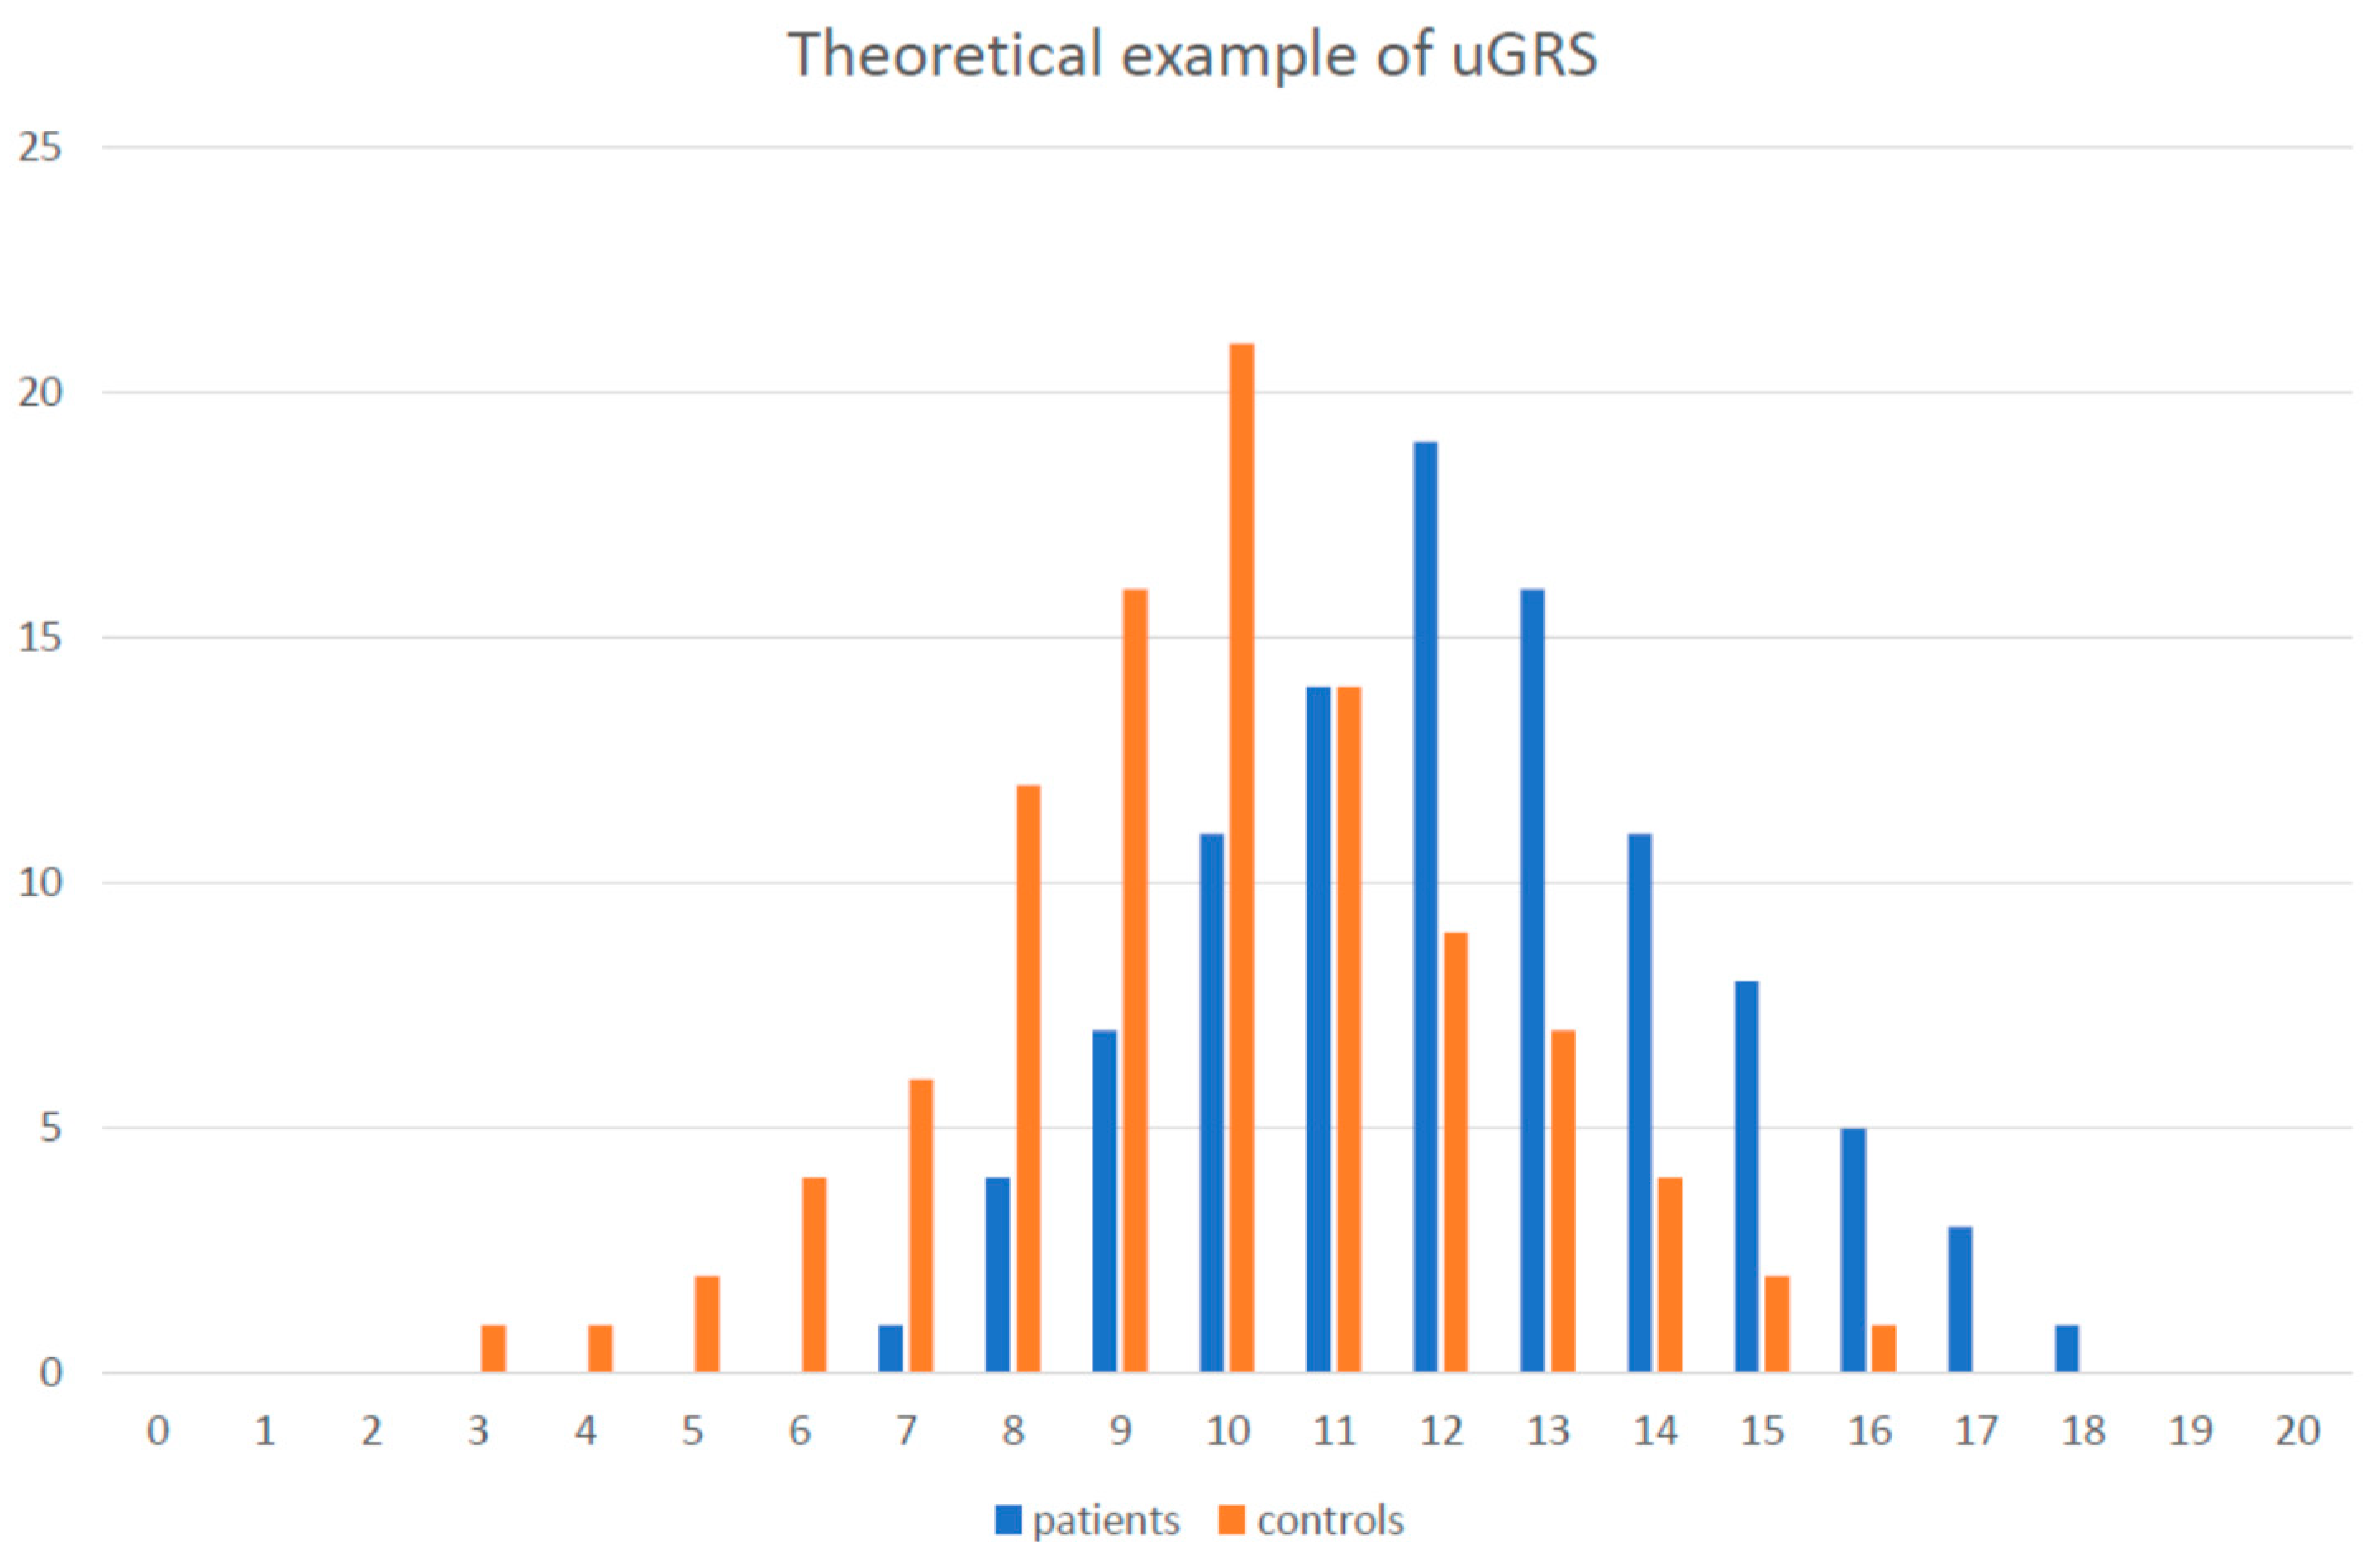
To calculate the GRS, alias PGS, two approaches are being used. The simple unweighted GRS (uGRS) summarizes the number of risk alleles, regardless of the effect size of each allele, and the weighted GRS (wGRS) takes into account the real effect of the SNP on the risk/biochemical parameter. Thus, for example, ANRIL variants will have higher power than risky alleles within other genes.
Both approaches have some advantages and pitfalls. The disadvantage of the wGRS is that the exact effect of the SNP on the parameter of interest within the population must be known for further calculations. This could be problematic because not all effects are necessarily generally applicable, even within populations of identical or similar ethnicities, as others and we have shown for the MLXIPL gene and plasma triglyceride values [57,58,59]. The wGRS could also be influenced by age, sex, and a wide list of environmental factors.
In contrast, for the simple uGRS, the exact effect of each genotype/allele does not have to be known, and information about the risky status is sufficient, although even this could be confusing, especially between the different ethnicities. For example, Japanese researchers [60] included AB0 gene variants in the GRS used for plasma lipid level estimation. Variants within this gene were not reported as significant in GWAS performed on Caucasians. An identical study that used different variants within the genes for SORT1, LDLR, and HMGCR showed that the effect sizes for the genes were different in comparison to the Global Lipids Genetics Consortium score (http://lipidgenetics.org accessed on 5 March 2021).
Given that the calculation of the GRS shall be used for disease risk estimation in young, asymptomatic subjects (to allow the detection of subjects at risk as soon as possible to initiate intensive and focused lifestyle interventions, potentially followed by pharmacological treatments), the use of the uGRS seems to be a sufficient tool.

5.3. GRS Examples

Initial studies focused on simultaneous analyses of several polymorphisms in association with plasma cholesterol levels were published (without attracting much attention) more than a quarter of century ago [61,62] and included APOE, APOB, and LDLR genes.
The golden age of the gene scoring began after the description of the human genome and after wider availability of high-throughput genotyping technologies. Briefly, there is a wide list linking the GRS and obesity prediction [63], plasma TG values [64,65], or hypertension [66].
Talmud et al. [67] used a preselected list of 65 SNPs to estimate the risk of T2DM development. Although the individual odds varied between 0.93 and 1.32, if the subjects from the top vs. bottom quintiles of the gene score were compared, the 10-year risk of T2DM development was almost 3 times higher for the top-quintile subjects.
Very detailed and extensive analyses on the identical phenotype were performed in the Estonian Biobank cohort [68]. Two different types of gene scores were used: Weighted and double weighted (taking into account the P values from all available studies for the SNPs of interest). Furthermore, different numbers of SNPs (from 65 to 2100) were used in different models, as well as different types of adjustments. Interestingly, the best prediction for T2DM manifestation was reached with the GRS that included 1000 SNPs and in the model without adjustment for BMI.
Using the 53 SNPs, Morris et al. [69] did not significantly improve CVD risk predictions based on traditional risk factors. Some utility has been demonstrated for intermediate-risk groups only, which was not surprising because a significant number of the selected SNPs used for the risk estimation were associated with traditional risk factors, mainly dyslipidaemia. Moreover, the effect of some individual SNPs used for GRS calculation was not confirmed in this study, thus highlighting the risk of inaccuracies, if external values are used for the calculation.
GRS is also used for the detection of so-called “polygenic FH” (see above), although FH was originally recognized as a monogenic disease. Currently, approximately 20% of clinically diagnosed FH cases are suggested to have the polygenic form of FH [6,70]. FH patients without monogenic causes have been shown to have a high GRS resulting from the contribution of several (usually 6–12) common LDL-C-raising SNPs.
A study published by Khera et al. [71] can serve as an extreme example of the use of the GRS in CVD prediction. The authors used more than 6 million SNPs for the risk estimation, and the high GRS was associated with a 3.7-fold increased likelihood of myocardial infarction. The cost–benefit of such analysis is thus questionable because the strongest CVD-associated SNPs within the ANRIL loci (see above) have ORs of approximately 1.7 in the case of homozygosity.
Thus, including such extremely high numbers of SNPs will not add as much value as expected; moreover, the optimum has not been identified.

6. Nutrigenetics

In the vast majority of noncommunicable diseases, neither the genes nor the environment or lifestyle individually are sufficient to fully explain the risk of the disease. Thus, we need to improve our understanding of the interactions between the genes and environment, especially between genes and diet.
From environmental and lifestyle factors, an unhealthy diet (beyond smoking) is one of the leading causes of mortality and morbidity worldwide. In fact, the Global Burden of Disease project estimated that in 2015, nutritional risk factors were responsible for more deaths and disease worldwide (calculated as % of disability adjusted life years—DALY) than any other risk [72]. An earlier analysis from the WHO found that an unhealthy diet together with physical inactivity contributed to 57% of cardiovascular deaths globally (//apps.who.int/iris/handle/10665/44203, accessed 5 March 2021). Genetic determinants of eating habits have been the focus of considerable scientific interest for decades.
An important area of research in this topic is to identify genetic targets for the purpose of personalized medicine and personalized nutrition. The interaction between dietary habits and genes is extremely complex and can go both ways: Specific genetic characteristics can influence the effect of the diet on biochemical or anthropometrical characteristics (nutrigenetics); however, what we eat may also have an impact on gene expression (nutrigenomics).
Within nutrigenetics, there are several illustrative examples showing how SNPs could influence the effect of consumed nutrients on plasma lipids or body weight.
Cholesterol 7 alpha-hydroxylase (CYP7A1) is the rate-limiting enzyme in the bile acid synthesis cascade, the only metabolic pathway for cholesterol elimination from the body [73]. There are several functional polymorphisms within the CYP7A1 promotor region. In a primary study, rs3808607 significantly influenced cholesterol decrease in a subset of males in the Czech population based post-MONICA study after marked changes in dietary habits (caused by socioeconomic changes between 1988 and 1996) and suggested the highest sensitivity of CC homozygotes [74]. The results were later confirmed in interventional studies based on dietary cholesterol intake in male volunteers [75] and in randomized trial focused on plant sterol consumption [76] or interventions based on cafesterol consumption [77].
The abovementioned FTO gene interacts with many dietary factors. Subjects with low protein intake and the “BMI-increasing” allele of FTO have the highest BMI values, and this interaction is particularly strong in distinct Asian populations [78]. The modification of the effect of FTO on BMI values through protein intake has also been found in children and adolescents [79]. Finally, higher birth weight also attenuated an association between the FTO genotypes and BMI values in adulthood [80].
Homocysteine, which is believed to be a risk factor for MI and stroke, is associated with the dietary intake of folate. It has been shown that the effect of methylene tetrahydrofolate reductase (MTHFR) polymorphism on homocysteine concentration is larger in regions with low folate intake than in regions where folate fortification is common [81].
The abovementioned risk associated with variants within the ANRIL, long noncoding regulatory RNA, although not associated with traditional risk factors, could be modified by dietary habits. It has been described [82] that increased intake of sugar-sweetened beverages interacts with ANRIL variants. An increased risk of nonfatal MI was observed only in subjects consuming more than 2 servings daily. Interestingly, this interaction was not observed in consumers of fruit juice only, despite identical energy intake per servings.
The list of potentially interesting nutrigenetic associations is long; however, a number of results remain unconfirmed in subsequent independent studies. The list of reviews and opinion papers on the topic is probably as long as the list of original results, but some of them are useful to read [83,84,85].
The significant lack of knowledge in the field of nutrigenetics and lack of a description of real and valid gene-environment interactions are much more complicated than originally believed.
In one of our previous studies, we focused on the determination of binge drinking and alcohol consumption within the large HAPIEE study, which involved almost 30,000 subjects from four countries [86]. For the differentiation between the subgroups of binge drinkers and controls, the two genes of interest (FTO and ADH1B), sex, smoking status, and drinking pattern were gradually included in the model and examined. Discrimination into these subgroups has resulted in subgroups with approximately 200–500 subjects. Thus, even the use of very large, precisely defined, and extensively and homogenously phenotyped subjects cannot guarantee unquestionable results and final answers, and such studies need to be replicated in independent cohorts.

7. Pharmacogenetic of CVD Treatment

The metabolism, effects, and side effects of all drugs are being determined and/or modified by genetic background. Pharmacogenetics will help us understand the complex relationships and determine individualized/personalized approaches to pharmacotherapy. There is significant interpatient variability in drug response, much of which has a genetic basis. Specifically, genotypes can influence drug metabolism, drug transport, and a person’s sensitivity to a drug [87].
In pharmacogenetics, the interactions between genetic variants and drug efficacy and/or susceptibility to undesirable side effects (USEs) are analyzed. This field has the potential to improve health outcomes by identifying individuals who have a greater benefit from treatment or who are at greater risk of harm caused by medication intolerance [88].
Statins are inhibitors of hydroxymethylglutaryl CoA-reductase (key enzyme of cholesterol biosynthesis), and they are among the most frequently used drugs. Despite the relatively low USE prevalence, the numbers of affected subjects are huge because the number of patients taking statins is enormous.
There are several genes with the potential to be helpful in the detection of subjects prone to statin USE (mostly muscle symptoms) [89,90,91].
The most powerful transporter seems to be the SLCO1B1 drug transporter. The gene encodes an organic anion-transporting polypeptide OATP1B1, which regulates the hepatic uptake of statins. A common variant (rs4363657) within this gene is associated with a significantly increased risk of myopathy, and carriers of two risk alleles have a 16-fold increased risk [92]. Later studies suggested [93,94,95] that this risk is limited to subjects on high statin doses (at least 40 mg daily), especially to patients treated with simvastatin.
For the treatment of hypertension, an important drug class is beta-blockers. It is recommended to examine the variants within CYP2D6 for the optimal dosing and avoiding the USE of this drug class [96].

8. Epigenetics

The term epigenetic has been several times redefined and recently, the most accepted definition is that epigenetic information represents the type of genetic information, which is not directly included in the DNA sequence. There are several mutual characteristics of epigenetic factors. They are reversible and not stable across the entire life span of individuals, and they can be influenced by the subjects’ lifestyle (e.g., by physical activity, smoking status, dietary habits). At least some of them (DNA methylations) are clearly heritable similarly to the DNA sequence. Epigenetic changes have primarily regulatory effects. There are two major types of epigenetic information [97] potentially associated with CVD that are commonly analyzed; (i) regulatory noncoding RNA, mostly represented by microRNA (miRNA) and (ii) DNA methylation.
Despite the modification of histones (mostly acetylation, methylation. and phosphorylation), which can potentially affect DNA replication, chromosome condensation or alternative gene splicing could have important consequences in connection with CVD [98], there is a significant lack of concise and well-performed studies.

8.1. Regulatory Non-Coding miRNA

MicroRNAs (miRNAs) are endogenous, short noncoding single-stranded RNA molecules, ~22 nucleotides in length, which act as transcriptional regulators and are involved in posttranscriptional processes.
MiRNAs are derived from transcripts that form distinctive hairpin structures. Processing of the hairpin into the mature miRNA allows the formation of an RNA-induced silencing complex (RISC) [99]. The miRNAs then pair with targeting mRNAs by binding to the different gene regions: 3′-untranslated region (3′UTR), 5′UTR, promoter or coding sequences. miRNA binding can both repress or activate translation. The crucial binding location for translational regulation resides in the mature miRNA sequence, called the seed region [100,101].
Deregulation of miRNA expression plays a crucial role in the pathogenesis of numerous diseases, including cardiovascular diseases. Changes in miRNA expression and/or function have been associated with various cardiovascular complications, such as myocardial infarction, cardiac hypertrophy, cardiomyopathy, or arrhythmias [102,103]. MiRNAs are expressed in cardiomyocytes, fibroblasts, endothelial cells, and vascular smooth muscle cells and control virtually all aspects of cardiovascular biology, including cardiac remodeling and fibrosis, apoptosis, inflammation, proliferation, angiogenesis, and metabolism [104].
MicroRNAs play a critical role in myocardial infarction by regulating apoptotic, necrotic, and autophagic cell death. Many miRNAs are differentially regulated in heart tissue in response to myocardial infarction depending on the type of myocardial injury [105].
MiRNAs are involved in every stage of the biological process of atherosclerosis, that is, endothelial dysfunction, cellular adhesion, plaque development, and plaque rupture (Table 3). Moreover, endothelial cells (ECs), macrophages, and smooth muscle cells (SMCs), which participate in pathways of plaque and thrombus formation, may potentially release miRNAs in systemic circulation [106].
Table 3. List of selected regulatory miRNA involved in CVD development.
miRNAFunction
miR-15 family, miR-34 family, miR-499, miR-320, miR-24, miR-1, miR-16, miR-21, miR-92a, miR-375, miR-103/107, miR-133a/b, miR-214Differently regulated in heart tissue in response to myocardial infarction
miR-34a, miR-217, miR-146aEndothelial cell senescence
miR-126, miR-31, miR-17-3pVascular inflammation
miR-21, miR-221, miR-222, miR-143/145 cluster, miR-1, miR-10aSMC (smooth muscle cell) differentiation, survival, proliferation, and dedifferentiation
miR-155, miR-125a-5pMonocytes/macrophages lipid uptake and inflammatory responses
miR-146a, miR-128, miR-365, miR-503Effect on migration of macrophages
miR-33, miR-302a, miR-122, miR-370, miR-335, miR-378, miR-27, miR-125a-5p, miR-33a/b, miR-144, miR-223, miR-148a, miR-128-1Cholesterol homeostasis and fatty acid oxidation
For more details, see [100,101,102,103,104,105,106,107,108,109,110,111,112,113,114].
Several miRNAs have been associated with regulatory mechanisms involved in EC senescence [107,108] and regulate vascular inflammation [109,110]. In addition to proinflammatory cytokines, changes in miRNA expression levels due to blood flow have the potential to affect networks of genes regulating endothelial and vascular smooth muscle cell function, inflammation, and atherosclerosis [111].
In response to endothelial dysfunction and inflammatory cell infiltration, SMCs migrate from the media to the intima and proliferate to form neointimal lesions. The switch from a contractile to a synthetic proliferative phenotype in SMCs is controlled by miRNAs, some of which are essential for the acquisition of the contractile phenotype, SMC differentiation, and the structural integrity of the aorta [112]. MiR-133 was reported to prevent the phenotypic switching of SMCs, and miR-21, miR-221, and miR-222 promote SMC survival, proliferation, and dedifferentiation [113].
Lipid uptake and inflammatory responses in monocytes/macrophages are regulated by miRNAs, such as miR-155 and miR-125a-5p [114,115]. As a result, neointimal accumulation of foam cells and fatty streaks can be reduced, which is a main determinant of plaque development and instability.
MiRNAs regulate signaling and lipid homeostasis pathways that alter the balance of atherosclerotic plaque progression and regression. MiRNAs have been identified to be potent posttranscriptional regulators of genes involved in the regulation of cholesterol homeostasis and fatty acid oxidation, fatty acid metabolism, and lipogenesis [116], and have been shown to play a key role in governing HDL metabolism [117].
Circulating miRNA released from cells can be detected in virtually all human body fluids [118]. Unlike intracellular miRNAs, circulating miRNAs show remarkable stability and resistance to degradation by endogenous RNases. MiRNAs can be released into the blood circulation by various mechanisms, including active secretion, apoptosis, or necrosis. It has been proposed that circulating miRNAs reside in microvesicles, which may provide protection from RNase activity and account for the shedding of miRNAs into the circulation [119]. Cell-secreted miRNAs play an important role in cell-to-cell communication. The stability of circulating miRNAs has stimulated interest in their use as biomarkers for the diagnosis and prognosis of various diseases, including CVD.

8.2. DNA Methylation

DNA methylation seems to be the most important and most extensively studied DNA epigenetic modification in association with CVD [120]. DNA methylation affects cytosine within CpG sites across the entire genome. Of all the epigenetic markers, DNA methylation is the most stable and occurs approximately within every second gene, and 70% of all CpGs within the human genome are methylated [121]. Generally, the global DNA methylation pattern can be analyzed: Methylation within long-interspersed nuclear elements (LINE-1) or within ALU sequences. Finally, detailed differences near the candidate genes within their regulatory elements could be analyzed using comparative bisulfite sequencing. Epigenetic changes could lead to an increase in both the transcription machinery and gene silencing. The importance of appropriate nutrition is underlined here—the sufficient intake of methyl-group donors, such as folate and other B vitamins, is necessary for optimal epigenetic regulation [122].
Agha and colleagues [123] performed a large epigenome-wide profiling study and detected that out of the almost 500,000 CpGs, the methylation levels at more than 50 CpG sites were significantly associated with incident CVD or myocardial infarction. These CpG sites mainly influenced genes involved in calcium homeostasis and calcium-dependent regulation, cardiac remodeling, and leukocyte transendothelial migration.
The importance of prenatal nutrition for the development of CVD in adulthood was suggested in a study in which six loci sensitive to prenatal nutrition were examined [124]. Increased methylation at GNASAS (alias NESPAS, with a highly imprinted expression pattern involved in the regulation of fetal nutrient demand) was associated with an increased risk of MI in females.
The results from the German KORA study [125] pointed to the importance of DNA methylation for the determination of plasma lipids. Interestingly, it seems that many more CpG sites are involved in the determination of plasma triglycerides and total cholesterol than in the determination of LDL and HDL cholesterol levels.

9. Telomeres

Telomeres are nucleoprotein complexes located at the ends of the linear chromosomes, and they protect chromosomes from DNA degradation and fusion. In humans, telomeres consist of thousands of TTAGGG hexanucleotides and a protein complex called shelterin. Telomere length is used as a marker of biological/cellular age [126], as telomeres become shorter with each cell division. It is worth mentioning that most studies analyze the relative telomere length, not the absolute telomere length.
Shorter telomere length was associated with an increased risk of cardiovascular mortality in several large longitudinal studies [127,128]. Additionally, some CVD risk factors were associated with telomere length, such as obesity, plasma lipids, or hypertension. These associations could be influenced by the age of examined subjects and generally showed strong heterogeneity effects [129,130,131].
It is important to remember that in contrast to SNPs or mutations, the pattern of epigenetic changes, unfortunately, will not be identical in different tissues [132,133,134]. Thus, for example, the relevance of information obtained from DNA isolated from peripheral blood (which is the most common source of DNA) for cardiac cell function is not absolutely justified.

10. Geographical and Ethnical Differences

Different populations and ethnicities have significant differences in genetic backgrounds, and these differences may influence disease development.
Rare mutations are geographically specific, which is not surprising because the prevalence differences are based often on the “founder effect”. However, important and extraordinary differences are also observed for allelic frequencies of many common and important variants.
At this point, apolipoprotein L1 (APOL1, OMIM acc No. 603743) and its variants should be mentioned. The APOL1 gene encodes an ion channel, and there are two known functional variants (rs73885319 and rs71785313). These variants are associated with an approximately twofold-fold increased risk of CVD (and even with a 10-fold increased risk of renal failure) [135]. The spread of these variants is a result of their primary function: Protection against Trypanosoma brucei infection (cause of sleeping disease) [136]; thus, as a result of selection pressure, they occur in black Africans only [49].
Additionally, variants within the abovementioned APOA5 gene show strong interethnic differences (for review see [137]). For example, one of the variants (rs3135506) commonly present in almost 30% of Hispanics and in approximately 14% of Caucasians and Africans is almost completely missing in Asians (less than 1%). In contrast, the minor allele of the APOA5 variant rs2075291 is present in Asians only.
Significant differences could also be observed within the large ethnic groups, despite hundreds of years of inhabiting identical geographic regions. The largest Middle European minority are Roma/Gypsy subjects, exhibiting identical ethnicity as the majority—Caucasians. Between Roma Caucasians and non-Roma Caucasians, significant differences were described (not only) in genetic predisposition to T2DM, albeit in both directions depending on the set of SNPs selected [138,139].
Another example of interethnic difference originating from nutrition-based selection pressure is the rs1229984 variant within the alcohol dehydrogenase (ADH1B, OMIM ac. No. 103720) gene. The enzyme encoded by ADH1B is the key metabolizer of ethanol, and two isoforms (with His or Arg at amino acid position 47) exhibit highly significant differences in ethanol catabolism. Slow metabolizers (Arg carriers) consume approximately 30% more ethanol than rapid Arg metabolizers [140]. This paradox is caused by the fact that rapid metabolizers accumulated the first ethanol degradation product, acetaldehyde, which causes unpleasant reactions to alcohol consumption. There are extreme allelic differences between Europeans (~5% of the His allele) and Asians (~80% of the His allele) [141], and the differences are considered the result of selection pressure in the past. Increased aldehyde concentrations associated with allele His help to degrade toxins, products of rice decay. Due to the medieval era, most European inhabitants consumed beer and wine because water was highly sludge-contaminated; however, in Asia, this problem was solved by boiling water, and tea was preferably consumed.
The abovementioned examples clearly point to the fact that the use of general GWAS results for calculation could be misleading, especially when different ethnicities and males or females or subjects from different geographical regions with different lifestyle habits are examined.

11. Heritability of CVD risk Modifiers: Less Understood Piece of the Puzzle

The list of the CVD risk factors or factors associated with CVD seems to be endless [142], and at least partial genetic determination can be assumed for all risk factors as well as risk modifiers, which was suggested by the latest versions of ESC/EAS guidelines [143]. However, studies evaluating the genetic component of complex risk modifiers and factors known to be associated with increased CVD risk (e.g., socioeconomic factors, climate, psychosocial factors, etc.) are infrequent and difficult to conduct and evaluate and interpret [144].

12. Conclusions and Future Direction

“One size will not fit all” is the basis of personalized medicine, which has been promulgated over the last decade at conferences and meetings and fills the pages of scientific journals. Unfortunately, large gaps remain in clinical practice, and the motivation for bringing this approach closer to patients may also be lacking [145].
Although nutrigenetic and nutrigenomic research has made some notable discoveries over the last years, such as identifying genetic determinants of obesity, lipid metabolism, or type 2 diabetes [146,147,148], the application of these findings in clinical or public health practice is also infrequent. Nonetheless, despite the methodological challenges, this line of research has the potential to offer practitioners the opportunity to provide dietary advice that is specifically tailored to the needs of the individuals. Unfortunately, such an approach is more often detectable at the private level and rarely supported by health insurance companies.
Determining the genetic determinants of our response to diet or treatment could be important for a number of reasons for both clinical and public health research and practice.
We can measure the genes, improve the accuracy of dietary assessments, and reduce the impact of measurement bias and residual confounders, which are often major limitations in traditional nutritional epidemiological analyses that could help to tailor more detailed recommendations. Although enormous amount of genetic information is available, more extensive assessment of such information relative to other traditional risk factors have not been performed; thus, genetic information has not been adequately used for CVD risk estimation.
Explosive progress achieved in understanding the rapidly evolving science underlying CVD genomics has resulted in fee-for-service testing, making genetic information widely available. Proper interpretation of these results is even more important than ever before. The power of genetic analysis lies most prominently in screening family members at risk for developing disease and excluding unaffected relatives, which is information not achievable otherwise. Genetic testing also allows expansion of the broad underlying inherited risk conditions spectrum and precise diagnosis of pathologies with different natural history and treatment options. Interfacing a heterogeneous disease such as CVD with the vast genetic variability of the human genome, and high frequency of novel mutations, has created unforeseen difficulties in translating complex science (and language) into the clinical arena. Indeed, proband diagnostic testing is often expressed on a probabilistic scale, which is frequently incompatible with clinical decision making. Major challenges rest with making reliable distinctions between pathogenic mutations and benign variants, and those judged to be of uncertain significance. Genotyping in CVD risk prediction can be a powerful tool for family screening and diagnosis. However, wider adoption and future success of genetic testing in the practicing cardiovascular community depends on a standardized approach to DNA variability interpretation, and bridging the communication gap between basic scientists and clinicians.

Funding

This work was supported by the (i) Ministry of Health of the Czech Republic under the Conceptual Development of Research Organizations (Institute for Clinical and Experimental Medicine—IKEM, IN 00023001); (J.A.H. and D.D.); (ii) Ministry of Health of the Czech Republic, AZV grants no. NV18-01-00046, 17-28882A, NU-20-06-00061 and NU21-01-00146. All rights reserved; (J.A.H. and D.D.); (iii) by the Ministry of Health, Czech Republic—Conceptual Development of Research Organization 64165, General University Hospital in Prague, Czech Republic; M.V. and V.T.

Institutional Review Board Statement

Not applicable.

Informed Consent Statement

Not applicable.

Data Availability Statement

Not applicable.

Conflicts of Interest

The authors declare no conflict of interest. The funders had no role in the design of the study; in the writing of the manuscript, or in the decision to publish the review.

References

  1. Timmis, A.; Townsend, N.; Gale, C.P.; Torbica, A.; Lettino, M.; Petersen, S.E.; Mossialos, E.A.; Maggioni, A.P.; Kazakiewicz, D.; May, H.T.; et al. European Society of Cardiology: Cardiovascular disease statistics 2019. Eur. Heart J. 2020, 41, 12–85. [Google Scholar] [CrossRef] [PubMed]
  2. Wilkins, E.; Wilson, L.; Wickramasinghe, K.; Bhatnagar, P.; Leal, J.; Luengo-Fernandez, R.; Burns, R.; Rayner, M.; Townsend, N. European Cardiovascular Disease Statistics 2017; European Heart Network: Brussels, Belgium, 2017. [Google Scholar]
  3. Hartley, A.; Marshall, D.C.; Salciccioli, J.D.; Sikkel, M.B.; Maruthappu, M.; Shalhoub, J. Trends in mortality from ischemic heart disease and cerebrovascular disease in Europe: 1980 to 2009. Circulation 2016, 133, 1916–1926. [Google Scholar] [CrossRef] [PubMed] [Green Version]
  4. Gersh, B.J.; Maron, B.J.; Bonow, R.O.; Dearani, J.A.; Fifer, M.A.; Link, M.S.; Naidu, S.S.; Nishimura, R.A.; Ommen, S.R.; Rakowski, H.; et al. 2011 ACCF/AHA guideline for the diagnosis and treatment of hypertrophic cardiomyopathy: A report of the American College of Cardiology Foundation/American Heart Association Task Force on Practice Guidelines. Circulation 2011, 124, e783–e831. [Google Scholar] [CrossRef] [Green Version]
  5. Musunuru, K.; Kathiresan, S. Genetics of common, complex coronary artery disease. Cell 2019, 177, 132–145. [Google Scholar] [CrossRef]
  6. Vrablik, M.; Tichý, L.; Freiberger, T.; Blaha, V.; Satny, M.; Hubacek, J.A. Genetics of familial hypercholesterolemia: New insights. Front. Genet. 2020, 11, 574474. [Google Scholar] [CrossRef]
  7. Mytilinaiou, M.; Kyrou, I.; Khan, M.; Grammatopoulos, D.K.; Randeva, H.S. Familial hypercholesterolemia: New horizons for diagnosis and effective management. Front. Pharmacol. 2018, 9, 707. [Google Scholar] [CrossRef]
  8. Sturm, A.C.; Knowles, J.W.; Gidding, S.S.; Ahmad, Z.S.; Ahmed, C.D.; Ballantyne, C.M.; Baum, S.J.; Bourbon, M.; Carrié, A.; Cuchel, M.; et al. Clinical genetic testing for familial hypercholesterolemia: JACC Scientific Expert Panel. J. Am. Coll. Cardiol. 2018, 72, 662–680. [Google Scholar] [CrossRef] [PubMed]
  9. Sharifi, M.; Futema, M.; Nair, D.; Humphries, S.E. Genetic architecture of familial hypercholesterolaemia. Curr. Cardiol. Rep. 2017, 19, 44. [Google Scholar] [CrossRef]
  10. Brandts, J.; Dharmayat, K.I.; Ray, K.K.; Vallejo-Vaz, A.J. Familial hypercholesterolemia: Is it time to separate monogenic from polygenic familial hypercholesterolemia? Curr. Opin. Lipidol. 2020, 31, 111–118. [Google Scholar] [CrossRef] [PubMed]
  11. Zou, Y.B.; Hui, R.T.; Song, L. The era of clinical application of gene diagnosis in cardiovascular diseases is coming. Chronic Dis. Transl. Med. 2020, 5, 214–220. [Google Scholar] [CrossRef]
  12. Berge, K.E.; Tian, H.; Graf, G.A.; Yu, L.; Grishin, N.V.; Schultz, J.; Kwiterovich, P.; Shan, B.; Barnes, R.; Hobbs, H.H. Accumulation of dietary cholesterol in sitosterolemia caused by mutations in adjacent ABC transporters. Science 2000, 290, 1771–1775. [Google Scholar] [CrossRef] [PubMed] [Green Version]
  13. Lu, K.; Lee, M.H.; Hazard, S.; Brooks-Wilson, A.; Hidaka, H.; Kojima, H.; Ose, L.; Stalenhoef, A.F.; Mietinnen, T.; Bjorkhem, I.; et al. Two genes that map to the STSL locus cause sitosterolemia: Genomic structure and spectrum of mutations involving sterolin-1 and sterolin-2, encoded by ABCG5 and ABCG8, respectively. Am. J. Hum. Genet. 2001, 69, 278–290. [Google Scholar] [CrossRef] [PubMed] [Green Version]
  14. Sakai, L.Y.; Keene, D.R.; Renard, M.; De Backer, J. FBN1: The disease-causing gene for Marfan syndrome and other genetic disorders. Gene 2016, 591, 279–291. [Google Scholar] [CrossRef] [PubMed]
  15. Marais, A.D. Apolipoprotein E in lipoprotein metabolism, health and cardiovascular disease. Pathology 2019, 51, 165–176. [Google Scholar] [CrossRef] [PubMed]
  16. Pennacchio, L.A.; Olivier, M.; Hubacek, J.A.; Cohen, J.C.; Cox, D.R.; Fruchart, J.C.; Krauss, R.M.; Rubin, E.M. An apolipoprotein influencing triglycerides in humans and mice revealed by comparative sequencing. Science 2001, 294, 169–173. [Google Scholar] [CrossRef] [PubMed] [Green Version]
  17. Loos, R.J. The genetic epidemiology of melanocortin 4 receptor variants. Eur. J. Pharmacol. 2011, 660, 156–164. [Google Scholar] [CrossRef] [PubMed]
  18. Gianfagna, F.; Cugino, D.; Santimone, I.; Iacoviello, L. From candidate gene to genome-wide association studies in cardiovascular disease. Thromb. Res. 2012, 129, 320–324. [Google Scholar] [CrossRef]
  19. Uitterlinden, A.G. An introduction to genome-wide association studies: GWAS for dummies. Semin. Reprod. Med. 2016, 34, 196–204. [Google Scholar] [CrossRef]
  20. Larson, M.G.; Atwood, L.D.; Benjamin, E.J.; Cupples, L.A.; D’Agostino, R.B., Sr.; Fox, C.S.; Govindaraju, D.R.; Guo, C.Y.; Heard-Costa, N.L.; Hwang, S.J.; et al. Framingham Heart Study 100K project: Genome-wide associations for cardiovascular disease outcomes. BMC Med. Genet. 2007, 8 (Suppl. 1), S5. [Google Scholar] [CrossRef]
  21. Samani, N.J.; Erdmann, J.; Hall, A.S.; Hengstenberg, C.; Mangino, M.; Mayer, B.; Dixon, R.J.; Meitinger, T.; Braund, P.; Wichmann, H.E.; et al. Genomewide association analysis of coronary artery disease. N. Engl. J. Med. 2007, 357, 443–453. [Google Scholar] [CrossRef] [Green Version]
  22. Scott, L.J.; Mohlke, K.L.; Bonnycastle, L.L.; Willer, C.J.; Li, Y.; Duren, W.L.; Erdos, M.R.; Stringham, H.M.; Chines, P.S.; Jackson, A.U.; et al. A genome-wide association study of type 2 diabetes in Finns detects multiple susceptibility variants. Science 2007, 316, 1341–1345. [Google Scholar] [CrossRef] [PubMed] [Green Version]
  23. Erdmann, J.; Kessler, T.; Munoz Venegas, L.; Schunkert, H. A decade of genome-wide association studies for coronary artery disease: The challenges ahead. Cardiovasc. Res. 2018, 114, 1241–1257. [Google Scholar] [CrossRef] [PubMed]
  24. Palomaki, G.E.; Melillo, S.; Bradley, L.A. Association between 9p21 genomic markers and heart disease: A meta-analysis. JAMA 2010, 303, 648–656. [Google Scholar] [CrossRef] [PubMed] [Green Version]
  25. Li, W.Q.; Pfeiffer, R.M.; Hyland, P.L.; Shi, J.; Gu, F.; Wang, Z.; Bhattacharjee, S.; Luo, J.; Xiong, X.; Yeager, M.; et al. Genetic polymorphisms in the 9p21 region associated with risk of multiple cancers. Carcinogenesis 2014, 35, 2698–2705. [Google Scholar] [CrossRef] [PubMed] [Green Version]
  26. Wiggs, J.L.; Yaspan, B.L.; Hauser, M.A.; Kang, J.H.; Allingham, R.R.; Olson, L.M.; Abdrabou, W.; Fan, B.J.; Wang, D.Y.; Brodeur, W.; et al. Common variants at 9p21 and 8q22 are associated with increased susceptibility to optic nerve degeneration in glaucoma. PLoS Genet. 2012, 8, e1002654. [Google Scholar] [CrossRef] [Green Version]
  27. Safa, A.; Noroozi, R.; Taheri, M.; Ghafouri-Fard, S. Association analysis of ANRIL polymorphisms and haplotypes with autism spectrum disorders. J. Mol. Neurosci. 2021, 71, 187–192. [Google Scholar] [CrossRef]
  28. Teslovich, T.M.; Musunuru, K.; Smith, A.V.; Edmondson, A.C.; Stylianou, I.M.; Koseki, M.; Pirruccello, J.P.; Ripatti, S.; Chasman, D.I.; Willer, C.J.; et al. Biological, clinical and population relevance of 95 loci for blood lipids. Nature 2010, 466, 707–713. [Google Scholar] [CrossRef]
  29. Strong, A.; Rader, D.J. Sortilin as a regulator of lipoprotein metabolism. Curr. Atheroscler. Rep. 2012, 14, 211–218. [Google Scholar] [CrossRef]
  30. Zhong, L.Y.; Cayabyab, F.S.; Tang, C.K.; Zheng, X.L.; Peng, T.H.; Lv, Y.C. Sortilin: A novel regulator in lipid metabolism and atherogenesis. Clin. Chim. Acta 2016, 460, 11–17. [Google Scholar] [CrossRef]
  31. Musunuru, K.; Strong, A.; Frank-Kamenetsky, M.; Lee, N.E.; Ahfeldt, T.; Sachs, K.V.; Li, X.; Li, H.; Kuperwasser, N.; Ruda, V.M.; et al. From noncoding variant to phenotype via SORT1 at the 1p13 cholesterol locus. Nature 2010, 466, 714–719. [Google Scholar] [CrossRef]
  32. Kjolby, M.; Andersen, O.M.; Breiderhoff, T.; Fjorback, A.W.; Pedersen, K.M.; Madsen, P.; Jansen, P.; Heeren, J.; Willnow, T.E.; Nykjaer, A. Sort1, encoded by the cardiovascular risk locus 1p13.3, is a regulator of hepatic lipoprotein export. Cell Metab. 2010, 12, 213–223. [Google Scholar] [CrossRef] [PubMed] [Green Version]
  33. Tveten, K.; Strøm, T.B.; Cameron, J.; Berge, K.E.; Leren, T.P. Mutations in the SORT1 gene are unlikely to cause autosomal dominant hypercholesterolemia. Atherosclerosis 2012, 225, 370–375. [Google Scholar] [CrossRef] [PubMed]
  34. Dina, C.; Meyre, D.; Gallina, S.; Durand, E.; Körner, A.; Jacobson, P.; Carlsson, L.M.; Kiess, W.; Vatin, V.; Lecoeur, C.; et al. Variation in FTO contributes to childhood obesity and severe adult obesity. Nat. Genet. 2007, 39, 724–726. [Google Scholar] [CrossRef] [PubMed]
  35. Frayling, T.M.; Timpson, N.J.; Weedon, M.N.; Zeggini, E.; Freathy, R.M.; Lindgren, C.M.; Perry, J.R.; Elliott, K.S.; Lango, H.; Rayner, N.W.; et al. A common variant in the FTO gene is associated with body mass index and predisposes to childhood and adult obesity. Science 2007, 316, 889–894. [Google Scholar] [CrossRef] [Green Version]
  36. Diabetes Genetics Initiative of Broad Institute of Harvard and MIT; Lund University; Novartis Institutes of BioMedical Research; Saxena, R.; Voight, B.F.; Lyssenko, V.; Burtt, N.P.; de Bakker, P.I.; Chen, H.; Roix, J.J.; et al. Genome-wide association analysis identifies loci for type 2 diabetes and triglyceride levels. Science 2007, 316, 1331–1336. [Google Scholar] [PubMed]
  37. Loos, R.J.; Yeo, G.S. The bigger picture of FTO: The first GWAS-identified obesity gene. Nat. Rev. Endocrinol. 2014, 10, 51–61. [Google Scholar] [CrossRef]
  38. Hubacek, J.A.; Stanek, V.; Gebauerová, M.; Pilipcincová, A.; Dlouhá, D.; Poledne, R.; Aschermann, M.; Skalická, H.; Matousková, J.; Kruger, A.; et al. A FTO variant and risk of acute coronary syndrome. Clin. Chim. Acta 2010, 411, 1069–1072. [Google Scholar] [CrossRef]
  39. Doney, A.S.; Dannfald, J.; Kimber, C.H.; Donnelly, L.A.; Pearson, E.; Morris, A.D.; Palmer, C.N. The FTO gene is associated with an atherogenic lipid profile and myocardial infarction in patients with type 2 diabetes: A Genetics of Diabetes Audit and Research Study in Tayside Scotland (Go-DARTS) study. Circ. Cardiovasc Genet. 2009, 2, 255–259. [Google Scholar] [CrossRef] [Green Version]
  40. Hubacek, J.A.; Viklicky, O.; Dlouha, D.; Bloudickova, S.; Kubinova, R.; Peasey, A.; Pikhart, H.; Adamkova, V.; Brabcova, I.; Pokorna, E.; et al. The FTO gene polymorphism is associated with end-stage renal disease: Two large independent case-control studies in a general population. Nephrol. Dial. Transplant. 2012, 27, 1030–1035. [Google Scholar] [CrossRef] [Green Version]
  41. Reitz, C.; Tosto, G.; Mayeux, R.; Luchsinger, J.A.; NIA-LOAD/NCRAD Family Study Group; Alzheimer’s Disease Neuroimaging Initiative. Genetic variants in the Fat and Obesity Associated (FTO) gene and risk of Alzheimer’s disease. PLoS ONE 2012, 7, e50354. [Google Scholar] [CrossRef]
  42. Hubacek, J.A.; Dlouha, D.; Klementova, M.; Lanska, V.; Neskudla, T.; Pelikanova, T. The FTO variant is associated with chronic complications of diabetes mellitus in Czech population. Gene 2018, 642, 220–224. [Google Scholar] [CrossRef] [PubMed]
  43. Zimmermann, E.; Kring, S.I.; Berentzen, T.L.; Holst, C.; Pers, T.H.; Hansen, T.; Pedersen, O.; Sørensen, T.I.; Jess, T. Fatness-associated FTO gene variant increases mortality independent of fatness—In cohorts of Danish men. PLoS ONE 2009, 4, e4428. [Google Scholar] [CrossRef] [PubMed] [Green Version]
  44. Tung, Y.C.L.; Yeo, G.S.H.; O’Rahilly, S.; Coll, A.P. Obesity and FTO: Changing focus at a complex locus. Cell Metab. 2014, 20, 710–718. [Google Scholar] [CrossRef] [PubMed] [Green Version]
  45. Gerken, T.; Girard, C.A.; Tung, Y.C.; Webby, C.J.; Saudek, V.; Hewitson, K.S.; Yeo, G.S.; McDonough, M.A.; Cunliffe, S.; McNeill, L.A.; et al. The obesity-associated FTO gene encodes a 2-oxoglutarate-dependent nucleic acid demethylase. Science 2007, 318, 1469–1472. [Google Scholar] [CrossRef] [PubMed] [Green Version]
  46. Dlouha, D.; Pitha, J.; Lanska, V.; Hubacek, J.A. Association between FTO 1st intron tagging variant and telomere length in middle aged females. 3PMFs study. Clin. Chim. Acta 2012, 413, 1222–1225. [Google Scholar] [CrossRef] [PubMed]
  47. Zhou, Y.; Hambly, B.D.; McLachlan, C.S. FTO associations with obesity and telomere length. J. Biomed. Sci. 2017, 24, 65. [Google Scholar] [CrossRef] [Green Version]
  48. Wu, Q.; Saunders, R.A.; Szkudlarek-Mikho, M.; Serna Ide, L.; Chin, K.V. The obesity-associated Fto gene is a transcriptional coactivator. Biochem. Biophys. Res. Commun. 2010, 401, 390–395. [Google Scholar] [CrossRef] [Green Version]
  49. Nadkarni, G.N.; Gignoux, C.R.; Sorokin, E.P.; Daya, M.; Rahman, R.; Barnes, K.C.; Wassel, C.L.; Kenny, E.E. Worldwide frequencies of APOL1 renal risk variants. N. Engl. J. Med. 2018, 379, 2571–2572. [Google Scholar] [CrossRef]
  50. Grant, S.F.A. The TCF7L2 locus: A genetic window into the pathogenesis of type 1 and type 2 diabetes. Diabetes Care 2019, 42, 1624–1629. [Google Scholar] [CrossRef] [Green Version]
  51. Xi, B.; Chandak, G.R.; Shen, Y.; Wang, Q.; Zhou, D. Association between common polymorphism near the MC4R gene and obesity risk: A systematic review and meta-analysis. PLoS ONE 2012, 7, e45731. [Google Scholar] [CrossRef] [PubMed]
  52. Saccone, N.L.; Saccone, S.F.; Hinrichs, A.L.; Stitzel, J.A.; Duan, W.; Pergadia, M.L.; Agrawal, A.; Breslau, N.; Grucza, R.A.; Hatsukami, D.; et al. Multiple distinct risk loci for nicotine dependence identified by dense coverage of the complete family of nicotinic receptor subunit (CHRN) genes. Am. J. Med. Genet. B Neuropsychiatr. Genet. 2009, 150, 453–466. [Google Scholar] [CrossRef] [Green Version]
  53. Lip, S.; Padmanabhan, S. Genomics of blood pressure and hypertension: Extending the mosaic theory toward stratification. Can. J. Cardiol. 2020, 36, 694–705. [Google Scholar] [CrossRef]
  54. Lambert, S.A.; Abraham, G.; Inouye, M. Towards clinical utility of polygenic risk scores. Hum. Mol. Genet. 2019, 28, R133–R142. [Google Scholar] [CrossRef]
  55. Rao, A.S.; Knowles, J.W. Polygenic risk scores in coronary artery disease. Curr. Opin. Cardiol. 2019, 34, 435–440. [Google Scholar] [CrossRef]
  56. Igo, R.P., Jr.; Kinzy, T.G.; Cooke Bailey, J.N. Genetic risk scores. Curr. Protoc. Hum. Genet. 2019, 104, e95. [Google Scholar] [CrossRef] [PubMed]
  57. Kooner, J.S.; Chambers, J.C.; Aguilar-Salinas, C.A.; Hinds, D.A.; Hyde, C.L.; Warnes, G.R.; Gómez Pérez, F.J.; Frazer, K.A.; Elliott, P.; Scott, J.; et al. Genome-wide scan identifies variation in MLXIPL associated with plasma triglycerides. Nat. Genet. 2008, 40, 149–151. [Google Scholar] [CrossRef] [PubMed]
  58. Vrablik, M.; Ceska, R.; Adamkova, V.; Peasey, A.; Pikhart, H.; Kubinova, R.; Marmot, M.; Bobak, M.; Hubacek, J.A. MLXIPL variant in individuals with low and high triglyceridemia in white population in Central Europe. Hum. Genet. 2008, 124, 553–555. [Google Scholar] [CrossRef]
  59. Rašlová, K.; Dobiášová, M.; Hubáček, J.A.; Bencová, D.; Siváková, D.; Danková, Z.; Franeková, J.; Jabor, A.; Gašparovič, J.; Vohnout, B. Association of metabolic and genetic factors with cholesterol esterification rate in HDL plasma and atherogenic index of plasma in a 40 years old Slovak population. Physiol. Res. 2011, 60, 785–795. [Google Scholar] [CrossRef] [PubMed]
  60. Tada, H.; Kawashiri, M.A.; Nomura, A.; Teramoto, R.; Hosomichi, K.; Nohara, A.; Inazu, A.; Mabuchi, H.; Tajima, A.; Yamagishi, M. Oligogenic familial hypercholesterolemia, LDL cholesterol, and coronary artery disease. J. Clin. Lipidol. 2018, 12, 1436–1444. [Google Scholar] [CrossRef]
  61. Poledne, R.; Hubácek, J.; Písa, Z.; Pistulková, H.; Valenta, Z. Genetic markers in hypercholesterolemic and normocholesterolemic Czech children. Clin. Genet. 1994, 46, 88–91. [Google Scholar] [CrossRef]
  62. Pedersen, J.C.; Berg, K. Gene-gene interaction between the low density lipoprotein receptor and apolipoprotein E loci affects lipid levels. Clin. Genet. 1990, 38, 287–294. [Google Scholar] [PubMed]
  63. Shabana; Shahid, S.U.; Hasnain, S. Use of a gene score of multiple low-modest effect size variants can predict the risk of obesity better than the individual SNPs. Lipids Health Dis. 2018, 17, 155. [Google Scholar] [CrossRef] [Green Version]
  64. Hubacek, J.A.; Dlouha, D.; Adamkova, V.; Schwarzova, L.; Lanska, V.; Ceska, R.; Satny, M.; Vrablik, M. The gene score for predicting hypertriglyceridemia: New insights from a Czech case-control study. Mol. Diagn. Ther. 2019, 23, 555–562. [Google Scholar] [CrossRef] [PubMed]
  65. Johansen, C.T.; Wang, J.; Lanktree, M.B.; McIntyre, A.D.; Ban, M.R.; Martins, R.A.; Kennedy, B.A.; Hassell, R.G.; Visser, M.E.; Schwartz, S.M.; et al. An increased burden of common and rare lipid-associated risk alleles contributes to the phenotypic spectrum of hypertriglyceridemia. Arterioscler. Thromb. Vasc. Biol. 2011, 31, 1916–1926. [Google Scholar] [CrossRef] [PubMed] [Green Version]
  66. El Rouby, N.; McDonough, C.W.; Gong, Y.; McClure, L.A.; Mitchell, B.D.; Horenstein, R.B.; Talbert, R.L.; Crawford, D.C.; eMERGE Network; Gitzendanner, M.A.; et al. Genome-wide association analysis of common genetic variants of resistant hypertension. Pharmacogenom. J. 2019, 19, 295–304. [Google Scholar] [CrossRef] [PubMed]
  67. Talmud, P.J.; Cooper, J.A.; Morris, R.W.; Dudbridge, F.; Shah, T.; Engmann, J.; Dale, C.; White, J.; McLachlan, S.; Zabaneh, D.; et al. Sixty-five common genetic variants and prediction of type 2 diabetes. Diabetes 2015, 64, 1830–1840. [Google Scholar] [CrossRef] [Green Version]
  68. Läll, K.; Mägi, R.; Morris, A.; Metspalu, A.; Fischer, K. Personalized risk prediction for type 2 diabetes: The potential of genetic risk scores. Genet. Med. 2017, 19, 322–329. [Google Scholar] [CrossRef] [Green Version]
  69. Morris, R.W.; Cooper, J.A.; Shah, T.; Wong, A.; Drenos, F.; Engmann, J.; McLachlan, S.; Jefferis, B.; Dale, C.; Hardy, R.; et al. Marginal role for 53 common genetic variants in cardiovascular disease prediction. Heart 2016, 102, 1640–1647. [Google Scholar] [CrossRef] [PubMed] [Green Version]
  70. Trinder, M.; Li, X.; DeCastro, M.L.; Cermakova, L.; Sadananda, S.; Jackson, L.M.; Azizi, H.; Mancini, G.B.J.; Francis, G.A.; Frohlich, J.; et al. Risk of premature atherosclerotic disease in patients with monogenic versus polygenic familial hypercholesterolemia. J. Am. Coll. Cardiol. 2019, 74, 512–522. [Google Scholar] [CrossRef]
  71. Khera, A.V.; Chaffin, M.; Zekavat, S.M.; Collins, R.L.; Roselli, C.; Natarajan, P.; Lichtman, J.H.; D’Onofrio, G.; Matera, J.; Dreyer, R.; et al. Whole-genome sequencing to characterize monogenic and polygenic contributions in patients hospitalized with early-onset myocardial infarction. Circulation 2019, 139, 1593–1602. [Google Scholar] [CrossRef] [Green Version]
  72. GBD 2015 Risk Factors Collaborators. Global, regional, and national comparative risk assessment of 79 behavioural, environmental and occupational, and metabolic risks or clusters of risks, 1990–2015: A systematic analysis for the Global Burden of Disease Study 2015. Lancet 2016, 388, 1659–1724. [Google Scholar] [CrossRef] [Green Version]
  73. Hubacek, J.A.; Bobkova, D. Role of cholesterol 7alpha-hydroxylase (CYP7A1) in nutrigenetics and pharmacogenetics of cholesterol lowering. Mol. Diagn. Ther. 2006, 10, 93–100. [Google Scholar] [CrossRef] [PubMed]
  74. Hubacek, J.A.; Pitha, J.; Skodová, Z.; Poledne, R.; Lánská, V.; Waterworth, D.M.; Humphries, S.E.; Talmud, P.J. Czech MONICA Study. Polymorphisms in CYP-7A1, not APOE, influence the change in plasma lipids in response to population dietary change in an 8 year follow-up; results from the Czech MONICA study. Clin. Biochem. 2003, 36, 263–267. [Google Scholar] [CrossRef]
  75. Kovár, J.; Suchánek, P.; Hubácek, J.A.; Poledne, R. The A-204C polymorphism in the cholesterol 7alpha-hydroxylase (CYP7A1) gene determines the cholesterolemia responsiveness to a high-fat diet. Physiol. Res. 2004, 53, 565–568. [Google Scholar] [PubMed]
  76. MacKay, D.S.; Eck, P.K.; Gebauer, S.K.; Baer, D.J.; Jones, P.J. CYP7A1-rs3808607 and APOE isoform associate with LDL cholesterol lowering after plant sterol consumption in a randomized clinical trial. Am. J. Clin. Nutr. 2015, 102, 951–957. [Google Scholar] [CrossRef] [Green Version]
  77. Hofman, M.K.; Weggemans, R.M.; Zock, P.L.; Schouten, E.G.; Katan, M.B.; Princen, H.M. CYP7A1 A-278C polymorphism affects the response of plasma lipids after dietary cholesterol or cafestol interventions in humans. J. Nutr. 2004, 134, 2200–2204. [Google Scholar] [CrossRef] [Green Version]
  78. Merritt, D.C.; Jamnik, J.; El-Sohemy, A. FTO genotype, dietary protein intake, and body weight in a multiethnic population of young adults: A cross-sectional study. Genes Nutr. 2018, 13, 4. [Google Scholar] [CrossRef]
  79. Qi, Q.; Downer, M.K.; Kilpeläinen, T.O.; Taal, H.R.; Barton, S.J.; Ntalla, I.; Standl, M.; Boraska, V.; Huikari, V.; Kiefte-de Jong, J.C.; et al. Dietary intake, FTO genetic variants, and adiposity: A combined analysis of over 16,000 children and adolescents. Diabetes 2015, 64, 2467–2476. [Google Scholar] [CrossRef] [Green Version]
  80. Kim, J. Are genes destiny? Exploring the role of intrauterine environment in moderating genetic influences on body mass. Am. J. Hum. Biol. 2020, 32, e23354. [Google Scholar] [CrossRef]
  81. Holmes, M.V.; Newcombe, P.; Hubacek, J.A.; Sofat, R.; Ricketts, S.L.; Cooper, J.; Breteler, M.M.; Bautista, L.E.; Sharma, P.; Whittaker, J.C.; et al. Effect modification by population dietary folate on the association between MTHFR genotype, homocysteine, and stroke risk: A meta-analysis of genetic studies and randomised trials. Lancet 2011, 378, 584–594. [Google Scholar] [CrossRef] [Green Version]
  82. Zheng, Y.; Li, Y.; Huang, T.; Cheng, H.L.; Campos, H.; Qi, L. Sugar-sweetened beverage intake, chromosome 9p21 variants, and risk of myocardial infarction in Hispanics. Am. J. Clin. Nutr. 2016, 103, 1179–1184. [Google Scholar] [CrossRef] [PubMed] [Green Version]
  83. Peña-Romero, A.C.; Navas-Carrillo, D.; Marín, F.; Orenes-Piñero, E. The future of nutrition: Nutrigenomics and nutrigenetics in obesity and cardiovascular diseases. Crit. Rev. Food Sci. Nutr. 2018, 58, 3030–3041. [Google Scholar] [CrossRef] [PubMed]
  84. Barrea, L.; Annunziata, G.; Bordoni, L.; Muscogiuri, G.; Colao, A.; Savastano, S.; Obesity Programs of Nutrition, Education, Research and Assessment (OPERA) Group. Nutrigenetics-personalized nutrition in obesity and cardiovascular diseases. Int. J. Obes. Suppl. 2020, 10, 1–13. [Google Scholar] [CrossRef] [PubMed]
  85. Mullins, V.A.; Bresette, W.; Johnstone, L.; Hallmark, B.; Chilton, F.H. Genomics in personalized nutrition: Can you “Eat for your genes”? Nutrients 2020, 12, 3118. [Google Scholar] [CrossRef]
  86. Hubacek, J.A.; Pikhart, H.; Peasey, A.; Malyutina, S.; Pajak, A.; Tamosiunas, A.; Voevoda, M.; Holmes, M.V.; Bobak, M. The association between the FTO gene variant and alcohol consumption and binge and problem drinking in different gene-environment background: The HAPIEE study. Gene 2019, 707, 30–35. [Google Scholar] [CrossRef]
  87. Johnson, J.A.; Cavallari, L.H. Pharmacogenetics and cardiovascular disease—Implications for personalized medicine. Pharmacol. Rev. 2013, 65, 987–1009. [Google Scholar] [CrossRef] [Green Version]
  88. Rodríguez Vicente, A.E.; Herrero Cervera, M.J.; Bernal, M.L.; Rojas, L.; Peiró, A.M. Personalized medicine into health national services: Barriers and potentialities. Drug Metab. Pers. Ther. 2018, 33, 159–163. [Google Scholar] [CrossRef]
  89. Vrablik, M.; Zlatohlavek, L.; Stulc, T.; Adamkova, V.; Prusikova, M.; Schwarzova, L.; Hubacek, J.A.; Ceska, R. Statin-associated myopathy: From genetic predisposition to clinical management. Physiol. Res. 2014, 63 (Suppl. 3), S327–S334. [Google Scholar] [CrossRef]
  90. Canestaro, W.J.; Austin, M.A.; Thummel, K.E. Genetic factors affecting statin concentrations and subsequent myopathy: A HuGENet systematic review. Genet. Med. 2014, 16, 810–819. [Google Scholar] [CrossRef] [Green Version]
  91. Neřoldová, M.; Stránecký, V.; Hodaňová, K.; Hartmannová, H.; Piherová, L.; Přistoupilová, A.; Mrázová, L.; Vrablík, M.; Adámková, V.; Hubáček, J.A.; et al. Rare variants in known and novel candidate genes predisposing to statin-associated myopathy. Pharmacogenomics 2016, 17, 1405–1414. [Google Scholar] [CrossRef]
  92. SEARCH Collaborative Group; Link, E.; Parish, S.; Armitage, J.; Bowman, L.; Heath, S.; Matsuda, F.; Gut, I.; Lathrop, M.; Collins, R. SLCO1B1 variants and statin-induced myopathy—A genomewide study. N. Engl. J. Med. 2008, 359, 789–799. [Google Scholar]
  93. Voora, D.; Shah, S.H.; Spasojevic, I.; Ali, S.; Reed, C.R.; Salisbury, B.A.; Ginsburg, G.S. The SLCO1B1*5 genetic variant is associated with statin-induced side effects. J. Am. Coll. Cardiol. 2009, 54, 1609–1616. [Google Scholar] [CrossRef] [PubMed] [Green Version]
  94. Brunham, L.R.; Lansberg, P.J.; Zhang, L.; Miao, F.; Carter, C.; Hovingh, G.K.; Visscher, H.; Jukema, J.W.; Stalenhoef, A.F.; Ross, C.J.; et al. Differential effect of the rs4149056 variant in SLCO1B1 on myopathy associated with simvastatin and atorvastatin. Pharmacogenom. J. 2012, 12, 233–237. [Google Scholar] [CrossRef] [Green Version]
  95. Hubáček, J.A.; Dlouhá, D.; Adámková, V.; Zlatohlavek, L.; Viklický, O.; Hrubá, P.; Češka, R.; Vrablík, M. SLCO1B1 polymorphism is not associated with risk of statin-induced myalgia/myopathy in a Czech population. Med. Sci. Monit. 2015, 21, 1454–1459. [Google Scholar] [PubMed] [Green Version]
  96. Swen, J.; Nijenhuis, M.; de Boer, A.; Grandia, L.; Maitland-van der Zee, A.; Mulder, H.; Rongen, G.; van Schaik, R.; Schalekamp, T.; Touw, D.; et al. Pharmacogenetics: From bench to byte—An update of guidelines. Clin. Pharmacol. Ther. 2011, 89, 662–673. [Google Scholar] [CrossRef] [PubMed]
  97. Abi Khalil, C. The emerging role of epigenetics in cardiovascular disease. Ther. Adv. Chronic. Dis. 2014, 5, 178–187. [Google Scholar] [CrossRef] [PubMed] [Green Version]
  98. Xu, Y.; Fang, F. Histone methylation and transcriptional regulation in cardiovascular disease. Cardiovasc Hematol. Disord. Drug Targets 2014, 14, 89–97. [Google Scholar] [CrossRef]
  99. Kaikkonen, M.U.; Lam, M.T.; Glass, C.K. Non-coding RNAs as regulators of gene expression and epigenetics. Cardiovasc Res. 2011, 90, 430–440. [Google Scholar] [CrossRef] [Green Version]
  100. Obsteter, J.; Dovc, P.; Kunej, T. Genetic variability of microRNA regulome in human. Mol. Genet. Genomic Med. 2015, 3, 30–39. [Google Scholar] [CrossRef]
  101. Dlouhá, D.; Hubáček, J.A. Regulatory RNAs and cardiovascular disease—With a special focus on circulating microRNAs. Physiol. Res. 2017, 66 (Suppl. 1), S21–S38. [Google Scholar] [CrossRef]
  102. Wang, Z.; Luo, X.; Lu, Y.; Yang, B. MiRNAs at the heart of the matter. J. Mol. Med. 2008, 86, 771–783. [Google Scholar] [CrossRef] [Green Version]
  103. Laffont, B.; Rayner, K.J. Micrornas in the pathobiology and therapy of atherosclerosis. Can. J. Cardiol. 2017, 33, 313–324. [Google Scholar] [CrossRef] [PubMed] [Green Version]
  104. De Gonzalo-Calvo, D.; Iglesias-Gutiérrez, E.; Llorente-Cortés, V. Epigenetic biomarkers and cardiovascular disease: Circulating microRnas. Rev. Esp. Cardiol. 2017, 70, 763–769. [Google Scholar] [CrossRef] [PubMed]
  105. Sun, T.; Dong, Y.H.; Du, W.; Shi, C.Y.; Wang, K.; Tariq, M.A.; Wang, J.X.; Li, P.F. The role of microRnas in myocardial infarction: From molecular mechanism to clinical application. Int. J. Mol. Sci. 2017, 18, 745. [Google Scholar] [CrossRef] [PubMed] [Green Version]
  106. Economou, E.K.; Oikonomou, E.; Siasos, G.; Papageorgiou, N.; Tsalamandris, S.; Mourouzis, K.; Papaioanou, S.; Tousoulis, D. The role of micrornas in coronary artery disease: From pathophysiology to diagnosis and treatment. Atherosclerosis 2015, 241, 624–633. [Google Scholar] [CrossRef] [PubMed]
  107. Deng, S.; Wang, H.; Jia, C.; Zhu, S.; Chu, X.; Ma, Q.; Wei, J.; Chen, E.; Zhu, W.; Macon, C.J.; et al. MicroRna-146a induces lineage-negative bone marrow cell apoptosis and senescence by targeting polo-like kinase 2 expression. Arterioscler. Thromb. Vasc. Biol. 2017, 37, 280–290. [Google Scholar] [CrossRef] [PubMed] [Green Version]
  108. Menghini, R.; Casagrande, V.; Cardellini, M.; Martelli, E.; Terrinoni, A.; Amati, F.; Vasa-Nicotera, M.; Ippoliti, A.; Novelli, G.; Melino, G.; et al. MicroRna 217 modulates endothelial cell senescence via silent information regulator 1. Circulation 2009, 120, 1524–1532. [Google Scholar] [CrossRef] [PubMed] [Green Version]
  109. Suarez, Y.; Wang, C.; Manes, T.D.; Pober, J.S. Cutting edge: TNF-induced microRNAs regulate TNF-induced expression of e-selectin and intercellular adhesion molecule-1 on human endothelial cells: Feedback control of inflammation. J. Immunol. 2010, 184, 21–25. [Google Scholar] [CrossRef] [Green Version]
  110. Asgeirsdottir, S.A.; Van Solingen, C.; Murniati, N.F.; Zwiers, P.J.; Heeringa, P.; Van Meurs, M.; Satchell, S.C.; Saleem, M.A.; Mathieson, P.W.; Banas, B.; et al. MicroRna-126 contributes to renal macrovascular heterogeneity of vcam-1 protein expression in acute inflammation. Am. J. Physiol. Renal. Physiol. 2012, 302, F1630–F1639. [Google Scholar] [CrossRef] [PubMed] [Green Version]
  111. Kumar, S.; Williams, D.; Sur, S.; Wang, J.Y.; Jo, H. Role of flow-sensitive microRNAs and long noncoding RNAs in vascular dysfunction and atherosclerosis. Vascul. Pharmacol. 2019, 114, 76–92. [Google Scholar] [CrossRef]
  112. Zampetaki, A.; Dudek, K.; Mayr, M. Oxidative Stress in Atherosclerosis: The role of microRnas in arterial remodeling. Free Radic. Biol. Med. 2013, 64, 69–77. [Google Scholar] [CrossRef] [Green Version]
  113. Lu, Y.; Thavarajah, T.; Gu, W.; Cai, J.; Xu, Q. Impact of miRna in atherosclerosis. Arterioscler. Thromb. Vasc. Biol. 2018, 38, E159–E170. [Google Scholar] [CrossRef] [Green Version]
  114. Huang, R.S.; Hu, G.Q.; Lin, B.; Lin, Z.Y.; Sun, C.C. MicroRNA-155 silencing enhances inflammatory response and lipid uptake in oxidized low-density lipoprotein-stimulated human THP-1 macrophages. J. Investig. Med. 2010, 58, 961–967. [Google Scholar] [CrossRef] [PubMed]
  115. Chen, T.; Huang, Z.; Wang, L.; Wang, Y.; Wu, F.; Meng, S.; Wang, C. MicroRNA-125a-5p partly regulates the inflammatory response, lipid uptake, and ORP9 expression in oxLDL-stimulated monocyte/macrophages. Cardiovasc. Res. 2009, 83, 131–139. [Google Scholar] [CrossRef] [PubMed] [Green Version]
  116. Fernández-Hernando, C.; Suárez, Y.; Rayner, K.J.; Moore, K.J. MicroRnas in lipid metabolism. Curr. Opin. Lipidol. 2011, 22, 86–92. [Google Scholar] [CrossRef] [PubMed]
  117. Rotllan, N.; Price, N.; Pati, P.; Goedeke, L.; Fernández-Hernando, C. MicroRNAs in lipoprotein metabolism and cardiometabolic disorders. Atherosclerosis 2016, 246, 352–360. [Google Scholar] [CrossRef] [Green Version]
  118. Dlouha, D.; Blaha, M.; Blaha, V.; Fatorova, I.; Hubacek, J.A.; Stavek, P.; Lanska, V.; Parikova, A.; Pitha, J. Analysis of circulating miRNAs in patients with familial hypercholesterolaemia treated by LDL/Lp(a) apheresis. Atheroscler. Suppl. 2017, 30, 128–134. [Google Scholar] [CrossRef]
  119. Zampetaki, A.; Willeit, P.; Drozdov, I.; Kiechl, S.; Mayr, M. Profiling of circulating microRNAs: From single biomarkers to re-wired networks. Cardiovasc Res. 2012, 93, 555–562. [Google Scholar] [CrossRef] [Green Version]
  120. Prasher, D.; Greenway, S.C.; Singh, R.B. The impact of epigenetics on cardiovascular disease. Biochem. Cell. Biol. 2020, 98, 12–22. [Google Scholar] [CrossRef]
  121. Wilson, A.G. Epigenetic regulation of gene expression in the inflammatory response and relevance to common diseases. J. Periodontol. 2008, 79, 1514–1519. [Google Scholar] [CrossRef] [Green Version]
  122. Sae-Lee, C.; Corsi, S.; Barrow, T.M.; Kuhnle, G.G.C.; Bollati, V.; Mathers, J.C.; Byun, H.M. Dietary intervention modifies DNA methylation age assessed by the epigenetic clock. Mol. Nutr. Food Res. 2018, 62, e1800092. [Google Scholar] [CrossRef] [PubMed] [Green Version]
  123. Agha, G.; Mendelson, M.M.; Ward-Caviness, C.K.; Joehanes, R.; Huan, T.; Gondalia, R.; Salfati, E.; Brody, J.A.; Fiorito, G.; Bressler, J.; et al. Blood leukocyte DNA methylation predicts risk of future myocardial infarction and coronary heart disease. Circulation 2019, 140, 645–657. [Google Scholar] [CrossRef] [PubMed]
  124. Talens, R.P.; Jukema, J.W.; Trompet, S.; Kremer, D.; Westendorp, R.G.; Lumey, L.H.; Sattar, N.; Putter, H.; Slagboom, P.E.; Heijmans, B.T.; et al. Hypermethylation at loci sensitive to the prenatal environment is associated with increased incidence of myocardial infarction. Int. J. Epidemiol. 2012, 41, 106–115. [Google Scholar] [CrossRef] [PubMed]
  125. Pfeiffer, L.; Wahl, S.; Pilling, L.C.; Reischl, E.; Sandling, J.K.; Kunze, S.; Holdt, L.M.; Kretschmer, A.; Schramm, K.; Adamski, J.; et al. DNA methylation of lipid-related genes affects blood lipid levels. Circ. Cardiovasc. Genet. 2015, 8, 334–342. [Google Scholar] [CrossRef] [PubMed]
  126. López-Otín, C.; Blasco, M.A.; Partridge, L.; Serrano, M.; Kroemer, G. The hallmarks of aging. Cell 2013, 153, 1194–1217. [Google Scholar] [CrossRef] [Green Version]
  127. Pusceddu, I.; Kleber, M.; Delgado, G.; Herrmann, W.; März, W.; Herrmann, M. Telomere length and mortality in the Ludwigshafen Risk and Cardiovascular Health study. PLoS ONE 2018, 13, e0198373. [Google Scholar] [CrossRef] [Green Version]
  128. Arbeev, K.G.; Verhulst, S.; Steenstrup, T.; Kark, J.D.; Bagley, O.; Kooperberg, C.; Reiner, A.P.; Hwang, S.J.; Levy, D.; Fitzpatrick, A.L.; et al. Association of leukocyte telomere length with mortality among adult participants in 3 longitudinal studies. JAMA Netw. Open 2020, 3, e200023. [Google Scholar] [CrossRef] [Green Version]
  129. Mundstock, E.; Sarria, E.E.; Zatti, H.; Mattos Louzada, F.; Kich Grun, L.; Herbert Jones, M.; Guma, F.T.; Mazzola, I.M.J.; Epifanio, M.; Stein, R.T.; et al. Effect of obesity on telomere length: Systematic review and meta-analysis. Obesity 2015, 23, 2165–2174. [Google Scholar] [CrossRef]
  130. Tellechea, M.L.; Pirola, C.J. The impact of hypertension on leukocyte telomere length: A systematic review and meta-analysis of human studies. J. Hum. Hypertens. 2017, 31, 99–105. [Google Scholar] [CrossRef]
  131. Koriath, M.; Müller, C.; Pfeiffer, N.; Nickels, S.; Beutel, M.; Schmidtmann, I.; Rapp, S.; Münzel, T.; Westermann, D.; Karakas, M.; et al. Relative telomere length and cardiovascular risk factors. Biomolecules 2019, 9, 192. [Google Scholar] [CrossRef] [Green Version]
  132. Yang, C.; Zhang, M.; Niu, W.; Yang, R.; Zhang, Y.; Qiu, Z.; Sun, B.; Zhao, Z. Analysis of DNA methylation in various swine tissues. PLoS ONE 2011, 6, e16229. [Google Scholar] [CrossRef]
  133. Dlouha, D.; Maluskova, J.; Kralova Lesna, I.; Lanska, V.; Hubacek, J.A. Comparison of the relative telomere length measured in leukocytes and eleven different human tissues. Physiol. Res. 2014, 63 (Suppl. 3), S343–S350. [Google Scholar] [CrossRef]
  134. Jiang, R.; Jones, M.J.; Chen, E.; Neumann, S.M.; Fraser, H.B.; Miller, G.E.; Kobor, M.S. Discordance of DNA methylation variance between two accessible human tissues. Sci. Rep. 2015, 5, 8257. [Google Scholar] [CrossRef] [PubMed] [Green Version]
  135. Estrella, M.M.; Parekh, R.S. The expanding role of APOL1 risk in chronic kidney disease and cardiovascular disease. Semin. Nephrol. 2017, 37, 520–529. [Google Scholar] [CrossRef]
  136. Vanhamme, L.; Paturiaux-Hanocq, F.; Poelvoorde, P.; Nolan, D.P.; Lins, L.; Van Den Abbeele, J.; Pays, A.; Tebabi, P.; Van Xong, H.; Jacquet, A.; et al. Apolipoprotein L-I is the trypanosome lytic factor of human serum. Nature 2003, 422, 83–87. [Google Scholar] [CrossRef] [PubMed]
  137. Hubacek, J.A. Apolipoprotein A5 fifteen years anniversary: Lessons from genetic epidemiology. Gene 2016, 592, 193–199. [Google Scholar] [CrossRef] [PubMed]
  138. Hubáček, J.A.; Šedová, L.; Olišarová, V.; Adámková, V.; Tóthová, V. Different prevalence of T2DM risk alleles in Roma population in comparison with the majority Czech population. Mol. Genet. Genom. Med. 2020, 8, e1361. [Google Scholar] [CrossRef]
  139. Werissa, N.A.; Piko, P.; Fiatal, S.; Kosa, Z.; Sandor, J.; Adany, R. SNP-based genetic risk score modeling suggests no increased genetic susceptibility of the Roma population to type 2 diabetes mellitus. Genes 2019, 10, 942. [Google Scholar] [CrossRef] [Green Version]
  140. Dick, D.M.; Bierut, L.J. The genetics of alcohol dependence. Curr. Psychiatry Rep. 2006, 8, 151–157. [Google Scholar] [CrossRef]
  141. Borinskaya, S.; Kal’ina, N.; Marusin, A.; Faskhutdinova, G.; Morozova, I.; Kutuev, I.; Koshechkin, V.; Khusnutdinova, E.; Stepanov, V.; Puzyrev, V.; et al. Distribution of the alcohol dehydrogenase ADH1B*47His allele in Eurasia. Am. J. Hum. Genet. 2009, 84, 89–92. [Google Scholar] [CrossRef] [Green Version]
  142. Hopkins, P.N.; Williams, R.R. A survey of 246 suggested coronary risk factors. Atherosclerosis 1981, 40, 1–52. [Google Scholar] [CrossRef]
  143. Authors/Task Force Members; ESC Committee for Practice Guidelines (CPG); ESC National Cardiac Societies. 2019 ESC/EAS guidelines for the management of dyslipidaemias: Lipid modification to reduce cardiovascular risk. Atherosclerosis 2019, 290, 140–205, Erratum in: Atherosclerosis 2020, 292, 160–162. Erratum in: Atherosclerosis 2020, 294, 80–82. [Google Scholar]
  144. Graziano, F.; Biino, G.; Bonati, M.T.; Neale, B.M.; Do, R.; Concas, M.P.; Vaccargiu, S.; Pirastu, M.; Terradura-Vagnarelli, O.; Cirillo, M.; et al. Estimation of metabolic syndrome heritability in three large populations including full pedigree and genomic information. Hum. Genet. 2019, 138, 739–748. [Google Scholar] [CrossRef] [PubMed]
  145. Taron, M.; Llerena, A.; Manolopoulos, V.G.; Rodriguez-Antona, C.; Stankovic, S.; van Schaik, R.H.N. The need of the clinical implementation of pharmacogenetics in European health services for routine drug prescription. What’s next? An urgent clinical unmet need for patients. Drug Metab. Pers. Ther. 2020, in press. [Google Scholar] [CrossRef]
  146. Merched, A.J.; Chan, L. Nutrigenetics and nutrigenomics of atherosclerosis. Curr. Atheroscler. Rep. 2013, 15, 328. [Google Scholar] [CrossRef] [Green Version]
  147. Lovegrove, J.A.; Gitau, R. Personalized nutrition for the prevention of cardiovascular disease: A future perspective. J. Hum. Nutr. Diet. 2008, 21, 306–316. [Google Scholar] [CrossRef]
  148. Di Renzo, L.; Gualtieri, P.; Romano, L.; Marrone, G.; Noce, A.; Pujia, A.; Perrone, M.A.; Aiello, V.; Colica, C.; De Lorenzo, A. Role of personalized nutrition in chronic-degenerative diseases. Nutrients 2019, 11, 1707. [Google Scholar] [CrossRef] [Green Version]
Figure 1. Genetic predisposition CVD. There are five nongenetic risk factors of CVD and all are under significant genetic control. Some selected genes with SNPs influencing mentioned risk factors and subsequently CVD are shown. Probably highest number of SNPs is associated with dyslipidemia, most powerful variants are associated with diabetes and obesity and the smallest effects have been observed in field of hypertension. Interestingly, smoking is by far the strongest predictor of CVD, but the list of genes associated with smoking behaviour is short and there is a lack of studies focused on these genes in CVD patients.
Ijms 22 04182 g001
Figure 2. Theoretical example of gene score construction. Theoretical example of unweighted gene score (based on sum of the risky alleles) in group of patients and controls. With 10 genes (polymorphisms) the values could be between 0 and 20. In fact, the lowest and the highest values are almost never presented. There is significant shift in the distribution curve in patient groups to the higher numbers of risky alleles. Still, there is also significant overlap between the patients and controls in gene score values.
Ijms 22 04182 g002
Publisher’s Note: MDPI stays neutral with regard to jurisdictional claims in published maps and institutional affiliations.

