Article

Glycosyltransferase B4GALNT2 as a Predictor of Good Prognosis in Colon Cancer: Lessons from Databases

Department of Experimental, Diagnostic and Specialty Medicine (DIMES), General Pathology Building, University of Bologna, Via San Giacomo 14, 40126 Bologna, Italy
*
Author to whom correspondence should be addressed.
Int. J. Mol. Sci. 2021, 22(9), 4331; https://0-doi-org.brum.beds.ac.uk/10.3390/ijms22094331
Submission received: 30 March 2021 / Revised: 16 April 2021 / Accepted: 19 April 2021 / Published: 21 April 2021

Abstract

:
Background: glycosyltransferase B4GALNT2 and its cognate carbohydrate antigen Sda are highly expressed in normal colon but strongly downregulated in colorectal carcinoma (CRC). We previously showed that CRC patients expressing higher B4GALNT2 mRNA levels displayed longer survival. Forced B4GALNT2 expression reduced the malignancy and stemness of colon cancer cells. Methods: Kaplan–Meier survival curves were determined in “The Cancer Genome Atlas” (TCGA) COAD cohort for several glycosyltransferases, oncogenes, and tumor suppressor genes. Whole expression data of coding genes as well as miRNA and methylation data for B4GALNT2 were downloaded from TCGA. Results: the prognostic potential of B4GALNT2 was the best among the glycosyltransferases tested and better than that of many oncogenes and tumor suppressor genes; high B4GALNT2 expression was associated with a lower malignancy gene expression profile; differential methylation of an intronic B4GALNT2 gene position and miR-204-5p expression play major roles in B4GALNT2 regulation. Conclusions: high B4GALNT2 expression is a strong predictor of good prognosis in CRC as a part of a wider molecular signature that includes ZG16, ITLN1, BEST2, and GUCA2B. Differential DNA methylation and miRNA expression contribute to regulating B4GALNT2 expression during colorectal carcinogenesis.

1. Introduction

Glycosylation plays a crucial role in a variety of biological processes, including intracellular transport, cell adhesion, cell growth, and apoptotic death [1]. In cancer, glycosylation changes consist of up- or downregulation of numerous carbohydrate structures affecting tumor invasion and progression [2,3,4]. The Sda antigen is a carbohydrate structure expressed on erythrocytes and a few other tissues in the vast majority of individuals. The minimal structure of the Sda antigen consists of a α2,3-sialylated galactose to which a GalNAc residue is β1,4-linked (Figure 1) [5]. This epitope can be carried out by various underlying sugar chains, which are indicated as R1–R5 in Figure 1. The enzyme responsible for the last step of Sda biosynthesis is β1,4N-acetylgalactosaminyltransferase 2 (B4GALNT2), first identified in our laboratory [6] and successively cloned in our and other labs [7,8,9]. The few Sda-negative individuals display missense mutations in the C-terminal portion of the B4GALNT2 gene [10]. The expression of B4GALNT2 is very high in normal colonic mucosa but undergoes a dramatic downregulation in colorectal carcinoma (CRC) [11,12]. However, the level of expression in cancer samples is highly variable. In many specimens, it is undetectable, while it is relatively conserved in other cases, predicting a longer survival [13]. In mice, B4galnt2 expression influences microbiota composition [14]. The B4GALNT2 gene is comprised of 11 coding exons. There are two different alternative first exons, both containing a translational start codon. The polypeptide encoded by the transcript including Exon 1S (short form) contains a cytoplasmic tail of conventional length, whereas the one encoded by the transcript with Exon 1L (long form) possesses an exceptionally long cytoplasmic tail. The short form exhibits conventional Golgi localization, while the long form is localized in post-Golgi compartments as well as on the plasma membrane [15].
The molecular bases of B4GALNT2 downregulation in colon cancer tissues and cell lines have not been fully elucidated, although methylation appears to plays a role. In fact, treatment of different colon cancer cell lines with the methylation inhibitor 5-aza-2′-deoxycytidine resulted in a partial activation of B4GALNT2 expression [16,17]. The carbohydrate antigen sialyl Lewisx (sLex), a well-known ligand for the cell adhesion molecules of the selectin family, is ectopically expressed by many cancers and is associated with malignancy [2]. The sLex antigen is formed by a fucose residue α1,3-linked to the GlcNAc residue of a α2,3 sialylated type 2 chain, a structure on which B4GALNT2 acts to synthesize the Sda antigen [5]. In cell lines, the forced expression of B4GALNT2 resulted in Sda expression and sLex inhibition, demonstrating that biosynthesis of the two antigens is mutually exclusive [12,18]. These B4GALNT2-expressing cell lines displayed reduced metastatic ability [18,19], which was attributed to sLex inhibition rather than to de novo Sda expression. However, our recent work [13,20] has shown that B4GALNT2 expression decreases malignancy and stemness in different models of colon cancer cell lines, independently of sLex inhibition. The COADREAD (colon and rectal adenocarcinoma) cohort of “The Cancer Genome Atlas” (TCGA) contains data from 626 cases. Matched tumor–normal tissue samples have been molecularly characterized to identify alterations providing insights into the biology of CRC. Molecular data are derived from multiple types of analysis including gene expression, whole genome sequences, DNA methylation, and miRNA expression. In addition, numerous metadata, including clinical information about participants are also available. The purpose of the present study is to gain insights into the mechanisms of regulation of B4GALNT2 expression and its association with malignancy through an in-depth analysis of data available in TCGA.

2. Results

2.1. The Level of Expression of Only a Few Oncogenes and Tumor Suppressor Genes Is Associated with Patient Survival

In a previous work, we reported that B4GALNT2 expression is a significant predictor of long-term survival in a CRC TCGA cohort [13]. To put this observation into a more general context, we asked whether tumor suppressors and oncogenes known to play fundamental roles in cancer and, in particular, in CRC were better predictors of patient survival. In Figure S1, the Kaplan–Meier survival plots of CRC patients falling in the 15% upper or the 15% lower levels of several tumor suppressors and oncogenes are shown. The 15% threshold was chosen as a compromise between the need to focus on patients displaying extremely high or extremely low levels of gene expression and the need to include a sufficient number of patients to allow for statistical analysis. Survival curves have been ordered according to increasing p-value and boxed in red or blue according to the recognized tumor-promoting or tumor-suppressing activity of the genes, respectively. A statistically significant (p ≤ 0.05) association with survival was shown by genes SMAD6, TERT, EGFR, CDKN2A, CTNNB1, and PIK3CA, which encode the following molecules: SMAD6, an inhibitor of TGF-β signaling [21]; TERT, the reverse transcriptase subunit of telomerase; EGFR, the EGF receptor; CDKN2A, the cyclinD/CDK4,6 inhibitor p16INK and the p53 activator p14ARF through two partially overlapping open reading frames; CTNNB1, catenin-β1; and PIK3CA, the catalytic α subunit of phosphatidylinositol-4,5-bisphosphate 3-Kinase. For the tumor promoter genes SMAD6, TERT, EGFR, and PIK3CA, low levels of expression were associated with better survival, as expected. On the contrary, the longer survival associated with low expression of the CDKN2A locus was unexpected. On the other hand, low levels of catenin-β1 were associated with short-term poorer survival but with long-term survival. Genes for which the association with survival displayed p-values higher than 0.05 but lower than 0.1 included CCNE1 (cyclin E1), SMAD2, CDH1 (E-cadherin) TP53, and BRAF (B-Raf Proto-Oncogene, Serine/Threonine Kinase). Despite the established role of cyclin E1 in colon cancer promotion [22], long-term survival was associated with high CCNE1 expression. On the other hand, the associations of SMAD2, CDH1, TP53, and BRAF with survival were consistent with their biological roles. These data reveal that the expression level of only a few oncogenes and tumor suppressor genes is associated with patients’ overall survival. A possible explanation for the lack of the expected relationships is provided by the fact that oncogene activation or tumor-suppressor inactivation can be due to mutations, altered phosphorylation, or mislocalization rather than increased or decreased mRNA expression.

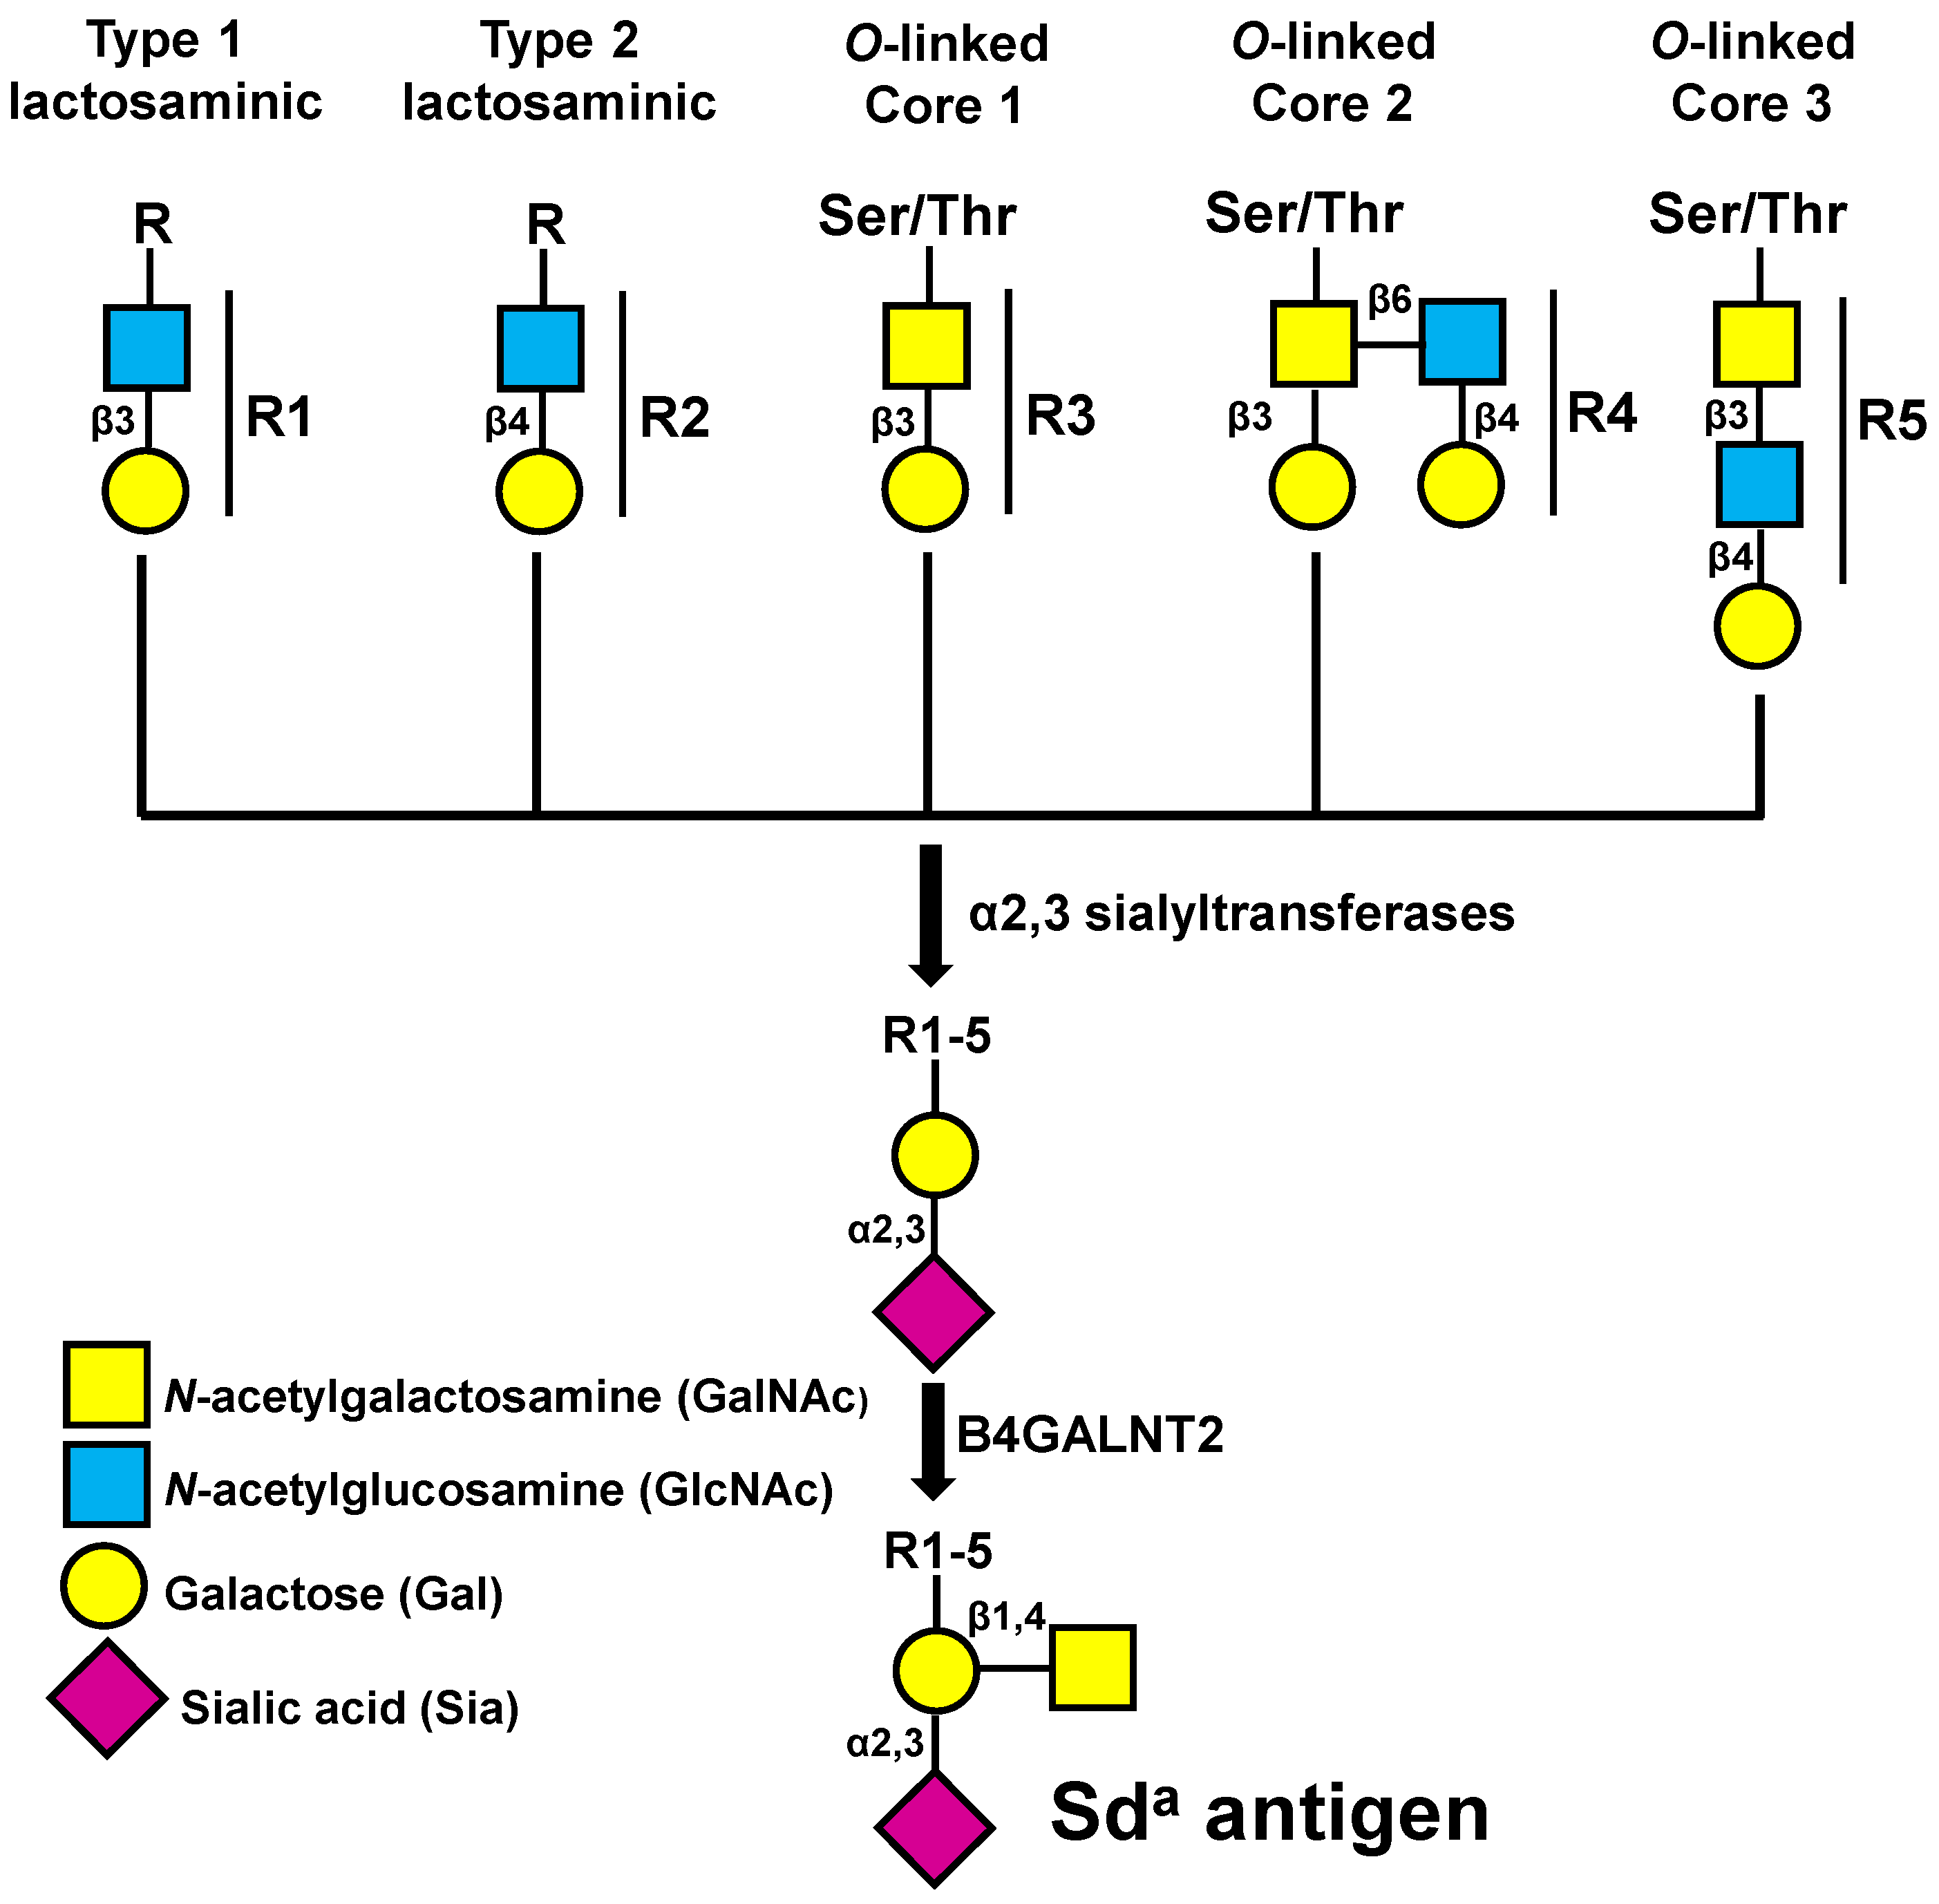
2.2. Among Glycosyltransferases B4GALNT2 Has a Very Good Prognostic Value in CRC

Then, we investigated the relationship between patients’ survival and the expression of several glycosyltransferases relevant for the biosynthesis of cancer-associated carbohydrate structures. In Figure 2, the Kaplan–Meier survival curves of CRC patients falling in the 15 higher percentile and the 15 lower percentile of expression of the indicated glycosyltransferase genes are reported. Each insert contains the code for the sugar transferred by that glycosyltransferase. The enzymatic reactions in which the different glycosyltransferases are involved are reported in Figure S2. Among the 26 glycosyltransferases considered, B4GALNT2 displayed the most significant association with prognosis (p = 0.03). In particular, long-term survivors belonged only to the high-expression group. GCNT3, the only other glycosyltransferase significantly associated with prognosis (p = 0.05), was previously identified as a member of a 15 glycosyltransferase prognostic signature in colon cancer [23]. However, none of the remaining 14 glycosyltransferases of that signature displayed a significant association with prognosis (data not shown). GCNT1, another GlcNAc transferase that shares with GCNT3 the biosynthesis of O-linked Core 2 structures, displayed clearly, although not significantly, the same tendency for worse prognosis shown by GCNT3. This is consistent with the recognized association of Core 2 structures with the vessel invasion and depth of tumor invasion [24]. In contrast, B3GNT6, which synthesizes the Core 3 structure displayed a clear, although nonsignificant, tendency towards an opposite prognostic value, consistent with the recognized role of Core 3 structures in preventing colitis and colon cancer [25]. Surprisingly, enzymes responsible for the biosynthesis of well-known cancer-associated structures, such as β1,6 branching (MGAT5), sialyl-Tn (ST6GALNAC1) sLex (FUT6), Sia6LacNAc (ST6GAL1), and core-fucosylation (FUT8) lack any relationship with survival. Thus, among glycosyltransferases, B4GALNT2 displays a very good prognostic value.

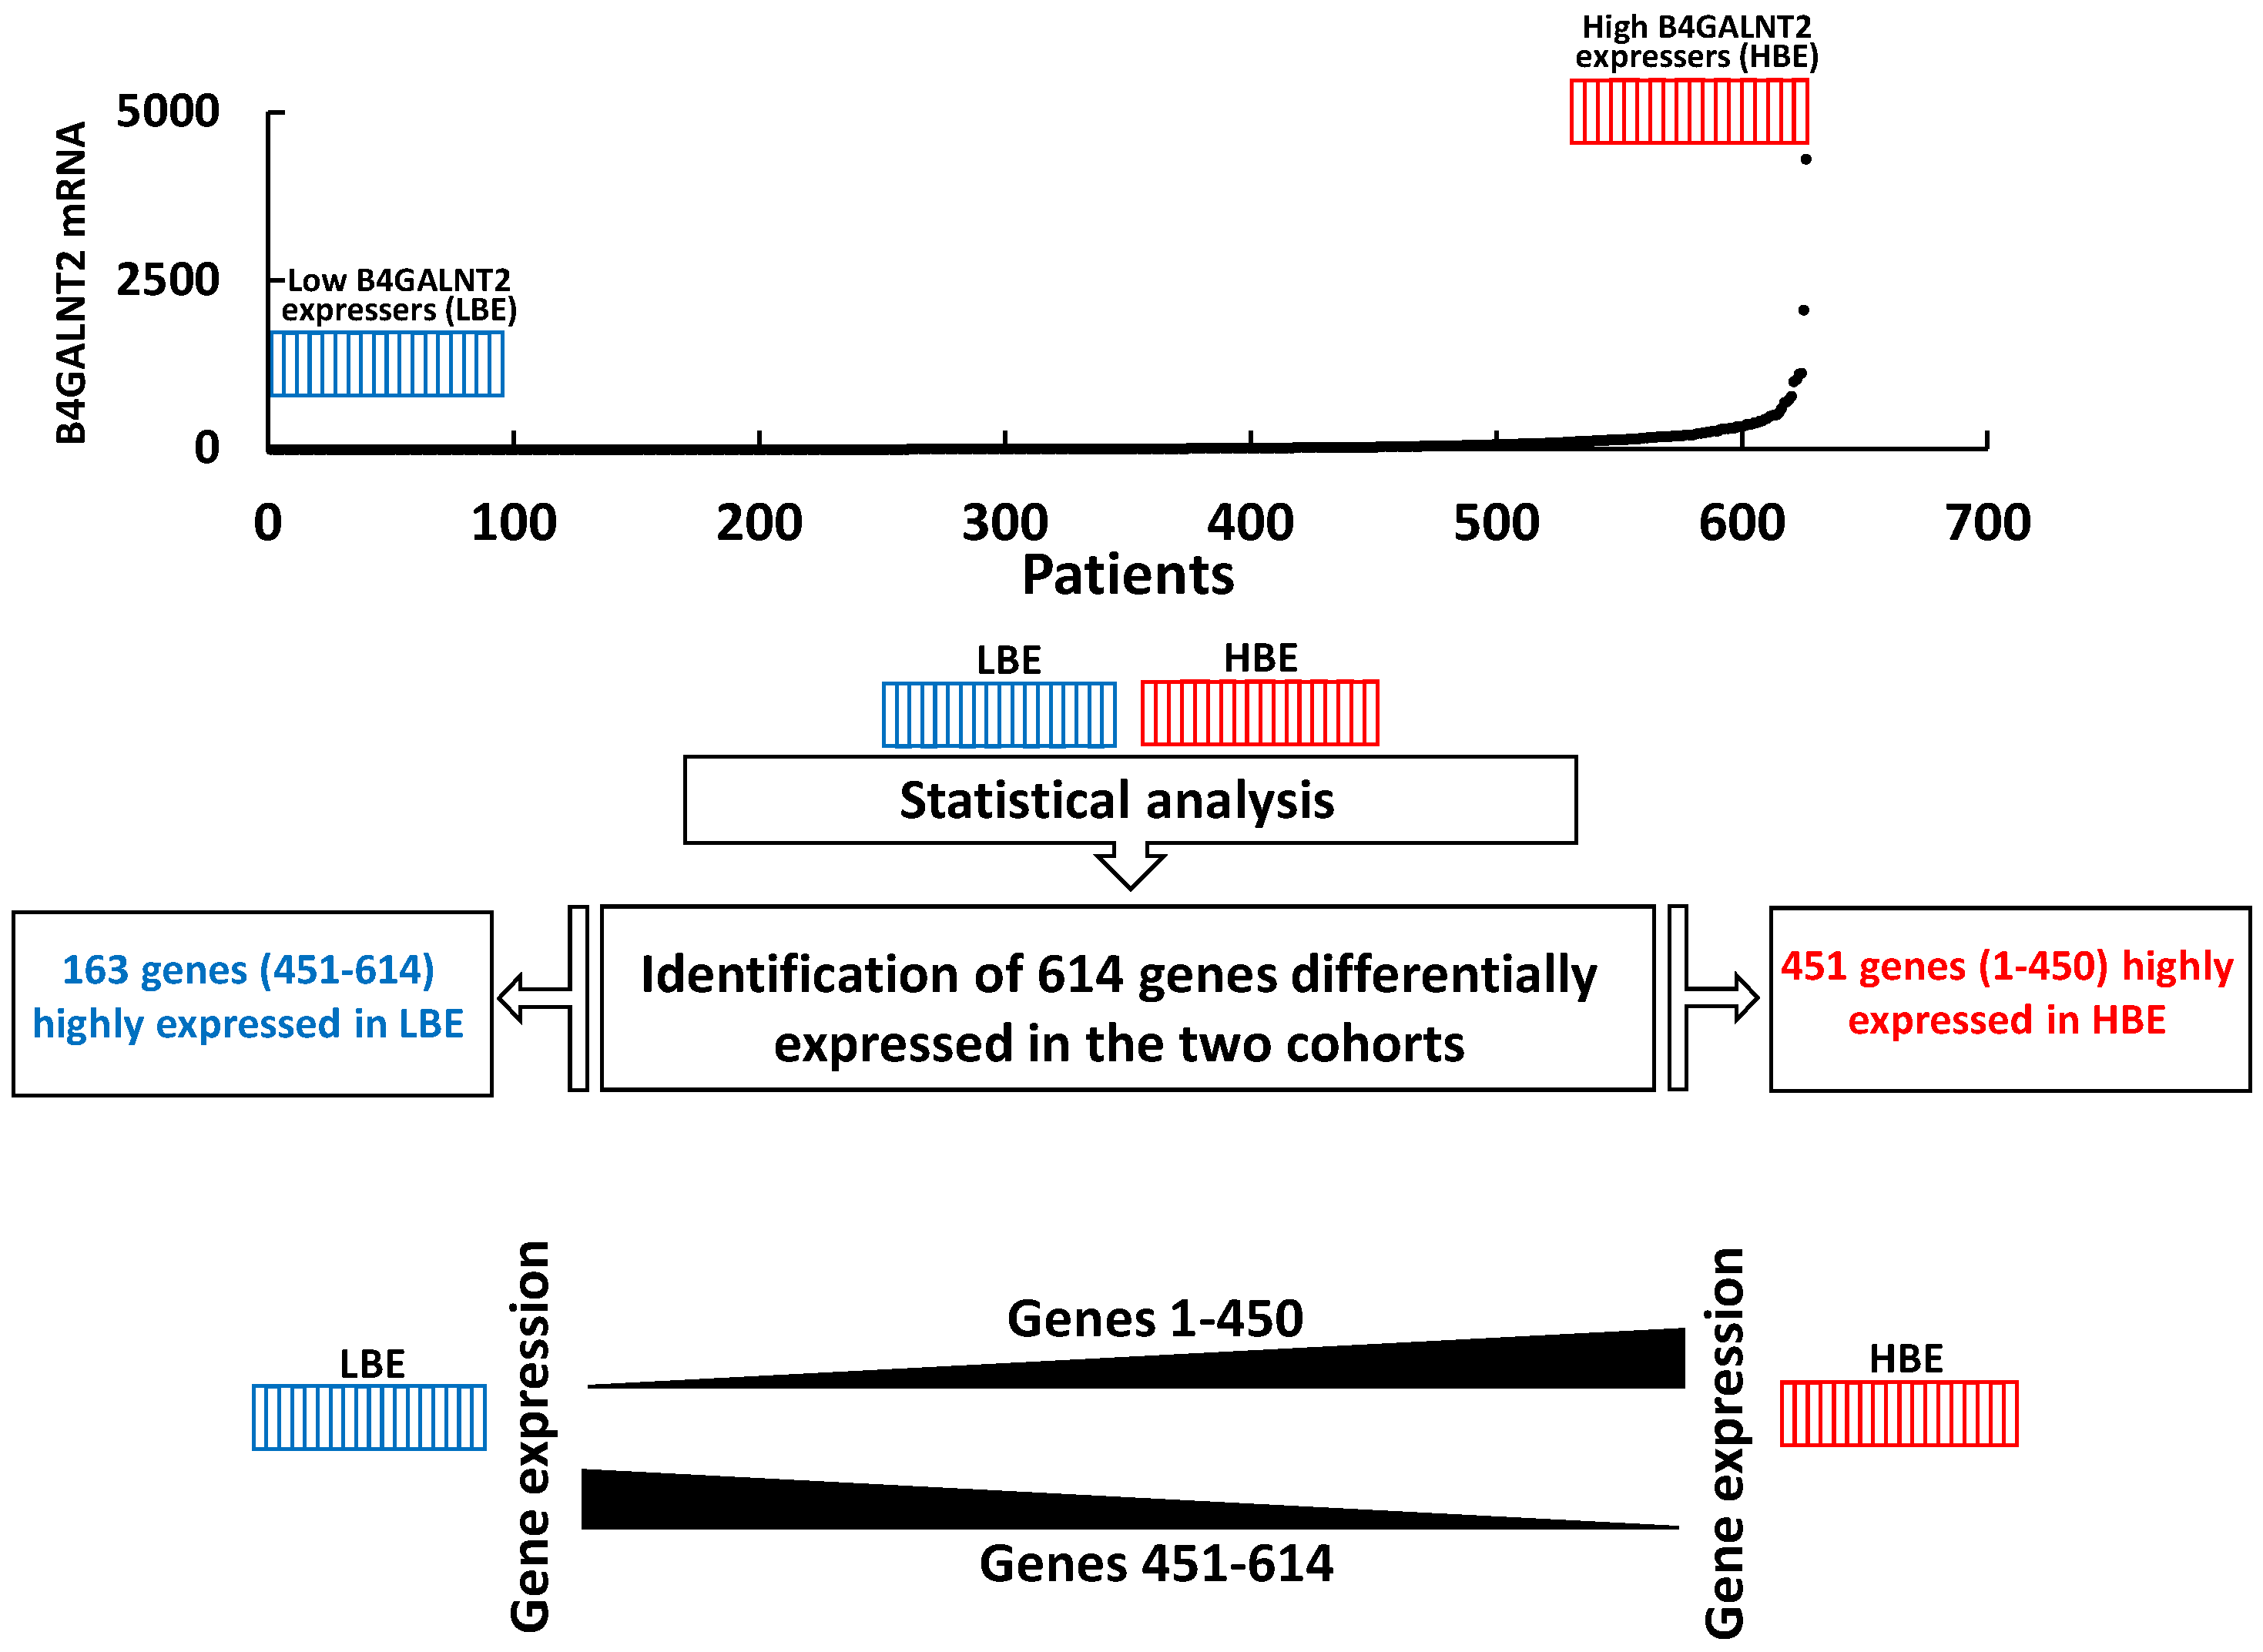
2.3. Comparison of High and Low B4GALNT2 Expressers in the COADRED Cohort

In the cohorts of the 15% higher B4GALNT2 expressers (HBE) and of the 15% lower B4GALNT2 expressers (LBE) the mean ± SD levels of B4GALNT2 expression were 0 ± 0 and 367 ± 501, respectively. In total, 614 genes displayed a significantly different level of expression in the two cohorts (Figure 3 and Table S1). The vast majority (451) of these genes displayed higher expressions in HBE, although 163 genes displayed the opposite behavior. The gene expression ratio between high/low expressers ranged from 200 to −11. Genes showing the most remarkable changes, selected for a ratio higher than 10.0 or lower than −4.0, have been characterized by an extensive literature search, in particular for their role in cancer (Table 1). A color code was assigned to the putative tumor-promoting or tumor-restraining role in the change as follows: green for higher expression of tumor-restraining genes or lower expression of tumor-promoting genes in HBE and vice versa for red. Only genes with a recognizable role in cancer were reported. A high B4GALNT2 expression was associated with 27 tumor restraining and 10 tumor promoting changes, suggesting its association with a low-malignancy molecular signature.
To establish the prognostic potential of genes modulated with respect to B4GALNT2, the survival curves of the top 15 highly expressed genes and the 10 least expressed genes in HBE were obtained (Figure S3). The predictive potential of the highly regulated genes was very good, while genes poorly expressed in HBE lacked any association with prognosis. In particular, the Kaplan–Meier curves of the 15 highly regulated genes (A) were relatively similar, with strong expresser patients displaying a more or less pronounced tendency towards better prognosis (the red curve is always above the blue curve). Four genes (ZG16, ITLN1, BEST2, and GUCA2B) displayed a statistically significant relationship. The significance of ZG16, a gene previously shown to be associated with a good prognosis in CRC [26], was particularly high. The p-value of these genes was always lower than 0.5, which could be indicative of a tendency, although not statistically significant. On the other hand, genes poorly expressed in HBE displayed p-values always above 0.5.

2.4. Several Glycogenes Are Differentially Modulated in HBE and LBE

In Table 2, genes encoding glycosyltransferases as well as heavily glycosylated glycoproteins, such as mucins, and sugar binding proteins, such as galectins, for which the expressions are significantly different in HBE and LBE are reported. The vast majority of the genes listed in Table 2 displayed higher expressions in HBE. In particular, we observed a 10-fold higher expression of GALNT8, mediating the first step of O-glycan biosynthesis (Figure S2), and a 14-fold higher expression of B3GNT6, the enzyme mediating the biosynthesis of Core 3 structures. Since the decrease in Core 3 structures is associated with colon cancer [35], the higher expression of B3GNT6 is consistent with a colon cancer phenotype closer to normal. In addition, Core 3 structures are major Sda carriers in normal colon [36]. On the other hand, HBE displayed higher levels of expression of the sialyltransferases ST6GALNAC1 and ST6GALNAC2, which are responsible for biosynthesis of the tumor-associated antigens sialyl-Tn and sialyl-6-T. Galactosyltransferase B3GALT5 is a key enzyme in the biosynthesis of type 1 lactosaminic chains (Galβ1,3GlcNAc) highly expressed in normal colon but downregulated in CRC [37]. Its higher expression in HBE is consistent with an association with lower malignancy. α2,3-sialylation of type 2 chains, which is mediated (among other STs) by ST3GAL4, is a necessary step in Sda biosynthesis. Concomitantly high ST3GAL4 and B4GALNT2 expressions in the same tissue are expected to support a strong level of Sda biosynthesis. On the other hand, the 10-fold higher expression of FUT5, which mediates sLex biosynthesis and acts as a possible competitor of B4GALNT2, reduces Sda expression. ST6GAL1 and ST6GAL2, which catalyze the α2,6-siaylation of glycoproteins [38] and oligosaccharides [39], are the only two glycogenes that display lower expressions in HBE. ST6GAL1 is overexpressed in CRC [40] and is associated with increased malignancy at the protein level [41] but not at the mRNA level [42].

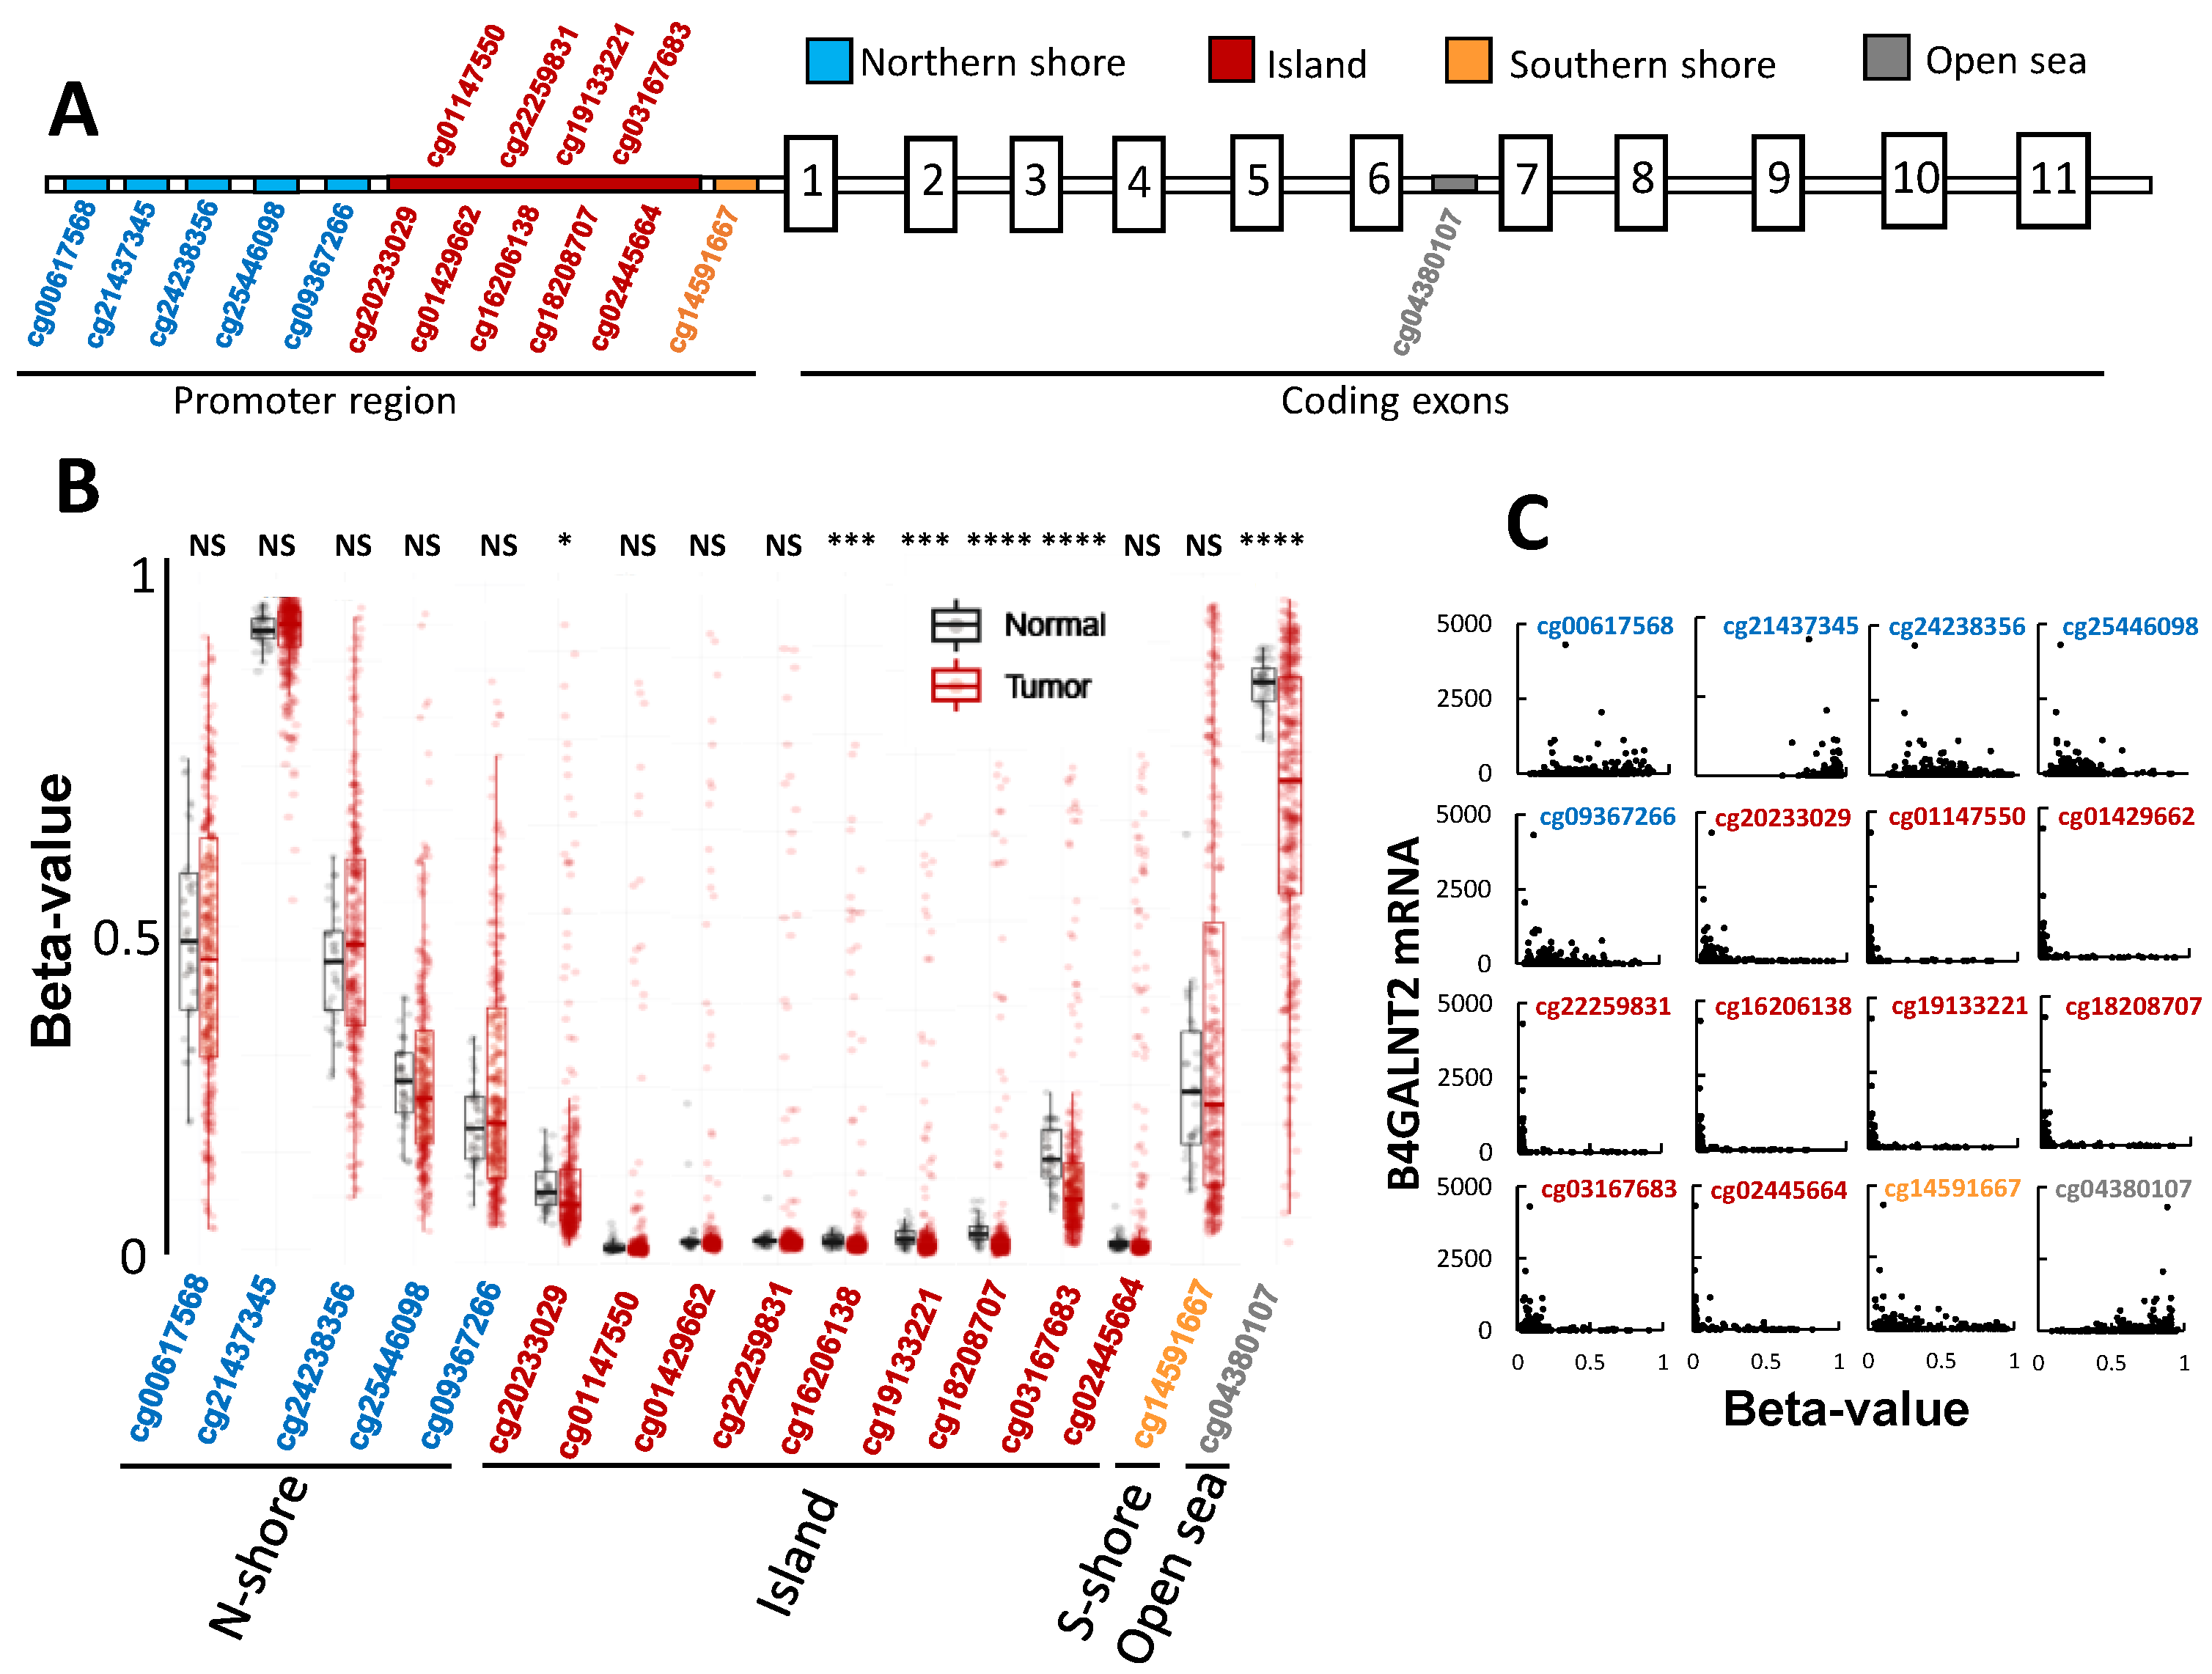
2.5. The Role of Methylation in B4GALNT2 Expression

The presence of CpG islands in the promoter region of the B4GALNT2 gene suggests that methylation can play a relevant role in B4GALNT2 downregulation in colon carcinogenesis. The methylation probes used by the TCGA characterization covered the CpG island as well as a Northern shore (N-shore, upstream the island), a Southern shore (S-shore, downstream the island), and an intronic (open-sea) position between exons 6 and 7 (Figure 4A). At first sight, several differences were evident between normal and tumor methylation (Figure 4B). Which insights do these data provide into the role of methylation in the general downregulation of B4GALNT2 mRNA observed in colon cancer? Methylation in both the N-shore and the S-shore was never statistically different between normal and tumor tissues, although in the latter the extent of methylation was more heterogeneous among patients (Figure 4B). Consequently, these changes cannot be responsible for the general B4GALNT2 downregulation in cancer. Seven positions within the island (cg01147550-cg18208707 and cg02445664) displayed very low levels of methylation in both normal and the vast majority of tumor tissues, ruling out their major role in cancer-associated B4GALNT2 downregulation. Positions cg20233029 and cg03167683 in the island displayed a small but significantly reduced methylation in tumor tissues. However, to explain the reduced B4GALNT2 expression, methylation of these sites should be increased rather than decreased. Methylation of the “open sea” intronic site cg043380107 displayed a highly significant and very heterogeneous reduction in cancer. As shown in Figure 4C, which reports the correlation between B4GALNT2 expression and methylation status of the 16 sites in tumor tissues, in some cases, methylation results in enhancement, rather than inhibition, of gene expression. This is particularly true for the intronic site cg043380107, in which the highest B4GALNT2 expression levels are associated with high methylation. Except for the first two sites in the N-shore, in all of the remaining sites, low methylation is a prerequisite for high B4GALNT2 expression, although many samples displaying very low methylation failed to express B4GALNT2 (Figure 4C). Altogether, these data point to reduced methylation of the intronic site as a key factor in accounting for the general reduction of B4GALNT2 expression in CRC and demonstrated that, among CRC samples, low methylation of the island and shore sites is a necessary but not sufficient condition for high B4GALNT2 expression.

2.6. The Role of miRNAs in B4GALNT2 Expression

The potential role of miRNAs in the regulation of B4GALNT2 expression was investigated. Preliminarily, a list of miRNA potentially targeting B4GALNT2 in colorectal cancer was obtained from the CSmiRTar database. Only miRNA supported by at least two of the four miRNA target prediction databases and with a “normalized miRNA score, NMR” >0.2 (Figure 5A) were considered. The mean level of miRNA expression was determined in the LBE and HBE groups. In consideration of the different number of TCGA patients for which miRNA data were available, we included in the LBE and HBE cohorts the top lower and top higher expressers displaying a mean level of B4GALNT2 expression closest to that of the LBE and HBE cohorts shown in Figure 3 (0 and 367, respectively). Five miRNA displayed little and nonsignificant differences between LBE and HBE (Figure 5A). On the other hand, miR-204–5p was nearly 3-fold less expressed in HBE than in LBE (p = 0.002). A correlation dot plot (Figure 5B) revealed that miR-204–5p was never expressed in HBE patients, although several patients not expressing miR-204–5p failed to express B4GALNT2. These data strongly suggest that downregulation of miR-204–5p is a necessary but not sufficient condition for B4GALNT2 expression in CRC tissues.

3. Discussion

In this study, we showed that B4GALNT2 mRNA expression exhibits a prognostic predictive potential in CRC much better than that of all of the glycosyltransferases tested and even better that that of many oncogenes and tumor-suppressor genes. Among those tested, only SMAD6 and TERT displayed better prognostic values than B4GALNT2, which equals that of EGFR (Figure S1). Patient stratification according to B4GALNT2 expression revealed that HBE group displayed a concomitantly high level of other genes associated with positive prognosis, such as ZG16, ITLN1, BEST2, and GUCA2B. (Table 1). ZG16 is an animal homologue of a plant lectin [43] that inhibits the growth of colon cancer cell lines and CRC-derived organoids by binding with cell surface sugars [29]. In addition, it downregulates PD-L1 expression in CRC, promoting immune surveillance [27]. ITLN1 is associated with good prognosis in CRC [30,32]. It encodes a lectin known as intelectin-1 or omentin-1, which acts as a tumor suppressor in CRC [31]. Apart from its association with good prognosis in CRC [33], no more information is available for BEST2. The product of the GUCA2B gene, in cooperation with those of GUCA2A and GUCA2C, regulates proliferation, metabolism, and barrier function in the intestine [44]. In long- and short duration ulcerative colitis, GUCA2B displays a differential expression in parallel with B4GALNT2 [45]. Among the genes more dramatically downregulated in HBE, TSIX is of particular interest. It is a long noncoding RNA (lncRNA) known to be the anti-sense inhibitor of XIST, which is responsible for the epigenetic inactivation of one of the two X chromosomes in female cells. However, TSIX has also been shown to synergistically regulate, together with other lncRNAs, cancer genes and pathways across multiple tumor contexts [34]. Altogether, these data support the notion that B4GALNT2 is a key member of a gene signature associated with good prognosis. Amongst the genes differentially expressed in HBE and LBE, several are involved in glycosylation (Table 2). Differential expression of several glycosyltransferases predicts that cancer cells of HBE display higher levels of mucin-type O-glycosylation (GALNT8) with sugar chains terminating with sialyl-Tn, (ST6GALNAC1), sialyl-6-T structures (ST6GALNAC2), and Core 3 structures (B3GNT6); increased biosynthesis of type 1 chains (B3GALT5); and increased α2,3 sialylation of type 2 chains (ST3GAL4), forming acceptor substrates for B4GALNT2. Despite the higher expression of FUT5, more biosynthesis of sLex does not appear to be likely, considering the competition of B4GALNT2. Owing to the reduced expressions of both ST6GAL1 and ST6GAL2, α2,6-sialylation could be reduced in HBE. Among non-glycosyltransferase molecules, it is worth mentioning the higher expression of galectin 4, which is associated with normal gut, and of the gel-forming mucins MUC2, MUC4, and MUC5B. These data support the existence of different glycophenotypes in the LBE and HBE cohorts.
Current data indicate that B4GALNT2 control in colonic tissues consists of complex mechanisms. We showed that DNA-methylation plays an important, although unconventional, role (Figure 4). In fact, its general downregulation observed in the vast majority of cancer cases cannot be explained by differential methylation of CpG sites located on the island and shores. Rather, the open-sea site located at the intron between exons 6 and 7 presents generally reduced methylation in cancer samples. Interestingly, methylation of this site is associated with increased, rather than decreased, B4GALNT2 expression. In some cases, the stimulatory effect of high methylation of specific sequences is due to the fact that it promotes interactions between distant enhancers and the regulatory regions of the gene [46]. However, regardless a permissive methylation status, in many samples, B4GALNT2 was not expressed, indicating that other regulatory mechanisms are involved. This is in agreement with a previous study showing that differential B4GALNT2 promoter methylation is only partially correlated with gene expression in gastric cancer cell lines [17]. miRNAs are potential candidates for B4GALNT2 regulation. Among the miRNAs theoretically predicted to inhibit B4GALNT2, miR-204–5p appears to be the most plausible candidate (Figure 5). In fact, it is the only one downregulated in HBE and none of the samples expressing B4GALNT2 above a background threshold expressed this miRNA. However, miR-204–5p downregulation does not ensure B4GALNT2 expression, since many cases lacking miR-204–5p failed to express B4GALNT2. Together, these data indicate a multifactorial nature of B4GALNT2 regulation, with DNA methylation and miRNA expression playing relevant but not exclusive roles. It appears that, even without methylation and miRNA “brakes”, the “engine” of B4GALNT2 transcription does not run. The lack of appropriate transcription factors is a plausible reason for the lack of B4GALNT2 expression in the majority of CRC samples. Our previous data indicate that forced B4GALNT2 expression is responsible for attenuation of the neoplastic phenotype and of stemness in different CRC cell models [13,20]. On this basis, the stimulation of B4GALNT2 expression in CRC cells can be proposed as a promising goal for therapy of this deadly disease.

4. Materials and Methods

Kaplan–Meier survival curves were obtained from the Oncolnc website (oncolnc.org), selecting the COAD cohort and the 15 higher and the 15 lower percentiles of gene expression. Gene expression data of 626 colorectal adenocarcinoma (COADREAD) samples were downloaded from the TCGA database using the Firebrowse website (http://firebrowse.org (accessed on 11 April 2021)). The gene methylation data of 288 tumor samples were downloaded from TCGA. A comparison with gene methylation between normal and cancer tissues was performed using the Smartapp tool (http://www.bioinfo-zs.com/smartapp/ (accessed on 11 April 2021)). A search for miRNAs targeting B4GALNT2 was completed using the CSmiRTar website (http://cosbi4.ee.ncku.edu.tw/CSmiRTar/ (accessed on 11 April 2021)), selecting “cancer” as “class of disease”; “colorectal cancer” as “disease”, and “colorectum” as “tissue”. Only miRNA predicted by at least two databases were considered. The number of TCGA patients for which miRNA expression data were available varied for different miRNA from 221 and 298.
Patients were ordered according to increasing levels of B4GALNT2 expression. Two cohorts (LBE and HBE) containing 94 patients falling in the 15% low percentile and 15% high percentile, respectively, were selected. Genes differentially modulated in the HBE and LBE cohorts were analyzed by the false discovery rate two-stage linear step-up procedure of Benjamini, Krieger, and Yekutieli. The role of the genes was deduced from the website “genecards.org”, while the role of the genes in cancer was deduced by an extensive PubMed search using the “gene name” and “cancer” as search terms.

Supplementary Materials

Author Contributions

Conceptualization, F.D.; formal analysis, M.P.; investigation, M.P. and N.M.; writing—original draft preparation, F.D.; writing—review and editing, N.M., M.P., and F.D.; supervision, F.D.; funding acquisition, F.D. All authors have read and agreed to the published version of the manuscript.

Funding

This research was funded by the University of Bologna and by the “Pallotti” Legacy for Cancer Research to F.D.

Institutional Review Board Statement

Not applicable.

Informed Consent Statement

Not applicable.

Data Availability Statement

Not applicable.

Conflicts of Interest

The authors declare no conflict of interest.

Abbreviations

COADREAD colon adenocarcinoma rectal adenocarcinoma
CRCcolorectal cancer
HBEhigher B4GALNT2 expressers
LBElower B4GALNT2 expressers
lncRNAlong noncoding RNA
NMRnormalized miRNA score
PD-L1programmed death ligand-1
sLexSialyl LewisX
TCGAThe Cancer Genome Atlas

References

  1. Varki, A. Biological roles of glycans. Glycobiology 2017, 27, 3–49. [Google Scholar] [CrossRef] [Green Version]
  2. Dall’Olio, F.; Malagolini, N.; Trinchera, M.; Chiricolo, M. Mechanisms of cancer-associated glycosylation changes. Front. Biosci. 2012, 17, 670–699. [Google Scholar] [CrossRef] [Green Version]
  3. Dall’Olio, F.; Malagolini, N.; Trinchera, M.; Chiricolo, M. Sialosignaling: Sialyltransferases as engines of self-fueling loops in cancer progression. Biochim. Biophys. Acta 2014, 1840, 2752–2764. [Google Scholar] [CrossRef] [PubMed] [Green Version]
  4. Pinho, S.S.; Reis, C.A. Glycosylation in cancer: Mechanisms and clinical implications. Nat. Rev. Cancer 2015, 15, 540–555. [Google Scholar] [CrossRef] [PubMed]
  5. Dall’Olio, F.; Malagolini, N.; Chiricolo, M.; Trinchera, M.; Harduin-Lepers, A. The expanding roles of the Sda/Cad carbohydrate antigen and its cognate glycosyltransferase B4GALNT. Biochim. Biophys. Acta 2014, 1840, 443–453. [Google Scholar] [CrossRef] [Green Version]
  6. Serafini-Cessi, F.; Dall’Olio, F. Guinea-pig kidney β-N-acetylgalactosaminyltransferase towards Tamm-Horsfall glycoprotein. Requirement of sialic acid in the acceptor for transferase activity. Biochem. J. 1983, 215, 483–489. [Google Scholar] [CrossRef]
  7. Lo Presti, L.; Cabuy, E.; Chiricolo, M.; Dall’Olio, F. Molecular Cloning of the Human β1,4 N-Acetylgalactosaminyltransferase Responsible for the Biosynthesis of the Sda Histo-Blood Group Antigen: The Sequence Predicts a Very Long Cytoplasmic Domain. J. Biochem. 2003, 134, 675–682. [Google Scholar] [CrossRef] [PubMed]
  8. Montiel, M.D.; Krzewinski-Recchi, M.A.; Delannoy, P.; Harduin-Lepers, A. Molecular cloning, gene organization and expression of the human UDP-GalNAc:Neu5Acα2-3Galβ-R β1,4-N-acetylgalactosaminyltransferase responsible for the biosynthesis of the blood group Sda/Cad antigen: Evidence for an unusual extended cytoplasmic domain. Biochem. J. 2003, 373, 369–379. [Google Scholar] [CrossRef] [Green Version]
  9. Smith, P.L.; Lowe, J.B. Molecular cloning of a murine N-acetylgalactosamine transferase cDNA that determines expression of the T lymphocyte-specific CT oligosaccharide differentiation antigen. J. Biol. Chem. 1994, 269, 15162–15171. [Google Scholar] [CrossRef]
  10. Stenfelt, L.; Hellberg, A.; Moller, M.; Thornton, N.; Larson, G.; Olsson, M.L. Missense mutations in the C-terminal portion of the B4GALNT2-encoded glycosyltransferase underlying the Sd(a-) phenotype. Biochem. Biophys. Rep. 2019, 19, 100659. [Google Scholar] [CrossRef]
  11. Malagolini, N.; Dall’Olio, F.; Di Stefano, G.; Minni, F.; Marrano, D.; Serafini-Cessi, F. Expression of UDP-GalNAc:NeuAc α2,3Gal β-R beta 1,4(GalNAc to Gal) N-acetylgalactosaminyltransferase involved in the synthesis of Sda antigen in human large intestine and colorectal carcinomas. Cancer Res. 1989, 49, 6466–6470. [Google Scholar]
  12. Malagolini, N.; Santini, D.; Chiricolo, M.; Dall’Olio, F. Biosynthesis and expression of the Sda and sialyl Lewis x antigens in normal and cancer colon. Glycobiology 2007, 17, 688–697. [Google Scholar] [CrossRef]
  13. Pucci, M.; Gomes Ferreira, I.; Orlandani, M.; Malagolini, N.; Ferracin, M.; Dall’Olio, F. High Expression of the Sda Synthase B4GALNT2 Associates with Good Prognosis and Attenuates Stemness in Colon Cancer. Cells 2020, 9, 948. [Google Scholar] [CrossRef] [Green Version]
  14. Staubach, F.; Kunzel, S.; Baines, A.C.; Yee, A.; McGee, B.M.; Backhed, F.; Baines, J.F.; Johnsen, J.M. Expression of the blood-group-related glycosyltransferase B4galnt2 influences the intestinal microbiota in mice. ISME J. 2012, 6, 1345–1355. [Google Scholar] [CrossRef] [PubMed] [Green Version]
  15. Groux-Degroote, S.; Schulz, C.; Cogez, V.; Noel, M.; Portier, L.; Vicogne, D.; Solorzano, C.; Dall’Olio, F.; Steenackers, A.; Mortuaire, M.; et al. The extended cytoplasmic tail of the human B4GALNT2 is critical for its Golgi targeting and post-Golgi sorting. FEBS J. 2018, 285, 3442–3463. [Google Scholar] [CrossRef] [Green Version]
  16. Wang, H.R.; Hsieh, C.Y.; Twu, Y.C.; Yu, L.C. Expression of the human Sda β-1,4-N-acetylgalactosaminyltransferase II gene is dependent on the promoter methylation status. Glycobiology 2008, 18, 104–113. [Google Scholar] [CrossRef] [PubMed]
  17. Kawamura, Y.I.; Toyota, M.; Kawashima, R.; Hagiwara, T.; Suzuki, H.; Imai, K.; Shinomura, Y.; Tokino, T.; Kannagi, R.; Dohi, T. DNA hypermethylation contributes to incomplete synthesis of carbohydrate determinants in gastrointestinal cancer. Gastroenterology 2008, 135, 142–151. [Google Scholar] [CrossRef] [PubMed]
  18. Kawamura, Y.I.; Kawashima, R.; Fukunaga, R.; Hirai, K.; Toyama-Sorimachi, N.; Tokuhara, M.; Shimizu, T.; Dohi, T. Introduction of Sda carbohydrate antigen in gastrointestinal cancer cells eliminates selectin ligands and inhibits metastasis. Cancer Res. 2005, 65, 6220–6227. [Google Scholar] [CrossRef] [Green Version]
  19. Kawamura, Y.I.; Adachi, Y.; Curiel, D.T.; Kawashima, R.; Kannagi, R.; Nishimoto, N.; Dohi, T. Therapeutic adenoviral gene transfer of a glycosyltransferase for prevention of peritoneal dissemination and metastasis of gastric cancer. Cancer Gene Ther. 2014, 21, 427–433. [Google Scholar] [CrossRef] [PubMed] [Green Version]
  20. Pucci, M.; Gomes, F.I.; Malagolini, N.; Ferracin, M.; Dall’Olio, F. The Sda Synthase B4GALNT2 Reduces Malignancy and Stemness in Colon Cancer Cell Lines Independently of Sialyl Lewis X Inhibition. Int. J. Mol. Sci. 2020, 21, 6558. [Google Scholar] [CrossRef]
  21. Jung, B.; Staudacher, J.J.; Beauchamp, D. Transforming Growth Factor beta Superfamily Signaling in Development of Colorectal Cancer. Gastroenterology 2017, 152. [Google Scholar] [CrossRef] [Green Version]
  22. Cheasley, D.; Pereira, L.; Sampurno, S.; Sieber, O.; Jorissen, R.; Xu, H.; Germann, M.; Yuqian, Y.; Ramsay, R.G.; Malaterre, J. Defective Myb Function Ablates Cyclin E1 Expression and Perturbs Intestinal Carcinogenesis. Mol. Cancer Res. 2015, 13, 1185–1196. [Google Scholar] [CrossRef] [Green Version]
  23. Noda, M.; Okayama, H.; Tachibana, K.; Sakamoto, W.; Saito, K.; Thar Min, A.K.; Ashizawa, M.; Nakajima, T.; Aoto, K.; Momma, T.; et al. Glycosyltransferase gene expression identifies a poor prognostic colorectal cancer subtype associated with mismatch repair deficiency and incomplete glycan synthesis. Clin. Cancer Res. 2018, 24, 4468–4481. [Google Scholar] [CrossRef] [Green Version]
  24. Shimodaira, K.; Nakayama, J.; Nakamura, N.; Hasebe, O.; Katsuyama, T.; Fukuda, M. Carcinoma-associated expression of core 2 β1,6-N-acetylglucosaminyltransferase gene in human colorectal cancer: Role of O-glycans in tumor progression. Cancer Res. 1997, 57, 5201–5206. [Google Scholar] [PubMed]
  25. An, G.; Wei, B.; Xia, B.; McDaniel, J.M.; Ju, T.; Cummings, R.D.; Braun, J.; Xia, L. Increased susceptibility to colitis and colorectal tumors in mice lacking core 3-derived O-glycans. J. Exp. Med. 2007, 204, 1417–1429. [Google Scholar] [CrossRef] [PubMed]
  26. Meng, H.; Li, W.; Boardman, L.A.; Wang, L. Loss of ZG16 is associated with molecular and clinicopathological phenotypes of colorectal cancer. BMC. Cancer 2018, 18, 433. [Google Scholar] [CrossRef] [PubMed] [Green Version]
  27. Meng, H.; Ding, Y.; Liu, E.; Li, W.; Wang, L. ZG16 regulates PD-L1 expression and promotes local immunity in colon cancer. Transl. Oncol. 2021, 14. [Google Scholar] [CrossRef] [PubMed]
  28. Meng, Q.; Ren, C.; Wang, L.; Zhao, Y.; Wang, S. Knockdown of ST6Gal-I inhibits the growth and invasion of osteosarcoma MG-63 cells. Biomed. Pharmacother. 2015, 72. [Google Scholar] [CrossRef] [PubMed]
  29. Mito, A.; Nakano, Y.; Saitoh, T.; Gouraud, S.S.S.; Yamaguchi, Y.; Sato, T.; Sasaki, N.; Kojima-Aikawa, K. Lectin ZG16p inhibits proliferation of human colorectal cancer cells via its carbohydrate-binding sites. Glycobiology 2018, 28, 21–31. [Google Scholar] [CrossRef] [Green Version]
  30. Liu, J.; Jiang, C.; Xu, C.; Wang, D.; Shen, Y.; Liu, Y.; Gu, L. Identification and development of a novel invasion-related gene signature for prognosis prediction in colon adenocarcinoma. Cancer Cell Int. 2021, 21, 101. [Google Scholar] [CrossRef]
  31. Kawashima, K.; Maeda, K.; Saigo, C.; Kito, Y.; Yoshida, K.; Takeuchi, T. Adiponectin and Intelectin-1: Important Adipokine Players in Obesity-Related Colorectal Carcinogenesis. Int. J. Mol. Sci. 2017, 18, 866. [Google Scholar] [CrossRef] [Green Version]
  32. Liu, X.; Bing, Z.; Wu, J.; Zhang, J.; Zhou, W.; Ni, M.; Meng, Z.; Liu, S.; Tian, J.; Zhang, X.; et al. Integrative Gene Expression Profiling Analysis to Investigate Potential Prognostic Biomarkers for Colorectal Cancer. Med. Sci. Monit. 2020, 26, e918906. [Google Scholar] [CrossRef] [PubMed]
  33. Qin, L.; Zeng, J.; Shi, N.; Chen, L.; Wang, L. Application of weighted gene coexpression network analysis to explore the potential diagnostic biomarkers for colorectal cancer. Mol. Med. Rep. 2020, 21, 2533–2543. [Google Scholar] [CrossRef] [PubMed] [Green Version]
  34. Chiu, H.S.; Somvanshi, S.; Patel, E.; Chen, T.W.; Singh, V.P.; Zorman, B.; Patil, S.L.; Pan, Y.; Chatterjee, S.S.; Sood, A.K.; et al. Pan-Cancer Analysis of lncRNA Regulation Supports Their Targeting of Cancer Genes in Each Tumor Context. Cell Rep. 2018, 23. [Google Scholar] [CrossRef] [PubMed]
  35. Holst, S.; Wuhrer, M.; Rombouts, Y. Glycosylation characteristics of colorectal cancer. Adv. Cancer Res. 2015, 126, 203–256. [Google Scholar]
  36. Capon, C.; Maes, E.; Michalski, J.C.; Leffler, H.; Kim, Y.S. Sda-antigen-like structures carried on core 3 are prominent features of glycans from the mucin of normal human descending colon. Biochem. J 2001, 358, 657–664. [Google Scholar] [CrossRef]
  37. Salvini, R.; Bardoni, A.; Valli, M.; Trinchera, M. β1,3-Galactosyltransferase β3Gal-T5 acts on the GlcNAcβ1-->3Galβ1-->4GlcNAcβ1-->R sugar chains of carcinoembryonic antigen and other N-linked glycoproteins and is down-regulated in colon adenocarcinomas. J Biol. Chem. 2001, 276, 3564–3573. [Google Scholar] [CrossRef] [Green Version]
  38. Weinstein, J.; Lee, E.U.; McEntee, K.; Lai, P.H.; Paulson, J.C. Primary structure of β-galactoside α 2,6-sialyltransferase. Conversion of membrane-bound enzyme to soluble forms by cleavage of the NH2-terminal signal anchor. J. Biol. Chem. 1987, 262, 17735–17743. [Google Scholar] [CrossRef]
  39. Takashima, S.; Tsuji, S.; Tsujimoto, M. Characterization of the Second Type of Human β-Galactoside α2,6-Sialyltransferase (ST6Gal II), Which Sialylates Galβ1,4GlcNAc Structures on Oligosaccharides Preferentially. Genomic Analysis of Human Sialyltransferase Genes. J Biol. Chem. 2002, 277, 45719–45728. [Google Scholar] [CrossRef] [Green Version]
  40. Dall’Olio, F.; Malagolini, N.; Di Stefano, G.; Minni, F.; Marrano, D.; Serafini-Cessi, F. Increased CMP-NeuAc:Galβ1,4GlcNAc-R α 2,6 sialyltransferase activity in human colorectal cancer tissues. Int. J. Cancer 1989, 44, 434–439. [Google Scholar]
  41. Lise, M.; Belluco, C.; Perera, S.P.; Patel, R.; Thomas, P.; Ganguly, A. Clinical correlations of α2,6-sialyltransferase expression in colorectal cancer patients. Hybridoma 2000, 19, 281–286. [Google Scholar] [CrossRef] [PubMed]
  42. Venturi, G.; Gomes, F.I.; Pucci, M.; Ferracin, M.; Malagolini, N.; Chiricolo, M.; Dall’Olio, F. Impact of sialyltransferase ST6GAL1 overexpression on different colon cancer cell types. Glycobiology 2019, 29, 684–695. [Google Scholar] [CrossRef] [PubMed]
  43. Mito, A.; Kumazawa-Inoue, K.; Kojima-Aikawa, K. ZG16p, an Animal Homologue of Plant beta-Prism Fold Lectins: Purification Methods of Natural and Recombinant ZG16p and Inhibition Assay of Cancer Cell Growth Using ZG16p. Methods Mol. Biol. 2020, 2132, 339–347. [Google Scholar] [CrossRef]
  44. Pattison, A.M.; Merlino, D.J.; Blomain, E.S.; Waldman, S.A. Guanylyl cyclase C signaling axis and colon cancer prevention. World J. Gastroenterol. 2016, 22, 8070–8077. [Google Scholar] [CrossRef] [PubMed]
  45. Low, E.N.D.; Mokhtar, N.M.; Wong, Z.; Raja Ali, R.A. Colonic Mucosal Transcriptomic Changes in Patients with Long-Duration Ulcerative Colitis Revealed Colitis-Associated Cancer Pathways. J. Crohns. Colitis. 2019, 13, 755–763. [Google Scholar] [CrossRef] [PubMed]
  46. Grimmer, M.R.; Costello, J.F. Cancer: Oncogene brought into the loop. Nature 2016, 529, 34–35. [Google Scholar] [CrossRef] [Green Version]
Figure 1. Schematic representation of the structure and biosynthesis of the Sda antigen. Several carbohydrate structures (R1–R5) terminating with galactose are α2,3 sialylated by different α2,3 sialyltransferases. The resulting sialylated structure is a substrate for B4GALNT2, which generates the Sda antigen.
Ijms 22 04331 g001
Figure 2. Kaplan–Meier survival plots of patients expressing high or low glycosyltransferase mRNA levels. Curves were generated by the OncoLnc website using the 15% higher (red lines) and 15% lower expressions (blue lines) of the indicated genes. The sugar transferred by each glycosyltransferase is indicated by the code in the insert.
Ijms 22 04331 g002
Figure 3. Schematic representation of the TCGA data analysis. The 626 COADREAD cases were ordered according to the level of B4GALNT2 expression, differentiating the 15% top expression (HBE, red) and the 15% lower expression (LBE, blue) cohorts of 94 cases. Statistical analysis (false discovery rate two-stage linear step-up procedure of Benjamini, Krieger, and Yekutieli) revealed that 614 genes were differentially expressed in the two cohorts. Of these, 451 genes were more expressed in HBE while 163 were more expressed in the LBE.
Ijms 22 04331 g003
Figure 4. DNA methylation of the B4GALNT2 gene. (A) Schematic representation, not drawn to scale, of the promoter region and of the coding exons of the B4GALNT2 gene. The approximate position of the probes is indicated. (B) Methylation level of the different probes. * p < 0.05; *** p < 0.001; **** p < 0.0001. (C) Correlation between B4GALNT2 expression level and methylation of specific positions in tumor tissues.
Ijms 22 04331 g004
Figure 5. Correlation of B4GALNT2 and miRNA expression. (A) miRNA potentially targeting B4GALNT2 were obtained from the CSmiRTar database. Only miRNA supported by at least two of the four miRNA prediction target databases and with a “normalized miRNA score, NMR” >0.2 were considered. LBE and HBE represent the expression of the miRNA in the LBE (B4GALNT2 expression = 0) or HBE (B4GALNT2 expression closest to 367) cohorts. The only significantly modulated miRNA is indicated in bold. * Student’s t test for independent samples. (B) dot plot correlation analysis of the miRNA and B4GALNT2 expression level.
Ijms 22 04331 g005
Table 1. Genes differentially modulated in HBE and LBE.
Gene RatioGene RoleReference
CLCA1203Involved in mucus secretion and as a tumor suppressor and suppresses CRC malignancy28974231
ZG16151Animal lectin; inhibits growth and increases immune surveillance of CRC[26,27,28,29]
ITLN162Lectin-recognizing microbial carbohydrates; protective in CRC[30,31,32]
CLCA451Involved in mediating chloride conductance; downregulated genes in CRC32027181
SPINK448Serine peptidase inhibitor; its downregulation is associated with poor survival in CRC31888570
CA145Carbonic anhydrase; predictive biomarker in CRC32031891
MAGEA137Involved in transcriptional regulation; acts as an oncogene in some cancers30509089
PYY33Inhibitis intestinal mobility; decreased expression is associated with CRC11825654
GUCA2B32Regulator of intestinal fluid transport; tumor suppressor in CRC29788743
CA427Stimulates the ion transporter activity of SLC4A4; Predictive biomarker in CRC32031891
MS4A1225Involved in signal transduction; promotes malignant progression in CRC18451174
BEST223Anion channel; methylation marker for early detection and prognosis of CRC[33]
HEPACAM223Required for centrosome maturation; associated with good prognosis29659199
TMIGD122Controls cell–cell adhesion and proliferation; tumor suppressor in CRC33129760
CLDN816Claudin 8; component of tight junctions; downregulated in CRC21479352
B3GNT614Synthesizes core 3 O-linked chains; downregulation associated with malignancy in CRC28745318
KIF1913Microtubule-dependent motor protein; higher expression associated with longer survival28901309
CSAG213Chondrosarcoma-asociated gene 2/3 protein; necessary for tumorigenesis32761762
FCGBP12Maintains the mucosal structure; high expression is associated with better prognosis31268166
CDKN2BAS12CDKN2B antisense RNA 1; promotes progression of ovarian cancer32572907
REG1B11Regenerating islet-derived protein 1-β; its silencing inhibits CRC growth25768000
IGJ11Joining chain of multimeric IgA and IgM; downregulated in CRC31749922
LEFTY210Member of the TGF-β superfamily; negative regulator of endometrial cell proliferation27497669
FUT510Fucosyltransferase 5; promotes the development of CRC28771224
MUC210Secreted mucus-forming mucin; suppresses CRC migration and metastasis28725043
PLIN1−4Modulator of adipocyte lipid metabolism; inhibits breast cancer cell proliferation27359054
PCP4−4Functions as a modulator of calcium-binding by calmodulin; antiapoptotic peptide25153723
IGF2−4Possess growth-promoting activity; overexpression is associated with poor prognosis24080445
SLC14A1−4Urea channel; cancer stem cell marker29329541
FREM1−5Extracellular matrix protein; associated with better prognosis in bladder cancer33058542
CASQ2−5Calsequestrin; high expression associated with poor survival in bladder cancer31991631
CPLX2−6Involved in exocytosis; associated with poor prognosis in lung tumors3912489
ADIPOQ−6Adiponectin; anti-inflammatory adipokine; lower expression in CRC27061803
WIF1−7Inhibits WNT actvities; hypermethylation is associated with a favorable clinical outcome31830937
CHRNB2−9Cholinergic receptor nicotinic beta 2 subunit; downregulated in gastric cancer30175534
AP3B2−10Involved in protein sorting; low expression is associated with long-term survival in rectal cancer29050227
TSIX−11XIST antisense RNA; dysregulates cancer pathways in multiple tumor contexts[34]
Genes differentially modulated in HBE and LBE cohorts were analyzed by the false discovery rate two-stage linear step-up procedure of Benjamini, Krieger, and Yekutieli. Only genes showing upregulation ≥ 10 or downregulation ≤ −4 and with a recognized role in cancer, as deduced by the literature, are reported. Mean level of expression ± SD and corrected p values are reported in Table S1. “Ratio” refers to the HBE/LBE ratio. When the expression was higher in LBE, the HBE/LBE ratio was expressed preceded by a “minus” sign. The role of the gene was deduced from the website “genecards.org”, whereas the role of the gene in cancer was deduced by an extensive literature search. The “Reference” column reports either the number in the Reference list or the PubMed accession number. The red or green labels indicate putative tumor-promoting or tumor-restraining changes, respectively.
Table 2. Expression level of glycogenes in HBE and LBE.
Functional ClassGene RatioRole
First steps of O-linked biosynthesisGALNT89.5Addition of the first GalNAc residue of the O-linked chains
B3GNT614.4Synthesis of Core 3 O-glycans by attaching GlcNAc to GalNAc
ST6GALNAC15.4Synthesis of sialyl Tn by attaching Sia to GalNAc
ST6GALNAC22.1Synthesis of sialyl T by attaching Sia to GalNAc of T antigen
Ganglioside biosynthesisST6GALNAC62.5Synthesis of higher gangliosides
Proteoglycan biosynthesisB3GNT76.3Keratan sulfate biosynthesis
Biosynthesis of sialyl Lewis antigensB3GALT54.0Synthesis of type 1 chains
ST3GAL44.0Sialylation of type 2 chains
FUT510.8Fucosylation of type 2 chains
Biosynthesis of Sia6 LacNAc structuresST6GAL1−2.0α2,6 sialylation of glycoproteins
ST6GAL2−2.7α2,6 sialylation of soluble substrates
Galactose recognitionLGALS42.0Galectin 4, expressed in the gut, underexpressed in CRC
LGALS9B2.2Highly similar to Galectin 9
O-glycoproteinsMUC12.0Membrane bound mucin with multiple functions
MUC210.4Secreted mucus forming mucin
MUC45.2Membrane and secreted mucin
MUC5B2.6Gel-forming mucin
The role of glycosyltransferases is indicated in Supplementary Figure S2. Mean level of expression ± SD and corrected p-values are reported in Table S1. “Ratio” indicates the ratio between gene expression in HBE/LBE. When the expression was higher in LBE, the HBE/LBE ratio was expressed with a “minus” sign.
Publisher’s Note: MDPI stays neutral with regard to jurisdictional claims in published maps and institutional affiliations.

