
Simulated Microgravity Inhibits the Proliferation of Chang Liver Cells by Attenuation of the Major Cell Cycle Regulators and Cytoskeletal Proteins

 ,
,  and
and 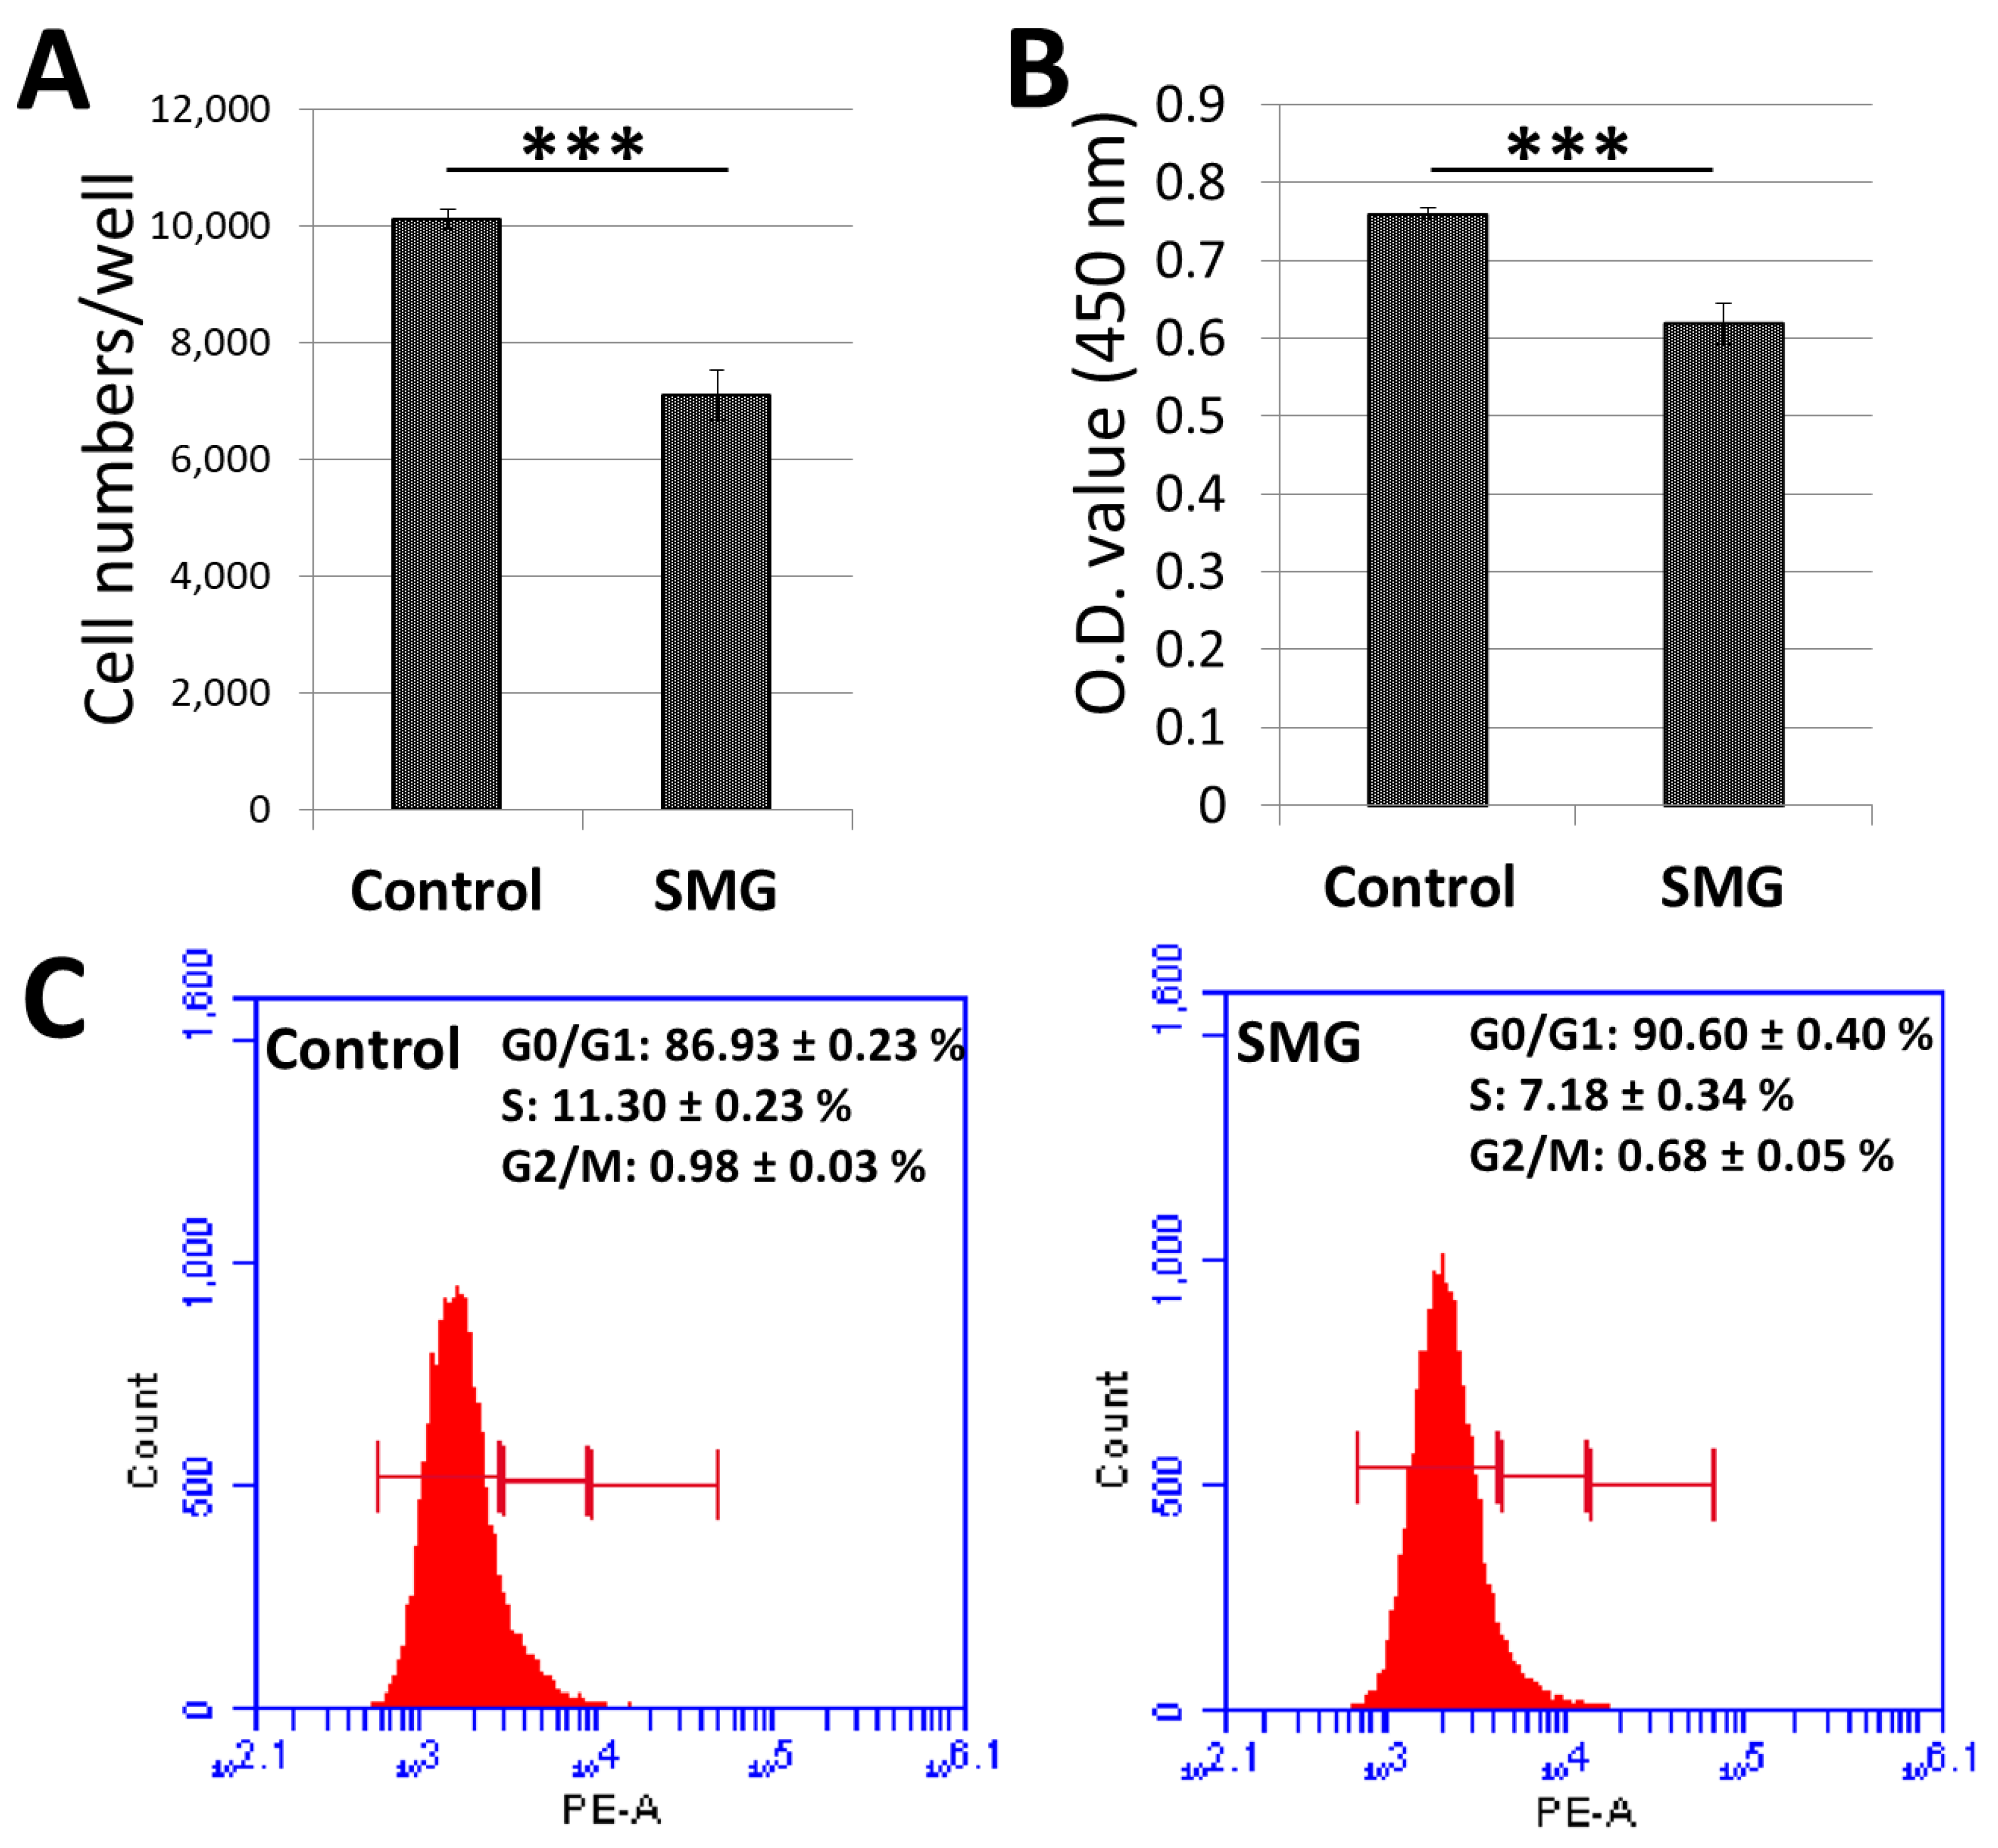
Abstract
:1. Introduction
2. Results
2.1. Proliferation of Chang Liver Cells under SMG
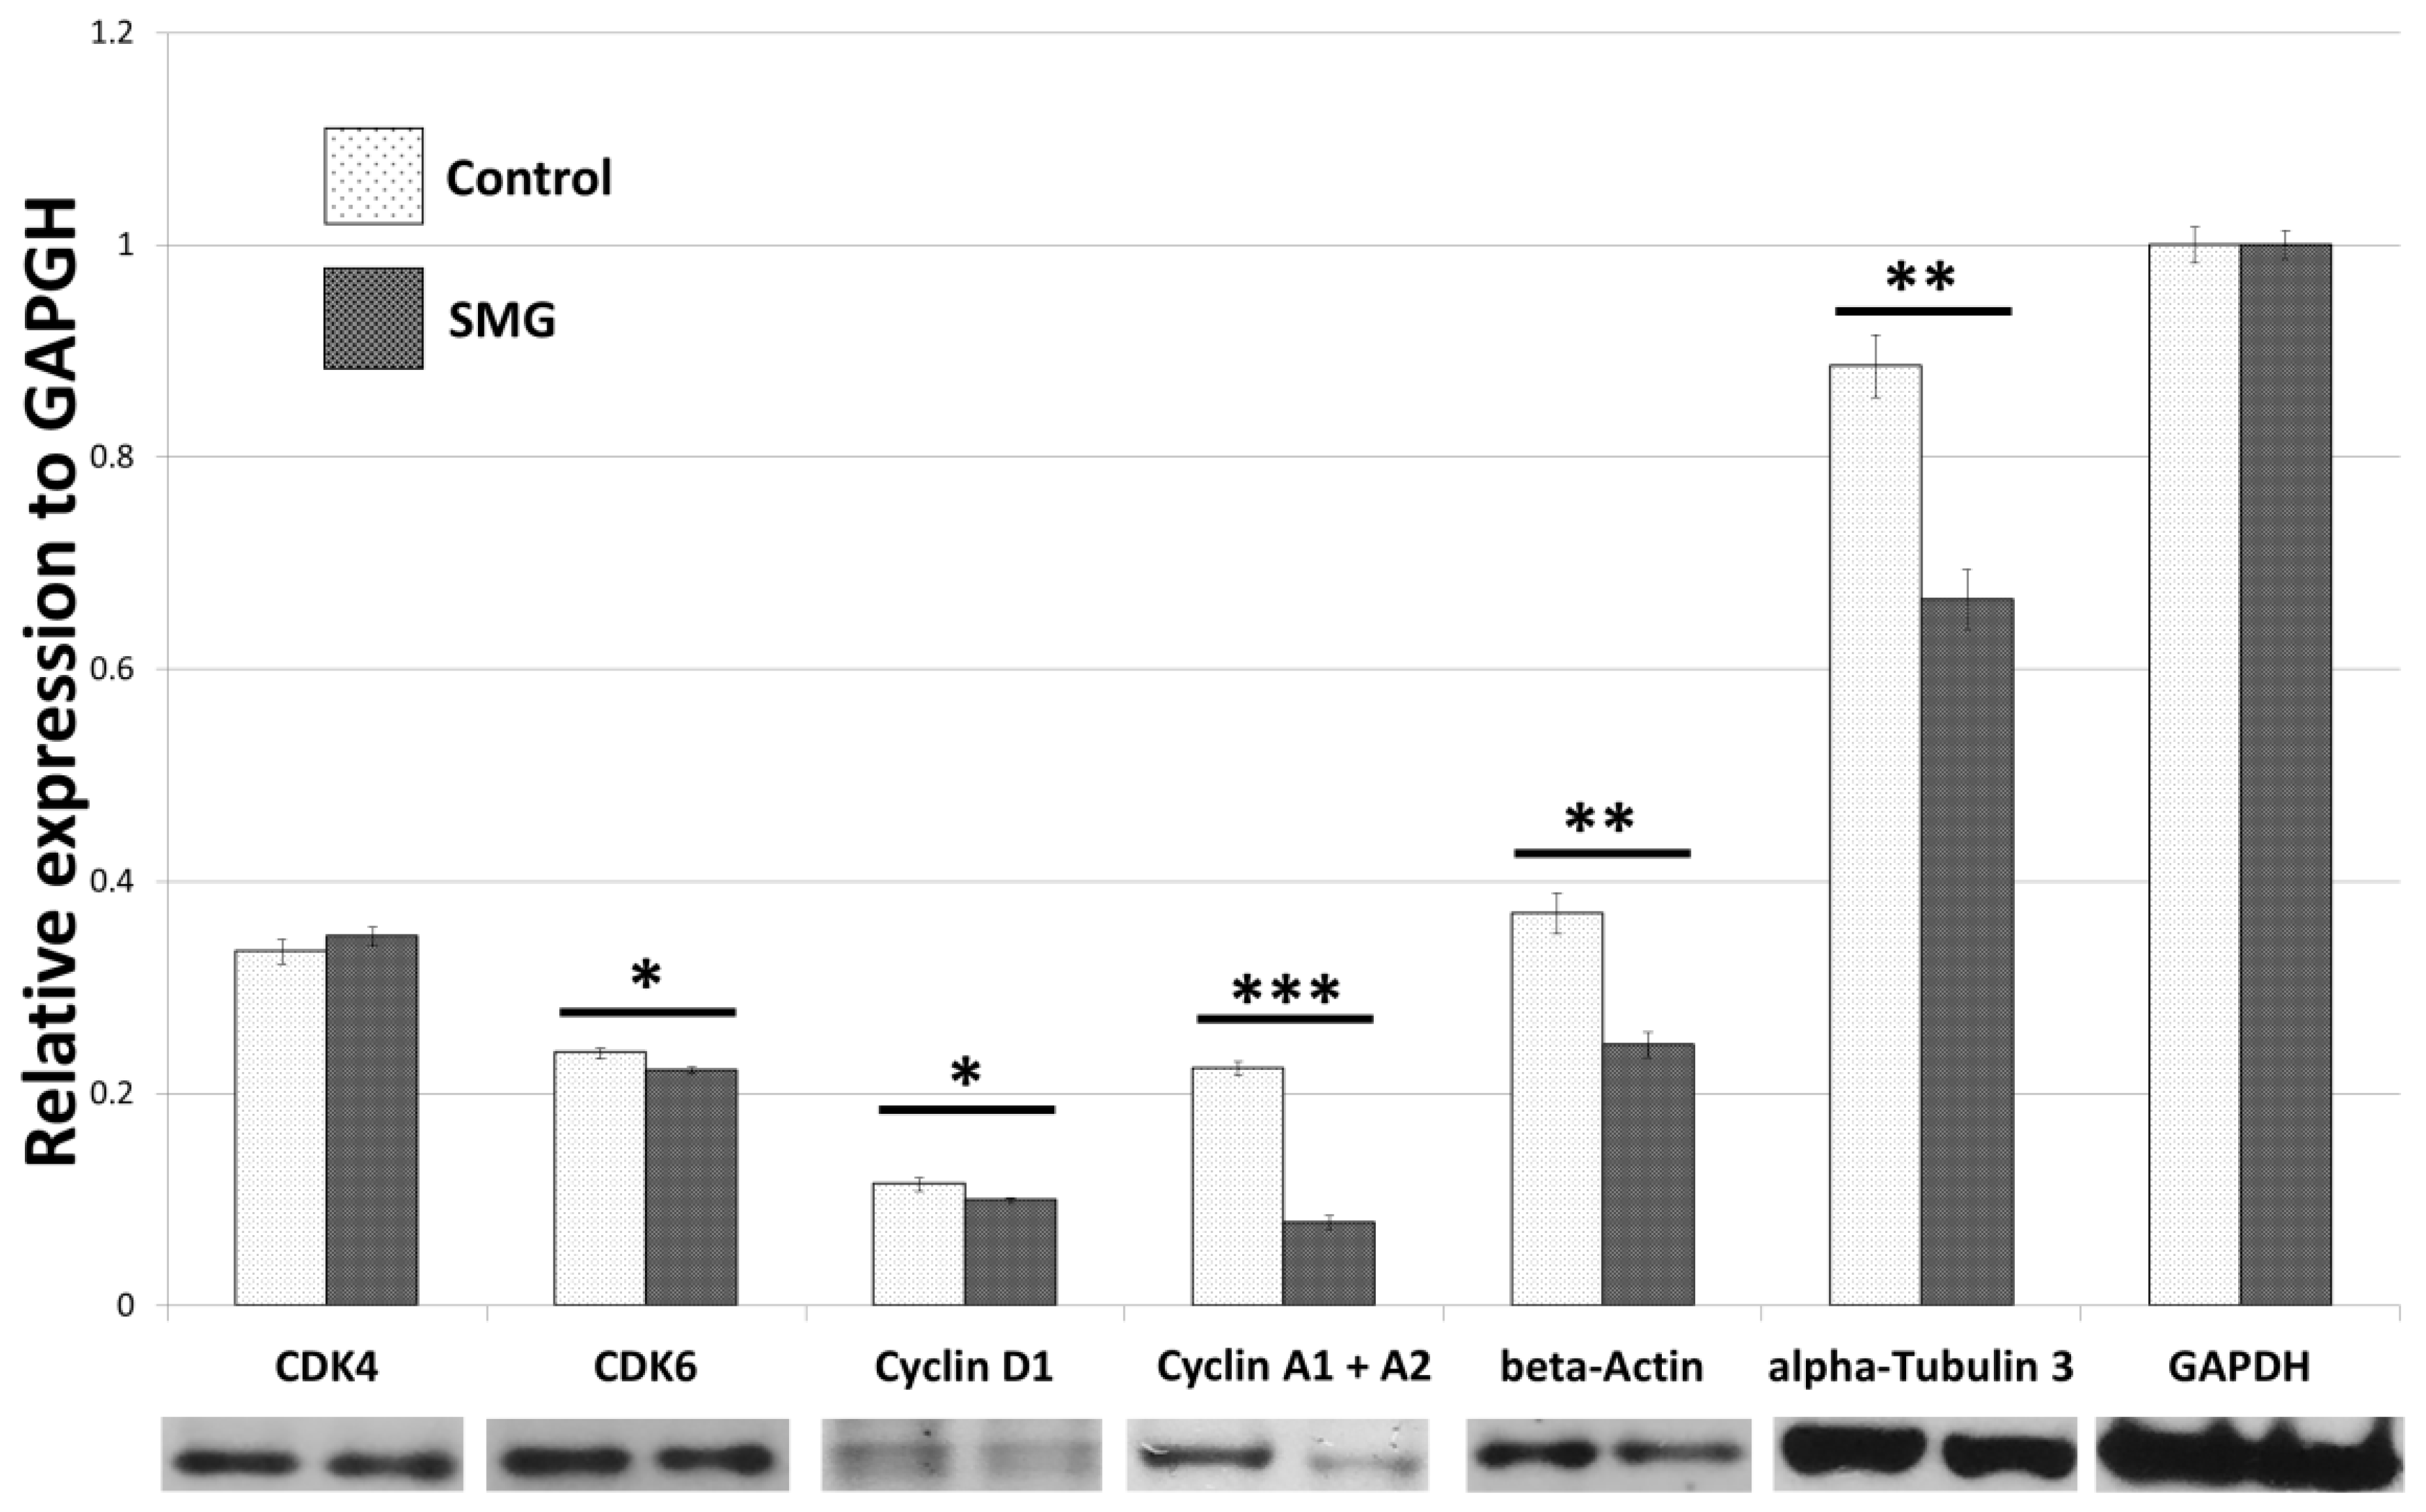
2.2. Effect of SMG on Cell Cycle Regulators
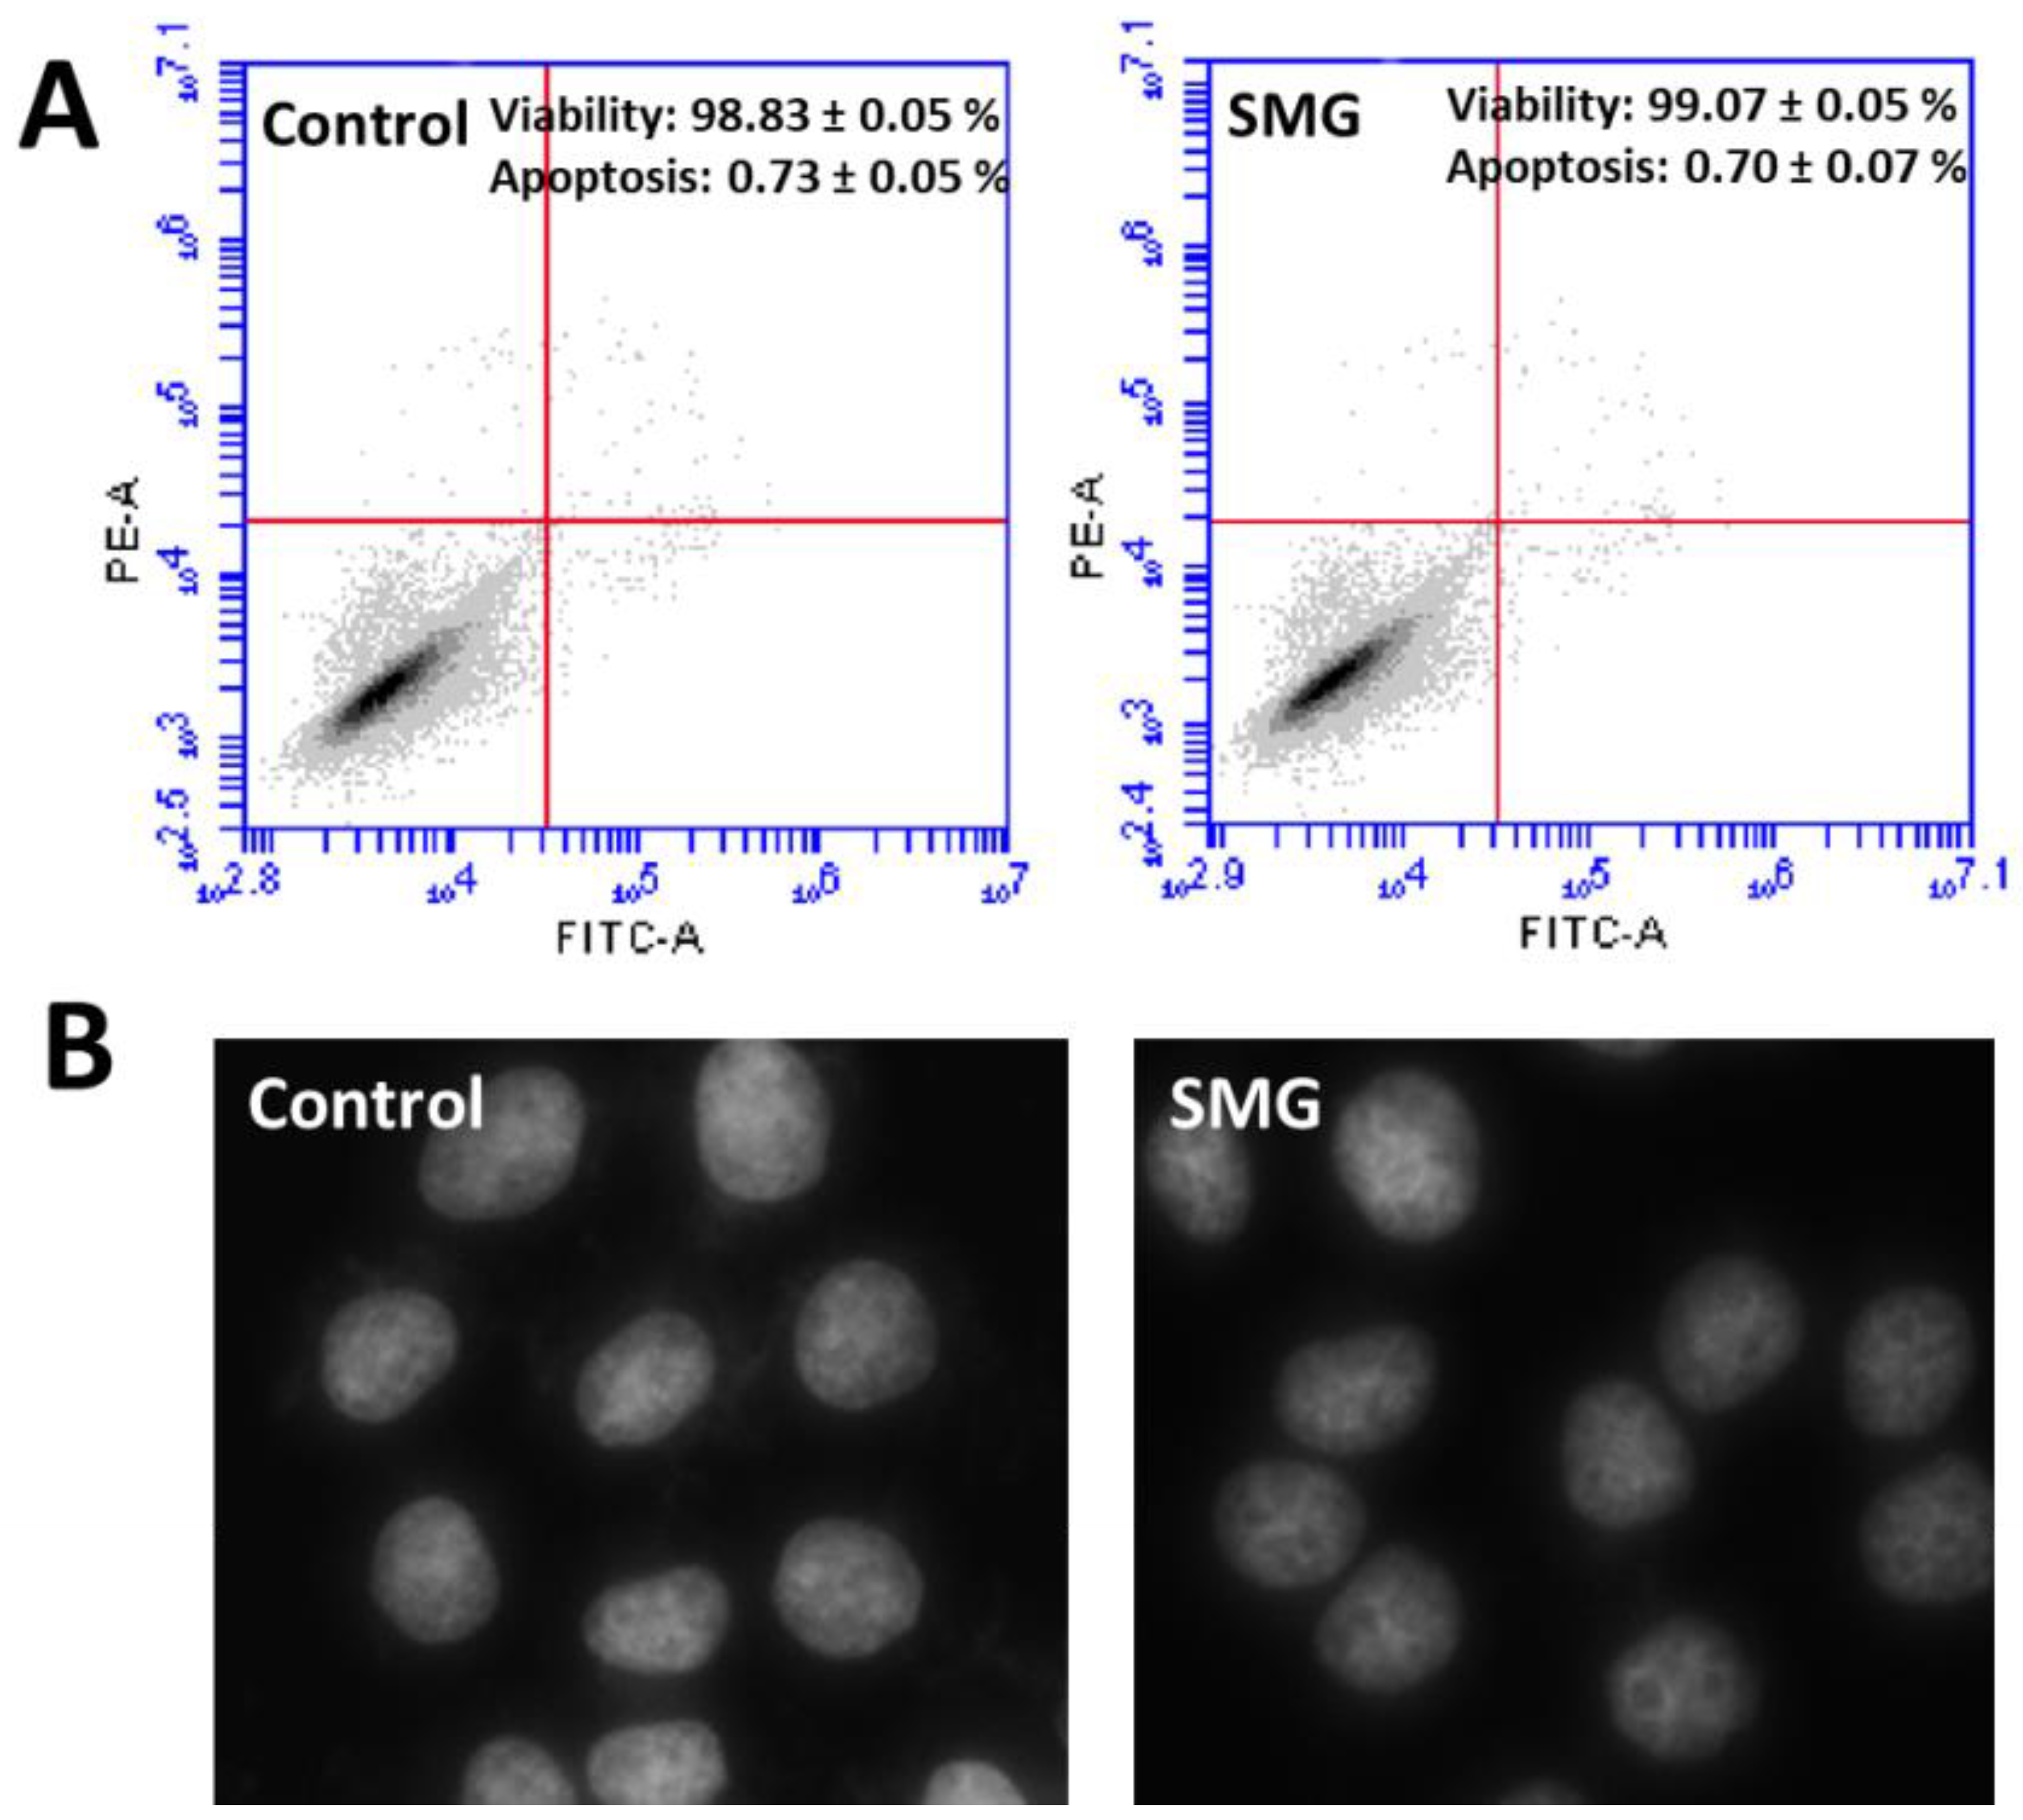
2.3. Apoptosis Analysis
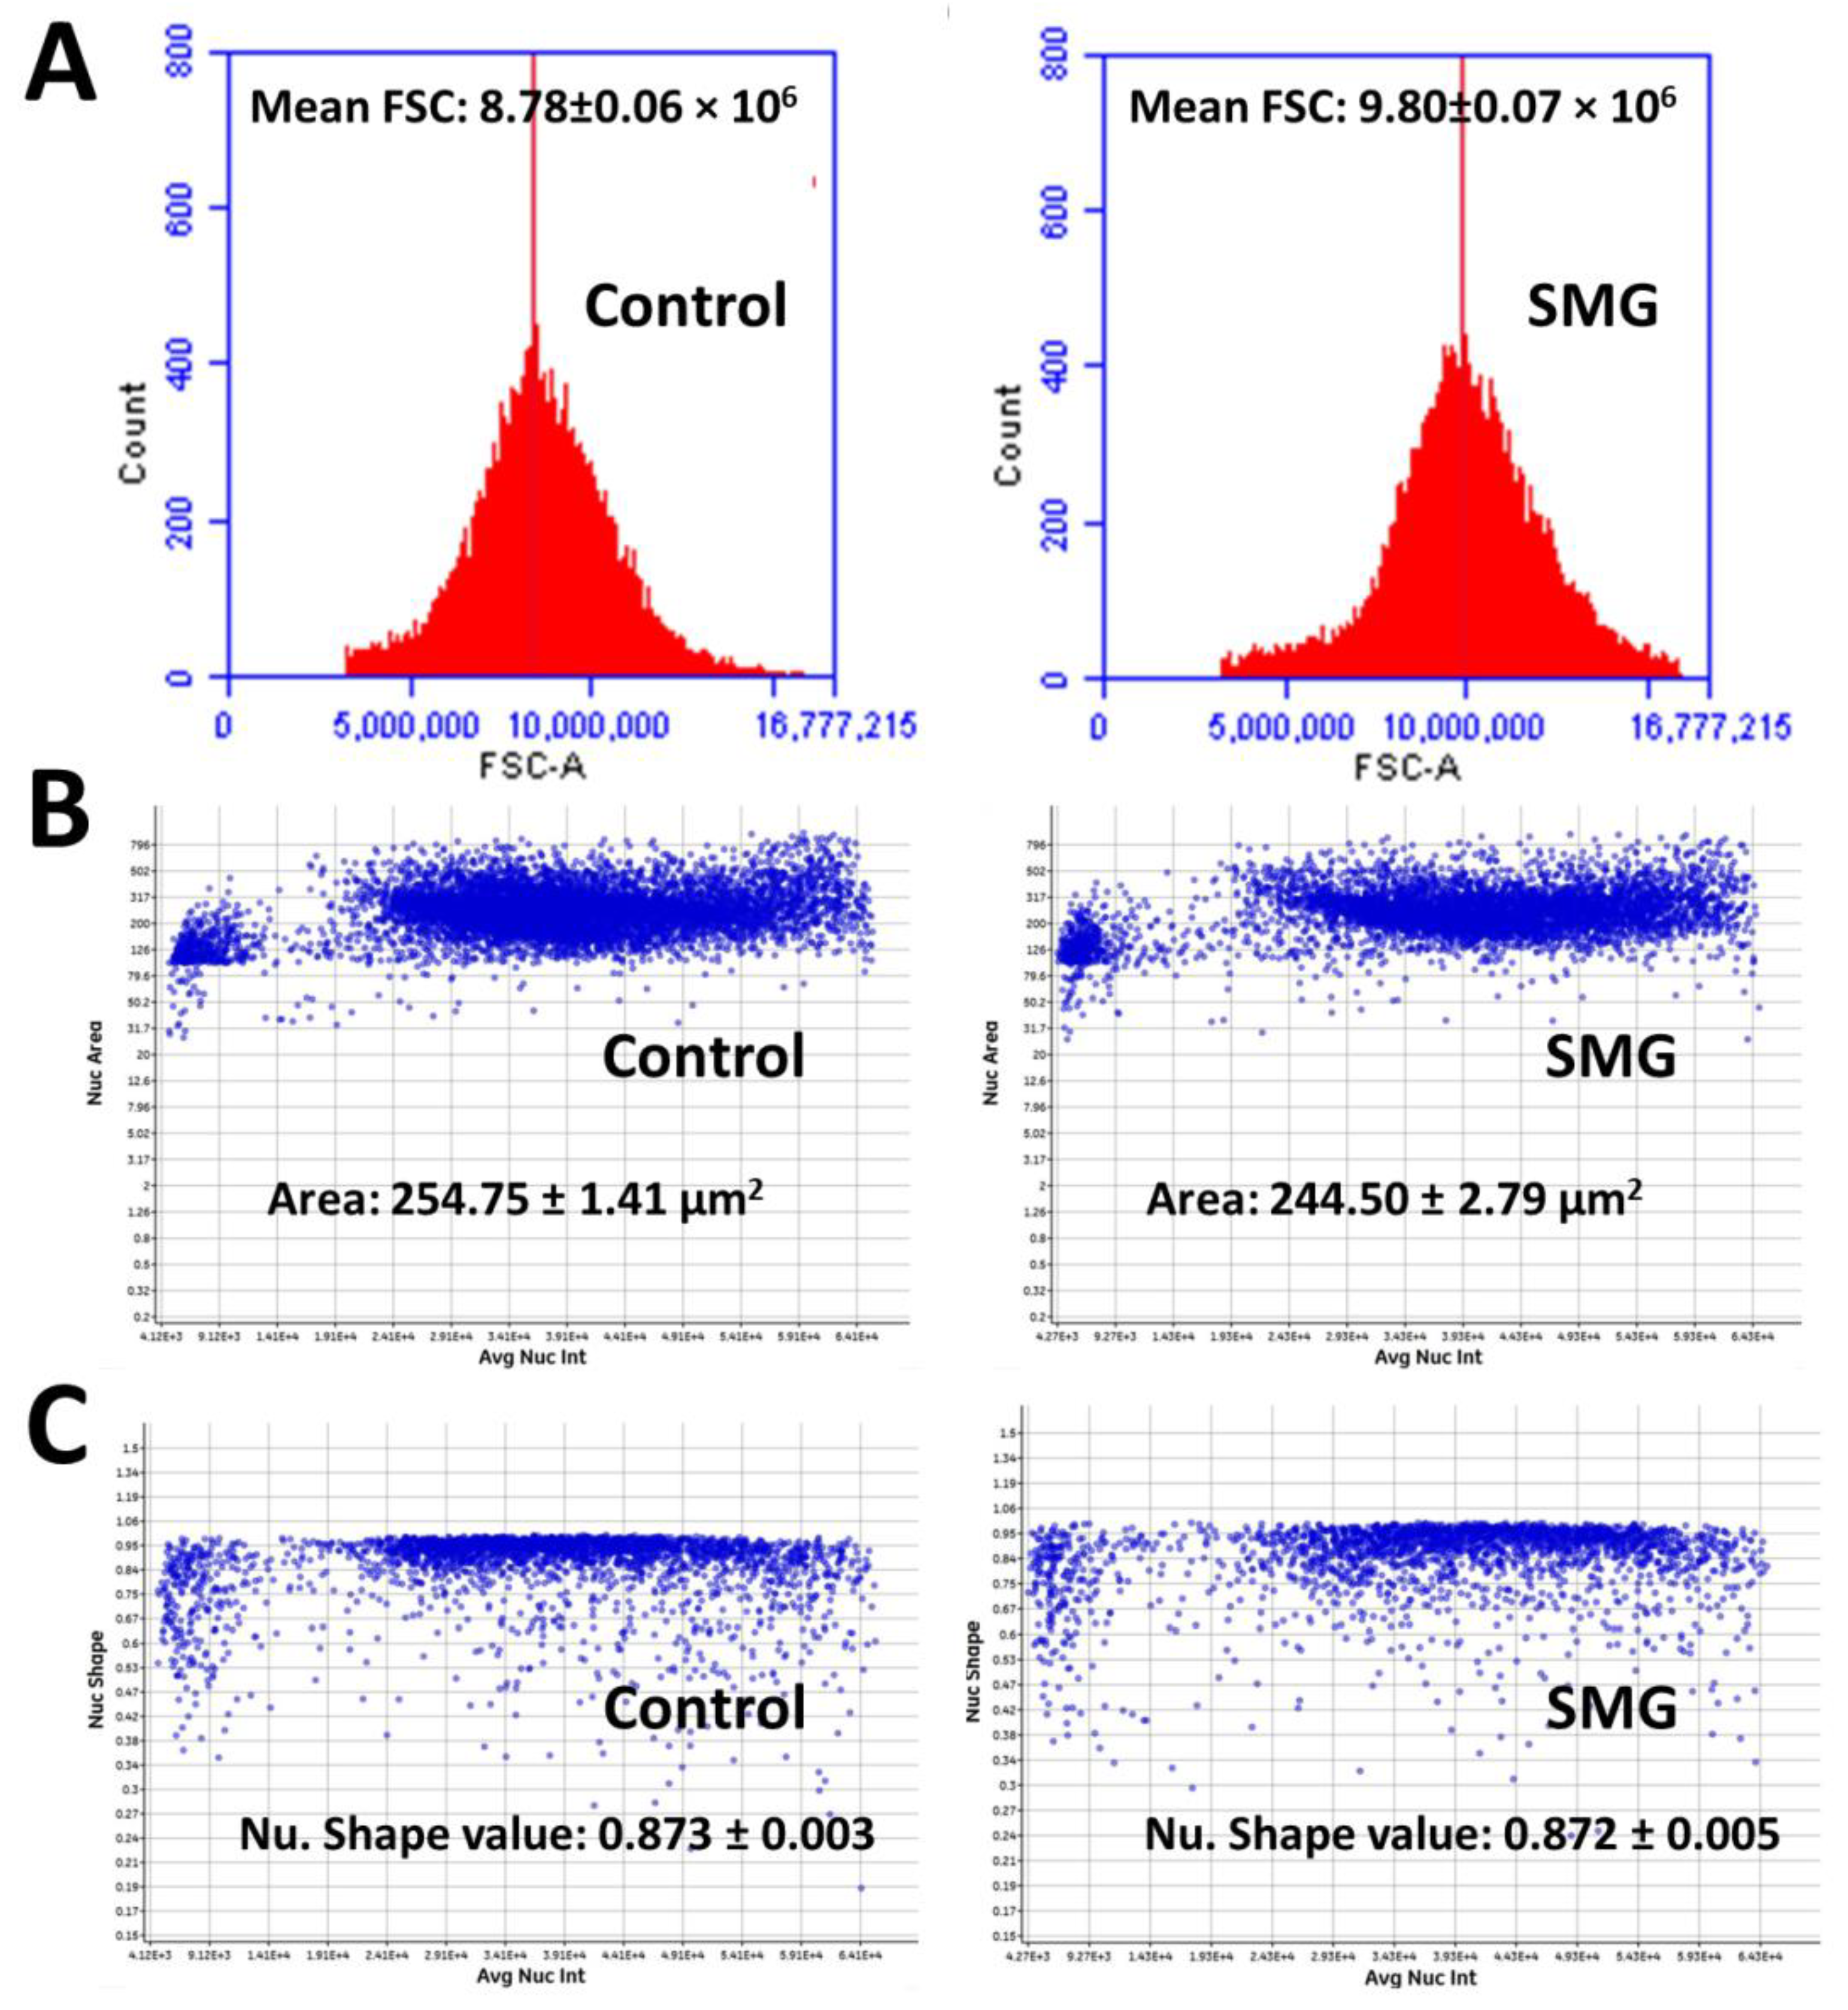
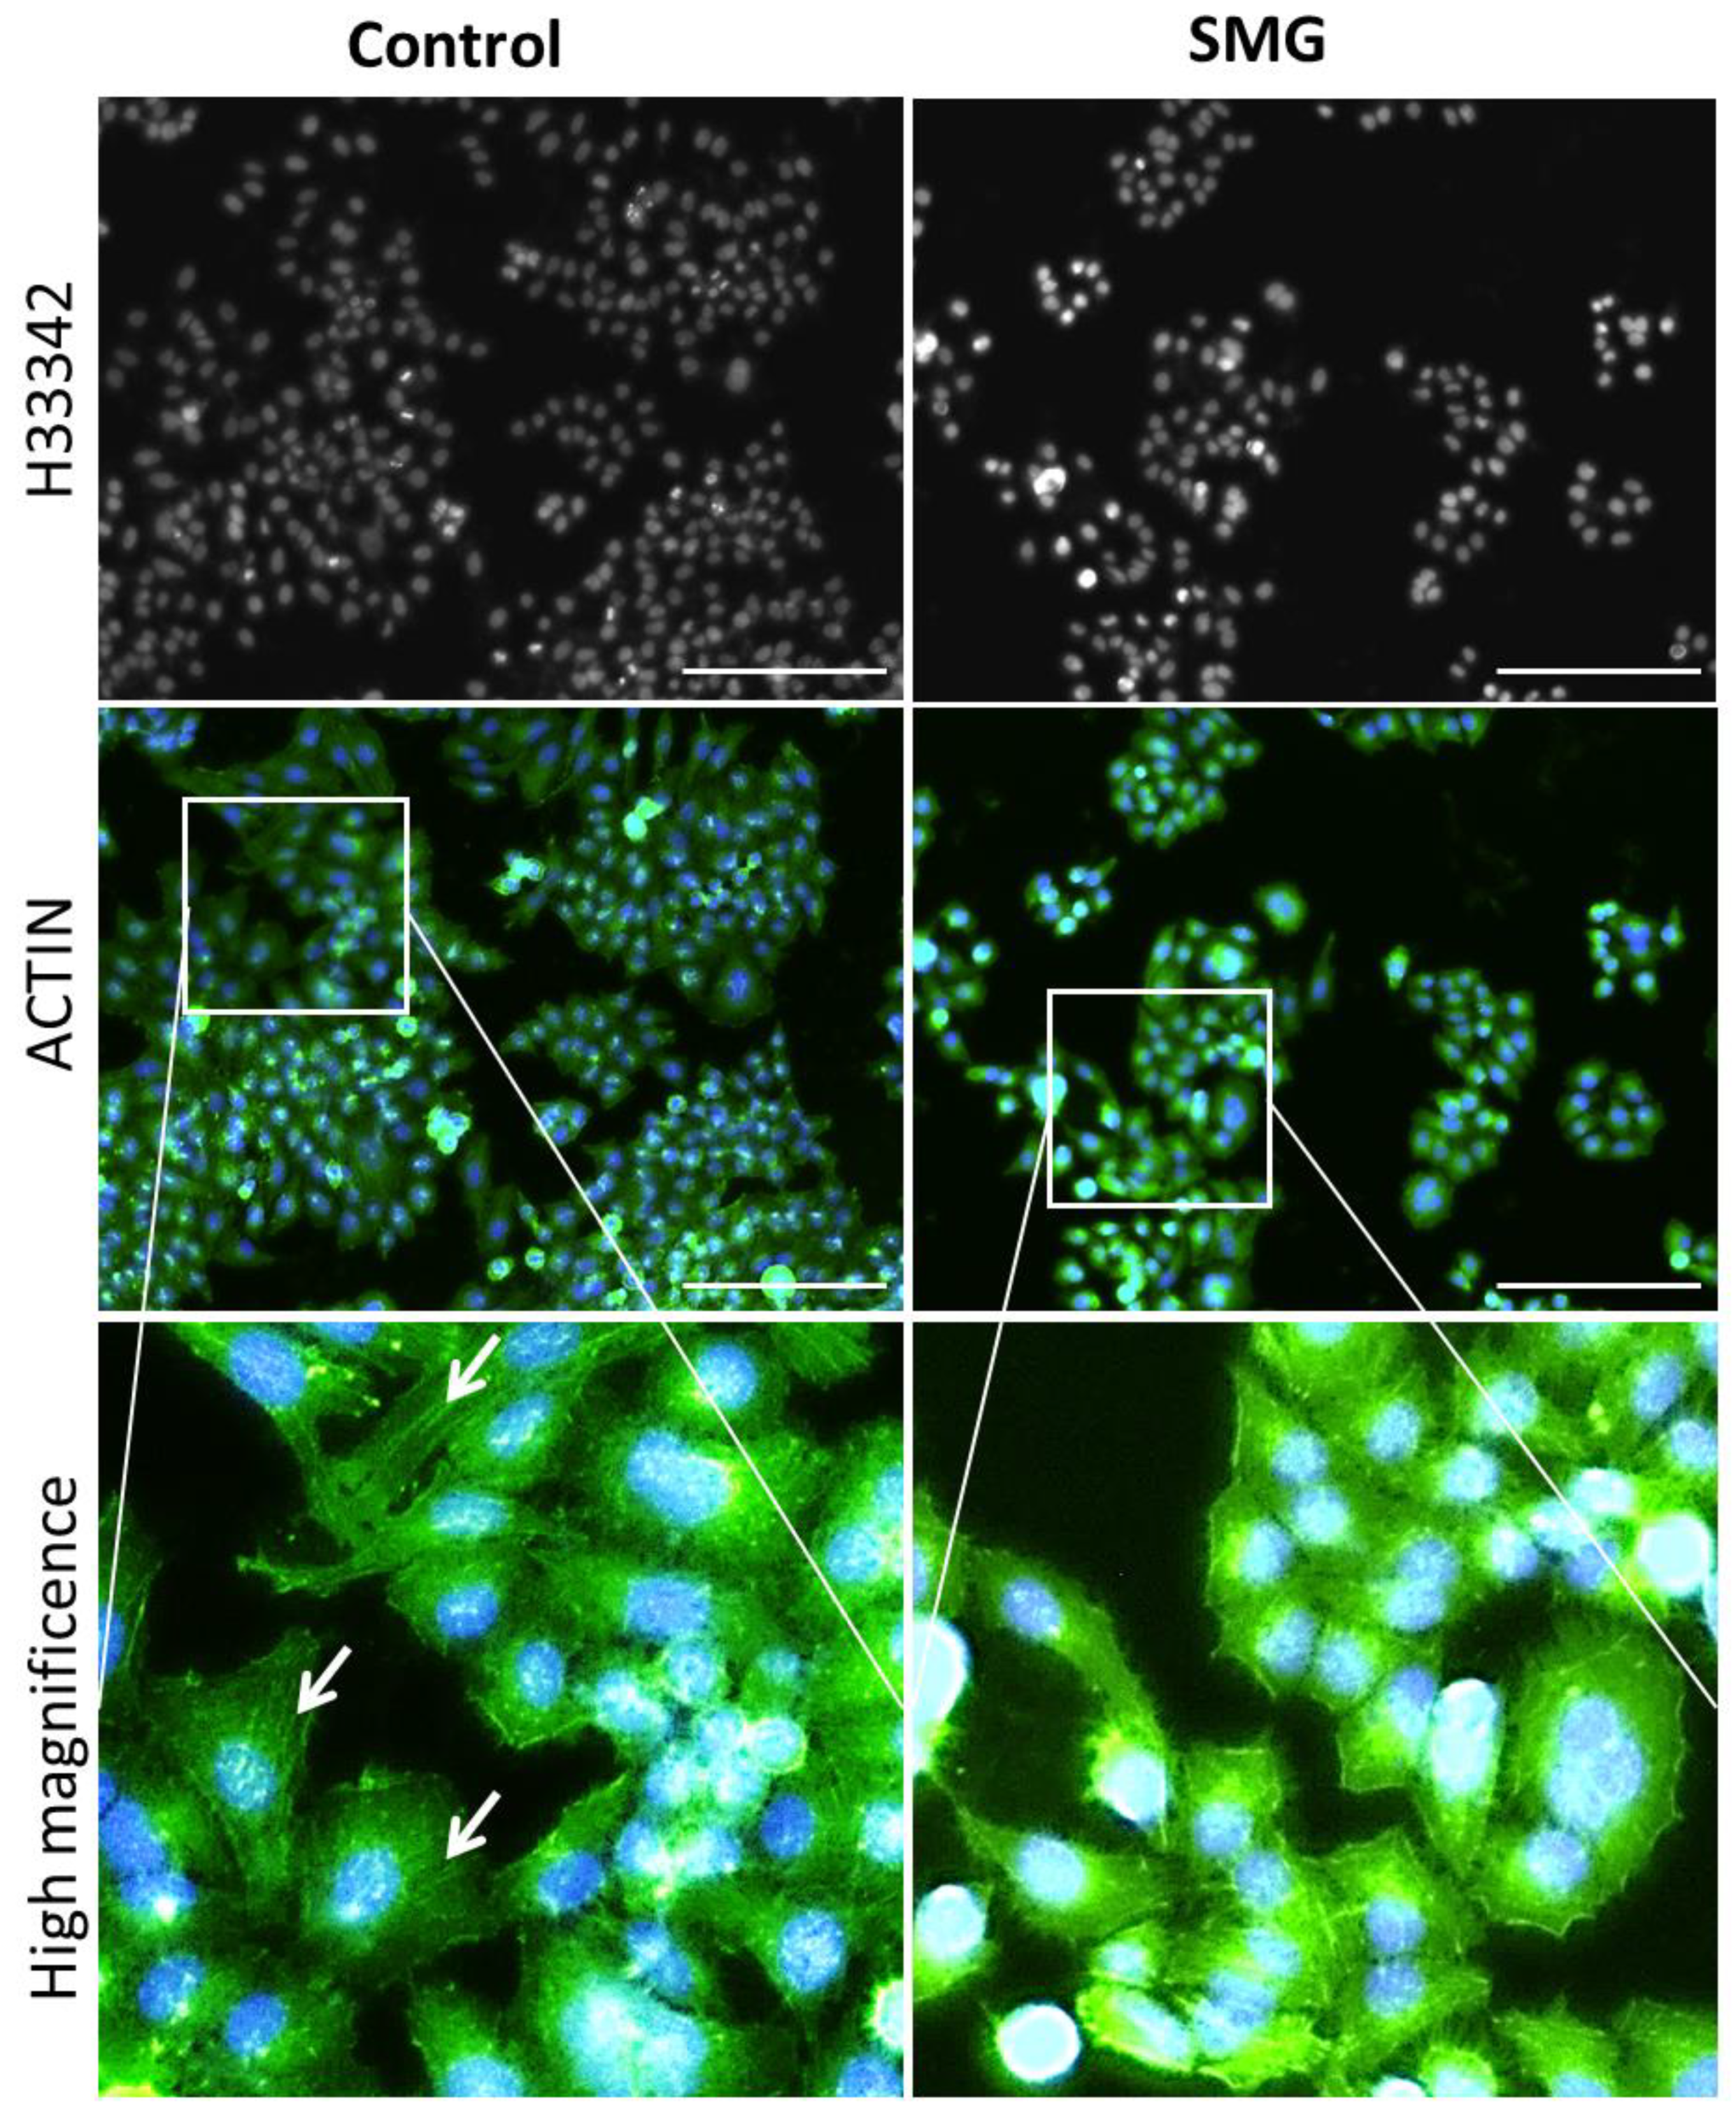
2.4. Morphological Evaluation of CCL-13 Cells under SMG Conditions
2.5. Effects of SMG on Cytoskeletal Protein Expression
3. Discussion
4. Materials and Methods
4.1. Cell Culture
4.2. Cell Density Measurement
4.3. WST-1 Cell Viability Assay
4.4. Flow Cytometry Analysis
4.5. Western Blot Analysis
4.6. Microtubule Staining
4.7. Microfilament Staining and Nuclear Morphology Evaluation
4.8. Statistical Analysis
Supplementary Materials
Author Contributions
Funding
Institutional Review Board Statement
Informed Consent Statement
Data Availability Statement
Conflicts of Interest
Abbreviations
| 2D clinostat | 2-dimensional clinostat |
| 3D clinostat | 3-dimensional clinostat |
| CCL-13 | Chang Liver Cells |
| CDKs | Cyclin-dependent kinases |
| DMEM | Dulbecco’s Modified Eagle Medium |
| F-actin | Filamentous actin |
| FBS | Fetal bovine serum |
| FSC | Forward scatter |
| GAPDH | Glyceraldehyde-3-phosphate dehydrogenase |
| HRP | Horseradish peroxidase |
| IgG | Immunoglobulin G |
| O.D. | Optical density |
| PBS | Phosphate-buffered saline |
| Pen/Strep | Penicillin/streptomycin |
| PI | Propidium iodide |
| SDS-PAGE | Sodium dodecyl sulfate polyacrylamide gel electrophoresis |
| SMG | Simulated microgravity |
| TBST | Tris-buffered saline, 0.1% Tween 20 |
References
- Radtke, A.L.; Herbst-Kralovetz, M.M. Culturing and applications of rotating wall vessel bioreactor derived 3D epithelial cell models. J. Vis. Exp. 2012, 62, 3868. [Google Scholar] [CrossRef] [PubMed] [Green Version]
- Wang, H.; Li, X.; Krause, L.; Görög, M.; Schüler, O.; Hauslage, J.; Hemmersbach, R.; Kircher, S.; Lasok, H.; Haser, T.; et al. 2-D Clinostat for Simulated Microgravity Experiments with Arabidopsis Seedlings. Microgravity Sci. Technol. 2016, 28, 59–66. [Google Scholar] [CrossRef]
- Kim, Y.J.; Jeong, A.J.; Kim, M.; Lee, C.; Ye, S.K.; Kim, S. Time-averaged simulated microgravity (taSMG) inhibits proliferation of lymphoma cells, L-540 and HDLM-2, using a 3D clinostat. Biomed. Eng. Online 2017, 16, 48. [Google Scholar] [CrossRef] [PubMed] [Green Version]
- Damm, T.B.; Richard, S.; Tanner, S.; Wyss, F.; Egli, M.; Franco-Obregon, A. Calcium-dependent deceleration of the cell cycle in muscle cells by simulated microgravity. FASEB J. 2013, 27, 2045–2054. [Google Scholar] [CrossRef]
- Furukawa, T.; Tanimoto, K.; Fukazawa, T.; Imura, T.; Kawahara, Y.; Yuge, L. Simulated microgravity attenuates myogenic differentiation via epigenetic regulations. NPJ Microgravity 2018, 4, 11. [Google Scholar] [CrossRef] [PubMed]
- Otsuka, T.; Imura, T.; Nakagawa, K.; Shrestha, L.; Takahashi, S.; Kawahara, Y.; Sueda, T.; Kurisu, K.; Yuge, L. Simulated microgravity culture enhances the neuroprotective effects of human cranial bone-derived mesenchymal stem cells in traumatic brain injury. Stem Cells Dev. 2018, 27, 1287–1297. [Google Scholar] [CrossRef] [PubMed] [Green Version]
- Brungs, S.; Hauslage, J.; Hemmersbach, R. Validation of Random Positioning Versus Clinorotation Using a Macrophage Model System. Microgravity Sci. Technol. 2019, 31, 223–230. [Google Scholar] [CrossRef] [Green Version]
- Mann, V.; Grimm, D.; Corydon, T.J.; Krüger, M.; Wehland, M.; Riwaldt, S.; Sahana, J.; Kopp, S.; Bauer, J.; Reseland, J.E.; et al. Changes in Human Foetal Osteoblasts Exposed to the Random Positioning Machine and Bone Construct Tissue Engineering. Int. J. Mol. Sci. 2019, 20, 1357. [Google Scholar] [CrossRef] [Green Version]
- Ramirez, L.E.S.; Lim, E.A.; Coimbra, C.F.M.; Kobayashi, M.H. On the dynamics of a spherical scaffold in rotating bioreactors. Biotechnol. Bioeng. 2003, 84, 382–389. [Google Scholar] [CrossRef]
- Hensel, W.; Sievers, A. Effects of prolonged omnilateral gravistimulation on the ultrastructure of statocytes and on the graviresponse of roots. Planta 1980, 150, 338–346. [Google Scholar] [CrossRef]
- Herranz, R.; Anken, R.; Boonstra, J.; Braun, M.; Christianen, P.C.; De Geest, M.; Hauslage, J.; Hilbig, R.; Hill, R.J.; Lebert, M.; et al. Ground-based facilities for simulation of microgravity: Organism-specific recommendations for their use, and recommended terminology. Astrobiology 2013, 13, 1–17. [Google Scholar] [CrossRef] [PubMed] [Green Version]
- Plett, P.A.; Abonour, R.; Frankovitz, S.M.; Orschell, C.M. Impact of modeled microgravity on migration, differentiation, and cell cycle control of primitive human hematopoietic progenitor cells. Exp. Hematol. 2004, 32, 773–781. [Google Scholar] [CrossRef] [PubMed]
- Yan, M.; Wang, Y.; Yang, M.; Liu, Y.; Qu, B.; Ye, Z.; Liang, W.; Sun, X.; Luo, Z. The effects and mechanisms of clinorotation on proliferation and differentiation in bone marrow mesenchymal stem cells. Biochem. Biophys. Res. Commun. 2015, 460, 327–332. [Google Scholar] [CrossRef]
- Touchstone, H.; Bryd, R.; Loisate, S.; Thompson, M.; Kim, S.; Puranam, K.; Senthilnathan, A.N.; Pu, X.; Beard, R.; Rubin, J.; et al. Recovery of stem cell proliferation by low intensity vibration under simulated microgravity requires LINC complex. NPJ Microgravity 2019, 5, 11. [Google Scholar] [CrossRef] [PubMed]
- Griffoni, C.; Di Molfetta, S.; Fantozzi, L.; Zanetti, C.; Pippia, P.; Tomasi, V.; Spisni, E. Modification of proteins secreted by endothelial cells during modeled low gravity exposure. J. Cell. Biochem. 2011, 112, 265–272. [Google Scholar] [CrossRef]
- Mao, X.; Chen, Z.; Luo, Q.; Zhang, B.; Song, G. Simulated microgravity inhibits the migration of mesenchymal stem cells by remodeling actin cytoskeleton and increasing cell stiffness. Cytotechnology 2016, 68, 2235–2243. [Google Scholar] [CrossRef] [PubMed]
- Masiello, M.G.; Cucina, A.; Proietti, S.; Palombo, A.; Coluccia, P.; D’Anselmi, F.; Dinicola, S.; Pasqualato, A.; Morini, V.; Bizzarri, M. Phenotypic Switch Induced by Simulated Microgravity on MDA-MB-231 Breast Cancer Cells. Biomed. Res. Int. 2014, 2014, 652434. [Google Scholar] [CrossRef]
- Lin, S.C.; Gou, G.H.; Hsia, C.W.; Ho, C.W.; Huang, K.L.; Wu, Y.F.; Lee, S.Y.; Chen, Y.H. Simulated Microgravity Disrupts Cytoskeleton Organization and Increases Apoptosis of Rat Neural Crest Stem Cells Via Upregulating CXCR4 Expression and RhoA-ROCK1-p38 MAPK-p53 Signaling. Stem Cells Dev. 2016, 25, 1172–1193. [Google Scholar] [CrossRef]
- Nassef, M.Z.; Kopp, S.; Wehland, M.; Melnik, D.; Sahana, J.; Krüger, M.; Corydon, T.J.; Oltmann, H.; Schmitz, B.; Schütte, A.; et al. Real Microgravity Influences the Cytoskeleton and Focal Adhesions in Human Breast Cancer Cells. Int. J. Mol. Sci. 2019, 20, 3156. [Google Scholar] [CrossRef] [Green Version]
- Beheshti, A.; Chakravarty, K.; Fogle, H.; Fazelinia, H.; Silveira, W.A.D.; Boyko, V.; Polo, S.L.; Saravia-Butler, A.M.; Hardiman, G.; Taylor, D.; et al. Multi-omics analysis of multiple missions to space reveal a theme of lipid dysregulation in mouse liver. Sci. Rep. 2019, 9, 19195. [Google Scholar] [CrossRef]
- Chen, B.; Guo, J.; Wang, S.; Kang, L.; Deng, Y.; Li, Y. Simulated Microgravity Altered the Metabolism of Loureirin B and the Expression of Major Cytochrome P450 in Liver of Rats. Front. Pharmacol. 2018, 9, 1130. [Google Scholar] [CrossRef]
- Rui, L. Energy metabolism in the liver. Compr. Physiol. 2014, 4, 177–197. [Google Scholar] [PubMed] [Green Version]
- Yang, T.; Li, C.; Zhang, L.; Li, M.; Zhou, P. A Promising Hepatocyte-Like Cell Line, CCL-13, Exhibits Good Liver Function Both In Vitro and in an Acute Liver Failure Model. Transplant. Proc. 2013, 45, 688–694. [Google Scholar] [CrossRef] [PubMed]
- Khaoustov, V.I.; Darlington, G.J.; Soriano, H.E.; Krishnan, B.; Risin, D.; Pellis, N.R.; Yoffe, B. Induction of three-dimensional assembly of human liver cells by simulated microgravity. Vitro Cell Dev. Biol. Anim. 1999, 35, 501–509. [Google Scholar] [CrossRef]
- Sarika, P.R.; James, N.R.; Anilkumar, P.R.; Raj, D.K.; Kumary, T.V. Microgravity as a means to incorporate HepG2 aggregates in polysaccharide–protein hybrid scaffold. J. Mater. Sci. Mater. Med. 2016, 27, 27. [Google Scholar] [CrossRef]
- Nelson, L.J.; Walker, S.W.; Hayes, P.C.; Plevris, J.N. Low-shear modelled microgravity environment maintains morphology and differentiated functionality of primary porcine hepatocyte cultures. Cells Tissues Organs 2010, 192, 125–140. [Google Scholar] [CrossRef] [Green Version]
- Snyder, J.E.; Emami, K.; Du, B.; Zhang, Y.; Wu, H.; Sun, W. Effect of model microgravity on human hepatic pharmacokinetics and urea secretion. In Proceedings of the 38th Annual Northeast Bioengineering Conference (NEBEC), Philadelphia, PA, USA, 16–18 March 2012; pp. 171–172. [Google Scholar]
- Costantini, D.; Overi, D.; Casadei, L.; Cardinale, V.; Nevi, L.; Carpino, G.; Di Matteo, S.; Safarikia, S.; Valerio, M.; Melandro, F.; et al. Simulated microgravity promotes the formation of tridimensional cultures and stimulates pluripotency and a glycolytic metabolism in human hepatic and biliary tree stem/progenitor cells. Sci. Rep. 2019, 9, 5559. [Google Scholar] [CrossRef] [Green Version]
- Tan, X.; Xu, A.; Zhao, T.; Zhao, Q.; Zhang, J.; Fan, C.; Deng, Y.; Freywald, A.; Genth, H.; Xiang, J. Simulated microgravity inhibits cell focal adhesions leading to reduced melanoma cell proliferation and metastasis via FAK/RhoA-regulated mTORC1 and AMPK pathways. Sci. Rep. 2018, 8, 3769. [Google Scholar] [CrossRef] [Green Version]
- Benavides Damm, T.; Walther, I.; Wüest, S.L.; Sekler, J.; Egli, M. Cell cultivation under different gravitational loads using a novel random positioning incubator. Biotechnol. Bioeng. 2014, 111, 1180–1190. [Google Scholar] [CrossRef] [Green Version]
- Sherr, C.J.; Roberts, J.M. Living with or without cyclins and cyclin-dependent kinases. Genes Dev. 2004, 18, 2699–2711. [Google Scholar] [CrossRef] [PubMed] [Green Version]
- Ji, P.; Agrawal, S.; Diederichs, S.; Bäumer, N.; Becker, A.; Cauvet, T.; Kowski, S.; Beger, C.; Welte, K.; Berdel, W.E.; et al. Cyclin A1, the alternative A-type cyclin, contributes to G1/S cell cycle progression in somatic cells. Oncogene 2005, 24, 2739–2744. [Google Scholar] [CrossRef] [PubMed] [Green Version]
- Kalaszczynska, I.; Geng, Y.; Iino, T.; Mizuno, S.; Choi, Y.; Kondratiuk, I.; Silver, D.P.; Wolgemuth, D.J.; Akashi, K.; Sicinski, P. Cyclin A is redundant in fibroblasts but essential in hematopoietic and embryonic stem cells. Cell 2009, 138, 352–365. [Google Scholar] [CrossRef] [Green Version]
- Arsic, N.; Bendris, N.; Peter, M.; Begon-Pescia, C.; Rebouissou, C.; Gadéa, G.; Bouquier, N.; Bibeau, F.; Lemmers, B.; Blanchard, J.M. A novel function for Cyclin A2: Control of cell invasion via RhoA signaling. J. Cell. Biol. 2012, 196, 147–162. [Google Scholar] [CrossRef] [PubMed] [Green Version]
- Loukil, A.; Cheung, C.T.; Bendris, N.; Lemmers, B.; Peter, M.; Blanchard, J.M. Cyclin A2: At the crossroads of cell cycle and cell invasion. World J. Biol. Chem. 2015, 6, 346–350. [Google Scholar] [CrossRef] [PubMed]
- Harbour, J.W.; Luo, R.X.; Dei Santi, A.; Postigo, A.A.; Dean, D.C. Cdk phosphorylation triggers sequential intramolecular interactions that progressively block Rb functions as cells move through G1. Cell 1999, 98, 859–869. [Google Scholar] [CrossRef] [Green Version]
- Huang, X.; Di Liberto, M.; Jayabalan, D.; Liang, J.; Ely, S.; Bretz, J.; Shaffer, A.L., 3rd; Louie, T.; Chen, I.; Randolph, S.; et al. Prolonged early G(1) arrest by selective CDK4/CDK6 inhibition sensitizes myeloma cells to cytotoxic killing through cell cycle-coupled loss of IRF4. Blood 2012, 120, 1095–1106. [Google Scholar] [CrossRef] [Green Version]
- Tigan, A.S.; Bellutti, F.; Kollmann, K.; Tebb, G.; Sexl, V. CDK6—a review of the past and a glimpse into the future: From cell-cycle control to transcriptional regulation. Oncogene 2016, 35, 3083–3091. [Google Scholar] [CrossRef]
- Webster, M.; Witkin, K.L.; Cohen-Fix, O. Sizing up the nucleus: Nuclear shape, size and nuclear-envelope assembly. J. Cell Sci. 2009, 122, 1477–1486. [Google Scholar] [CrossRef] [Green Version]
- Maeshima, K.; Iino, H.; Hihara, S.; Imamoto, N. Nuclear size, nuclear pore number and cell cycle. Nucleus 2011, 2, 113–118. [Google Scholar] [CrossRef] [PubMed] [Green Version]
- Fletcher, D.A.; Mullins, R.D. Cell mechanics and the cytoskeleton. Nature 2010, 463, 485–492. [Google Scholar] [CrossRef] [Green Version]
- Nakaseko, Y.; Yanagida, M. Cytoskeleton in the cell cycle. Nature 2001, 412, 291–292. [Google Scholar] [CrossRef] [PubMed]
- Cohen-Fix, O. Sister chromatid separation: Falling apart at the seams. Curr. Biol. 2000, 10, R816–R819. [Google Scholar] [CrossRef] [Green Version]
- Spira, F.; Cuylen-Haering, S.; Mehta, S.; Samwer, M.; Reversat, A.; Verma, A.; Oldenbourg, R.; Sixt, M.; Gerlich, D.W. Cytokinesis in vertebrate cells initiates by contraction of an equatorial actomyosin network composed of randomly oriented filaments. Elife 2017, 6, e30867. [Google Scholar] [CrossRef]
- Zhong, Z.; Yeow, W.S.; Zou, C.; Wassell, R.; Wang, C.; Pestell, R.G.; Quong, J.N.; Quong, A.A. Cyclin D1/cyclin-dependent kinase 4 interacts with filamin A and affects the migration and invasion potential of breast cancer cells. Cancer Res. 2010, 70, 2105–2114. [Google Scholar] [CrossRef] [Green Version]
- Bendris, N.; Lemmers, B.; Blanchard, J.M. Cell cycle, cytoskeleton dynamics and beyond: The many functions of cyclins and CDK inhibitors. Cell Cycle 2015, 14, 1786–1798. [Google Scholar] [CrossRef] [Green Version]
- Uras, I.Z.; Scheicher, R.M.; Kollmann, K.; Glösmann, M.; Prchal-Murphy, M.; Tigan, A.S.; Fux, D.A.; Altamura, S.; Neves, J.; Muckenthaler, M.U.; et al. Cdk6 contributes to cytoskeletal stability in erythroid cells. Haematologica 2017, 102, 995–1005. [Google Scholar] [CrossRef] [PubMed]
- Leguy, C.A.D.; Delfos, R.; Pourquie, M.J.B.M.; Poelma, C.; Krooneman, J.; Westerweel, J.; van Loon, J.J.W.A. Fluid dynamics during Random Positioning Machine micro-gravity experiments. Adv. Space Res. 2017, 59, 3045–3057. [Google Scholar] [CrossRef]
- Son, H.N.; Chi, H.N.Q.; Chung, D.C.; Long, L.T. Morphological changes during replicative senescence in bovine ovarian granulosa cells. Cell Cycle 2019, 18, 1490–1497. [Google Scholar] [CrossRef]


Publisher’s Note: MDPI stays neutral with regard to jurisdictional claims in published maps and institutional affiliations. |
© 2021 by the authors. Licensee MDPI, Basel, Switzerland. This article is an open access article distributed under the terms and conditions of the Creative Commons Attribution (CC BY) license (https://creativecommons.org/licenses/by/4.0/).
Share and Cite
Ho, C.N.Q.; Tran, M.T.; Doan, C.C.; Hoang, S.N.; Tran, D.H.; Le, L.T. Simulated Microgravity Inhibits the Proliferation of Chang Liver Cells by Attenuation of the Major Cell Cycle Regulators and Cytoskeletal Proteins. Int. J. Mol. Sci. 2021, 22, 4550. https://0-doi-org.brum.beds.ac.uk/10.3390/ijms22094550
Ho CNQ, Tran MT, Doan CC, Hoang SN, Tran DH, Le LT. Simulated Microgravity Inhibits the Proliferation of Chang Liver Cells by Attenuation of the Major Cell Cycle Regulators and Cytoskeletal Proteins. International Journal of Molecular Sciences. 2021; 22(9):4550. https://0-doi-org.brum.beds.ac.uk/10.3390/ijms22094550
Chicago/Turabian StyleHo, Chi Nguyen Quynh, Minh Thi Tran, Chung Chinh Doan, Son Nghia Hoang, Diem Hong Tran, and Long Thanh Le. 2021. "Simulated Microgravity Inhibits the Proliferation of Chang Liver Cells by Attenuation of the Major Cell Cycle Regulators and Cytoskeletal Proteins" International Journal of Molecular Sciences 22, no. 9: 4550. https://0-doi-org.brum.beds.ac.uk/10.3390/ijms22094550