Article

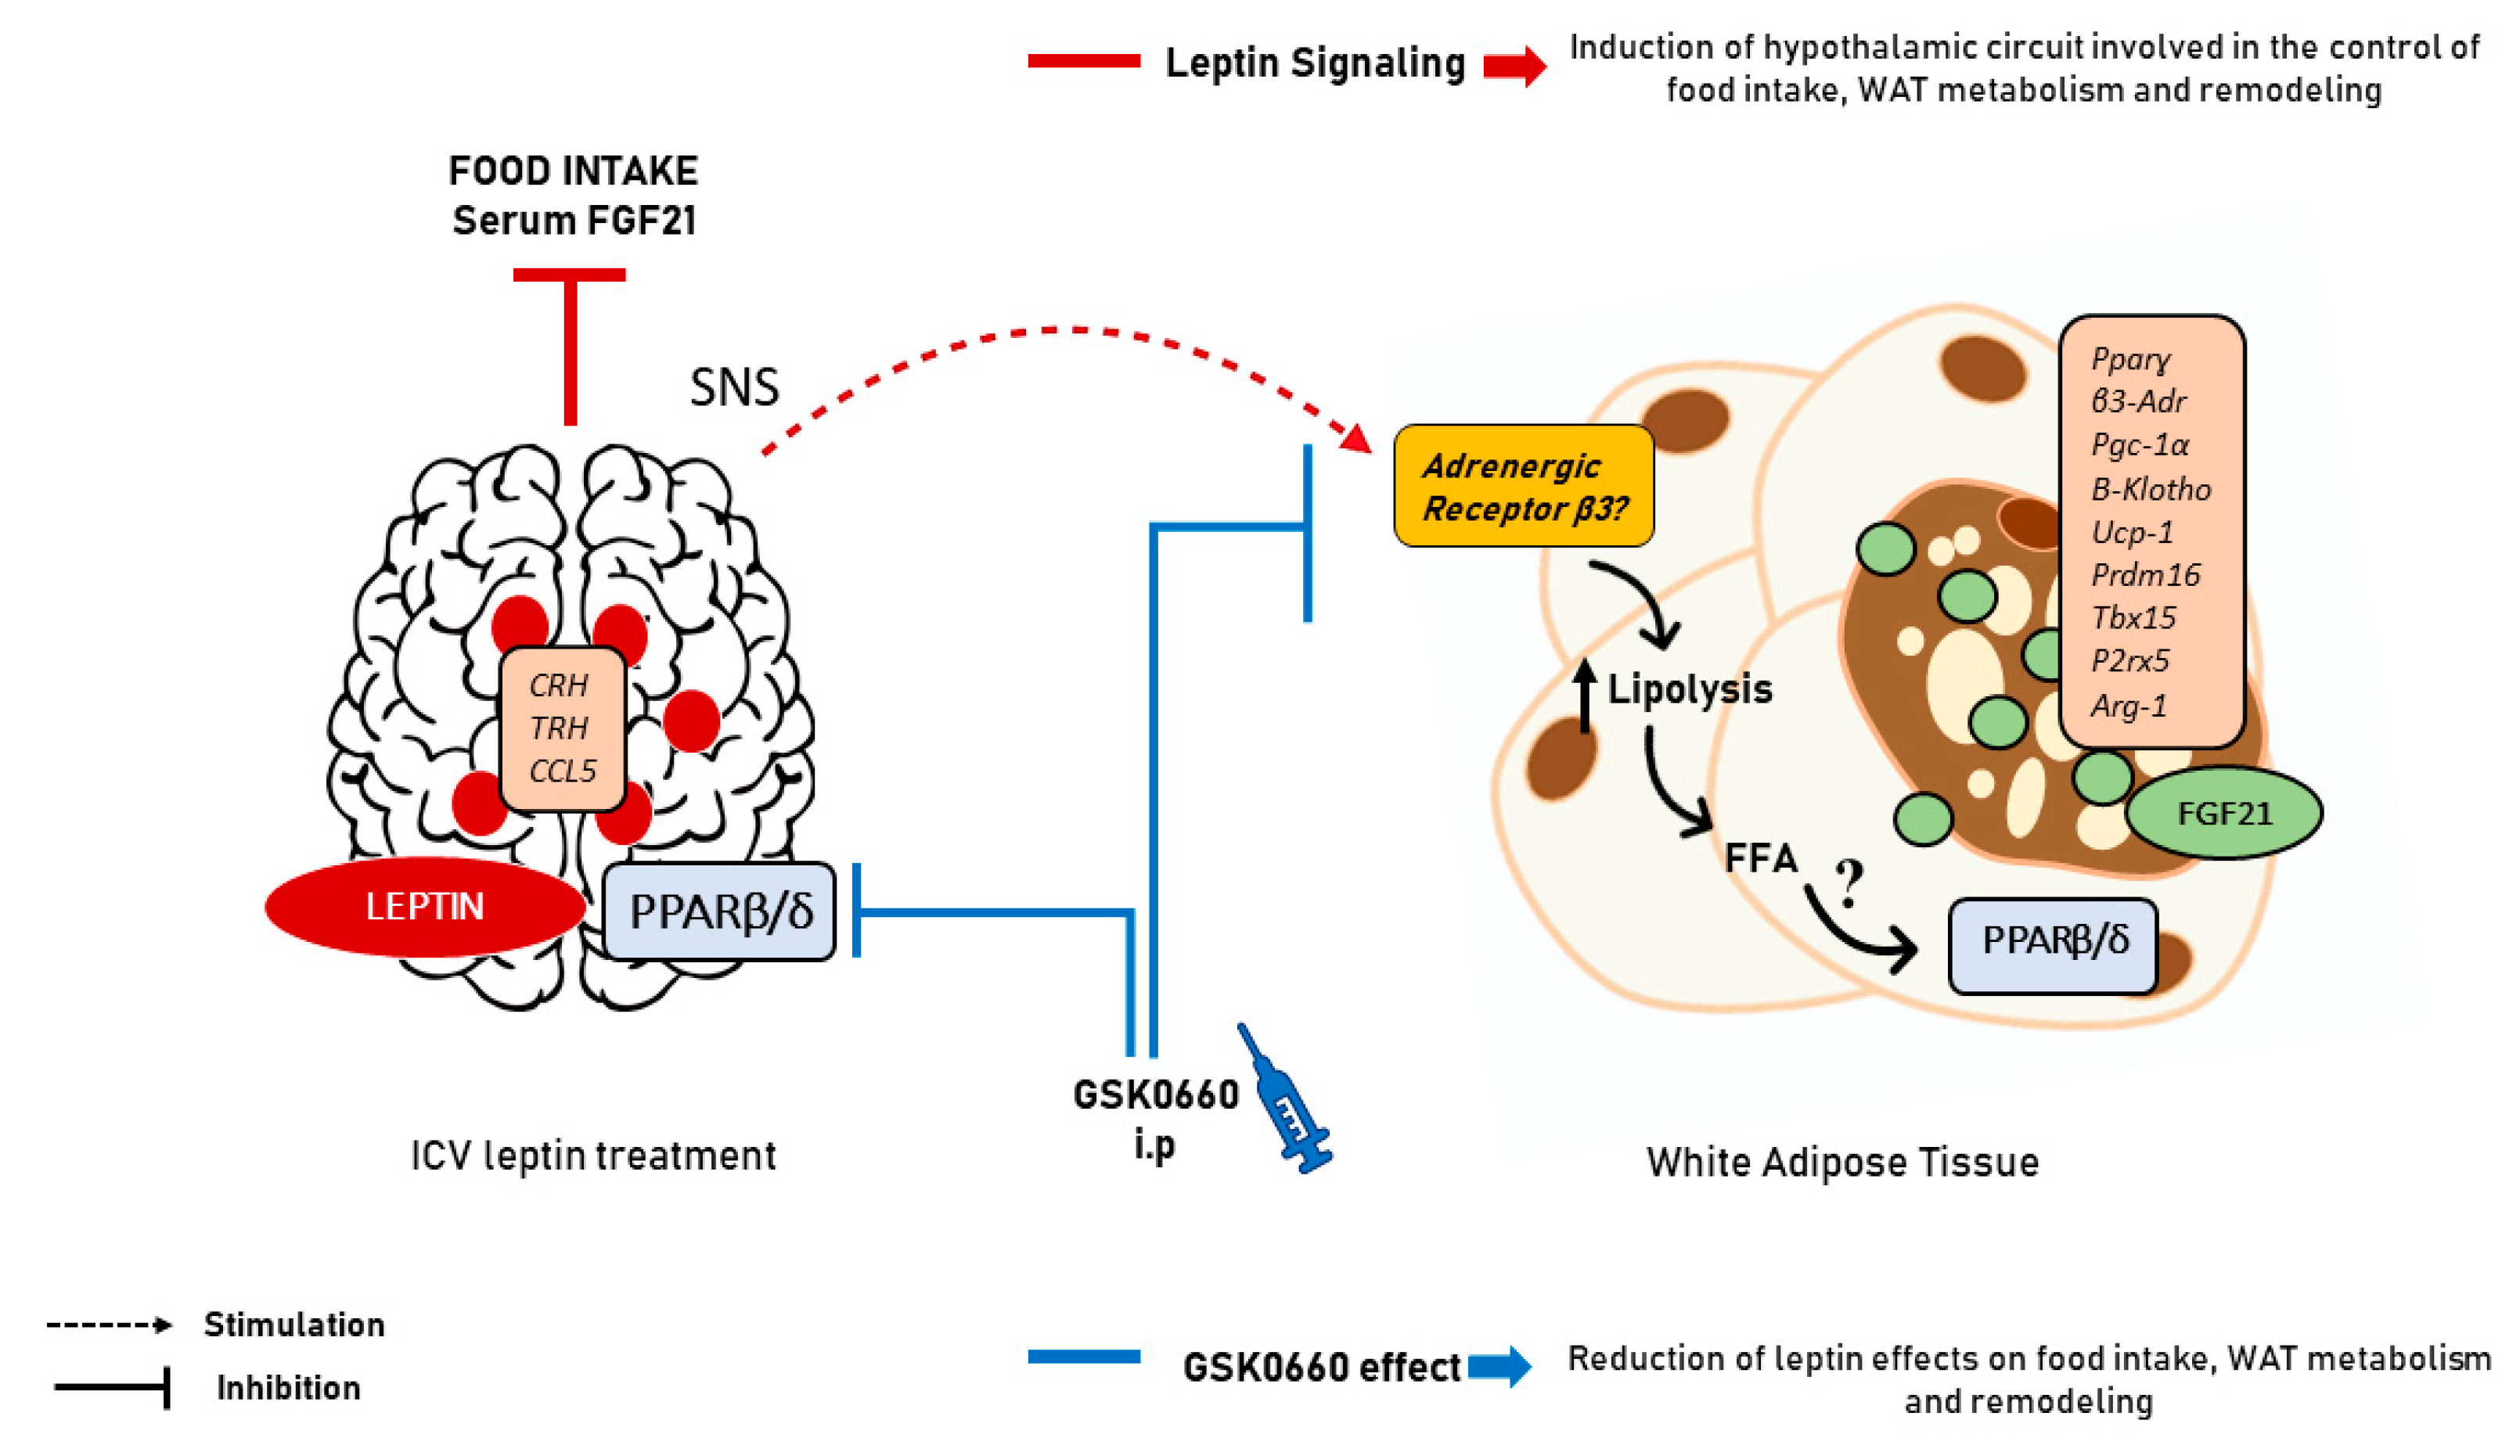
Leptin, Acting at Central Level, Increases FGF21 Expression in White Adipose Tissue via PPARβ/δ

by
Lorena Mazuecos
1,2,
Cristina Pintado
1,3,
Blanca Rubio
1,2,
Eduardo Guisantes-Batán
4,
Antonio Andrés
1,2,* and
Nilda Gallardo
1,2,*
1
Regional Center for Biomedical Research (CRIB), University of Castilla-La Mancha, 13071 Ciudad Real, Spain
2
Biochemistry Section, Faculty of Science and Chemical Technologies, University of Castilla-La Mancha, Avda Camilo José Cela 10, 13071 Ciudad Real, Spain
3
Biochemistry Section, Faculty of Environmental Sciences and Biochemistry, University of Castilla-La Mancha, Avda. Carlos III s/n, 45071 Toledo, Spain
4
Regional Institute for Applied Scientific Research, University of Castilla-La Mancha, 13071 Ciudad Real, Spain
*
Authors to whom correspondence should be addressed.
Int. J. Mol. Sci. 2021, 22(9), 4624; https://0-doi-org.brum.beds.ac.uk/10.3390/ijms22094624
Submission received: 2 April 2021 / Revised: 23 April 2021 / Accepted: 24 April 2021 / Published: 28 April 2021
(This article belongs to the Special Issue Leptin and Obesity: New Discoveries and Future Perspectives)

Abstract

:
The altered function of adipose tissue can result in obesity, insulin resistance, and its metabolic complications. Leptin, acting on the central nervous system, modifies the composition and function of adipose tissue. To date, the molecular changes that occur in epididymal white adipose tissue (eWAT) during chronic leptin treatment are not fully understood. Herein we aimed to address whether PPARβ/δ could mediate the metabolic actions induced by leptin in eWAT. To this end, male 3-month-old Wistar rats, infused intracerebroventricularly (icv) with leptin (0.2 μg/day) for 7 days, were daily co-treated intraperitoneally (ip) without or with the specific PPARβ/δ receptor antagonist GSK0660 (1 mg/kg/day). In parallel, we also administered GSK0660 to control rats fed ad libitum without leptin infusion. Leptin, acting at central level, prevented the starvation-induced increase in circulating levels of FGF21, while induced markedly the endogenous expression of FGF21 and browning markers of eWAT. Interestingly, GSK0660 abolished the anorectic effects induced by icv leptin leading to increased visceral fat mass and reduced browning capacity. In addition, the pharmacological inhibition of PPARβ/δ alters the immunomodulatory actions of central leptin on eWAT. In summary, our results demonstrate that PPARβ/δ is involved in the up-regulation of FGF21 expression induced by leptin in visceral adipose tissue.

1. Introduction

Leptin is mainly synthesized and secreted by white adipose tissue in proportion to fat content, acting as an energy store signal. Once in circulation, it reaches hypothalamic centers and controls food intake, energy homeostasis, body fat, and immune response by altering the secretion of hypothalamic neuropeptides [1,2,3,4]. In addition, leptin effectively regulates glucose and lipid homeostasis, metabolic effects that occur regardless of their ability to reduce body weight and food intake [5]. Acting through the sympathetic nervous system (SNS) and the neuroendocrine hypothalamic–pituitary–thyroid (HPT) axis, leptin increases lipolysis and promotes adaptive thermogenesis in white adipose tissue, a fact that leads to an increase in energy expenditure and decrease fat stores [6,7,8]. In fact, chronic leptin treatment corrects hyperphagia, impaired lipid metabolism, and thermogenesis in ob/ob mice [9].
Moreover, the long-term thermogenic and lipolytic effects of leptin during chronic treatment is achieved through hypothalamic regulation of sympathetic innervation of both brown and white adipose tissue [10]. Specifically, disruption of leptin signalling in the entire arcuate (ARC) leads to a loss of sympathetic innervation of both types of adipose tissues in normal adult mice [10].
In addition, in white adipose tissue, depending on the activation of POMC-positive hypothalamic neurons and the SNS, it has been widely reported that leptin (combined with insulin action) has the ability to promote the browning process as part of a metabolic reprogramming and nutritional adaptation of adipocytes, increasing Ucp-1 expression and other browning markers as Pgc-1α, Prdm16, or β3-adrenergic receptor included [11,12]. However, whether chronic leptin treatment through the CNS regulates the conversion of white to beige fat is only partly understood.
Mountain evidence suggested that leptin deficiency disturb lipid oxidation but its influence on electron transport system appear to depend on the metabolic feature of tissues. In this regard, it has been described that subcutaneous injection of leptin in ob/ob mice decreased protein levels of certain components of OXPHOS complexes in liver and heart, following by a reduction in basal metabolic rate and mitochondrial volume density [13].
Recently it has been known that both pharmacological and genetic inhibition of OXPHOS in adipocytes significantly improved energy homeostasis and insulin sensitivity in mice, accompanied by a markedly increase in adipocyte secretion of Fibroblast Growth Factor 21 (FGF21) [14], another peripheral signal that affects thermogenic activity in both BAT and WAT.
Member of the fibroblast growth factor family of proteins, FGF21 is rapidly induced and secreted by liver in fasting states and mediates the mechanism of adaptation to starvation and multiple stressors in both humans and rodents. Interestingly, it has been found that other tissues as adipocytes, hypothalamus, or pancreas also express this factor in lower levels [15,16,17] and it has been recently hypothesized that FGF21 might have a further additional function as an autocrine/paracrine hormone [18,19,20].
As leptin, FGF21 secretion is related to weight loss and is acutely expressed after cold stimulation in white adipocytes, promoting the induction of Ucp-1 expression and the browning process in rodents [21,22]. In spite of having been reported that leptin might be involved in FGF21 responsiveness or the opposite [23,24], there are few data about a potential metabolic relationship between leptin and FGF21 in vivo. Thus, relevance of adipose tissue and leptin signaling on FGF21 cascade need to be further investigated.
The transcription factor PPARβ/δ is part of the metabolic reprogramming leaded to thermogenesis and browning in white adipocytes, which upregulation reduces adiposity, improves inflammation, and promotes energy expenditure, protecting against obesity in mice [25]. In fact, it has been proposed as a therapeutic target for the treatment of metabolic syndrome [26]. Interestingly, studies from our laboratory have recently shown that leptin, acting in the brain, has the ability to regulate heart lipid content and cardiac remodeling by PPARβ/δ activity [27,28], revealing the capacity of leptin to control cell reprogramming through PPARβ/δ. However, whether PPARβ/δ is a mediator of the central induced actions of leptin in the brain–visceral fat crosstalk has not been elucidated.
To date, since no in vivo investigations using GSK0660 have determined the role of PPARβ/δ on leptin signaling machinery and metabolic function in visceral WAT, we assessed in vivo the effect of the pharmacological inhibition of PPARβ/δ on the metabolic and inflammatory status of eWAT in response to brain leptin infusion. To this end, untreated or icv leptin-treated rats were injected ip with GSK0660, a potent and selective antagonist widely used for determining the biological roles of PPARβ/δ [29]. Moreover, we have also studied the role of icv leptin administration on the regulation of the endogenous expression of FGF21 in eWAT. Of particular interest was to establish the role of PPARβ/δ in the browning of eWAT when the stimulus applied to induce browning is the chronic central leptin infusion. Induction of browning and immune response was assessed by measuring gene and protein expression of several known markers of browning and immune inflammatory response, such as Ucp1, Pparɣ, Pgc-1α, Pdk4, Prdm16, Tbx15, P2rx5, FGF21, Arg1, and Ccl5 in WAT. Our data suggest that PPARβ/δ is involved in the anorexigenic and adipostatic effects of leptin acting at the CNS in Wistar rats, by modulating the transcriptional adaptation of eWAT to chronic leptin treatment regulation of innate immunity and browning.

2. Results

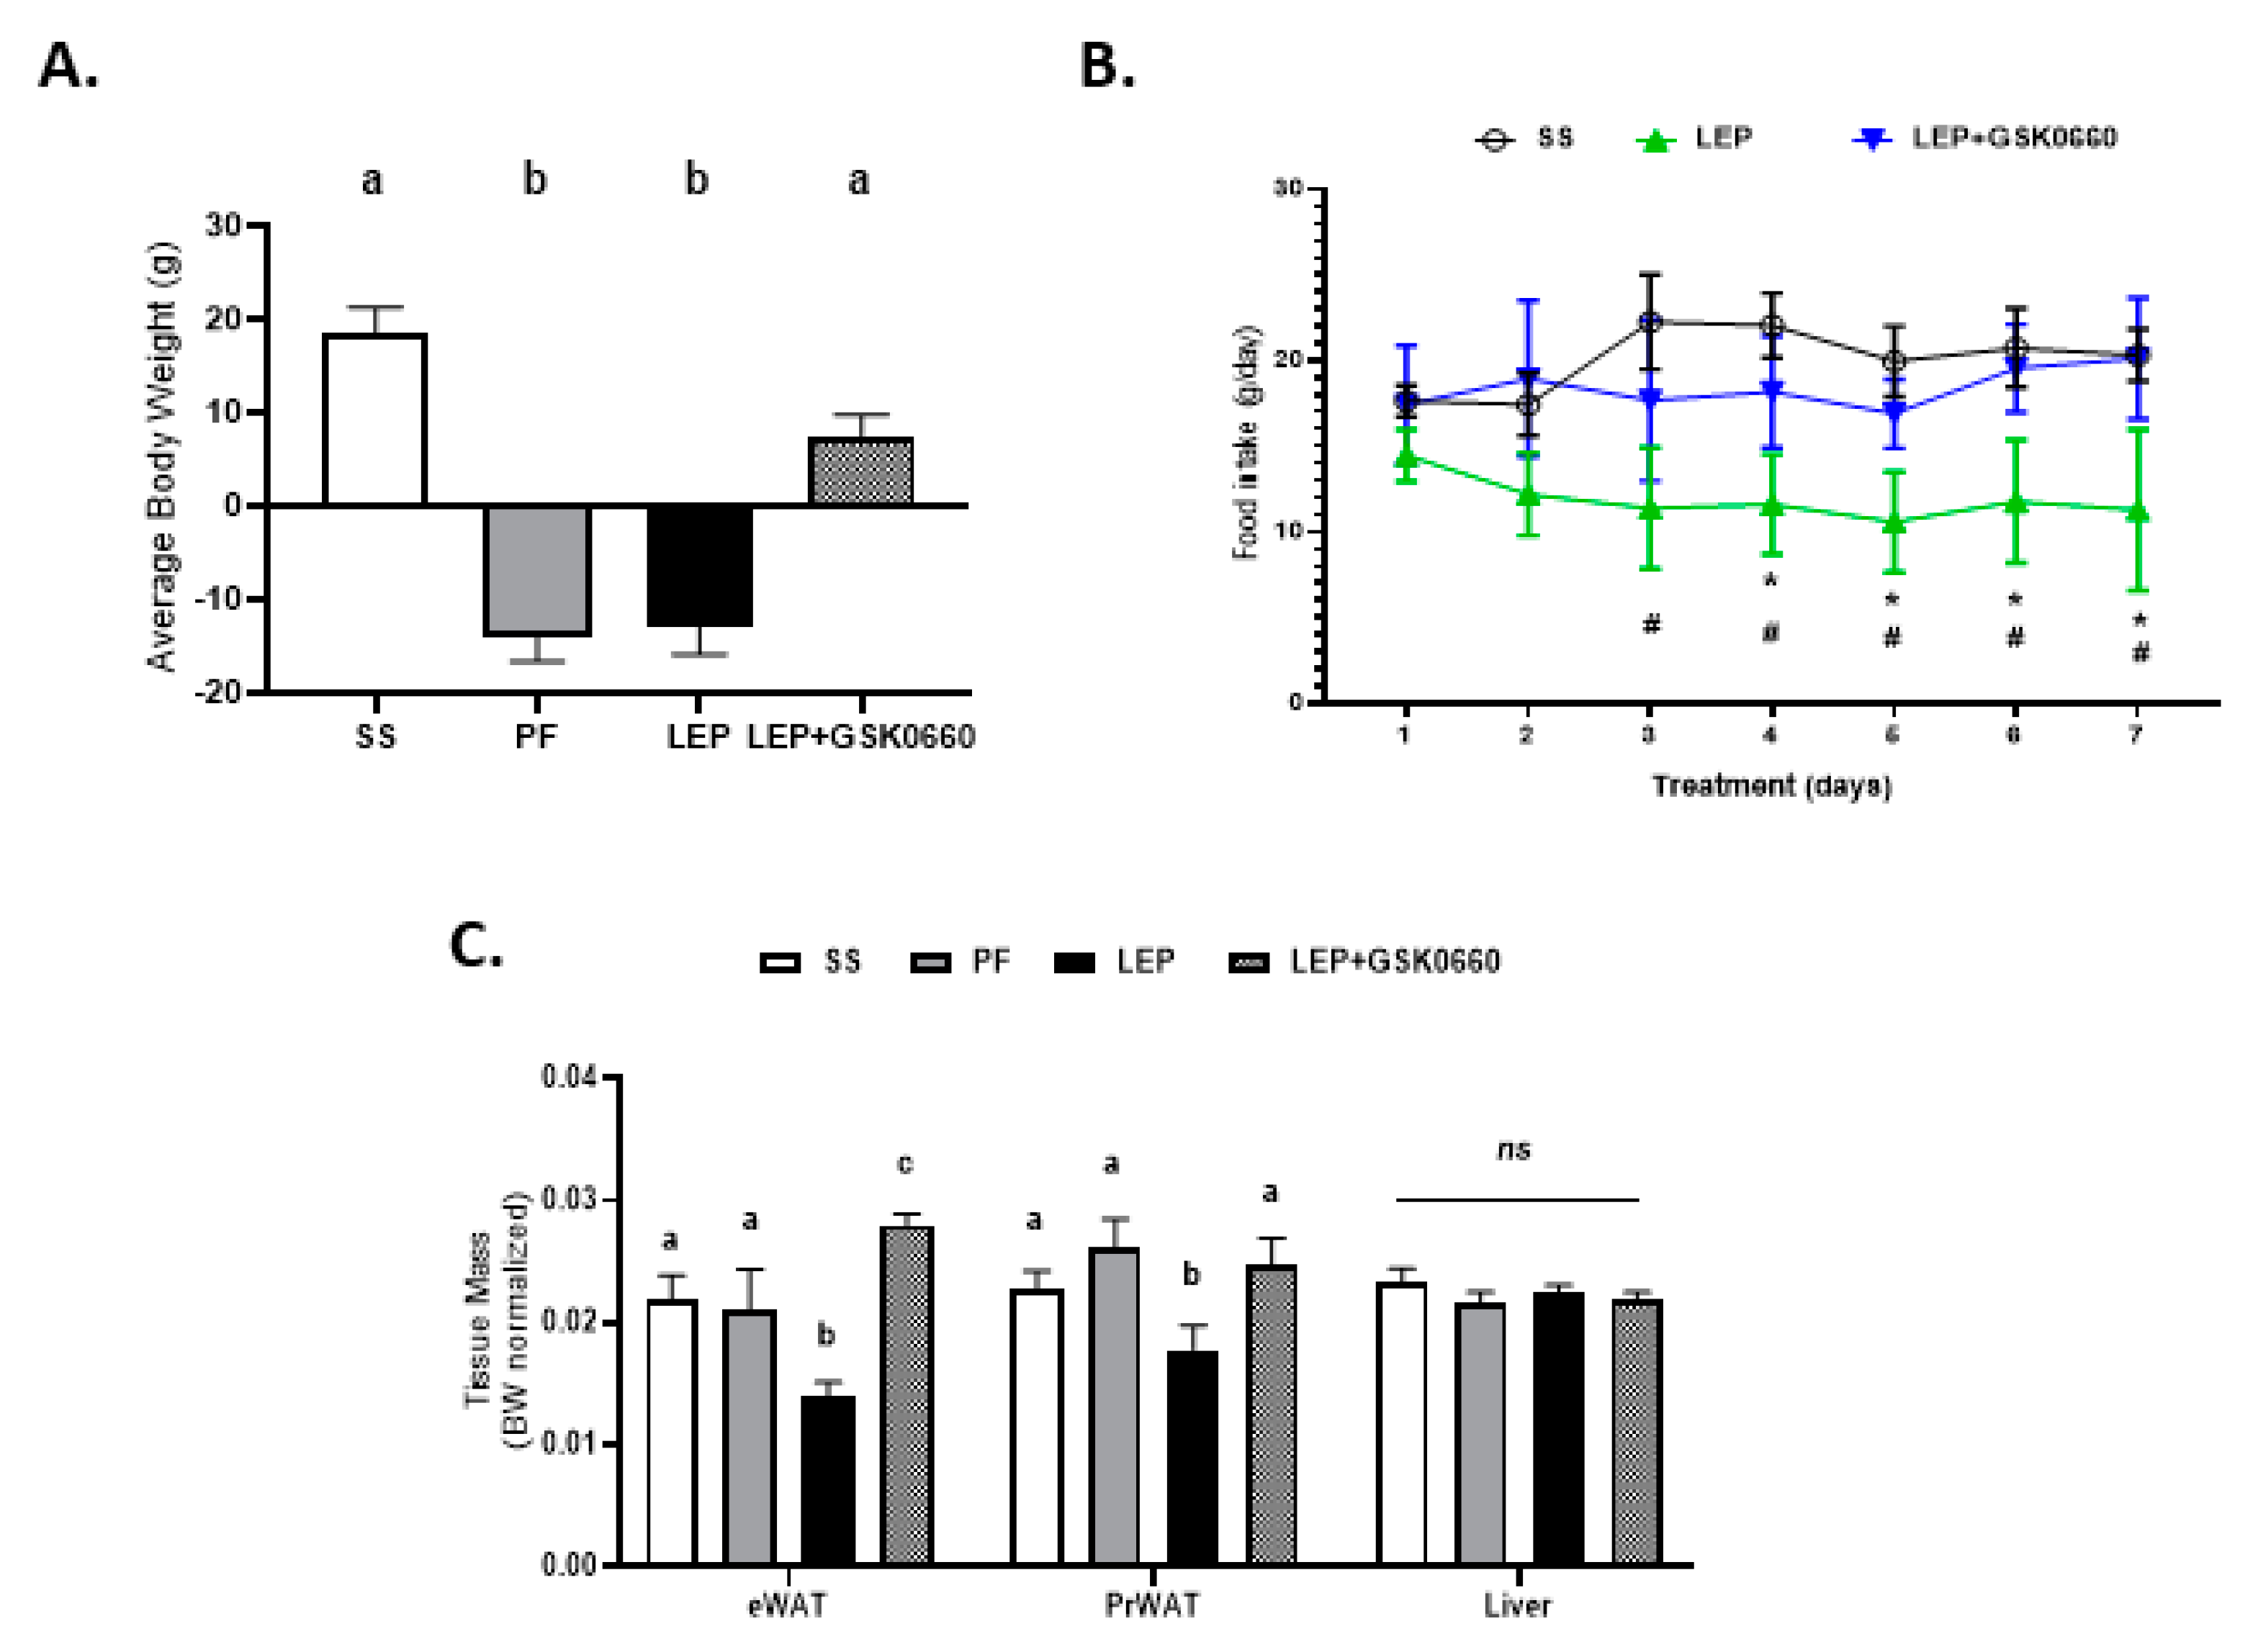
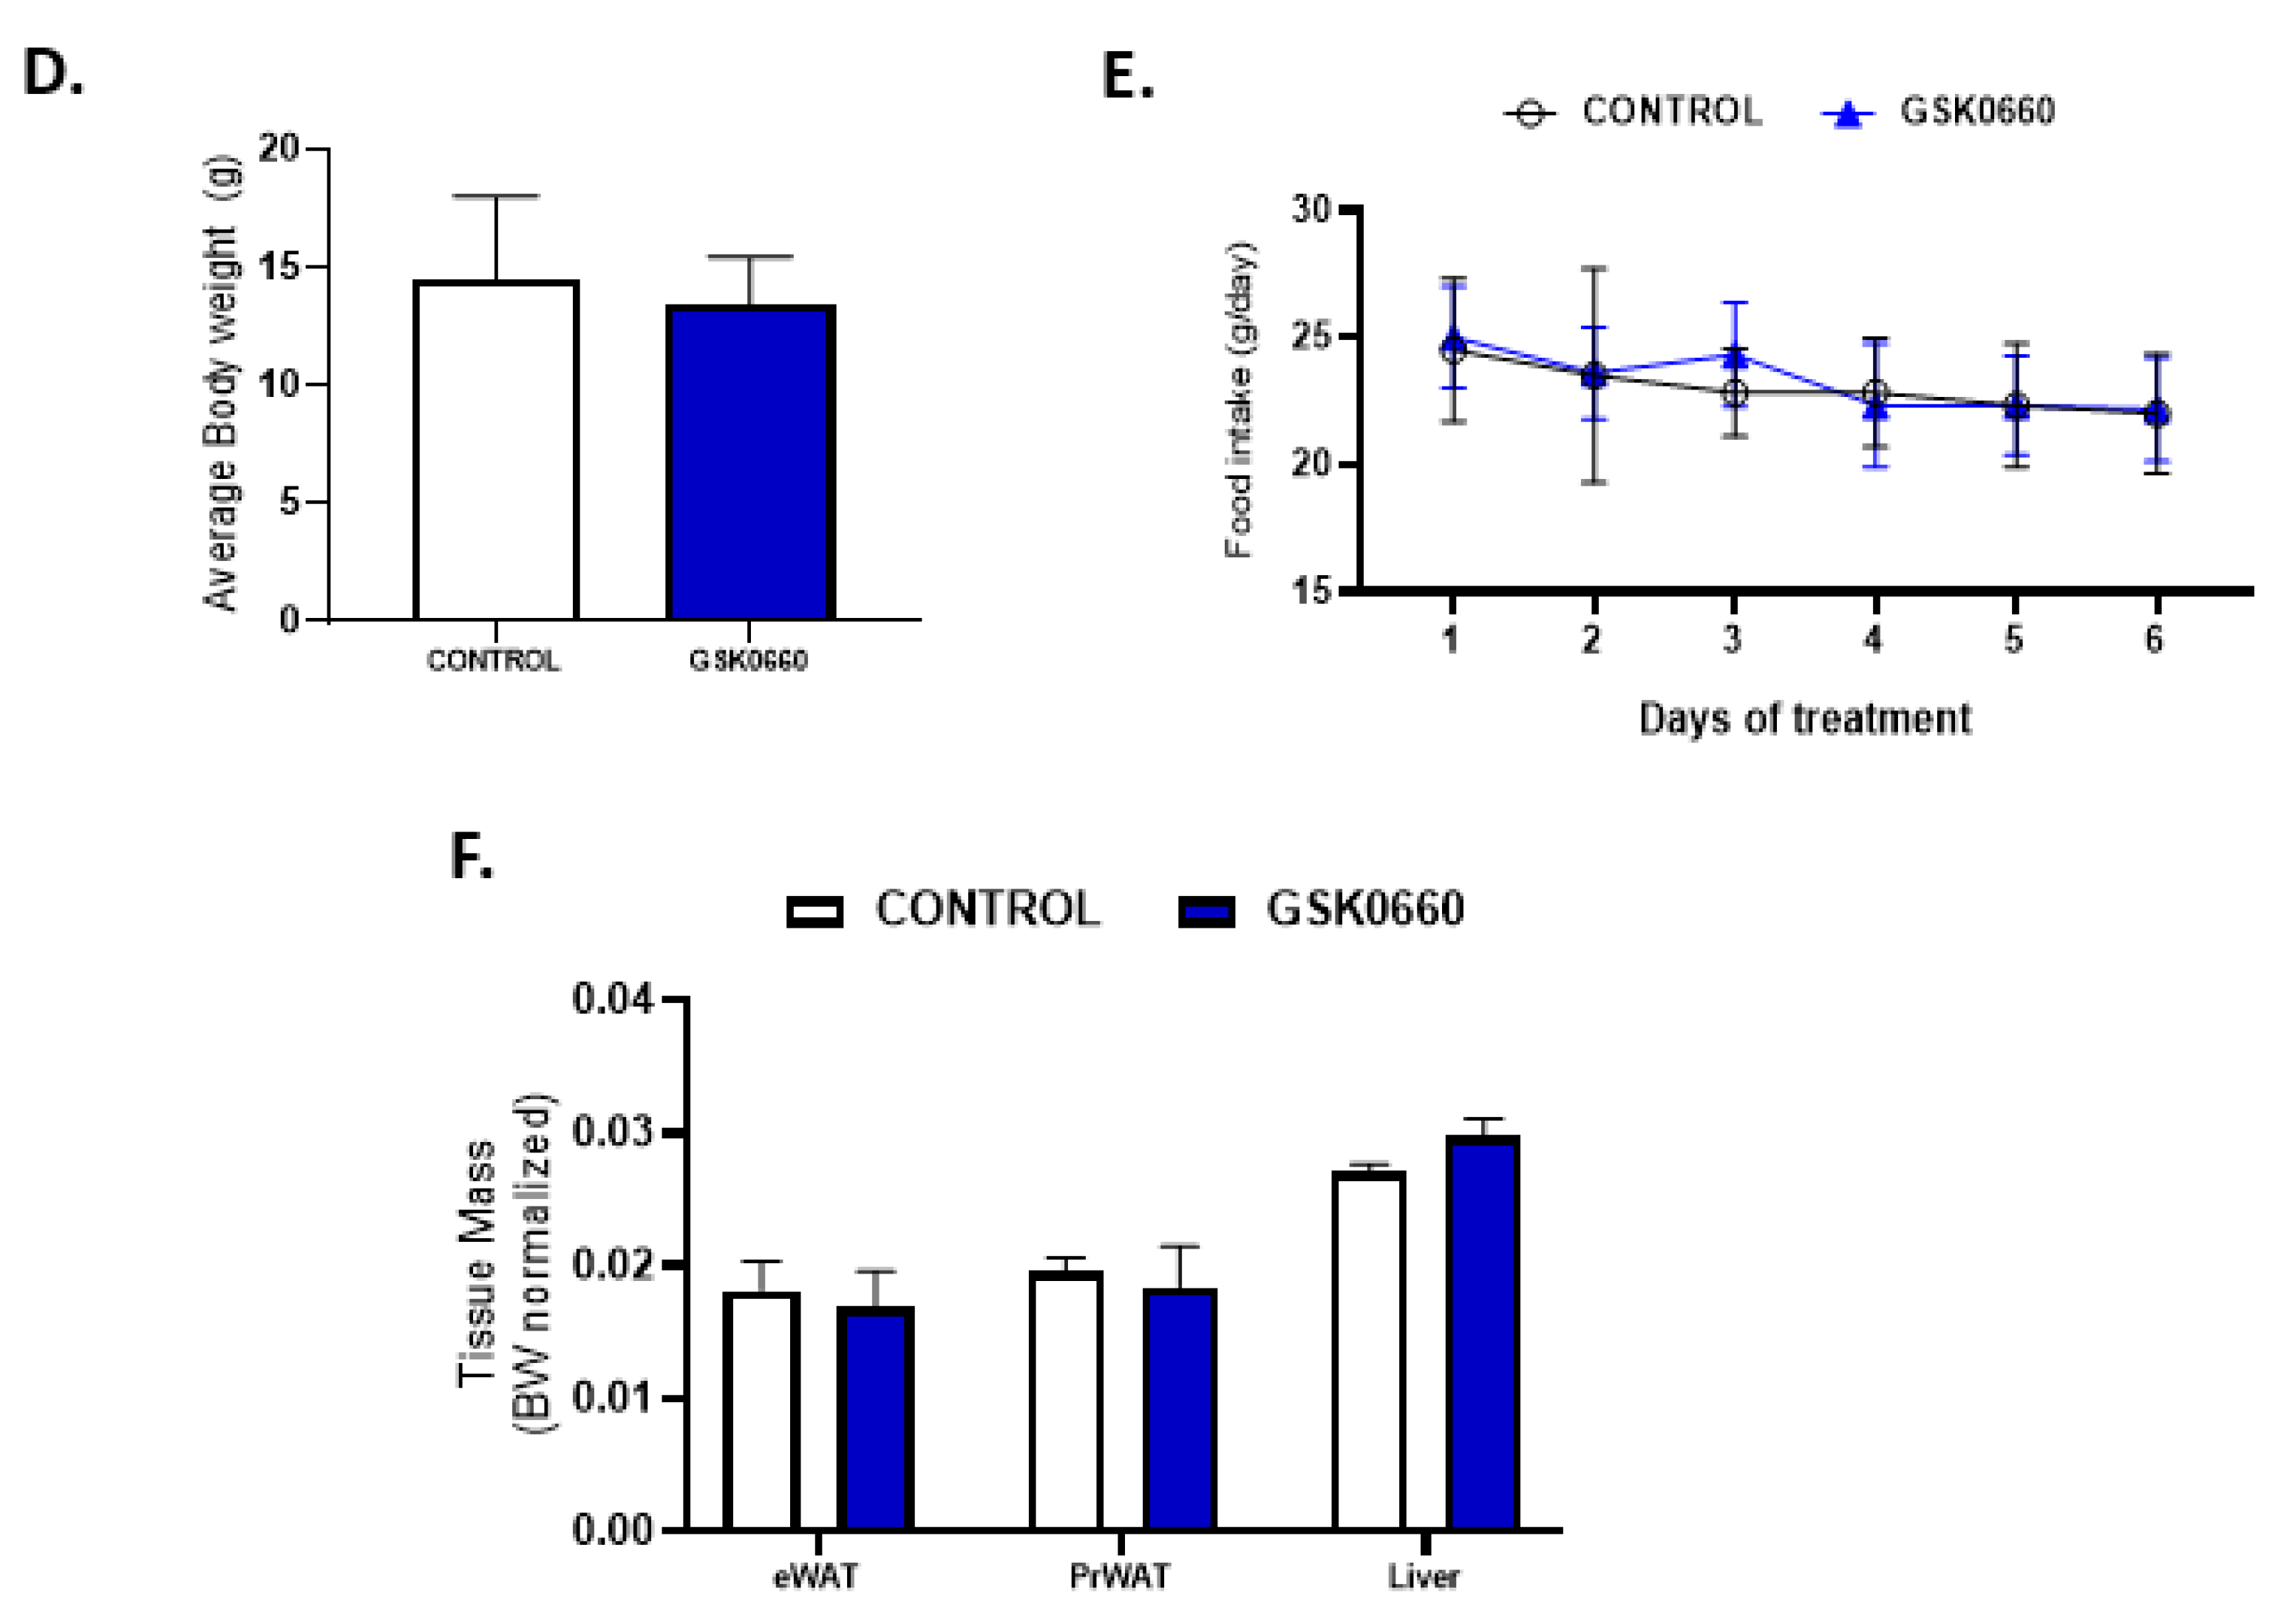
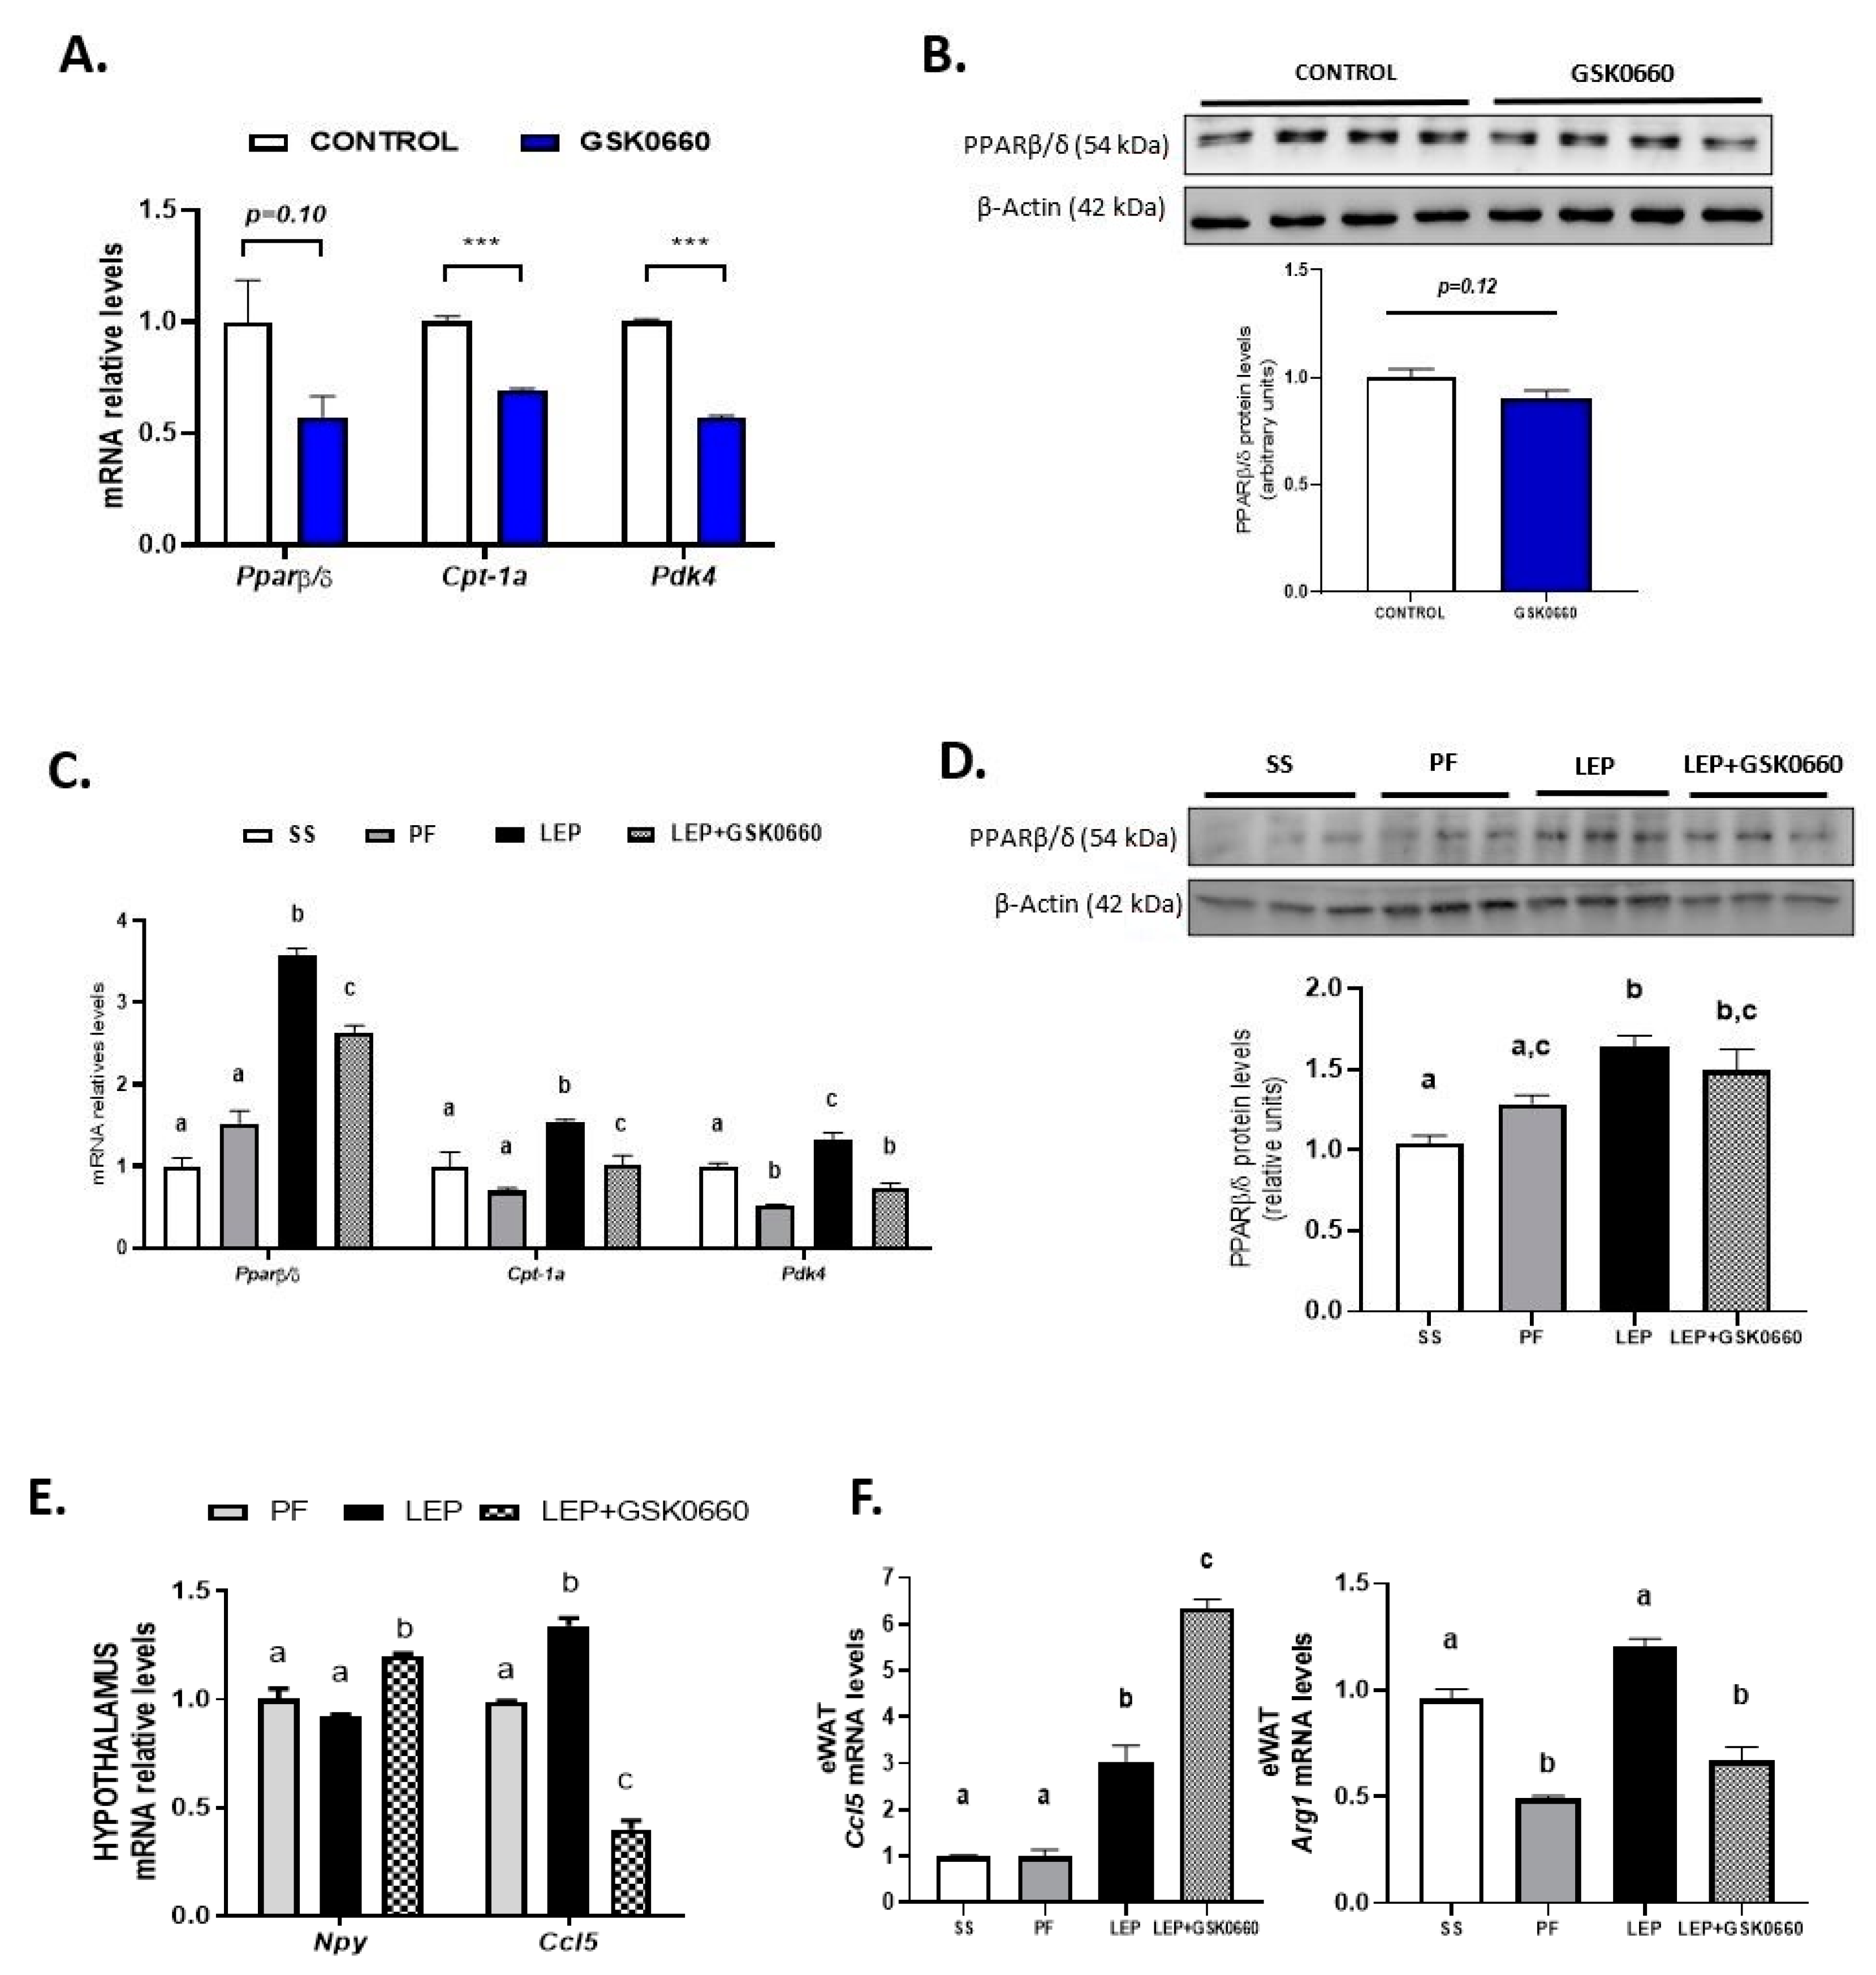
2.1. Whole Body Pharmacological Inhibition of PPARβ/δ Reduced the Effects of Central Leptin in PPARβ/δ Expression in eWAT, and Abolished the Anorexigenic and Adipostatic Actions of Leptin

Initially, we wanted to confirm the ability of exogenous central leptin infusion to activate hypothalamic leptin signaling. Thus, we examined the hypothalamic mRNA levels of the long Ob-Rb leptin receptor and those of Pomc, Crh, and Trh, three target genes for the action of leptin, in saline, pair-fed, and leptin treated rats, at the time of sacrifice. As expected, leptin induced hypothalamic Ob-Rb, Pomc, Crh, and Trh expression compared to the pair-fed rats, consistent with unaltered central leptin sensitivity (Supplemental Table S3). Accordingly, and supporting previous observations [6,30], chronic central leptin infusion notably decreased body weight gain and daily food intake when compared with saline-treated rats (SS) (Figure 1A,B) as well as the epididymal and retroperitoneal adipose tissue mass when compared with pair-fed rats (Figure 1C). Of note, GSK0660 administration in leptin-treated rats caused an opposite effect on body weight, food intake, and adiposity, blunting the anorexigenic and adipostatic effects of central leptin, (Figure 1A–C). Moreover, no changes in liver tissue mass were found (Figure 1C). Therefore, we suggest that the body weight differences found in rats co-treated centrally with leptin and intraperitoneally with GSK0660 are largely due to the differences in visceral fat mass.
In contrast, in non-leptin-treated rats with free access to chow diet, GSK0660 treatment alone had no effect on body weight gain or food intake (Figure 1D,E). In addition, no change was either observed in eWAT, retroperitoneal white adipose tissue (PrWAT), or liver weight upon GSK0660 administration (Figure 1F). Nevertheless, GSK0660 treatment notably increased serum levels of leptin, insulin, and triglyceride in rats, without affecting glucose levels (Table 1), suggesting that GSK0660 induced insulin resistance in 3-month-old Wistar rats. Moreover, whole body inhibition of PPARβ/δ in non-leptin-treated rats caused a significant decrease on the expression of Cpt-1a and Pdk4, (PPARβ/δ target genes) in eWAT, confirming a partial inhibition of the transcriptional activity of this nuclear receptor (Figure 2A). In fact, PPARβ/δ gene expression was also reduced (p = 0.1) after GSK0660 injection compared to control group (Figure 2A), although protein levels were not affected (Figure 2B). These data indicate that PPARβ/δ might regulate its own gene expression in eWAT from Wistar rats.
As central leptin increased PPARβ/δ expression in heart [27], we next analyzed whether leptin was able to upregulate the expression of PPARβ/δ in eWAT. Central chronic infusion of leptin increased PPARβ/δ gene expression by 3.5-fold in eWAT compared with pair-fed rats (Figure 2C). Furthermore, the protein levels of this transcription factor were also markedly increased (Figure 2D). As expected, mRNA levels of Cpt-1a and Pdk4 were also increased parallel to PPARβ/δ induction and independently of the anorexigenic effects of leptin, confirming an increase in oxidative capacity of eWAT (Figure 2C). According to Figure 2A, the pharmacological inhibition of PPARβ/δ during leptin treatment reduced PPARβ/δ, Cpt-1a, and Pdk4 gene expression (Figure 2C), without affecting PPARβ/δ protein levels (Figure 2D).
In accordance with our previous results [6,30], 7 days chronic central leptin administration at a very low dose decreased serum insulin levels in 3-month-old rats, very likely due to its capacity to suppress insulin secretion and to enhance insulin sensitivity through central leptin-mediated activation of the SNS (Table 1). Interestingly, when leptin and GSK0660 are co-administered, brain leptin maintains its ability to regulate insulin secretion and glucose levels, despite the whole body-inhibition of PPARβ/δ receptor (Table 1).
Total cholesterol was reduced in pair-fed and leptin-treated rats, and according to its lipostatic function, leptin also reduced serum levels of triglycerides (Table 1). No notable changes were observed in leptin-GSK0660 co-treated rats in cholesterol levels when compared with pair-fed or leptin groups (Table 1). Interestingly, PPARβ/δ antagonist administration increased triglyceride serum levels in leptin- and non-leptin-treated rats (Table 1), which could be associated to downregulation of Cpt1a, at least, in eWAT (Figure 2A,C). These results confirm that GSK0660 reduced the positive impact of PPARβ/δ on fatty acid oxidation [29].
Leptin infusion tended to decrease serum leptin levels in leptin-treated rats, but this tendency was not statistically significant. Moreover, there was an increase, albeit not statistically significant at p ≤ 0.05, in leptin levels after inhibition of PPARβ/δ in leptin-treated rats (p = 0.08 Lep+GSK0660 vs. Lep) (Table 1), in parallel with the increase in eWAT (Figure 1C). These data allow us to suggest that leptin sensitivity might be impaired by GSK0660.

2.2. Changes in the Immunomodulatory Actions of Leptin in Hypothalamus and eWAT upon PPARβ/δ Inhibition

To identify mechanisms by which GSK0660 interfere in the anorexigenic and adipostatic effects of leptin in rats, we measured in the hypothalamus the expression of Npy as well as Ccl5, a chemokine implicated in the hypothalamic regulation of food intake and insulin-related energy homeostasis [31]. As seen in Figure 2E, treatment with GSK0660 changes the effects of leptin on Npy and Ccl5 (RANTES) expression, which is indicative that the actions of leptin at the hypothalamic level go through the activation of PPARβ/δ, which could result in the control of energy intake and expenditure confirming a previous role assigned to neuronal PPARβ/δ reported in neuron-specific PPARβ/δ deficient mice [32].
We further analyzed in eWAT the expression of Arg1, a hallmark of alternatively activated macrophages and Ccl5 given its role in local inflammation of visceral WAT in obesity. Importantly, leptin-GSK0660 co-treatment dramatically reduced Arg1, while increased Ccl5 mRNA levels in this group of rats compared to leptin-treated rats (Figure 2F). Although we do not know what the source of Ccl5 is, these data might suggest that increased adiposity could be accompanied by immune cells (macrophages and T cells) infiltration, reduction of alternatively activated macrophages and local tissue inflammation in eWAT [33].

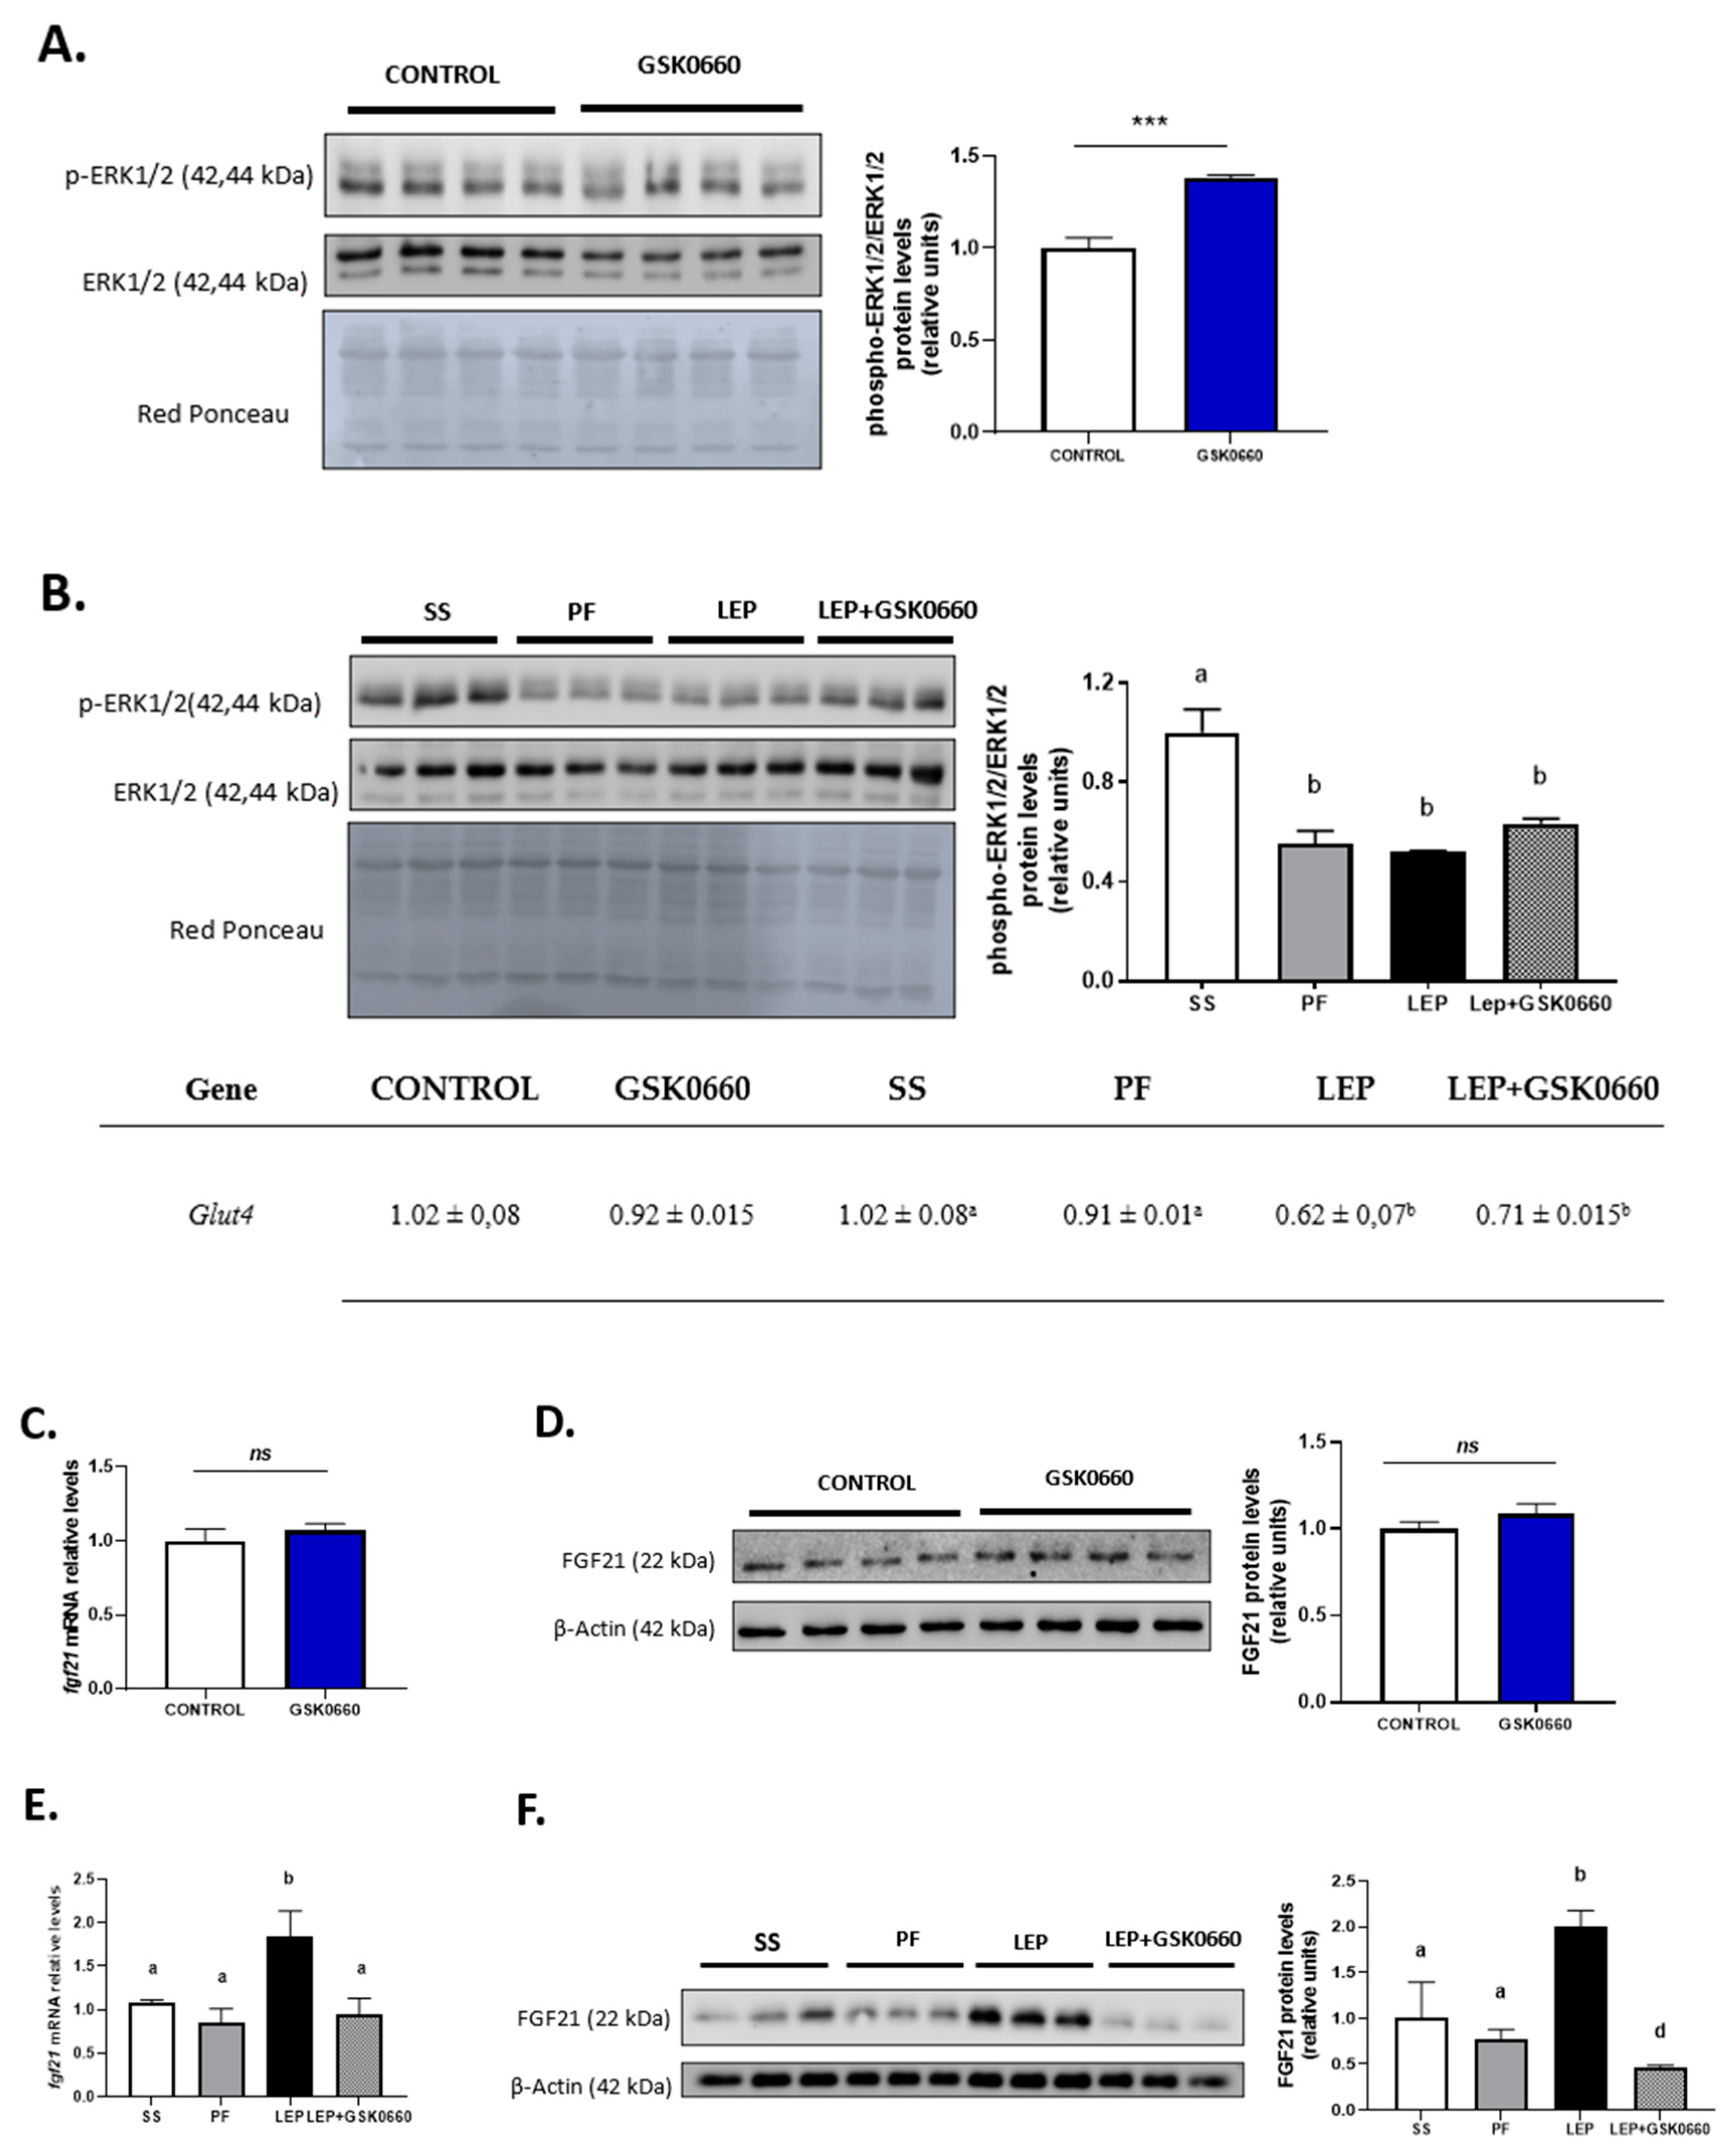
2.3. Pharmacological Inhibition of PPARβ/δ Affects Leptin Signaling in eWAT

Because the role of PPARβ/δ in WAT leptin metabolism is unknown, we further investigate the molecular changes in eWAT related to leptin signaling. Consistent with the increased circulating levels of leptin in non-leptin-treated rats (Table 1), we found that GSK0660 administration increased leptin and Ob-Rb mRNA levels in eWAT (Table 2), indicating a state of energy sufficiency. In fact, GSK0660 treatment remarkably increased triglyceride and cholesterol content in eWAT (Figure 3A), as it has been reported in myotubes, macrophages, fibroblasts, and intestinal cells [34,35,36].
Leptin infusion reduced the expression of leptin gene in eWAT independently of its anorectic effects and the metabolic effects of GSK0660 (Table 2). Although not clear, it has been recently suggested that the mRNA levels of leptin strongly correlate with fat mass content [37,38]. On the contrary, although leptin infusion did not affect gene expression of Ob-Rb in eWAT compared to the pair-fed rats, when leptin and GSK0660 were co-administered, the mRNA levels of Ob-Rb were markedly reduced (Table 2), which diminishes the potential of leptin to directly influence the metabolism of adipocytes. This result is in line with previous finding indicating that caloric restriction enhances Ob-Rb expression and leptin responsiveness in leptin-resistant DIO rats; thus, levels of Ob-Rb depend on food intake [39].
Moreover, and supporting prior data [6], central leptin reduced both the cholesterol and triglyceride content in eWAT (Figure 3B). In contrast, the pharmacological inhibition of PPARβ/δ abolished the effects of central leptin, increasing cholesterol and triglyceride levels in GSK0660-leptin co-treated rats (Figure 3B). Hence, we hypothesized that differences in triglyceride content could be linked to disturbed adipocyte lipolysis in leptin-GSK0660 co-treated rats. Interestingly, we found that GSK0660 could reduce the lipolytic effects induced by central leptin in eWAT by lowering ATGL protein levels (Figure 3C) and increasing HSL-Ser565 phosphorylation levels, which abolishes cyclic AMP-dependent protein kinase (PKA)-induced HSL activation (Figure 3D). All these results suggest an impairing in central leptin signalling transduction and PKA-mediated induction of lipolysis in eWAT upon PPARβ/δ inactivation.

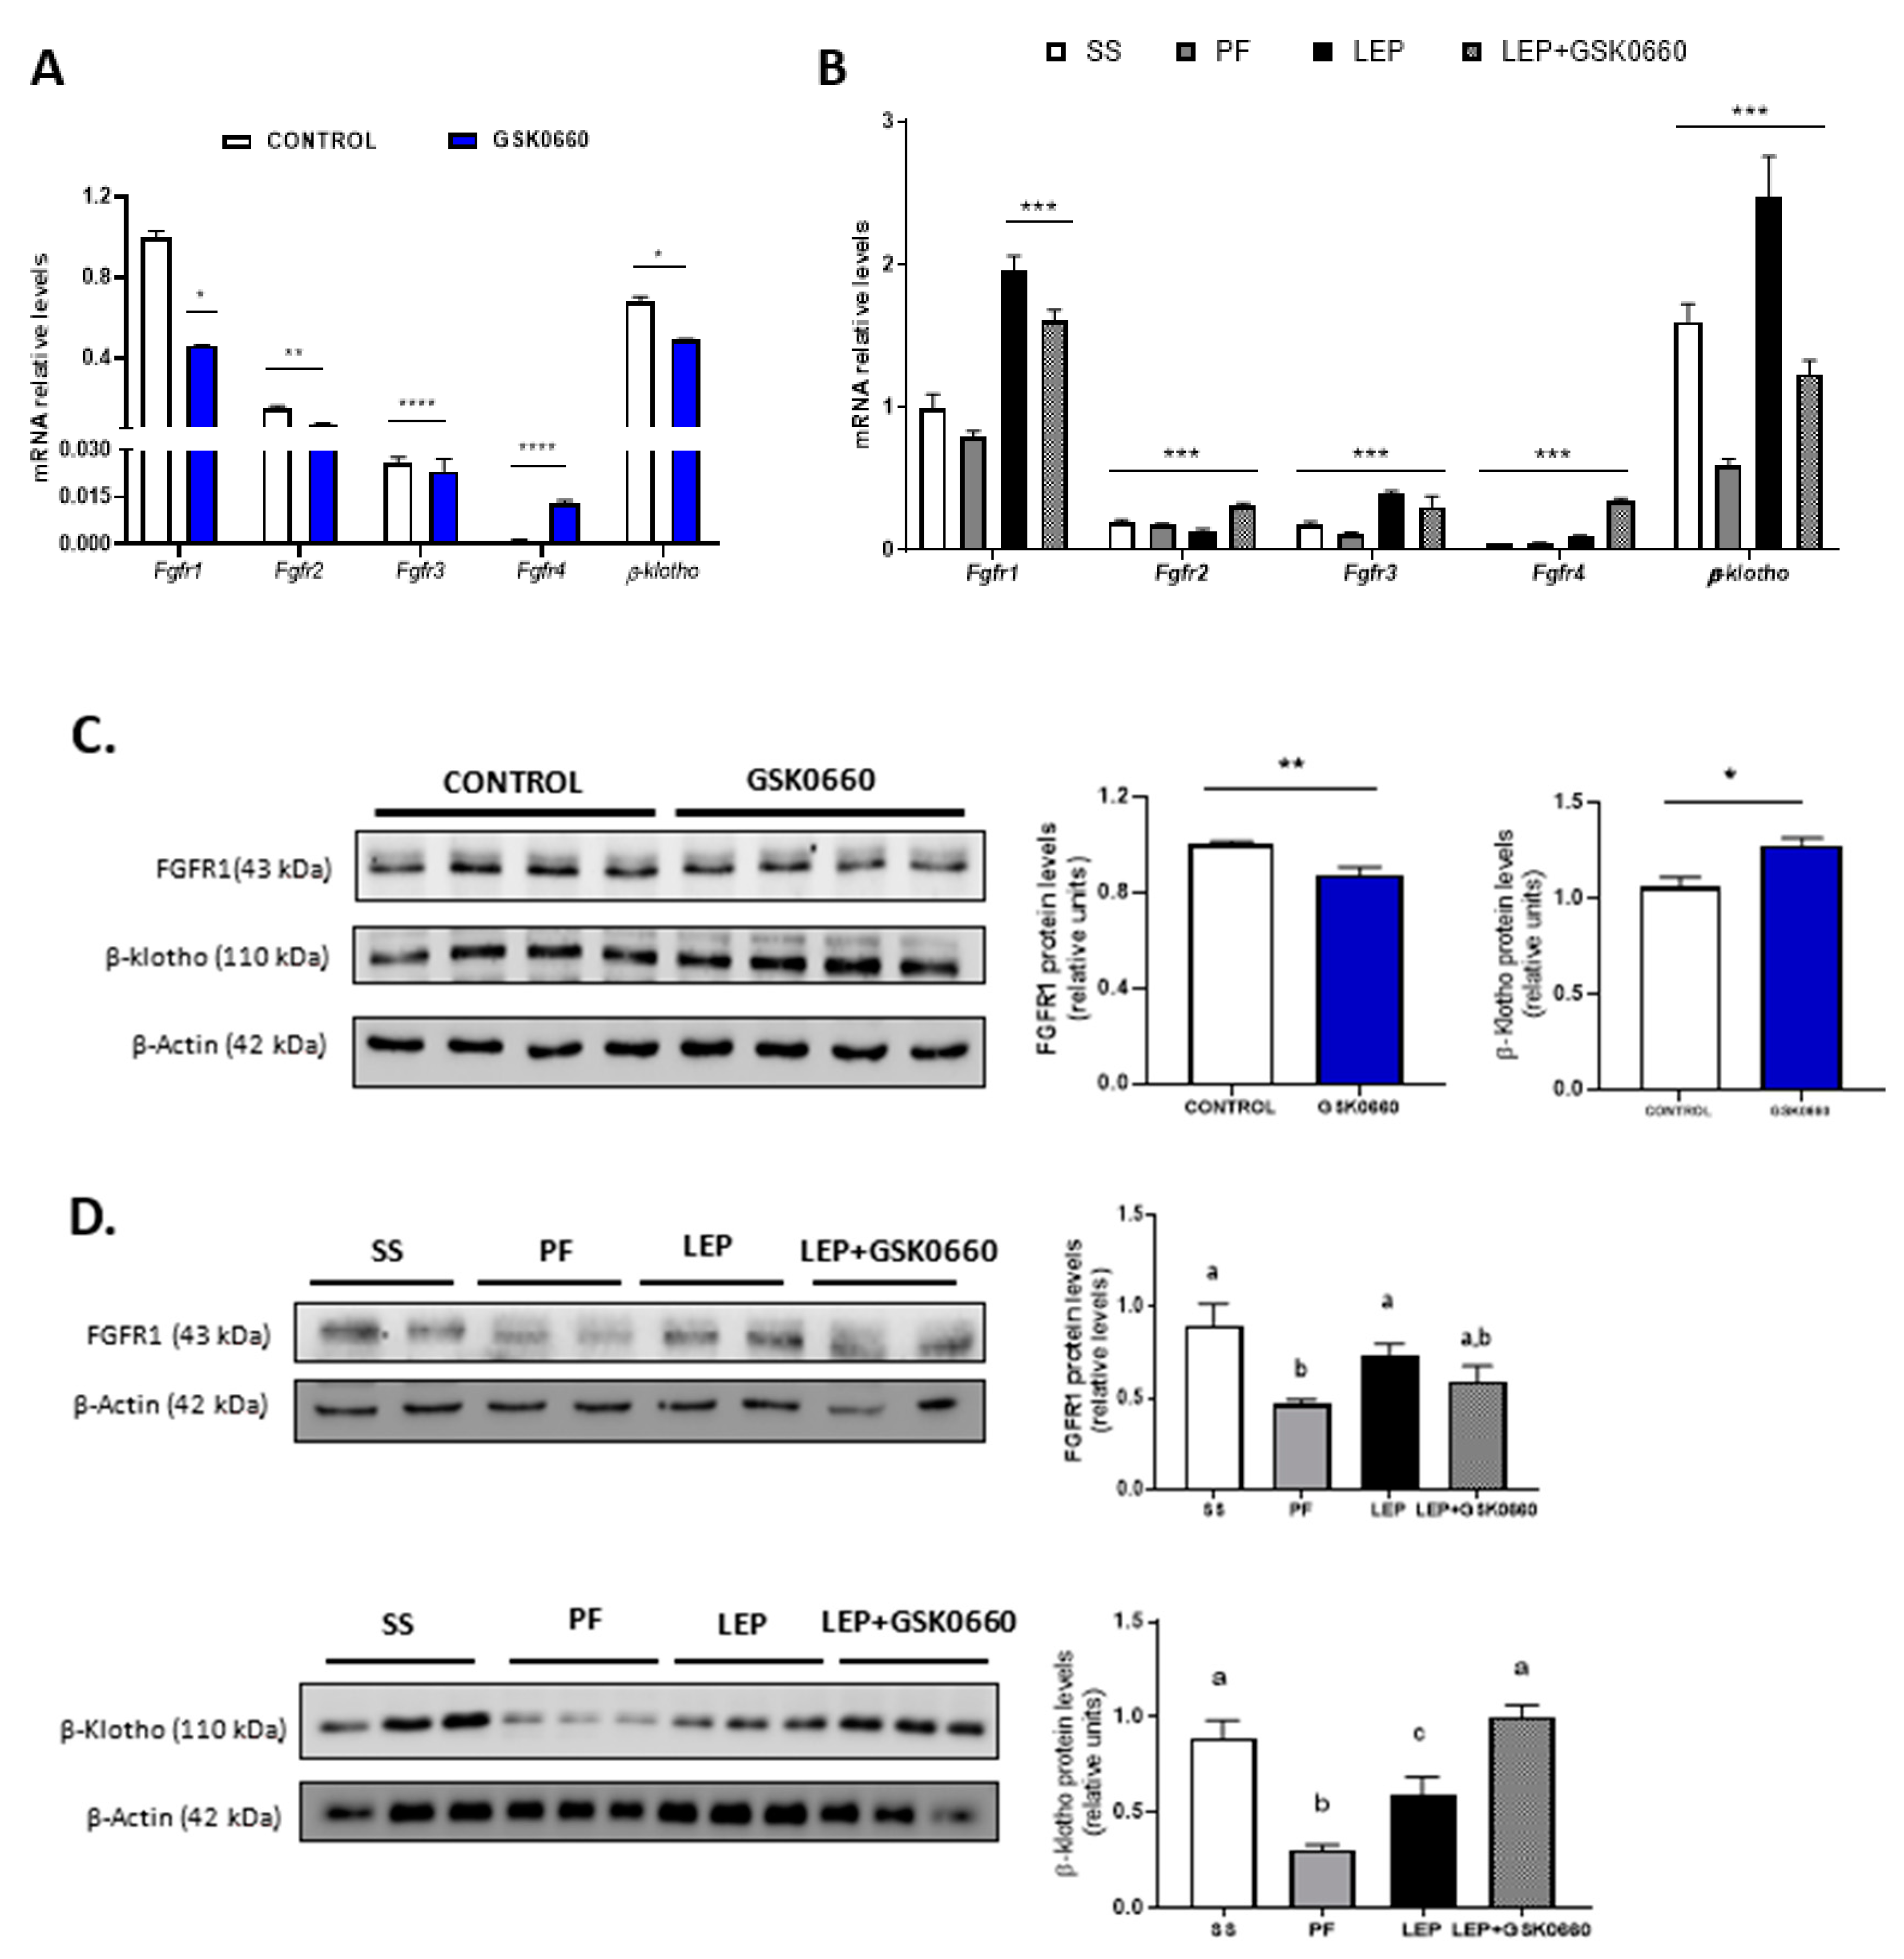
2.4. Enhancement of β-Klotho Protein Levels in eWAT by Both icv Leptin, or Leptin and ip GSK0660 co-Treated Rats

Fibroblast Growth Factor 21 (FGF21) has been described as a potent metabolic regulator with anti-diabetic properties, but still a complex hormone with unknown functions in multiple target tissues [19,40]. Hepatic FGF21 is a negative regulator of adipose tissue lipolysis during fasting [41], while FGF21 locally released by 3T3-adipocytes, after β-adrenergic stimulation, induces insulin-independent glucose uptake in these cells through an autocrine mechanism [20].
As shown in Table 1, in non-leptin-treated rats antagonist GSK0660 administration alone did no change circulating levels of FGF21, while reduced mRNA levels of β-klotho and Fgfr1, the main protein receptors of this family expressed in eWAT (Figure 4A). In accordance, FGFR1 protein levels were decreased after GSK0660 administration (Figure 4C). Nevertheless, β-klotho protein levels were increased in eWAT after GSK0660 treatment (Figure 4C). As FGF21/FGFR1 cascade phosphorylates the extracellular signal-regulated kinases 1 and 2 (ERK1/2) and regulates Glut4 expression, we further evaluate the ratio phosphorylated ERK1/2 to total ERK1/2 and the mRNA levels of Glut4 (also a target of ERK1/2) in eWAT at basal levels. Although the basal levels of both p-ERK and total ERK were decreased after inhibition of PPARβ/δ receptor (* p = 0.048, ** p = 0.003, respectively, Student’s t test) (Figure 5A), the pharmacological inhibition of PPARβ/δ with GSK0660 increased the ratio p-ERK/ERK in eWAT (Figure 5A).
Despite not having changes in liver FGF21 protein levels (Supplemental Figure S1), leptin infusion markedly reduced serum levels of the hormone in both leptin-treated group of rats, comparing with its pair-fed control group (Table 1), in which FGF21 levels were acutely increased very likely due to fasting and caloric-restricted state. Inhibition of PPARβ/δ did not apparently affect FGF21 circulating levels when it was co-administered with leptin (Table 1). Thus, the effects of leptin on circulating FGF21 are not dependent on PPARβ/δ activity. Upon central administration of leptin for 7 days, the mRNA and protein levels of FGFR1 and β-klotho were notably induced in eWAT when compared to its pair-fed treated rats (Figure 4B,D). Moreover, the pharmacological inhibition of PPARβ/δ in leptin-treated rats decreased mRNA levels of both FGFR1 and β-klotho in leptin-treated rats (Figure 4B). Unexpectedly, the inhibition of PPARβ/δ did not reduce FGFR1 and β-klotho protein levels in eWAT (Figure 4D).
As indicated above, GSK0660 administration did not alter serum FGF21 levels in leptin-treated rats. However, FGFR1 protein levels and Fgfr1 and β-klotho expression were downregulated in these rats (Figure 4B,D). As shown in Figure 5B, basal phosphorylated state of ERK1/2 was also reduced compared to saline-infused ad libitum fed rats (SS), suggesting a decrease in eWAT proteins from FGF21 signaling cascade during caloric restriction. Interestingly, when leptin was centrally infused, circulating levels of FGF21 notably decreased in these rats, independently of the anorexigenic effects of leptin, while both FGFR1 and β-klotho gene expression and protein levels were upregulated. Furthermore, the stage of the activated form of ERK1/2 is maintained similar to levels found in pair-fed rats (Figure 5B). In line with this result, epididymal Glut4 expression was significantly decreased in both leptin-treated rats (Figure 5B). These data agree with the fact that subcutaneous FGF21 treatment increase pERK1/2 levels as a consequence of the increase in circulating levels of FGF21, as previously reported [42]. All these results might suggest that eWAT response/sensitivity to circulating FGF21 is potentiated in leptin-treated rats and point, for the first time, to a clear role of PPARβ/δ and central leptin in modulation of FGF receptors expression and FGFR1-β-klotho receptor complex levels in eWAT, which, according with recent reports [43,44], affect the sensitivity of eWAT to FGF21.

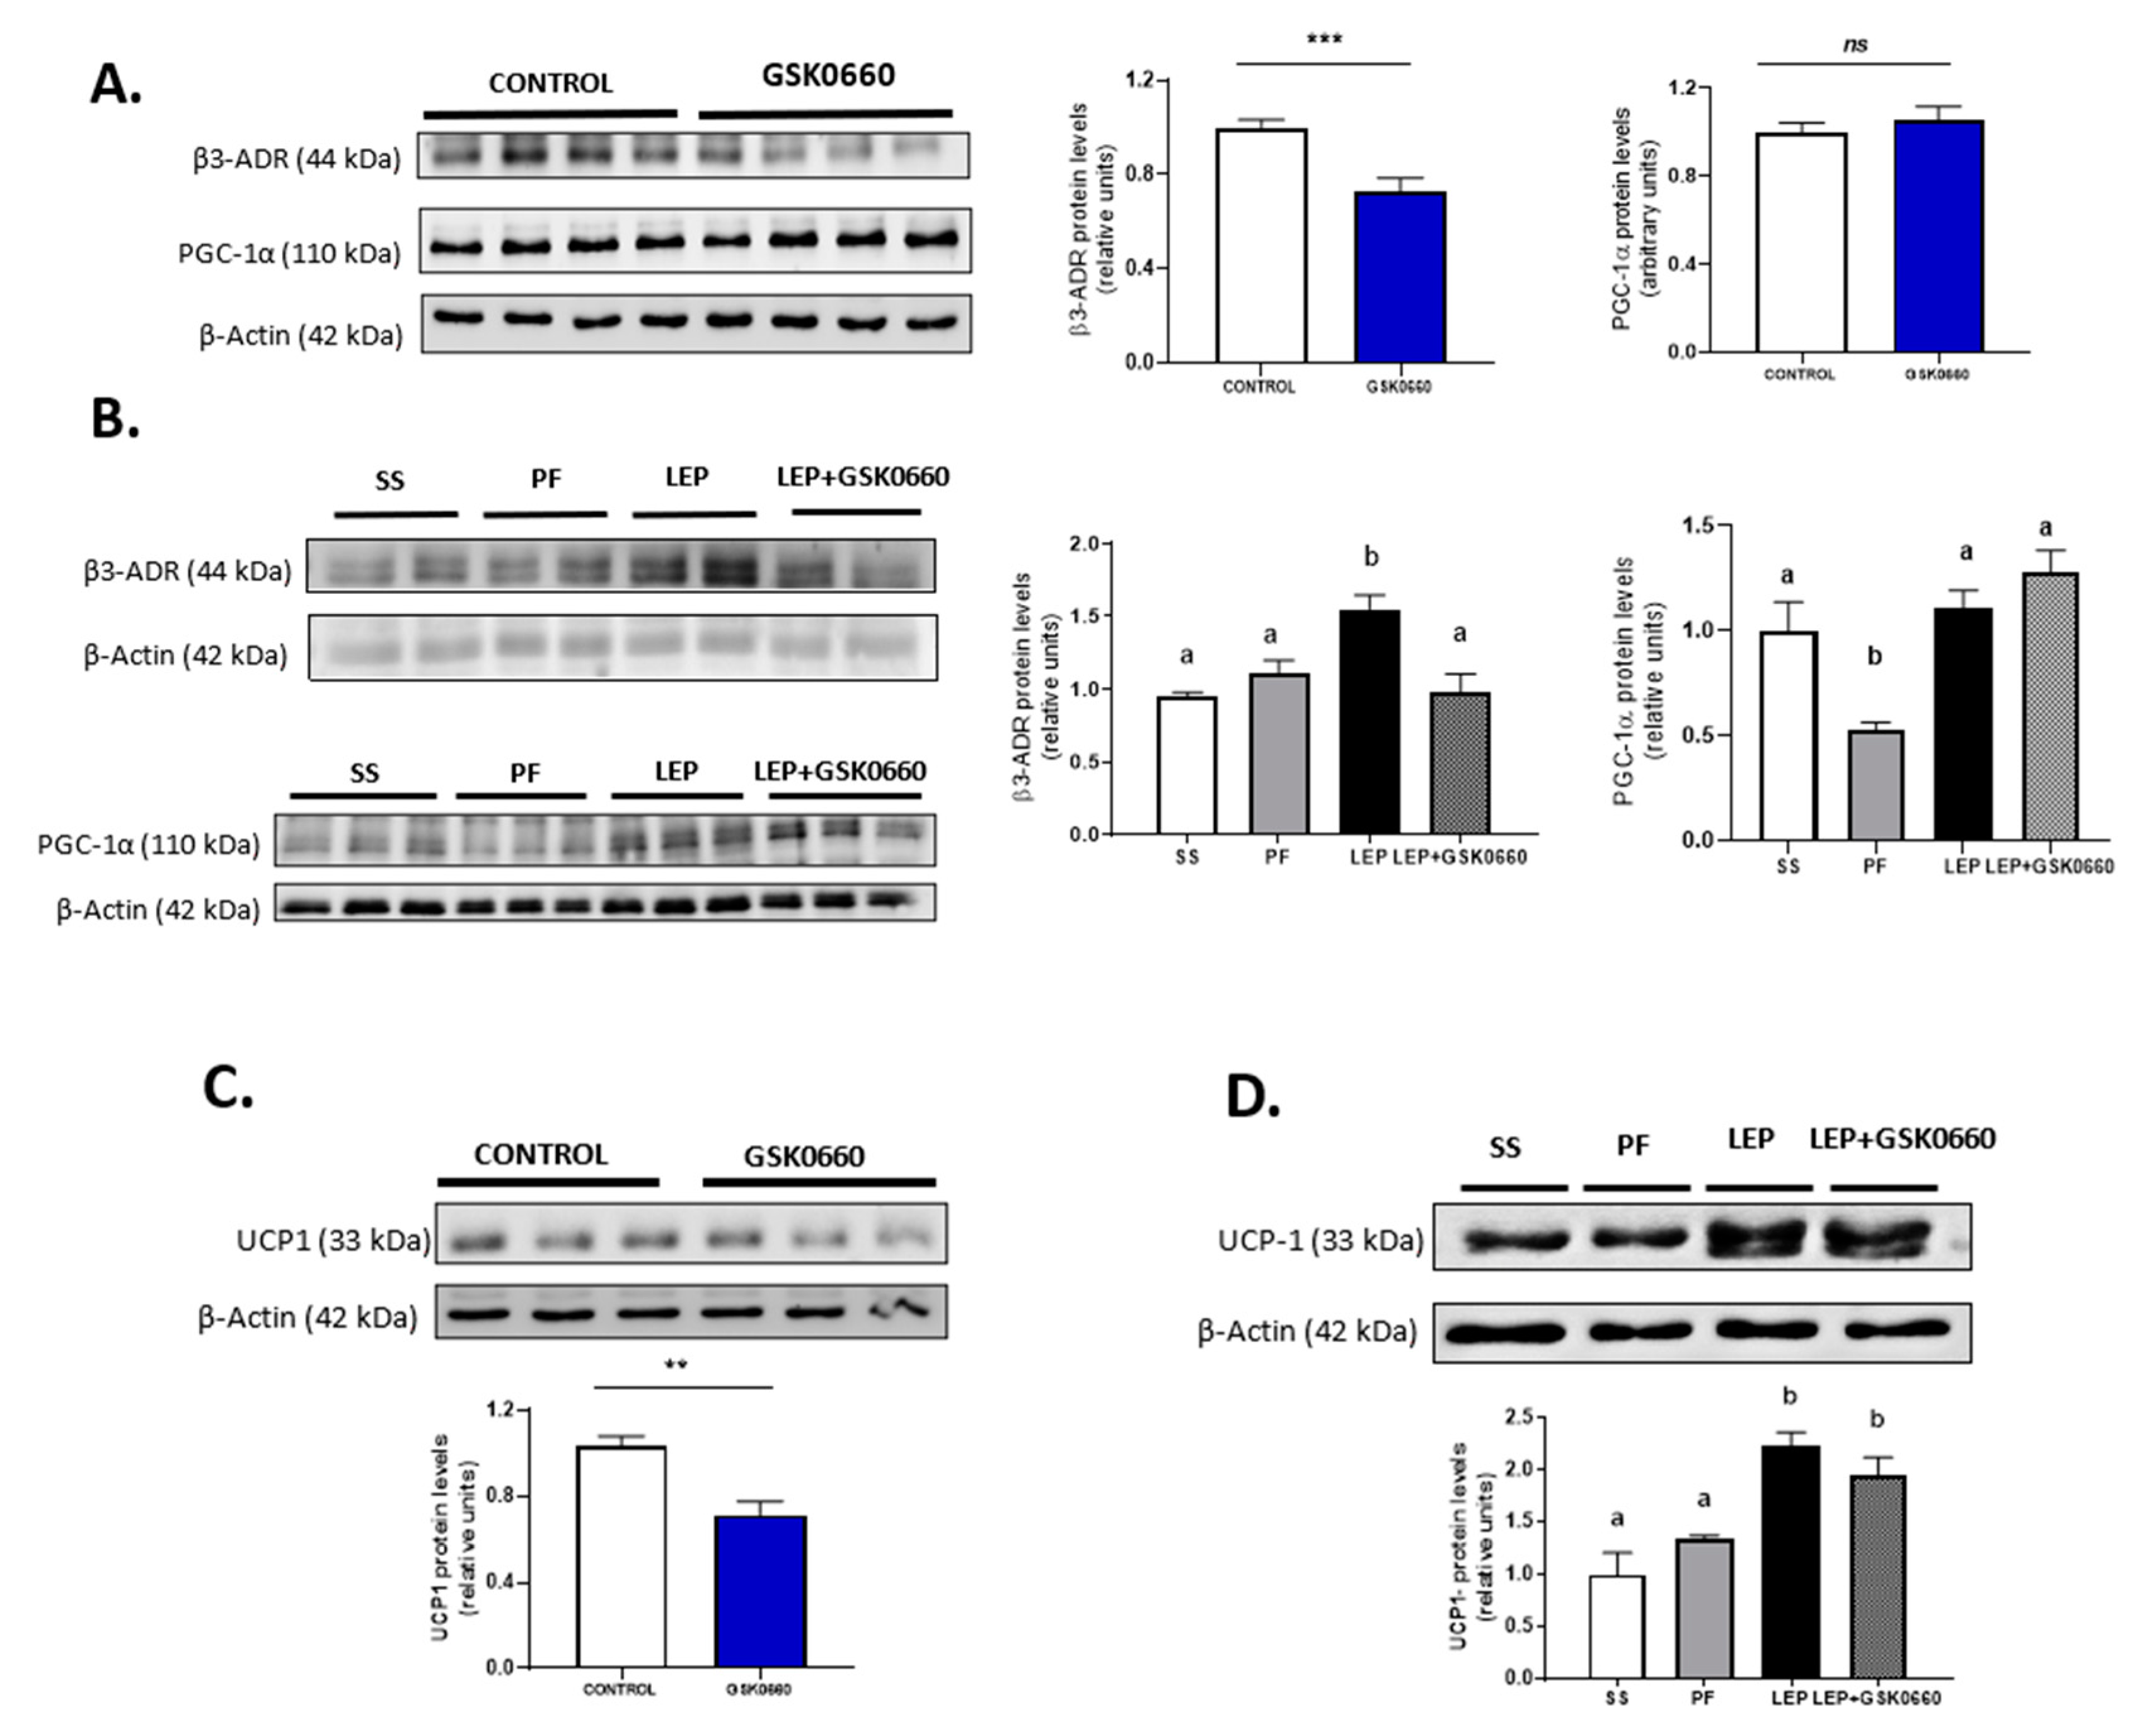
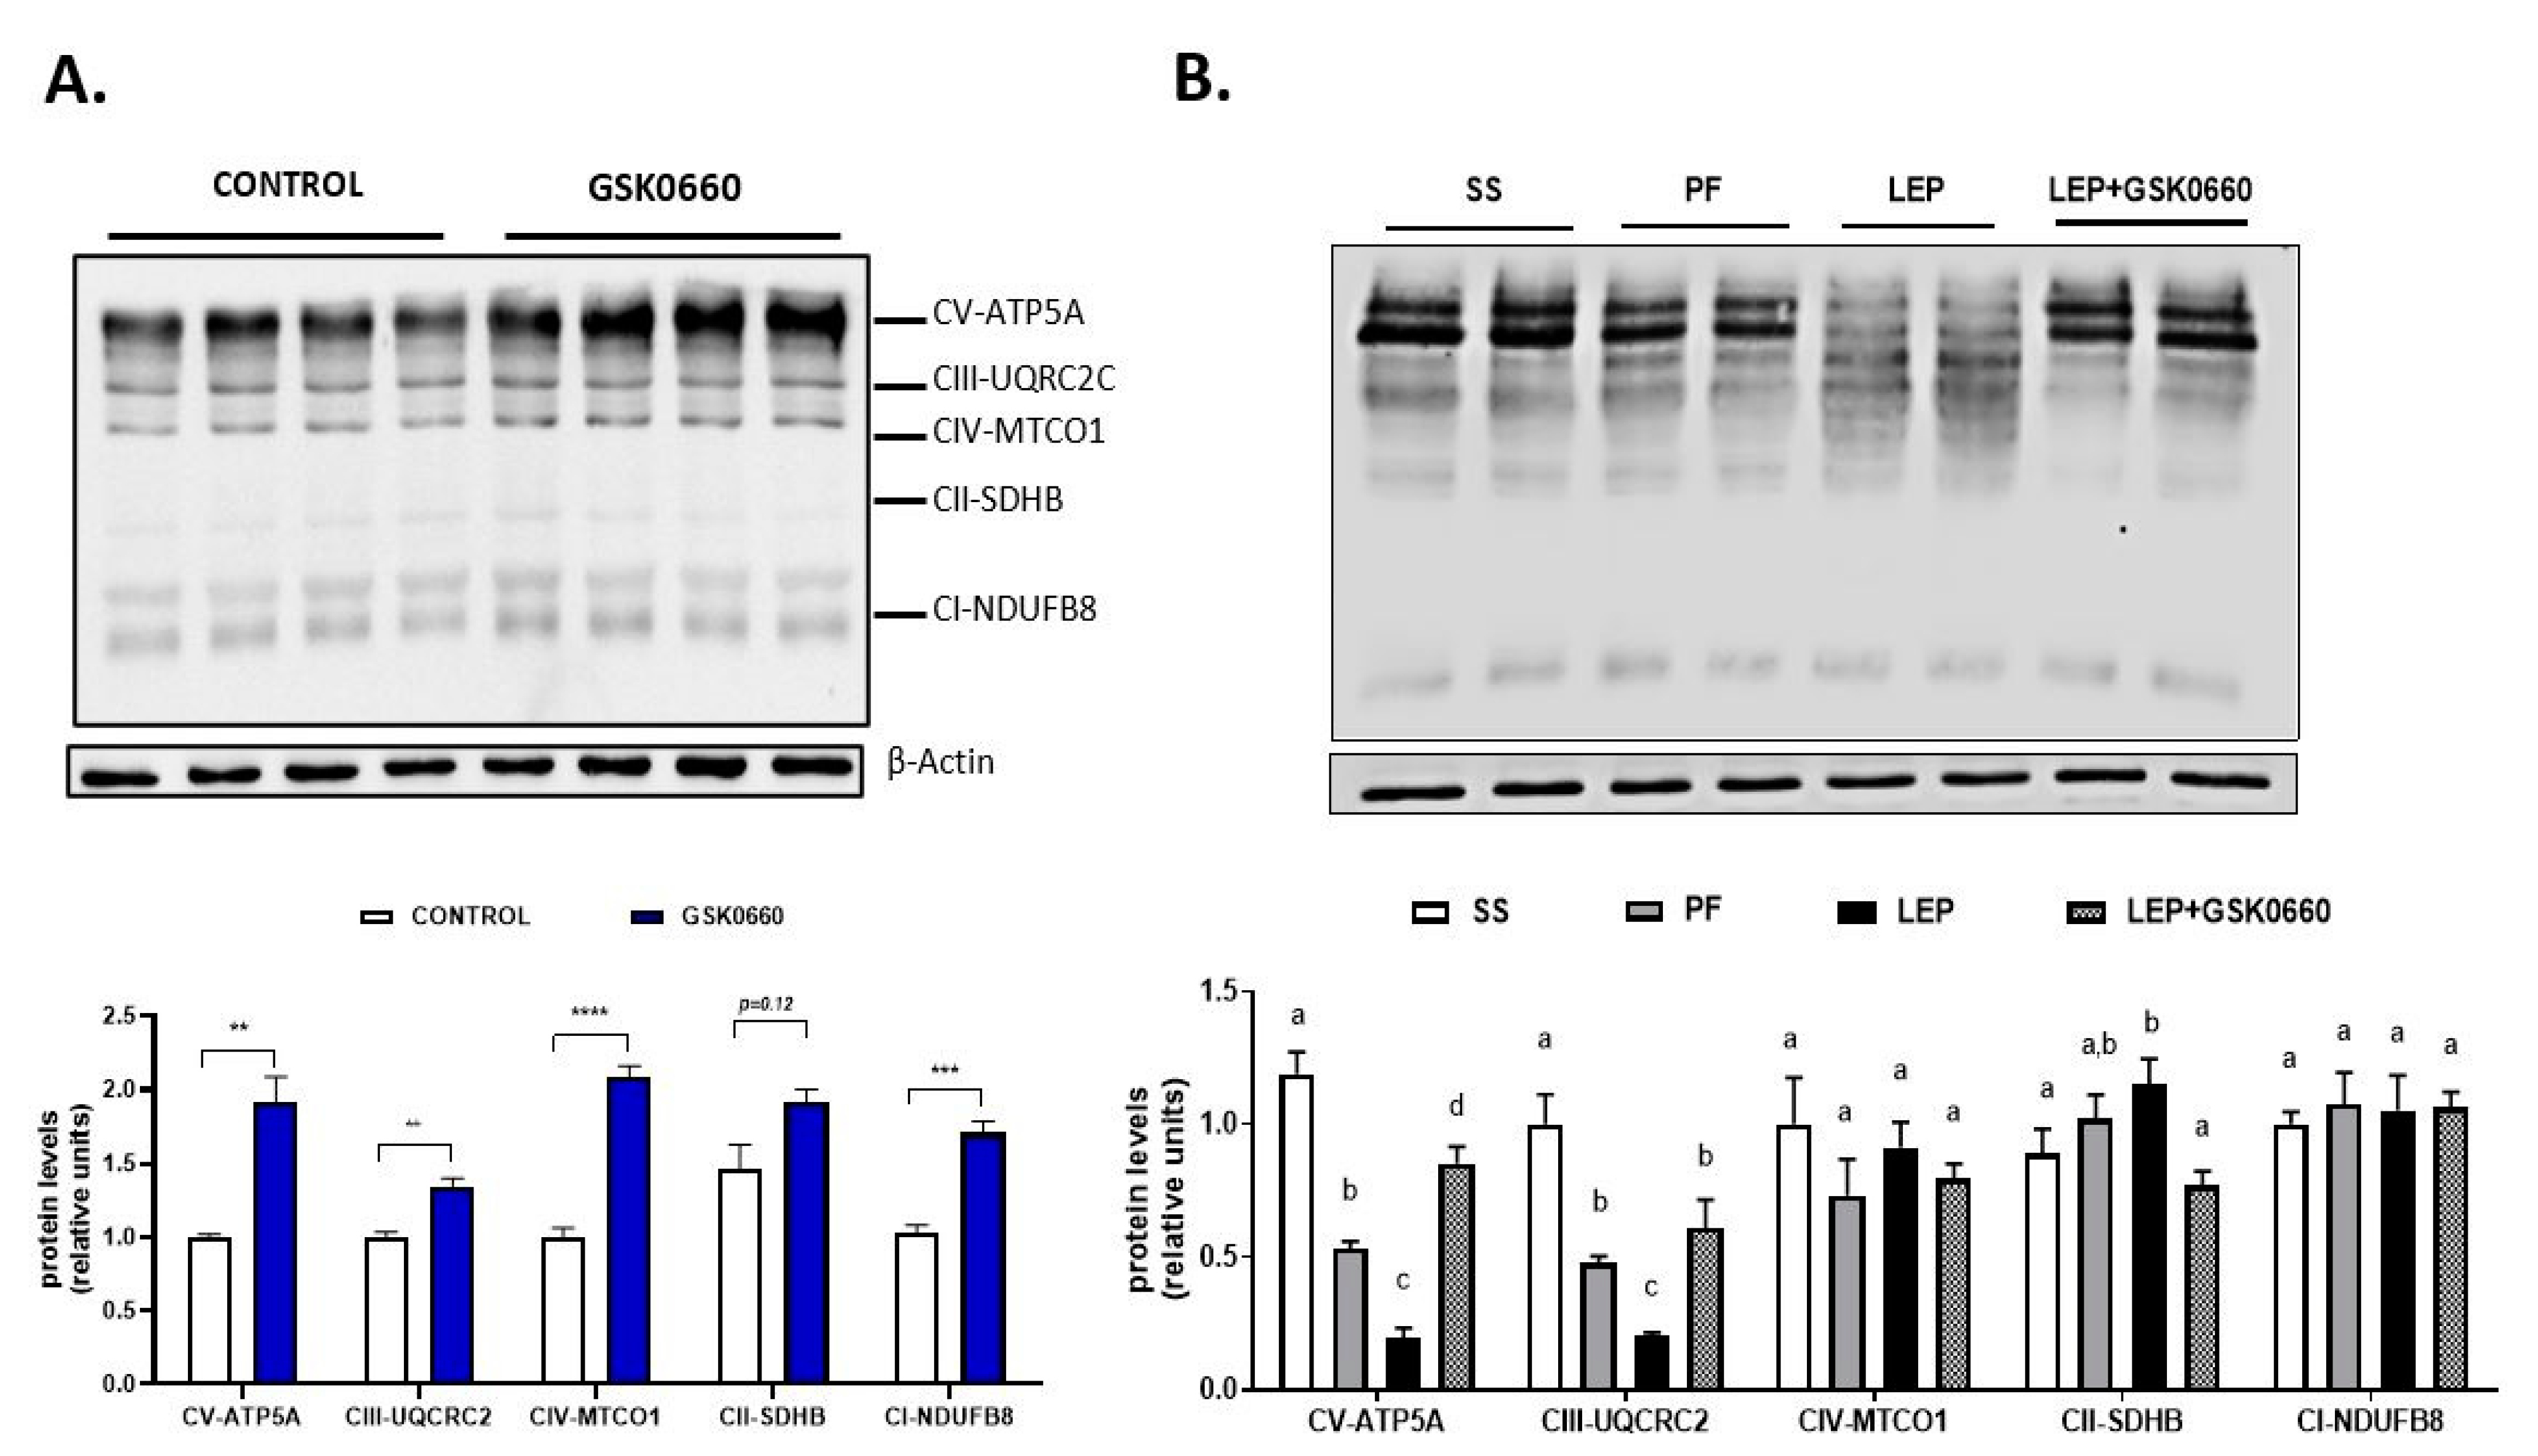
2.5. PPARβ/δ Activity Is Essential in Promotion of FGF21 Endogenous Expression and Browning Program in eWAT Induced by Central Leptin

It is known that endocrine FGF21 action is largely due to liver-secreted FGF21. However, under certain conditions adipocytes increase their own production of FGF21. The adipose tissue-derived FGF21 is thought to act in an autocrine/paracrine manner on adipocytes, independently of serum levels of the hormone. In this regard it has been demonstrated that male Wistar rats acclimated to cold (4 °C for 7 days) reduced their circulating levels of FGF21 but increased FGF21 secretion from white adipocytes [22,45]. Then, we analyzed mRNA and protein levels of FGF21 in eWAT.
In non-leptin-treated rats, GSK0660 treatment did not modify mRNA nor protein levels of adipose FGF21 in eWAT (Figure 5C,D). However, leptin administration acutely increased Fgf21 gene expression in eWAT and potentiate protein levels by ~3-fold when compared with both vehicle-infused rats (SS and PF) (Figure 5E,F). Interestingly, inhibition of PPARβ/δ activity during leptin infusion practically abolished FGF21 abundance in eWAT (Figure 5F). These results might suggest that indirect induction of PPARβ/δ by central leptin is implicated in the control of FGF21 production by eWAT.
Lastly and because previous studies demonstrated that adipose tissue ‘browning’ have been observed in response to FGF21 administration [21,46], we analyzed whether brain leptin-PPARβ/δ pathway could play a role in the transcriptional program that control white fat metabolic reprogramming during adrenergic stimulation. First, we tested β3-adrenergic receptor expression and expression levels of several markers of browning, as well as protein levels of the main uncoupling protein UCP-1 and the content of mitochondrial oxidative phosphorylation complex (OXPHOS) in eWAT, to elucidate the role of central leptin and the effect of PPARβ/δ inhibition on the transcriptional regulation of the browning process.
The administration of GSK0660 notably decreased both β3-Adr and Pparɣ gene expression in non-leptin-treated rats (Table 3), being the latter one of the inductors of browning and Fgf21 expression in WAT. The protein levels of β3-adrenergic receptor were also reduced in eWAT after inhibiting PPARβ/δ activity (Figure 6A). In contrast, the gene expression of PPARɣ co-activator, Pgc-1α, was increased by GSK0660 treatment although its protein abundance was similar to the control levels (Table 3, Figure 6A). As expected, total UCP-1 protein levels were markedly reduced in eWAT after GSK0660 administration (Figure 6C) as well as the gene expression of the browning marker P2rx5, remaining Prdm16 and Tbx15 mRNA levels unchanged (Table 3).
Leptin infusion induced β3-Adr mRNA and protein levels in eWAT (Table 3, Figure 6B). Moreover, inhibition of PPARβ/δ upon leptin administration decreased the mRNA levels of both β3-Adr and Pparɣ, and β3-adrenergic receptor protein levels (Table 3, Figure 6B). In addition, mRNA levels of Pgc-1α were notably increased when icv leptin and ip GSK0660 were co-administered, without overtly changes in its protein levels (Table 3, Figure 6B). Interestingly, chronic icv leptin administration was able to increase UCP-1 protein levels in eWAT and partially prevented the decrease of this protein induced by the pharmacological inhibition of PPARβ/δ (Figure 6D). Furthermore, leptin administration also increased the expression of the browning markers Prdm16 and P2rx5, and GSK0660 notably downregulated both genes when was co-administered with leptin (Table 3), indicating that GSK0660 decreases the browning capacity of eWAT after central leptin infusion.
It has been reported that in ob/ob mice, 30% of the weight loss induced by the subcutaneous injection of leptin is due to changes in energy expenditure [13]. Moreover, these authors described that in ob/ob mice leptin decreased the protein levels of three substrate oxidation complexes (OXPHOS) in liver and heart, following by a reduction in basal metabolic rate and mitochondrial volume density. In agreement with these data, we have recently reported similar results in heart after chronic icv leptin infusion in rats [28]. Hence, we investigate whether leptin and/or the pharmacological inhibition of PPARβ/δ could alter mitochondrial activity driven by OXPHOS complexes in eWAT. In addition, we measured the mRNA levels of the transcription factor NF-E2-related factor 2 (Nrf2) that plays a key role in the maintenance of cellular redox balance and detoxification [47].
In non-leptin-treated rats, Nrf2 gene expression in eWAT was notably decreased upon antagonist GSK0660 administration (Table 4). Nevertheless, GSK0660 increased ~2-fold the abundance of OXPHOS complexes CV, CIII, CIV, and CI (Figure 7A). Hence, these data suggest that PPARβ/δ is involved in the control of mitochondrial OXPHOS complexes content in eWAT. On the other hand, chronic leptin infusion notable increased Nrf2 mRNA levels when compared with pair-fed rats, but this effect was abolished when GSK0660 was co-administered with leptin (Table 4). Two subunits of OXPHOS system, complexes V and III, the main site of ATP synthesis and ROS production, respectively, were significantly decreased by central leptin treatment compared with pair-fed control rats (Figure 7B). Curiously, low levels of ATP-synthase are considered as an important feature of rodent brown adipose tissue and have also described in brite-fat mitochondria [48,49]. Interestingly, PPARβ/δ inhibition abolished the effects of leptin in mitochondrial OXPHOS complexes content in eWAT (Figure 7B).

3. Discussion

In the current study, we analyze the implication of PPARβ/δ as a potential mediator of both central and peripheral metabolic, inflammatory, and immunomodulatory actions of leptin acting on the CNS. Because currently little is known about the role of PPARβ/δ in visceral WAT, we focus our attention on the in vivo blockage of PPARβ/δ in eWAT from chronic icv leptin treated rats. Herein, we demonstrate that leptin, acting through hypothalamic neural circuits and the SNS, increases PPARβ/δ expression in eWAT and that leptin effects on browning and inflammation of visceral adipose tissue are partially regulated by PPARβ/δ. Moreover, our results also unveil that PPARβ/δ is involved in the up-regulation of FGF21 expression induced by leptin in eWAT.
Neuronal-specific deletion of PPARβ/δ has been reported to lead to general leptin insensitivity after treatment with ip leptin [32]. In this sense, an important finding of our study is that pharmacological inhibition of PPARβ/δ generates insensitivity to the appetite-suppressing effects and therefore to the anti-lipidemic effects of brain leptin in eWAT.
PPARβ/δ is a sensor of the cellular lipid environment and a regulator of inflammation and oxidative stress [26]. As a receptor, it binds lipid molecules that activate its ability to modify gene expression and then the behavior of cells in a new environment. Overexpression of a constitutive active form of PPARβ/δ in Leprdb/db mice adipose tissue decreased adiposity and reversed the obesity phenotype [25]. In support of this, these authors showed that an acute treatment with a PPARβ/δ agonist GW501516 depletes WAT lipid accumulation in these genetically obese mice, suggesting that the anti-obesity actions of PPARβ/δ are not dependent on leptin signaling pathways [25]. Nevertheless, PPARβ/δ-null mice but not adipose tissue-specific PPARβ/δ-knockout mice are extremely lean and have reduced adipose stores [50,51]. Furthermore, several lines of evidence suggest that PPARβ/δ and leptin signaling are interconnected, because neuronal-specific PPARβ/δ knockout mice are leptin resistant [32] and downregulation of leptin upon PPARβ/δ activation have been seen in liposarcoma cells [52].
In the present study we provide new insights on the mechanisms by which chronic central leptin administration exert its anti-obesity actions through the CNS. These involve the activation of PPARβ/δ and the improvement of the browning capacity in eWAT. In this regard, our data show that leptin acting through the SNS dampens the effects of GSK0660 on the expression of leptin in eWAT. Secondly, the pharmacological inhibition of PPARβ/δ upon ip GSK0660 injection, a selective antagonist inhibitor of PPARβ/δ, abolishes the effects of icv leptin on the expression of Ob-Rb in eWAT, which could impair the direct effect of leptin on eWAT metabolism and innate/adaptive immune response.
In fact, we found that GSK0660 treatment appears to change the immune cells balance in eWAT towards a more inflammatory profile, but flow cytometry analysis is needed to validate these observations. In addition, inhibition of PPARβ/δ increases Npy but decreases Ccl5 expression in hypothalamus from icv leptin treated rats, which correlates with the abolishment of the anorexigenic effects of leptin by GSK0660. Thus, our data support that PPARβ/δ could be involved in the crosstalk between CNS, immune system, and the remodeling of visceral WAT promoted by the hormone/cytokine leptin.
On the other hand, our data shed a new light on the own PPARβ/δ metabolic action on eWAT. In the absence of ligands and/or ligand precursors generated by increased lipolysis in eWAT in response to brain leptin infusion [6,7], the pharmacological inhibition of PPARβ/δ decreased PPARγ expression and increases cholesterol and TAG content in eWAT and, consequently, the mRNA levels of both leptin and the main leptin receptor Ob-Rb. More importantly, GSK0660 administration markedly decreased the endogenous FGF21 content in eWAT and increased the levels of OXPHOS system in this tissue. Lower expression of PPARγ is linked to the pathogenesis of metabolic syndrome [53], whereas increased OXPHOS have been associated to increased basal respiration and oxidative stress [54,55] a characteristic of adipocytes from insulin resistant obese-nondiabetic humans and mice [56]. In our setting, GSK0660 alone increases circulating levels of insulin an indicator of insulin resistance.
FGF21 plays very important roles in the regulation of energy dissipation and balance [16,17,57]. Here, we report for the first time that chronic leptin administration notably decreased the circulating levels of FGF21, independently of the anorexigenic properties of leptin and/or the presence of GSK0660. In parallel, central leptin infusion increased the components of FGF21 signaling machinery in eWAT compared with pair-fed rats, supporting the idea that leptin through the brain controls the visceral adipose tissue response to FGF21. Although there is little evidence on the relationship between FGF21 signaling and PPARβ/δ activity in visceral WAT, our results suggest that global inhibition of PPARβ/δ could reduce the potential endocrine action of FGF21 in eWAT.
In addition, icv leptin infusion increased the expression of several browning hallmark markers as Pdk4, β3-Adr, Prdm16, and P2rx5, as well as β3-Adr, PGC-1α, and UCP1 protein levels in eWAT. These results indicate the presence of cells within this visceral WAT depot with a gene expression pattern similar to “beige” or “brite” cells [58,59] confirming leptin’s browning capacity in eWAT. Interestingly, these results correlate with the acutely increase of FGF21 expression in eWAT by leptin infusion.
Previous studies have described PPARβ/δ as a candidate for browning induction in fat cells [25,60,61]. In line with these observations, the pharmacological inhibition of PPARβ/δ by GSK0660 decreased Pdk4, β3-Adr, PPARɣ, and P2rx5 gene expression and β3-Adr and UCP-1 protein levels in eWAT from rats chronically treated with icv leptin, confirming that leptin action on the CNS and via SNS activates lipolysis [6,7] generating tissue-specific PPARβ/δ ligands and/or ligand precursors which, once present in adipose tissue, might also induce the browning capacity of this tissue. Nevertheless, further work has to be done in order to confirm the molecular nature of the ligands that might activate PPARβ/δ in eWAT, in response to the increased lipolysis induced by central leptin in this tissue.
It was unexpected that the pharmacological inhibition of PPARβ/δ with the specific antagonist GSK0660 totally blunted the endogenous FGF21 protein content of eWAT in leptin treated rats. Although FGF21 expression and effects, including its browning capacity, are closely associated with PPARα and PPARɣ activity [62,63], a study in humans with PPARs agonists revealed that treatment with the PPARβ/δ agonist (GW501516) increased the circulating levels of FGF21, providing evidence of a metabolic relationship between PPARβ/δ isoform and FGF21 expression [64]. Our results suggest that the activation of PPARβ/δ in visceral adipose tissue in response to icv leptin infusion regulates the endogenous expression of FGF21 contributing to white-to-beige cell transition in eWAT (summarized in Figure 8). In this sense, direct central leptin action in the hypothalamus, and/or indirect effects mediated by SNS on eWAT and heart [28], could increase energy expenditure and decrease body weight in rats.
Finally, it has been generally stated that impaired mitochondrial phosphorylation becomes a metabolic disturbance underlying insulin resistance and obesity development in humans and rodents [55]. Nevertheless, other works revealed that impaired OXPHOS function can increase lifespan in Drosophila melanogaster, Caenorhabditis elegans, and rodents [65,66,67]. In addition, genetic models characterized by decreased adipocyte OXPHOS point to a protective role of FGF21 in mediating tissue specific adaptation to this cellular stress [14,68]. Although the specific mechanism by which the production of FGF21 by visceral adipose tissue has not been described, herein we show that PPARβ/δ could be an essential factor for inducing endogenous expression of FGF21 in eWAT in response to central leptin signaling. Furthermore, the pharmacological inhibition of PPARβ/δ by the antagonist GSK0660 has a huge impact in visceral fat accretion, reduction of FGF21 endogenous production and white-to-beige fat transformation in eWAT. This study has some limitations. Despite the lipophilic nature of GSK0660, we do not have direct confirmation on whether the intraperitoneal GSK0660 administration can pass the brain–blood barrier (BBB) leading to the inhibition of the hypothalamic PPARβ/δ activation mediated by central leptin. However, several lines of evidences reported herein support that GSK0660 can indeed pass the BBB. The pharmacological inhibition of PPARβ/δ increased Npy and decreased Ccl5 expression in the hypothalamus, both involved in the hypothalamic control of food intake and regulated by central leptin in an opposite way. On the other hand, GSK0660 administration blunted the anorectic and adipostatic effects induced by leptin in the brain leading to visceral fat accretion and reducing both the endogenous FGF21 protein content and the browning capacity of this tissue. However, we do not know whether the regulation of CCL5 expression by leptin in hypothalamus requires signals from the periphery or is linked to a central local effect, or whether the effect of GSK0660 on hypothalamic neurons is direct or indirect. Hence, further work has to be done before a final conclusion can be drawn about this issue. Overall, our results contribute to understand the mechanisms by which PPARβ/δ and leptin acting through the CNS exert its effects on eWAT. Nevertheless, future studies are needed to determine how leptin enhances central or peripheral PPARβ/δ activity and to test the role of PPARβ/δ as a potential mediator of leptin in the brain–visceral fat crosstalk.

4. Materials and Methods

4.1. Experimental Animals

Experiments were performed in male 3-month-old Wistar rats. Animals were randomly housed individually, to control their food intake and thereby avoid differences in adipose tissue weight and serum levels of hormones and metabolites that depend on the amount of feed eaten by animals. All the animals were fed with a standard chow diet and water and maintained in ventilated-controlled quarters (20–25 °C temperature, 50–55% humidity, and 12 h-light cycle 8 a.m.–8 p.m.). Body weight and food intake was monitored daily during all the treatments. Animals were handled according to European Union’s laws (2010/63/EU) and following Spanish regulations (RD 53/2013) for laboratory animal use. Experimental protocols with animals were approved by the Institutional Committee for Ethical Animal Care CEEA/UCLM (Permit Numbers CE/301012 and CE/99-1835-A308, research proposal approved respectively, on 30 October 2012 and 17 May 2019). All efforts were made to reduce the number of animals used and minimize animal suffering.

4.2. PPARβ/δ Antagonist (GSK0660) Administration

Pharmacological antagonist GSK0660 for PPARβ/δ inhibition was administered in both experiments as previously described at a dose that does not induce toxic side effects in rats [69,70]. Briefly, GSK0660 was diluted first in DMSO (less than 1%) and later in 0.9% NaCl. Then, it was injected daily ip (1 mg/kg per day) during 7 days to GSK0660 group and LEP+GSK0660 group of rats, while the CONTROL and LEP groups received in parallel an ip injection of vehicle at 2 mL/kg (0.062% DMSO). After 7 days of treatment, all animals were fasted (overnight 12 h), anesthetized by CO2 inhalation and sacrificed by decapitation at 09:30 a.m. Tissue samples were rapidly dissected and snap frozen in liquid nitrogen. Serum was obtained by centrifugation (1000 g, 10 min).

4.3. Intracerebroventricular Leptin Administration

The ICV leptin (LEP, LEP+GSK0660) or vehicle administration (SS, PF) in young 3-month-old rats was performed as described [27,28] (see Supplementary information for details). To evaluate the role of PPARβ/δ on central leptin effects, the group LEP+GSK0660 was infused with leptin and co-administered ip with antagonist GSK0660 as previously described. Body weight and food intake was measured daily during the experiment. After 7 days of experiment, animals were sacrificed as previously described (see “PPARβ/δ antagonist GSK0660 administration” section).

4.4. Biochemical Assessment

Serum hormone and metabolites levels were measured as described [27,28] (see Supplementary information for details). Triglyceride and cholesterol content in epididymal white adipose tissue was extracted from 100 mg frozen tissue by chloroform-methanol (2:1 v/v) and was determined using enzymatic reagents following manufacturer’s instructions (Triglyceride: #11528; cholesterol: #11505; BioSystems, Barcelona, Spain).

4.5. Quantitative Transcription Analysis with Real Time Polymerase Chain Reaction (qRT-PCR)

Total RNA was isolated from frozen tissues using RNeasy Lipid Tissue kit following manufacturer’s instructions (#74804, Qiagen, Venlo, Netherlands) after homogenization with 1 mL of Qiazol (#79306, Qiagen). Gene expression was performed by using ABI PRISM 7500 Fast Sequence Detection System instrument and software (Applied Biosystem, Foster City, CA, USA). Relative quantification of target cDNA in each sample was performed from cDNA in TaqMan One-Step real time PCR Master Mix (#4352042, PE Applied Byosystems, Foster City, CA, USA), using Pre-Developed TaqMan Assay Reagents (PE Applied Biosystem) for β-Klotho, Ccl5, Crh, Cpt-1α, Fgf21, Fgfr1, Fgfr2, Fgfr3, Fgfr4, Glut4, Nrf2, Pgc-1α, P2rx, 5 Prdm16, Pparα, Pparβ/δ, Pparɣ, and Tbx15 with FAM and 18S rRNA with VIC as real time reporter, according to manufacturer’s protocol, whereas Npy, Pomc, Trh, ObRb, and Leptin (ob) we used SYBR-Green One-Step real time PCR Master Mix was used (#4309156, PE Applied Byosystems, Foster City, USA) according to manufacturer instructions with primers supplied by Sigma-Aldrich (see Supplemental Tables S1 and S2 for details).

4.6. Epididymal White Adipose Tissue (eWAT) Total Extract Preparation

Tissues (100 mg) were homogenized in a manual Dounce homogenizer and lysed in homogenization buffer (50 mM Hepes-KOH, pH 7.4; 150 mM NaCl, 2 mM EDTA, 0,5% deoxycolate) containing proteases and phosphatases inhibitors (1 mM PMSF, 2 mM NaF, 10 µg/mL leupeptin, 10 µg/mL pepstatin, 10 µg/mL aprotinin, and 2 mM Na3VO4). The homogenate was centrifugated 10,000 rpm for 10 min at 4 °C to produce a total protein lysate of eWAT. All extracts were stored at −80 °C until use. Bradford protein assay was used for total protein quantification (#500-006, Bio-Rad, Hercules, CA, USA).

4.7. Hypothalamus Total RNA and Protein Extract Preparation

The hypothalamic regions were carefully dissected as previously described [71]. After that, hypothalamic regions were frozen in liquid nitrogen and stored at −80 °C until further processing. RNA and protein from hypothalamus were obtained using All Prep DNA/RNA/Protein Mini kit (Cat. No. 80004, Qiagen, Venlo, The Netherlands) following manufacturer’s instructions. The cDNA was synthesized from 1.5 μg of DNase-treated RNA. Bradford protein assay was used for total protein quantification (#500-006, Bio-Rad, CA, USA).

4.8. Western Blot Analysis and Inmunoblotting

Protein lysates (equal amounts of 20–30 µg) were separated under reducing condition (7.5–10% polyacrylamide concentration gels) SDS-PAGE. Samples were previously mixed with SDS sample buffer and boiled at 95 °C for 10 min. Proteins were transferred to nitrocellulose sheets (0.2 µm, Bio-Rad) and incubate overnight (12–16 h) at 4 °C with the appropriate primary antibodies, followed by incubation at room temperature for 2 h with corresponding secondary antibody conjugated with horseradish peroxidase (see Supplemental information for further details).

4.9. Statistical Analysis

Data are expressed as mean ± SEM. Statistical analysis was performed using the GraphPad Prism version 8.4 for Windows (GraphPad Software, San Diego, CA, USA). Differences between two groups were assessed using the unpaired Student’s t-test. Significant differences between more than two groups were assessed by one-way ANOVA followed by Tukey test as post-hoc analysis (different letters indicate significant differences among treatments). All differences were considered significant at p < 0.05. The number of rats used per experiments is stated in each figure legend.

Supplementary Materials

The following are available online at https://0-www-mdpi-com.brum.beds.ac.uk/article/10.3390/ijms22094624/s1, Figure S1: FGF21 mRNA and protein levels in liver of rats after 7 days of chronic central treatment; Table S1: Probes used for real time PCR, Table S2: primers sequences used for real time PCR; Table S3: mRNA levels of Ob-Rb, Pomc, Crh and Trh in hypothalamus.

Author Contributions

Conceptualization A.A. and N.G.; methodology L.M., C.P., B.R., and E.G.-B.; prepared figures L.M.; interpreted results of experiments L.M., A.A., and N.G.; funding acquisition N.G. and A.A.; edited and revised manuscript, L.M., C.P., A.A., and N.G.; approved final version of manuscript, L.M., C.P., B.R., E.G.-B., A.A., and N.G.; drafted manuscript, L.M., A.A., and N.G. All authors have read and agreed to the published version of the manuscript.

Funding

This work was supported by Research Grant RTI2018-098643-B-I00 from Ministerio de Ciencia, Innovación y Universidades, Spain, co-financed by the European Regional Development Fund (MCIU/AEI/FEDER, UE) and by Institutional Aids GI20174021 and 2019-GRIN-26992 (UCLM).

Institutional Review Board Statement

The study was conducted according to the guidelines of the Declaration of Helsinki and approved by the Institutional Committee for Ethical Animal Care CEEA/UCLM (Permit Numbers CE/301012 and CE/99-1835-A308, research proposal approved respectively, on 30 October 2012 and 17 May 2019).

Data Availability Statement

Al relevant data are included within the manuscript and in the Supplementary Materials.

Acknowledgments

We thank Sergio Moreno for the excellent technical assistance.

Conflicts of Interest

The authors declare no conflict of interest. The funders had no role in the design of the study; in the collection, analyses, or interpretation of data; in the writing of the manuscript, or in the decision to publish the results.

Abbreviations

ARCarcuate nucleus
Arg1Arginase-1
ATGLAdipose triglyceride lipase
Ccl5chemokine ligand 5
CNScentral nervous system
CPT-1aCarnitine Palmitoyltransferase 1a
Crhcorticotropin releasing hormone
ERK1/2extracellular signal-regulated kinase 1/2
FGF21Fibroblast Growth Factor-21
FGFRFGF21 receptor
GLUT4Glucose transporter 4
HPThypothalamic–pituitary–thyroid axis
HSLhormone-sensitive lipase
Nrf-2nuclear factor erythroid 2-related factor 2
Npyneuropeptide Y
ObRbLong form of the leptin receptor
OXPHOSMitochondrial oxidative phosphorylation system
Pdk4Pyruvate Dehydrogenase Kinase 4
P2rx5purinergic receptor P2X 5
Pgc-1αPeroxisome proliferator-activated receptor gamma coactivator 1α
POMCproopiomelanocortin neurons
PPARαPeroxisome proliferator-activated receptor-α
PPARβ/δPeroxisome proliferator-activated receptor-β/δ
PPARγPeroxisome proliferator-activated receptor-γ
Prdm16Pr-domain containing protein 16
SNSsympathetic nervous system
Tbx15Transcription factor 15
Trhthyrotropin-releasing hormone
UCP-1Uncoupling protein-1

References

  1. Schwartz, M.W.; Baskin, D.G.; Bukowski, T.R.; Kuijper, J.L.; Foster, D.; Lasser, G.; E Prunkard, D.; Porte, D.; Woods, S.C.; Seeley, R.J.; et al. Specificity of Leptin Action on Elevated Blood Glucose Levels and Hypothalamic Neuropeptide Y Gene Expression in ob/ob Mice. Diabetes 1996, 45, 531–535. [Google Scholar] [CrossRef] [Green Version]
  2. Schwartz, M.W.; Seeley, R.J.; A Campfield, L.; Burn, P.; Baskin, D.G. Identification of targets of leptin action in rat hypothalamus. J. Clin. Investig. 1996, 98, 1101–1106. [Google Scholar] [CrossRef] [PubMed]
  3. Schwartz, M.W.; Woods, S.C.; Porte, D., Jr.; Seeley, R.J.; Baskin, D.G. Central nervous system control of food intake. Nature 2000, 404, 661–671. [Google Scholar] [CrossRef] [PubMed]
  4. Lord, G.M.; Matarese, G.; Howard, J.K.; Baker, R.J.; Bloom, S.R.; Lechler, R.I. Leptin modulates the T-cell immune response and reverses starvation-induced immunosuppression. Nat. Cell Biol. 1998, 394, 897–901. [Google Scholar] [CrossRef]
  5. Levi, J.; Gray, S.L.; Speck, M.; Huynh, F.K.; Babich, S.L.; Gibson, W.T.; Kieffer, T.J. Acute Disruption of Leptin Signaling in Vivo Leads to Increased Insulin Levels and Insulin Resistance. Endocrinology 2011, 152, 3385–3395. [Google Scholar] [CrossRef] [Green Version]
  6. Gallardo, N.; Bonzón-Kulichenko, E.; Fernández-Agulló, T.; Moltó, E.; Gómez-Alonso, S.; Blanco, P.; Carrascosa, J.M.; Ros, M.; Andrés, A. Tissue-Specific Effects of Central Leptin on the Expression of Genes Involved in Lipid Metabolism in Liver and White Adipose Tissue. Endocrinology 2007, 148, 5604–5610. [Google Scholar] [CrossRef] [Green Version]
  7. Zeng, W.; Pirzgalska, R.M.; Pereira, M.M.; Kubasova, N.; Barateiro, A.; Seixas, E.; Lu, Y.-H.; Kozlova, A.; Voss, H.; Martins, G.G.; et al. Sympathetic Neuro-adipose Connections Mediate Leptin-Driven Lipolysis. Cell 2015, 163, 84–94. [Google Scholar] [CrossRef] [Green Version]
  8. Pandit, R.; Beerens, S.; Adan, R.A.H. Role of leptin in energy expenditure: The hypothalamic perspective. Am. J. Physiol. Integr. Comp. Physiol. 2017, 312, R938–R947. [Google Scholar] [CrossRef] [Green Version]
  9. Pelleymounter, M.A.; Cullen, M.J.; Baker, M.B.; Hecht, R.; Winters, D.; Boone, T.; Collins, F. Effects of the obese gene product on body weight regulation in ob/ob mice. Science 1995, 269, 540–543. [Google Scholar] [CrossRef]
  10. Wang, P.; Loh, K.H.; Wu, M.; Morgan, D.A.; Schneeberger, M.; Yu, X.; Chi, J.; Kosse, C.; Kim, D.; Rahmouni, K.; et al. A leptin–BDNF pathway regulating sympathetic innervation of adipose tissue. Nat. Cell Biol. 2020, 583, 839–844. [Google Scholar] [CrossRef]
  11. Plum, L.; Rother, E.; Münzberg, H.; Wunderlich, F.T.; Morgan, D.A.; Hampel, B.; Shanabrough, M.; Janoschek, R.; Könner, A.C.; Alber, J.; et al. Enhanced Leptin-Stimulated Pi3k Activation in the CNS Promotes White Adipose Tissue Transdifferentiation. Cell Metab. 2007, 6, 431–445. [Google Scholar] [CrossRef] [PubMed] [Green Version]
  12. Dodd, G.T.; Decherf, S.; Loh, K.; Simonds, S.E.; Wiede, F.; Balland, E.; Merry, T.L.; Münzberg, H.; Zhang, Z.-Y.; Kahn, B.B.; et al. Leptin and Insulin Act on POMC Neurons to Promote the Browning of White Fat. Cell 2015, 160, 88–104. [Google Scholar] [CrossRef] [PubMed] [Green Version]
  13. Singh, A.; Wirtz, M.; Parker, N.; Hogan, M.; Strahler, J.; Michailidis, G.; Schmidt, S.; Vidal-Puig, A.; Diano, S.; Andrews, P.; et al. Leptin-mediated changes in hepatic mitochondrial metabolism, structure, and protein levels. Proc. Natl. Acad. Sci. USA 2009, 106, 13100–13105. [Google Scholar] [CrossRef] [PubMed] [Green Version]
  14. Choi, M.J.; Jung, S.-B.; Lee, S.E.; Kang, S.G.; Lee, J.H.; Ryu, M.J.; Chung, H.K.; Chang, J.Y.; Kim, Y.K.; Hong, H.J.; et al. An adipocyte-specific defect in oxidative phosphorylation increases systemic energy expenditure and protects against diet-induced obesity in mouse models. Diabetologia 2020, 63, 837–852. [Google Scholar] [CrossRef] [Green Version]
  15. Nishimura, T.; Nakatake, Y.; Konishi, M.; Itoh, N. Identification of a novel FGF, FGF-21, preferentially expressed in the liver. Biochim. Biophys. Acta (BBA) Gene Struct. Expr. 2000, 1492, 203–206. [Google Scholar] [CrossRef]
  16. Hondares, E.; Iglesias, R.; Giralt, A.; Gonzalez, F.J.; Giralt, M.; Mampel, T.; Villarroya, F. Thermogenic Activation Induces FGF21 Expression and Release in Brown Adipose Tissue. J. Biol. Chem. 2011, 286, 12983–12990. [Google Scholar] [CrossRef] [Green Version]
  17. Cuevas-Ramos, D.; Mehta, R.; Aguilar-Salinas, C.A. Fibroblast Growth Factor 21 and Browning of White Adipose Tissue. Front. Physiol. 2019, 10, 37. [Google Scholar] [CrossRef] [Green Version]
  18. Fisher, F.M.; Maratos-Flier, E. Understanding the Physiology of FGF21. Annu. Rev. Physiol. 2016, 78, 223–241. [Google Scholar] [CrossRef] [Green Version]
  19. Tezze, C.; Romanello, V.; Sandri, M. FGF21 as Modulator of Metabolism in Health and Disease. Front. Physiol. 2019, 10, 419. [Google Scholar] [CrossRef]
  20. Justesen, S.; Haugegaard, K.V.; Hansen, J.B.; Hansen, H.S.; Andersen, B. The autocrine role of FGF21 in cultured adipocytes. Biochem. J. 2020, 477, 2477–2487. [Google Scholar] [CrossRef]
  21. Fisher, F.M.; Kleiner, S.; Douris, N.; Fox, E.C.; Mepani, R.J.; Verdeguer, F.; Wu, J.; Kharitonenkov, A.; Flier, J.S.; Maratos-Flier, E.; et al. FGF21 regulates PGC-1 and browning of white adipose tissues in adaptive thermogenesis. Genes Dev. 2012, 26, 271–281. [Google Scholar] [CrossRef] [PubMed] [Green Version]
  22. Sepa-Kishi, D.M.; Ceddia, R.B. Circulating fibroblast growth factor 21 is reduced, whereas its production is increased in a fat depot-specific manner in cold-acclimated rats. Adipocyte 2018, 7, 238–247. [Google Scholar] [CrossRef] [Green Version]
  23. Veniant, M.M.; Hale, C.; Helmering, J.; Chen, M.M.; Stanislaus, S.; Busby, J.; Vonderfecht, S.; Xu, J.; Lloyd, D.J. FGF21 Promotes Metabolic Homeostasis via White Adipose and Leptin in Mice. PLoS ONE 2012, 7, e40164. [Google Scholar] [CrossRef]
  24. Asrih, M.; Veyrat-Durebex, C.; Poher, A.-L.; Lyautey, J.; Rohner-Jeanrenaud, F.; Jornayvaz, F.R. Leptin as a Potential Regulator of FGF21. Cell. Physiol. Biochem. 2016, 38, 1218–1225. [Google Scholar] [CrossRef]
  25. Wang, Y.-X.; Lee, C.-H.; Tiep, S.; Yu, R.T.; Ham, J.; Kang, H.; Evans, R.M. Peroxisome-Proliferator-Activated Receptor δ Activates Fat Metabolism to Prevent Obesity. Cell 2003, 113, 159–170. [Google Scholar] [CrossRef] [Green Version]
  26. Palomer, X.; Barroso, E.; Pizarro-Delgado, J.; Peña, L.; Botteri, G.; Zarei, M.; Aguilar, D.; Montori-Grau, M.; Vázquez-Carrera, M. PPARβ/δ: A Key Therapeutic Target in Metabolic Disorders. Int. J. Mol. Sci. 2018, 19, 913. [Google Scholar] [CrossRef] [Green Version]
  27. Mora, C.; Pintado, C.; Rubio, B.; Mazuecos, L.; López, V.; Fernández, A.; Salamanca, A.; Bárcena, B.; Fernández-Agulló, T.; Arribas, C.; et al. Central leptin regulates heart lipid content by selectively increasing PPAR β/δ expression. J. Endocrinol. 2018, 236, 43–56. [Google Scholar] [CrossRef] [Green Version]
  28. Rubio, B.; Mora, C.; Pintado, C.; Mazuecos, L.; Fernández, A.; López, V.; Andrés, A.; Gallardo, N. The nutrient sensing pathways FoxO1/3 and mTOR in the heart are coordinately regulated by central leptin through PPARβ/δ. Implications in cardiac remodeling. Metabolism 2021, 115, 154453. [Google Scholar] [CrossRef]
  29. Shearer, B.G.; Steger, D.J.; Way, J.M.; Stanley, T.B.; Lobe, D.C.; Grillot, D.A.; Iannone, M.A.; Lazar, M.A.; Willson, T.M.; Billin, A.N. Identification and Characterization of a Selective Peroxisome Proliferator-Activated Receptor β/δ (NR1C2) Antagonist. Mol. Endocrinol. 2008, 22, 523–529. [Google Scholar] [CrossRef] [Green Version]
  30. Bonzón-Kulichenko, E.; Fernández-Agulló, T.; Moltó, E.; Serrano, R.; Fernández, A.; Ros, M.; Carrascosa, J.M.; Arribas, C.; Martínez, C.; Andrés, A.; et al. Regulation of Insulin-Stimulated Glucose Uptake in Rat White Adipose Tissue upon Chronic Central Leptin Infusion: Effects on Adiposity. Endocrinology 2011, 152, 1366–1377. [Google Scholar] [CrossRef]
  31. Chou, S.-Y.; Ajoy, R.; Changou, C.A.; Hsieh, Y.-T.; Wang, Y.-K.; Hoffer, S.-Y.C.R.A.Y.-T.H.B. CCL5/RANTES contributes to hypothalamic insulin signaling for systemic insulin responsiveness through CCR5. Sci. Rep. 2016, 6, 37659. [Google Scholar] [CrossRef] [PubMed] [Green Version]
  32. Kocalis, H.E.; Turney, M.K.; Printz, R.L.; Laryea, G.N.; Muglia, L.J.; Davies, S.S.; Stanwood, G.D.; McGuinness, O.P.; Niswender, K.D. Neuron-Specific Deletion of Peroxisome Proliferator-Activated Receptor Delta (PPARδ) in Mice Leads to Increased Susceptibility to Diet-Induced Obesity. PLoS ONE 2012, 7, e42981. [Google Scholar] [CrossRef] [PubMed]
  33. Keophiphath, M.; Rouault, C.; Divoux, A.; Clément, K.; Lacasa, D. CCL5 Promotes Macrophage Recruitment and Survival in Human Adipose Tissue. Arter. Thromb. Vasc. Biol. 2010, 30, 39–45. [Google Scholar] [CrossRef]
  34. Oliver, J.W.R.; Shenk, J.L.; Snaith, M.R.; Russell, C.S.; Plunket, K.D.; Bodkin, N.L.; Lewis, M.C.; Winegar, D.A.; Sznaidman, M.L.; Lambert, M.H.; et al. A selective peroxisome proliferator-activated receptor agonist promotes reverse cholesterol transport. Proc. Natl. Acad. Sci. USA 2001, 98, 5306–5311. [Google Scholar] [CrossRef] [PubMed] [Green Version]
  35. Tanaka, T.; Yamamoto, J.; Iwasaki, S.; Asaba, H.; Hamura, H.; Ikeda, Y.; Watanabe, M.; Magoori, K.; Ioka, R.X.; Tachibana, K.; et al. Activation of peroxisome proliferator-activated receptor induces fatty acid -oxidation in skeletal muscle and attenuates metabolic syndrome. Proc. Natl. Acad. Sci. USA 2003, 100, 15924–15929. [Google Scholar] [CrossRef] [Green Version]
  36. Van der Veen, J.N.; Kruit, J.K.; Havinga, R.; Baller, J.F.W.; Chimini, G.; Lestavel, S.; Staels, B.; Groot, P.H.E.; Groen, A.K.; Kuipers, F. Reduced cholesterol absorption upon PPARδ activation coincides with decreased intestinal expression of NPC1L1. J. Lipid Res. 2005, 46, 526–534. [Google Scholar] [CrossRef] [Green Version]
  37. Dallner, O.S.; Marinis, J.M.; Lu, Y.-H.; Birsoy, K.; Werner, E.; Fayzikhodjaeva, G.; Dill, B.D.; Molina, H.; Moscati, A.; Kutalik, Z.; et al. Dysregulation of a long noncoding RNA reduces leptin leading to a leptin-responsive form of obesity. Nat. Med. 2019, 25, 507–516. [Google Scholar] [CrossRef]
  38. Morris, A. Subtyping obesity. Nat. Rev. Endocrinol. 2019, 15, 316. [Google Scholar] [CrossRef]
  39. Wilsey, J.; Scarpace, P.J. Caloric restriction reverses the deficits in leptin receptor protein and leptin signaling capacity associated with diet-induced obesity: Role of leptin in the regulation of hypothalamic long-form leptin receptor expression. J. Endocrinol. 2004, 181, 297–306. [Google Scholar] [CrossRef] [Green Version]
  40. Kharitonenkov, A.; Shiyanova, T.L.; Koester, A.; Ford, A.M.; Micanovic, R.; Galbreath, E.J.; Sandusky, G.E.; Hammond, L.J.; Moyers, J.S.; Owens, R.A.; et al. FGF-21 as a novel metabolic regulator. J. Clin. Investig. 2005, 115, 1627–1635. [Google Scholar] [CrossRef] [Green Version]
  41. Hotta, Y.; Nakamura, H.; Konishi, M.; Murata, Y.; Takagi, H.; Matsumura, S.; Inoue, K.; Fushiki, T.; Itoh, N. Fibroblast Growth Factor 21 Regulates Lipolysis in White Adipose Tissue But Is Not Required for Ketogenesis and Triglyceride Clearance in Liver. Endocrinology 2009, 150, 4625–4633. [Google Scholar] [CrossRef] [Green Version]
  42. Lewis, J.E.; Monnier, C.; Marshall, H.; Fowler, M.; Green, R.; Cooper, S.; Chiotellis, A.; Luckett, J.; Perkins, A.C.; Coskun, T.; et al. Whole-body and adipose tissue-specific mechanisms underlying the metabolic effects of fibroblast growth factor 21 in the Siberian hamster. Mol. Metab. 2020, 31, 45–54. [Google Scholar] [CrossRef]
  43. Samms, R.J.; Cheng, C.C.; Kharitonenkov, A.; Gimeno, R.E.; Adams, A.C. Overexpression of β-Klotho in Adipose Tissue Sensitizes Male Mice to Endogenous FGF21 and Provides Protection From Diet-Induced Obesity. Endocrinology 2016, 157, 1467–1480. [Google Scholar] [CrossRef] [PubMed] [Green Version]
  44. BonDurant, L.D.; Ameka, M.; Naber, M.C.; Markan, K.R.; Idiga, S.O.; Acevedo, M.R.; Walsh, S.A.; Ornitz, D.M.; Potthoff, M.J. FGF21 Regulates Metabolism Through Adipose-Dependent and -Independent Mechanisms. Cell Metab. 2017, 25, 935–944.e4. [Google Scholar] [CrossRef] [Green Version]
  45. Potthoff, M.J.; Kliewer, S.A.; Mangelsdorf, D.J. Endocrine fibroblast growth factors 15/19 and 21: From feast to famine. Genes Dev. 2012, 26, 312–324. [Google Scholar] [CrossRef] [Green Version]
  46. Coskun, T.; Bina, H.A.; Schneider, M.A.; Dunbar, J.D.; Hu, C.C.; Chen, Y.; Moller, D.E.; Kharitonenkov, A. Fibroblast Growth Factor 21 Corrects Obesity in Mice. Endocrinology 2008, 149, 6018–6027. [Google Scholar] [CrossRef]
  47. Liu, L.; Locascio, L.M.; Doré, S. Critical Role of Nrf2 in Experimental Ischemic Stroke. Front. Pharmacol. 2019, 10, 153. [Google Scholar] [CrossRef] [PubMed] [Green Version]
  48. Houstek, J.; Andersson, U.; Tvrdík, P.; Nedergaard, J.; Cannon, B. The Expression of Subunit c Correlates with and Thus May Limit the Biosynthesis of the Mitochondrial F0F1-ATPase in Brown Adipose Tissue. J. Biol. Chem. 1995, 270, 7689–7694. [Google Scholar] [CrossRef] [Green Version]
  49. Shabalina, I.G.; Petrovic, N.; De Jong, J.M.; Kalinovich, A.V.; Cannon, B.; Nedergaard, J. UCP1 in Brite/Beige Adipose Tissue Mitochondria Is Functionally Thermogenic. Cell Rep. 2013, 5, 1196–1203. [Google Scholar] [CrossRef] [Green Version]
  50. Peters, J.M.; Lee, S.S.T.; Li, W.; Ward, J.M.; Gavrilova, O.; Everett, C.; Reitman, M.L.; Hudson, L.D.; Gonzalez, F.J. Growth, Adipose, Brain, and Skin Alterations Resulting from Targeted Disruption of the Mouse Peroxisome Proliferator-Activated Receptor β(δ). Mol. Cell. Biol. 2000, 20, 5119–5128. [Google Scholar] [CrossRef] [Green Version]
  51. Barak, Y.; Liao, D.; He, W.; Ong, E.S.; Nelson, M.C.; Olefsky, J.M.; Boland, R.; Evans, R.M. Effects of peroxisome proliferator-activated receptor on placentation, adiposity, and colorectal cancer. Proc. Natl. Acad. Sci. USA 2002, 99, 303–308. [Google Scholar] [CrossRef] [PubMed] [Green Version]
  52. Wagner, K.-D.; Benchetrit, M.; Bianchini, L.; Michiels, J.-F.; Wagner, N. Peroxisome proliferator-activated receptor β/δ (PPARβ/δ) is highly expressed in liposarcoma and promotes migration and proliferation. J. Pathol. 2011, 224, 575–588. [Google Scholar] [CrossRef] [PubMed]
  53. Sugii, S.; Olson, P.; Sears, D.D.; Saberi, M.; Atkins, A.R.; Barish, G.D.; Hong, S.-H.; Castro, G.L.; Yin, Y.-Q.; Nelson, M.C.; et al. PPARγ activation in adipocytes is sufficient for systemic insulin sensitization. Proc. Natl. Acad. Sci. USA 2009, 106, 22504–22509. [Google Scholar] [CrossRef] [PubMed] [Green Version]
  54. Choo, H.-J.; Kim, J.-H.; Kwon, O.-B.; Lee, C.S.; Mun, J.Y.; Han, S.S.; Yoon, Y.-S.; Yoon, G.; Choi, K.-M.; Ko, Y.-G. Mitochondria are impaired in the adipocytes of type 2 diabetic mice. Diabetologia 2006, 49, 784–791. [Google Scholar] [CrossRef] [Green Version]
  55. Lee, S.C.; Park, A.; Oh, K.-J.; Kim, W.K.; Bae, K.-H. The Role of Adipose Tissue Mitochondria: Regulation of Mitochondrial Function for the Treatment of Metabolic Diseases. Int. J. Mol. Sci. 2019, 20, 4924. [Google Scholar] [CrossRef] [PubMed] [Green Version]
  56. Böhm, A.; Keuper, M.; Meile, T.; Zdichavsky, M.; Fritsche, A.; Häring, H.-U.; De Angelis, M.H.; Staiger, H.; Franko, A. Increased mitochondrial respiration of adipocytes from metabolically unhealthy obese compared to healthy obese individuals. Sci. Rep. 2020, 10, 1–10. [Google Scholar] [CrossRef] [PubMed]
  57. Hondares, E.; Rosell, M.; Gonzalez, F.J.; Giralt, M.; Iglesias, R.; Villarroya, F. Hepatic FGF21 Expression Is Induced at Birth via PPARα in Response to Milk Intake and Contributes to Thermogenic Activation of Neonatal Brown Fat. Cell Metab. 2010, 11, 206–212. [Google Scholar] [CrossRef] [PubMed] [Green Version]
  58. Wu, J.; Boström, P.; Sparks, L.M.; Ye, L.; Choi, J.H.; Giang, A.-H.; Khandekar, M.; Virtanen, K.A.; Nuutila, P.; Schaart, G.; et al. Beige Adipocytes Are a Distinct Type of Thermogenic Fat Cell in Mouse and Human. Cell 2012, 150, 366–376. [Google Scholar] [CrossRef] [Green Version]
  59. Cheng, Y.; Jiang, L.; Keipert, S.; Zhang, S.; Hauser, A.; Graf, E.; Strom, T.; Tschöp, M.; Jastroch, M.; Perocchi, F. Prediction of Adipose Browning Capacity by Systematic Integration of Transcriptional Profiles. Cell Rep. 2018, 23, 3112–3125. [Google Scholar] [CrossRef] [PubMed]
  60. Rachid, T.L.; Silva-Veiga, F.M.; Graus-Nunes, F.; Bringhenti, I.; Mandarim-De-Lacerda, C.A.; Souza-Mello, V. Differential actions of PPAR-α and PPAR-β/δ on beige adipocyte formation: A study in the subcutaneous white adipose tissue of obese male mice. PLoS ONE 2018, 13, e0191365. [Google Scholar] [CrossRef]
  61. Pan, Y.; Liu, J.; Qi, F. Identification of key candidate genes and molecular pathways in white fat browning: An anti-obesity drug discovery based on computational biology. Hum. Genom. 2019, 13, 1–13. [Google Scholar] [CrossRef] [Green Version]
  62. Kim, B.-R.; Lee, G.Y.; Yu, H.; Maeng, H.J.; Oh, T.J.; Kim, K.M.; Moon, J.H.; Lim, S.; Jang, H.C.; Choi, S.H. Suppression of Nrf2 attenuates adipogenesis and decreases FGF21 expression through PPAR gamma in 3T3-L1 cells. Biochem. Biophys. Res. Commun. 2018, 497, 1149–1153. [Google Scholar] [CrossRef] [PubMed]
  63. Kroon, T.; Harms, M.; Maurer, S.; Bonnet, L.; Alexandersson, I.; Lindblom, A.; Ahnmark, A.; Nilsson, D.; Gennemark, P.; O’Mahony, G.; et al. PPARγ and PPARα synergize to induce robust browning of white fat in vivo. Mol. Metab. 2020, 36, 100964. [Google Scholar] [CrossRef] [PubMed]
  64. Christodoulides, C.; Dyson, P.; Sprecher, D.; Tsintzas, K.; Karpe, F. Circulating Fibroblast Growth Factor 21 Is Induced by Peroxisome Proliferator-Activated Receptor Agonists But Not Ketosis in Man. J. Clin. Endocrinol. Metab. 2009, 94, 3594–3601. [Google Scholar] [CrossRef] [Green Version]
  65. Dillin, A.; Hsu, A.-L.; Arantes-Oliveira, N.; Lehrer-Graiwer, J.; Hsin, H.; Fraser, A.G.; Kamath, R.S.; Ahringer, J.; Kenyon, C. Rates of Behavior and Aging Specified by Mitochondrial Function During Development. Science 2002, 298, 2398–2401. [Google Scholar] [CrossRef]
  66. Copeland, J.M.; Cho, J.; Lo, T.; Hur, J.H.; Bahadorani, S.; Arabyan, T.; Rabie, J.; Soh, J.; Walker, D.W. Extension of Drosophila Life Span by RNAi of the Mitochondrial Respiratory Chain. Curr. Biol. 2009, 19, 1591–1598. [Google Scholar] [CrossRef] [Green Version]
  67. Liu, Y.; Samuel, B.S.; Breen, P.C.; Ruvkun, G. Caenorhabditis elegans pathways that surveil and defend mitochondria. Nat. Cell Biol. 2014, 508, 406–410. [Google Scholar] [CrossRef] [Green Version]
  68. Kang, S.G.; Yi, H.-S.; Choi, M.J.; Ryu, M.J.; Jung, S.; Chung, H.K.; Chang, J.Y.; Kim, Y.K.; Lee, S.E.; Kim, H.-W.; et al. ANGPTL6 expression is coupled with mitochondrial OXPHOS function to regulate adipose FGF21. J. Endocrinol. 2017, 233, 105–118. [Google Scholar] [CrossRef] [Green Version]
  69. Sanchez-Siles, A.A.; Ishimura, N.; Rumi, M.A.K.; Tamagawa, Y.; Ito, S.; Ishihara, S.; Nabika, T.; Kinoshita, Y. Administration of PPARβ/δ agonist reduces copper-induced liver damage in mice: Possible implications in clinical practice. J. Clin. Biochem. Nutr. 2011, 49, 42–49. [Google Scholar] [CrossRef]
  70. Toral, M.; Romero, M.; Jiménez, R.; Mahmoud, A.M.; Barroso, E.; Gómez-Guzmán, M.; Sánchez, M.; Cogolludo, Á.; García-Redondo, A.B.; Briones, A.M.; et al. Carnitine palmitoyltransferase-1 up-regulation by PPAR-β/δ prevents lipid-induced endothelial dysfunction. Clin. Sci. 2015, 129, 823–837. [Google Scholar] [CrossRef]
  71. Rodríguez, M.; Pintado, C.; la Cal, R.T.-D.; Moltó, E.; Gallardo, N.; Andrés, A.; Arribas, C. Ageing alters the lipid sensing process in the hypothalamus of Wistar rats. Effect of food restriction. Nutr. Neurosci. 2021, 5, 1–15. [Google Scholar] [CrossRef] [PubMed]
Figure 1. Change in body weight (A) and food intake evolution (B) of rats after 7 days of chronic central treatment of vehicle (SS and PF), leptin, or leptin and ip GSK0660 co-administration (n = 6–8). (C) Tissue mass of epididymal white adipose tissue (eWAT), peritoneal white adipose tissue (PrWAT) and liver in rats after 7 days of chronic central treatment of vehicle (SS and PF), leptin, or leptin and ip GSK0660 co-administration (n = 6–8) Change in body weight (D) and food intake evolution (E) of rats after 7 days of vehicle (DMSO) control or antagonist GSK0660 intraperitoneal injection (n = 6). (F) Tissue mass of epididymal white adipose tissue (eWAT), peritoneal white adipose tissue (PrWAT) and liver in rats after 7 days of vehicle (DMSO) control or antagonist GSK0660 intraperitoneal injection (n = 6). Results are the mean ± SEM per group of animals (n = 6–8). Differences between CONTROL vs. GSK0660 treatment were analyzed by Student’s t-test (* p < 0.05; ns: non-significant). Significant differences between ICV-treated rats were analyzed Student’s t-test, SS vs. Lep * p ≤ 0.05; Lep vs. Lep+GSK0660 # p < 0.05). Significant differences between ICV-treated rats were analyzed by One-Way ANOVA followed by Tukey test (differences letters mean significant differences among treatments, p ≤ 0.05). a p ≤ 0.05 vs. PF or Lep or Lep+GSK0660; b p ≤ 0.05 vs. SS or PF or Lep+GSK0660; c p ≤ 0.05 vs. SS or PF or Lep. SS: vehicle-infused rats fed ad libitum; PF: vehicle-infused pair-fed rats; Lep: leptin-infused rats; Lep+GSK0660: leptin-infused rats plus PPARβ/δ antagonist GSK0660.
Ijms 22 04624 g001aIjms 22 04624 g001b
Figure 2. (A) Effect of vehicle (DMSO) control or antagonist ip GSK0660 administration on eWAT mRNA levels of Pparβ/δ, Cpt1a, and Pdk4 of rats after 7 days of intraperitoneal injection (n = 6). (B) Representative Western Blot and relative densitometric analysis of PPARβ/δ total protein content in eWAT of rats after 7 days of vehicle (DMSO) control or ip GSK0660 injection (n = 6). (C) Effect of icv vehicle (SS and PF), leptin, or leptin and ip GSK0060 co-administration on eWAT mRNA levels of Pparβ/δ, Cpt1a and Pdk4 in rats after 7 days of chronic treatment (n = 4–6). (D) Representative Western blot and relative densitometric analysis PPARβ/δ total protein content in eWAT in rats after 7 days of chronic central treatment of vehicle (SS and PF), leptin, or leptin and ip GSK0660 co-administration (n = 4–6). (E) Hypothalamus mRNA levels of Npy and Ccl5 in rats after 7 days of chronic central treatment of vehicle (SS and PF), leptin, or leptin and ip GSK0660 co-administration. (F) eWAT mRNA levels of Ccl5 and Arg1 in rats after 7 days of chronic central treatment of vehicle (SS and PF), leptin, or leptin and ip GSK0660 co-administration. Data from real-time RT-PCR are expressed relative to 18S rRNA and the mRNA levels are expressed relative to the control (DMSO) group and vehicle SS group, the level of which was set at 1.0 arbitrarily. In Western blot analysis, densitometric levels of proteins are expressed relative to the control group and SS group, the levels of which were set at 1.0 arbitrarily. Results are the mean ± SEM per group of animals (n = 4–6). Differences between CONTROL vs. GSK0660 treatment were analyzed by Student’s t-test (*** p < 0.001). Significant differences between ICV-treated rats were analyzed by One-Way ANOVA followed by Tukey test (differences letters mean significant differences among treatments, p ≤ 0.05). a p ≤ 0.05 vs. Lep or Lep+GSK0660; b p ≤ 0.05 vs. SS or PF or Lep+GSK0660; c p ≤ 0.05 vs. SS or PF or Lep or Lep+GSK0660. SS: vehicle-infused rats fed ad libitum; PF: vehicle-infused pair-fed rats; Lep: leptin-infused rats; Lep+GSK0660: leptin-infused rats plus PPARβ/δ antagonist GSK0660.
Ijms 22 04624 g002
Figure 3. (A) Cholesterol and triglyceride (TAG) levels in eWAT in rats after 7 days of vehicle (DMSO) control or antagonist GSK0660 intraperitoneal injection (n = 6). (B) Cholesterol and triglyceride levels in eWAT in rats after 7 days of chronic central treatment of vehicle (SS and PF), leptin, or leptin and ip GSK0660 co-administration (n = 4–6). (C) Representative Western Blot and relative densitometric analysis of ATGL total protein content in eWAT after 7 days of chronic central treatment of vehicle (SS and PF), leptin, or leptin and ip GSK0660 co-administration (n = 4–6). (D) Representative Western blot of p-SER565-HSL and total HSL protein levels and relative densitometric analysis of the ratio p-Ser565HSL/HSL in eWAT of rats after 7 days of chronic central treatment of vehicle, leptin, or leptin and GSK0660 co-administration (n = 4–6). Results are the mean ± SEM per group of animals (n = 4–6). Densitometric levels of proteins are expressed relative to the SS group the level of which was set at 1.0 arbitrarily. Differences between CONTROL vs. GSK0660 treatment were analyzed by Student’s t-test (** p < 0.01, *** p < 0.0001). Significant differences between ICV-treated rats were analyzed by One-Way ANOVA followed by Tukey test (differences letters mean significant differences among treatments, p ≤ 0.05). a p ≤ 0.05 vs. PF or Lep; b p ≤ 0.05 vs. SS or PF or Lep+GSK0660. SS: vehicle-infused rats fed ad libitum, PF: vehicle-infused pair-fed rats; Lep: leptin-infused rats; Lep+GSK0660: leptin-infused rats plus PPARβ/δ antagonist GSK0660.
Ijms 22 04624 g003
Figure 4. (A) Quantification and gene expression comparison between FGFR1-4 and β-klotho co-receptor in eWAT of rats after 7 days of vehicle (DMSO) control or intraperitoneal GSK0660 injection (n = 6). (B) Gene expression comparison between FGF receptors and β-klotho co-receptor in eWAT of rats after 7 days of chronic central treatment of vehicle (SS and PF), leptin, or leptin and ip GSK0660 co-administration (n = 4–6). (C) Representative Western blot and relative densitometric analysis of FGFR1 and β-klotho total protein content in eWAT of rats after 7 days of vehicle (DMSO) control or intraperitoneal GSK0660 injection (n = 6). (D) Representative Western blot and relative densitometric analysis of FGFR1 and β-klotho total protein content in eWAT of rats after 7 days of chronic central treatment of vehicle (SS and PF), leptin, or leptin and ip GSK0660 co-administration (n = 4–6). Data from real-time RT-PCR are expressed relative to 18S rRNA and the mRNA levels are expressed relative to the Fgfr1 gene expression of Control group and SS group, the level of which were set at 1.0 arbitrarily. Results are mean ± S.E.M (n = 4–6) and were analyzed by Nested one-way ANOVA followed by Dunnett’s test (* p < 0.05, ** p < 0.01, *** p < 0.001, **** p < 0.0001 vs. Fgfr1 gene expression). In Western blot analysis, densitometric levels of proteins are expressed relative to the Control group and SS group, the levels of which were set at 1.0 arbitrarily. Results are the mean ± SEM per group of animals (n = 4–6). Differences between CONTROL vs. GSK0660 treatment were analyzed by Student’s t-test (* p < 0.05, ** p < 0.001). Significant differences between ICV-treated rats were analyzed by One-Way ANOVA followed by Tukey test (differences letters mean significant differences among treatments, p ≤ 0.05). a p ≤ 0.05 vs. PF or Lep; b p ≤ 0.05 vs. SS or Lep or Lep+GSK0660; c p ≤ 0.05 vs. SS or PF or Lep+GSK0660. SS: vehicle-infused rats fed ad libitum, PF: vehicle-infused pair-fed rats; Lep: leptin-infused rats; Lep+GSK0660: leptin-infused rats plus PPARβ/δ antagonist GSK0660.
Ijms 22 04624 g004
Figure 5. (A) Representative Western Blot of p-ERK1/2 and total ERK1/2 protein levels and relative densitometric analysis of the ratio p-ERK1/2/ERK1/2 in eWAT of rats after 7 days of vehicle (DMSO) control or intraperitoneal antagonist GSK0660 injection (n = 6). (B) mRNA levels of Glut4, representative Western Blot of p-ERK1/2 and total ERK1/2 protein levels and relative densitometric analysis of the ratio p-ERK1/2/ERK1/2 in eWAT of rats after 7 days of chronic central treatment of vehicle (SS and PF), leptin, or leptin and ip GSK0660 co-administration (n = 4–6). Effect of vehicle (DMSO) control or ip antagonist GSK0660 administration on eWAT mRNA levels (C) and protein levels (D) of FGF21 in rats after 7 days injection (n = 6). Effect of icv vehicle (SS and PF), leptin, or leptin and ip GSK0060 co-administration on eWAT mRNA levels (E) and protein levels (F) of FGF21 in rats after 7 days of chronic treatment (n = 4–6). Data from real-time RT-PCR are expressed relative to 18S rRNA and the mRNA levels are expressed relative to the Control group and SS group, the level of which was set at 1.0 arbitrarily. In Western blot analysis, densitometric levels of proteins are expressed relative to the Control group and SS group, the levels of which were set at 1.0 arbitrarily. Results are the mean ± SEM per group of animals (n = 4–6). Differences between CONTROL vs. GSK0660 treatment were analyzed by Student’s t-test (*** p < 0.001). Significant differences between ICV-treated rats were analyzed by One-Way ANOVA followed by Tukey test (differences letters mean significant differences among treatments, p ≤ 0.05). a p ≤ 0.05 vs. Lep or Lep+GSK0660; b p ≤ 0.05 vs. SS or PF or Lep+GSK0660; c p ≤ 0.05 vs. SS or PF or Lep. SS: vehicle-infused rats fed ad libitum, PF: vehicle-infused pair-fed rats; Lep: leptin-infused rats; Lep+GSK0660: leptin-infused rats plus PPARβ/δ antagonist GSK0660.
Ijms 22 04624 g005
Figure 6. Representative Western blot of β3-adrenergic receptor, PGC-1α (A) and UCP-1 (C) protein levels and relative densitometric analysis in eWAT of rats after 7 days of vehicle (DMSO) control or intraperitoneal antagonist GSK0660 injection (n = 6). (B) Representative Western blot of β3-adrenergic receptor, PGC-1α (B) and UCP-1 (D) protein levels and relative densitometric analysis in eWAT of rats after 7 days of chronic central treatment of vehicle (SS and PF), leptin, or leptin and ip GSK0660 co-administration (n = 4–6). Densitometric levels of proteins are expressed relative to the Control group and SS group, the levels of which were set at 1.0 arbitrarily. Results are the mean ± SEM per group of animals (n = 4–6). Differences between CONTROL vs. GSK0660 treatment were analyzed by Student’s t-test (** p < 0.05, *** p < 0.001; ns: non-significant). Significant differences between ICV-treated rats were analyzed by One-Way ANOVA followed by Tukey test (differences letters mean significant differences among treatments, p ≤ 0.05). a p ≤ 0.05 vs. PF or Lep or Lep+GSK0660; b p ≤ 0.05 vs. SS or PF or Lep+GSK0660. SS: vehicle-infused rats fed ad libitum, PF: vehicle-infused pair-fed rats; Lep: leptin-infused rats; Lep+GSK0660: leptin-infused rats plus PPARβ/δ antagonist GSK0660.
Ijms 22 04624 g006
Figure 7. (A) Representative Western Blot of OXPHOS complexes 1–5 and relative densitometric analysis in eWAT of rats after 7 days of vehicle (DMSO) control or intraperitoneal antagonist GSK0660 injection (n = 6). (B) Representative Western blot of OXPHOS complexes 1–5 and relative densitometric analysis in eWAT of rats after 7 days of chronic central treatment of vehicle (SS and PF), leptin, or leptin and ip GSK0660 co-administration (n = 4–6). Densitometric levels of proteins are expressed relative to the Control group and SS group, the levels of which were set at 1.0 arbitrarily. Results are the mean ± SEM per group of animals (n = 4–6). Differences between CONTROL vs. GSK0660 treatment were analyzed by Student’s t-test (** p <0.1, *** p < 0.001, **** p < 0.0001). Significant differences between ICV-treated rats were analyzed by One-Way ANOVA followed by Tukey test (differences letters mean significant differences among treatments, p ≤ 0.05). a p ≤ 0.05 vs. PF or Lep or Lep+GSK0660; b p ≤ 0.05 vs. SS or Lep or Lep+GSK0660; c p ≤ 0.05 vs. SS or PF or Lep+GSK0660. SS: vehicle-infused rats fed ad libitum, PF: vehicle-infused pair-fed rats; Lep: leptin-infused rats; Lep+GSK0660: leptin-infused rats plus PPARβ/δ antagonist GSK0660.
Ijms 22 04624 g007
Figure 8. Scheme summarizing the effects of central leptin on eWAT. Leptin, acting through hypothalamic neural circuits and the SNS activates lipolysis in eWAT, generating probably tissue-specific PARβ/δ ligands and/or ligand precursors which, once present in adipose tissue might activate PPARβ/δ function in eWAT inducing the endogenous expression of FGF21 and the browning capacity of this tissue. The molecular nature of the ligands that might activate PPARβ/δ in eWAT, in response to the increased lipolysis induced by central leptin in this tissue is not known and remains to be determined. SNS: sympathetic nervous system; FFA: free fatty acids.
Ijms 22 04624 g008
Table 1. Effects of GSK0660 and ICV leptin administration on serum metabolites and hormone levels of the animals.
TREATMENTCONTROLGSK0660SSPFLEPLEP+GSK0660
Glucose (mM)6.95 ± 1.066.58 ± 1.694.37 ± 0.37 a4.52 ± 0.62 a4.75 ± 1.7 a4.18 ± 0.4 a
Insulin (ng/mL)1.32 ± 0.122.51 ± 0.72 **1.6 ± 0.5 a1.4 ± 0.1 a0.7 ± 0.1 b0.63 ± 0.19 b
Cholesterol (mg/dL)76.83 ± 14.2986.87 ± 3.0976.67 ± 9.9 a51.46 ± 5.2 b52.4 ± 18 b60.8 ± 11.7 a,b
Triglycerides (mg/dL)132.74 ± 13.27177.88 ± 19.47 *85 ± 7 a80 ± 5 a53 ± 6 b90± 15 a
Leptin (ng/mL)4.01 ± 0.929.01 ± 0.26 *6.01 ± 0.55.4 ± 15.2 ± 0.87.16 ± 1.6
FGF21 (pg/mL)266.54 ± 21.25251.14 ± 31.1020 ± 4.44 a129.92 ± 5.2 b77.11 ± 11.09 c60.38 ± 14.05 c
After 7 days of GSK0660 intraperitoneal and/or central leptin (LEP, 0.2 µg/day) or vehicle (SS, PF) administration, serum, and metabolites hormone levels. Results are represented by mean ± SEM (n = 6) per group of animals. Differences between CONTROL vs. GSK0660 treatment were analyzed by Student’s t-test (* p < 0.05, ** p < 0.001). Significant differences between ICV-treated rats were analyzed by One-Way ANOVA followed by Tukey test (differences letters mean significant differences among treatments, p ≤ 0.05). a p ≤ 0.05 vs. PF or Lep or Lep+GSK0660; b p ≤ 0.05 vs. SS or PF or Lep+GSK0660; c p ≤ 0.05 vs. SS or PF. SS: vehicle-infused rats fed ad libitum; PF: vehicle-infused pair feed rats; LEP: leptin-infused rats; Lep+GSK0660: leptin-infused rats plus PPARβ/δ antagonist GSK0660.
Table 2. Gene expression of leptin and ObRb leptin receptor in epididymal white adipose tissue.
GeneCONTROLGSK0660SSPFLEPLEP+GSK0660
Leptin1.05 ± 0.122.18 ± 0.17 **1.02 ± 0.08 a2.37 ± 0.22 b0.27 ± 0.05 c0.32 ± 0.14 c
ObRb1.07 ± 0.283.1 ± 0.35 **0.98 ± 0.18 a3.3 ± 0.37 b2.36 ± 0.6 b0.06 ± 0.018 c
Results are represented by mean ± SEM (n = 6) per group of animals. Data from real-time RT-PCR are expressed relative to 18S rRNA and the mRNA levels are expressed relative to the Control group and SS group the level of which were set at 1.0 arbitrarily Differences between CONTROL vs. GSK0660 treatment were analyzed by Student’s t-test (** p < 0.001). Significant differences between ICV-treated rats were analyzed by One-Way ANOVA followed by Tukey test (differences letters mean significant differences among treatments, p ≤ 0.05). a p ≤ 0.05 vs. PF or Lep or Lep+GSK0660; b p ≤ 0.05 vs. SS or PF or Lep+GSK0660; c p ≤ 0.05 vs. SS or PF or Lep. SS: vehicle-infused rats fed ad libitum; PF: vehicle-infused pair feed rats; LEP: leptin-infused rats; Lep+GSK0660: leptin-infused rats plus PPARβ/δ antagonist GSK0660.
Table 3. Gene expression of β3-Adr, Pparɣ, Pgc-1a, Prdm16, Tbx15, and P2rx5 in eWAT.
GeneCONTROLGSK0660SSPFLEPLEP+GSK0660
β3-Adr1.10 ± 0.130.66 ± 0.06 **1.06 ± 0.06 a1.25 ± 0.2 a1.83 ± 0.12 b0.61 ± 0.05 c
Pparɣ0.97 ± 0.220.56 ± 0.01 *1.10 ± 0.04 a1.10 ± 0.02 a1.05 ± 0.013 a0.65 ± 0.06 b
Pgc-1a1.02 ± 0.21.43 ± 0.15 *0.98 ± 0.25 a1.2 ± 0.11 a0.99 ± 0.23 a4.64 ± 0.48 b
Prdm161.1 ± 0.271.3 ± 0.151.04 ± 0.06 a1.06 ± 0.25 a1.82 ± 0.02 b1.4 ± 0.3 a
Tbx150.97 ± 0.451.2 ± 0.470.89 ± 0.18 a2.09 ± 0.6 b1.58 ± 0.3 b1.1 ± 0.48 a
P2rx51.14 ± 0.060.7 ± 0.01 **1.06 ± 0.13 a1.15 ± 0.16 a3.13 ± 0.38 b1.25 ± 0.19 a
Results are represented by mean ± SEM (n = 6) per group of animals. Data from real-time RT-PCR are expressed relative to 18S rRNA and the mRNA levels are expressed relative to the Control group and SS group, the level of which was set at 1.0 arbitrarily. Differences between CONTROL vs. GSK0660 treatment were analyzed by Student’s t-test (* p < 0.05, ** p < 0.001). Significant differences between ICV-treated rats were analyzed by One-Way ANOVA followed by Tukey test (differences letters mean significant differences among treatments, p ≤ 0.05). a p ≤ 0.05 vs. PF or Lep or Lep+GSK0660; b p ≤ 0.05 vs. SS or PF or Lep+GSK0660; c p ≤ 0.05 vs. SS or PF or Lep. SS: vehicle-infused rats fed ad libitum, PF: vehicle-infused pair-fed rats; Lep: leptin-infused rats; Lep+GSK0660: leptin-infused rats plus PPARβ/δ antagonist GSK0660.
Table 4. Gene expression of Nrf2 in epididymal white adipose tissue.
GeneCONTROLGSK0660SSPFLEPLEP+GSK0660
Nrf21.10 ± 0.070.73 ± 0.02 **1.07 ± 0.07 a0.86 ± 0.06 a1.88 ± 0.08 b0.97 ± 0.045 a
Results are represented by mean ± SEM (n = 6) per group of animals. Data from real-time RT-PCR are expressed relative to 18S rRNA and the mRNA levels are expressed relative to the Control group and SS group, the level of which were set at 1.0 arbitrarily Differences between CONTROL vs. GSK0660 treatment were analyzed by Student’s t-test (** p < 0.001). Significant differences between ICV-treated rats were analyzed by One-Way ANOVA followed by Tukey test (differences letters mean significant differences among treatments, p ≤ 0.05). a p ≤ 0.05 vs. Lep; b p ≤ 0.05 vs. SS or PF or Lep+GSK0660. SS: vehicle-infused rats fed ad libitum, PF: vehicle-infused pair-fed rats; Lep: leptin-infused rats; Lep+GSK0660: leptin-infused rats plus PPARβ/δ antagonist GSK0660.
Publisher’s Note: MDPI stays neutral with regard to jurisdictional claims in published maps and institutional affiliations.

