Article

Genome-Wide Analysis, Evolutionary History and Response of ALMT Family to Phosphate Starvation in Brassica napus

1
National Key Laboratory of Crop Genetic Improvement, Huazhong Agricultural University, Wuhan 430070, China
2
Key Laboratory of Arable Land Conservation (Middle and Lower Reaches of Yangtze River), Microelement Research Centre, Ministry of Agriculture and Rural Affairs, Huazhong Agricultural University, Wuhan 430070, China
3
Department of Plant Breeding and Genetics, Gomal University, Dera Ismail Khan 29220, Pakistan
*
Author to whom correspondence should be addressed.
Int. J. Mol. Sci. 2021, 22(9), 4625; https://doi.org/10.3390/ijms22094625
Submission received: 7 April 2021 / Revised: 21 April 2021 / Accepted: 22 April 2021 / Published: 28 April 2021

Abstract

:
Low phosphorus (P) availability is one of the major constraints to plant growth, particularly in acidic soils. A possible mechanism for enhancing the use of sparsely soluble P forms is the secretion of malate in plants by the aluminum-activated malate transporter (ALMT) gene family. Despite its significance in plant biology, the identification of the ALMT gene family in oilseed rape (Brassica napus; B. napus), an allotetraploid crop, is unveiled. Herein, we performed genome-wide identification and characterization of ALMTs in B. napus, determined their gene expression in different tissues and monitored transcriptional regulation of BnaALMTs in the roots and leaves at both a sufficient and a deficient P supply. Thirty-nine BnaALMT genes were identified and were clustered into five branches in the phylogenetic tree based on protein sequences. Collinearity analysis revealed that most of the BnaALMT genes shared syntenic relationships among BnaALMT members in B. napus, which suggested that whole-genome duplication (polyploidy) played a major driving force for BnaALMTs evolution in addition to segmental duplication. RNA-seq analyses showed that most BnaALMT genes were preferentially expressed in root and leaf tissues. Among them, the expression of BnaC08g13520D, BnaC08g15170D, BnaC08g15180D, BnaC08g13490D, BnaC08g13500D, BnaA08g26960D, BnaC05g14120D, BnaA06g12560D, BnaC05g20630D, BnaA07g02630D, BnaA04g15700D were significantly up-regulated in B. napus roots and leaf at a P deficient supply. The current study analyzes the evolution and the expression of the ALMT family in B. napus, which will help in further research on their role in the enhancement of soil P availability by secretion of organic acids.

1. Introduction

Phosphorus (P) is an essential nutrient for plant growth and development and is involved in a number of metabolic processes [1]. Although total P in the soil is plentiful yet, soluble P (Pi) is often low [2], mainly because a large amount of P in soil is fixed by metal oxides (acidic soil) or carbonate compounds (alkaline soil), or exists in the form of organic P [3,4]. P deficiency has been one of the main constraints in agricultural production, restricting crop yields of arable land worldwide from 30% to 40% [5]. The plant root can consume only Pi, which normally is present on a micro-molar basis in soils [6]. Plants have established a variety of adaptive strategies in response to P deficiency. These include enhancement of soil Pi availability through rhizosphere acidification by organic acid secretion (OA) and secretion of hydrolytic enzymes (Apase, RNase and Phytase); increasing Pi uptake capability by changing the root system architecture, raising the abundance of high-affinity Pi transporters and establishing associations with arbuscular mycorrhizal (AM); improving physiological P consumption performance through reducing organic P pools by alternate metabolic pathway lipid remodeling and increasing P redistribution from senescing tissues to developing tissues, sustaining yield by maximizing light capture and seed yield biomass allocation [7,8,9].
An aluminum-activated malate protein transporter (ALMT) plays a crucial role in the adaptation under acidic soil conditions [10]. In several organisms, numerous ALMT homologous have been cloned and extensively characterized [11]. For example, TaALMT1 regulates the malate-activated aluminum efflux from the bread wheat roots [12]. The key problem of acid soil is the increased mobility of aluminum ions and their ability to form highly stable phosphorous complexes. As a result, the plant faces not only the toxicity of Al3+ ions but also the low bioavailability of Pi [13,14]. Both issues are solved by releasing organic acids, which could chelate Al3+ ions and release Pi [13,14]. ALMT proteins are regulated at transcriptional and functional levels [13,14]. The existing lack of a crystal structure for modelling the structure of ALMT transporters has impeded the understanding of the structure-function which are the fundamental aspect of ALMT-mediated transportation processes [15,16]. A sequence-based analysis showed that as a family, ALMT has a high level of secondary structural similarity with an n-terminus region containing 6 transmembrane domains, and a long, strongly hydrophilic C-terminus of up to half the length of the whole protein [15,17]. Furuichi et al. (2010) [18] have identified three key residues (Glu274, Asp275 and Glu284) that eliminate Al-dependent transport changes after neutralization, without affecting the basal transport activity; they have concluded that these residues are likely to be in the extracellular C-terminal region as a major determinant of Al3+-activation response [19]. The high level of conservation of these residues demonstrates their value for structural integrity [15,17].
Brassica napu (B. napus, AC genome) is a domesticated allotetraploid, arising from the natural hybridization of the diploid species Brassica rapa (B. rapa, A genome) and Brassica oleracea (B. oleracea, C) over 7500 years ago. It is the third largest source of vegetable oil globally. The lack of plant-available Pi in soil could impede the development and growth of B. napus and reduce its production and quality in return [20]. Citric and malate could be secreted by phosphate-starved oilseed rape to improve soil P mobilization capacity [21]. B. napus had rapid rates of carboxylic acid exudation (Citric acid), which together with its greater root length and root surface area, could allow the plant to acquire poorly available P forms and explore a larger soil volume that facilitate P uptake [22], there have been limited studies on the adjustment to P starvation for the ALMT gene family in B. napus. In this study, we identified the members of the BnaALMT family, their characterization, intrinsic diversity, heterogeneity of expression and functional divergence under contrasting P supplies.

2. Results

2.1. Identification of the ALMT Family Genes in B. napus

A total of 14 ALMT family members were identified in Arabidopsis. The ALMT family genes in B. napus were retrieved from Brassica databases (BRAD, http:/brassicadb.org/brad; accessed on 11 April 2020) using AtALMTs as reference. A high similarity among the orthologues of AtALMTs and BnaALMTs was observed in most of the cases. Some of the B. napus protein sequences were up to 75% similar to their corresponding orthologues in Arabidopsis, while others similarity merely ranged from 40% to 50%. According to the selected threshold value of alignment similarity 75%, we found a total of thirty-nine (39) ALMTs in the B. napus genome. All 39 homologous of the 14 members of the ALMT family, were further confirmed by the published online “Zhongshuang-11” B. napus transcriptomic databases (CRA001775) from the National Genomics Data Centre [23].

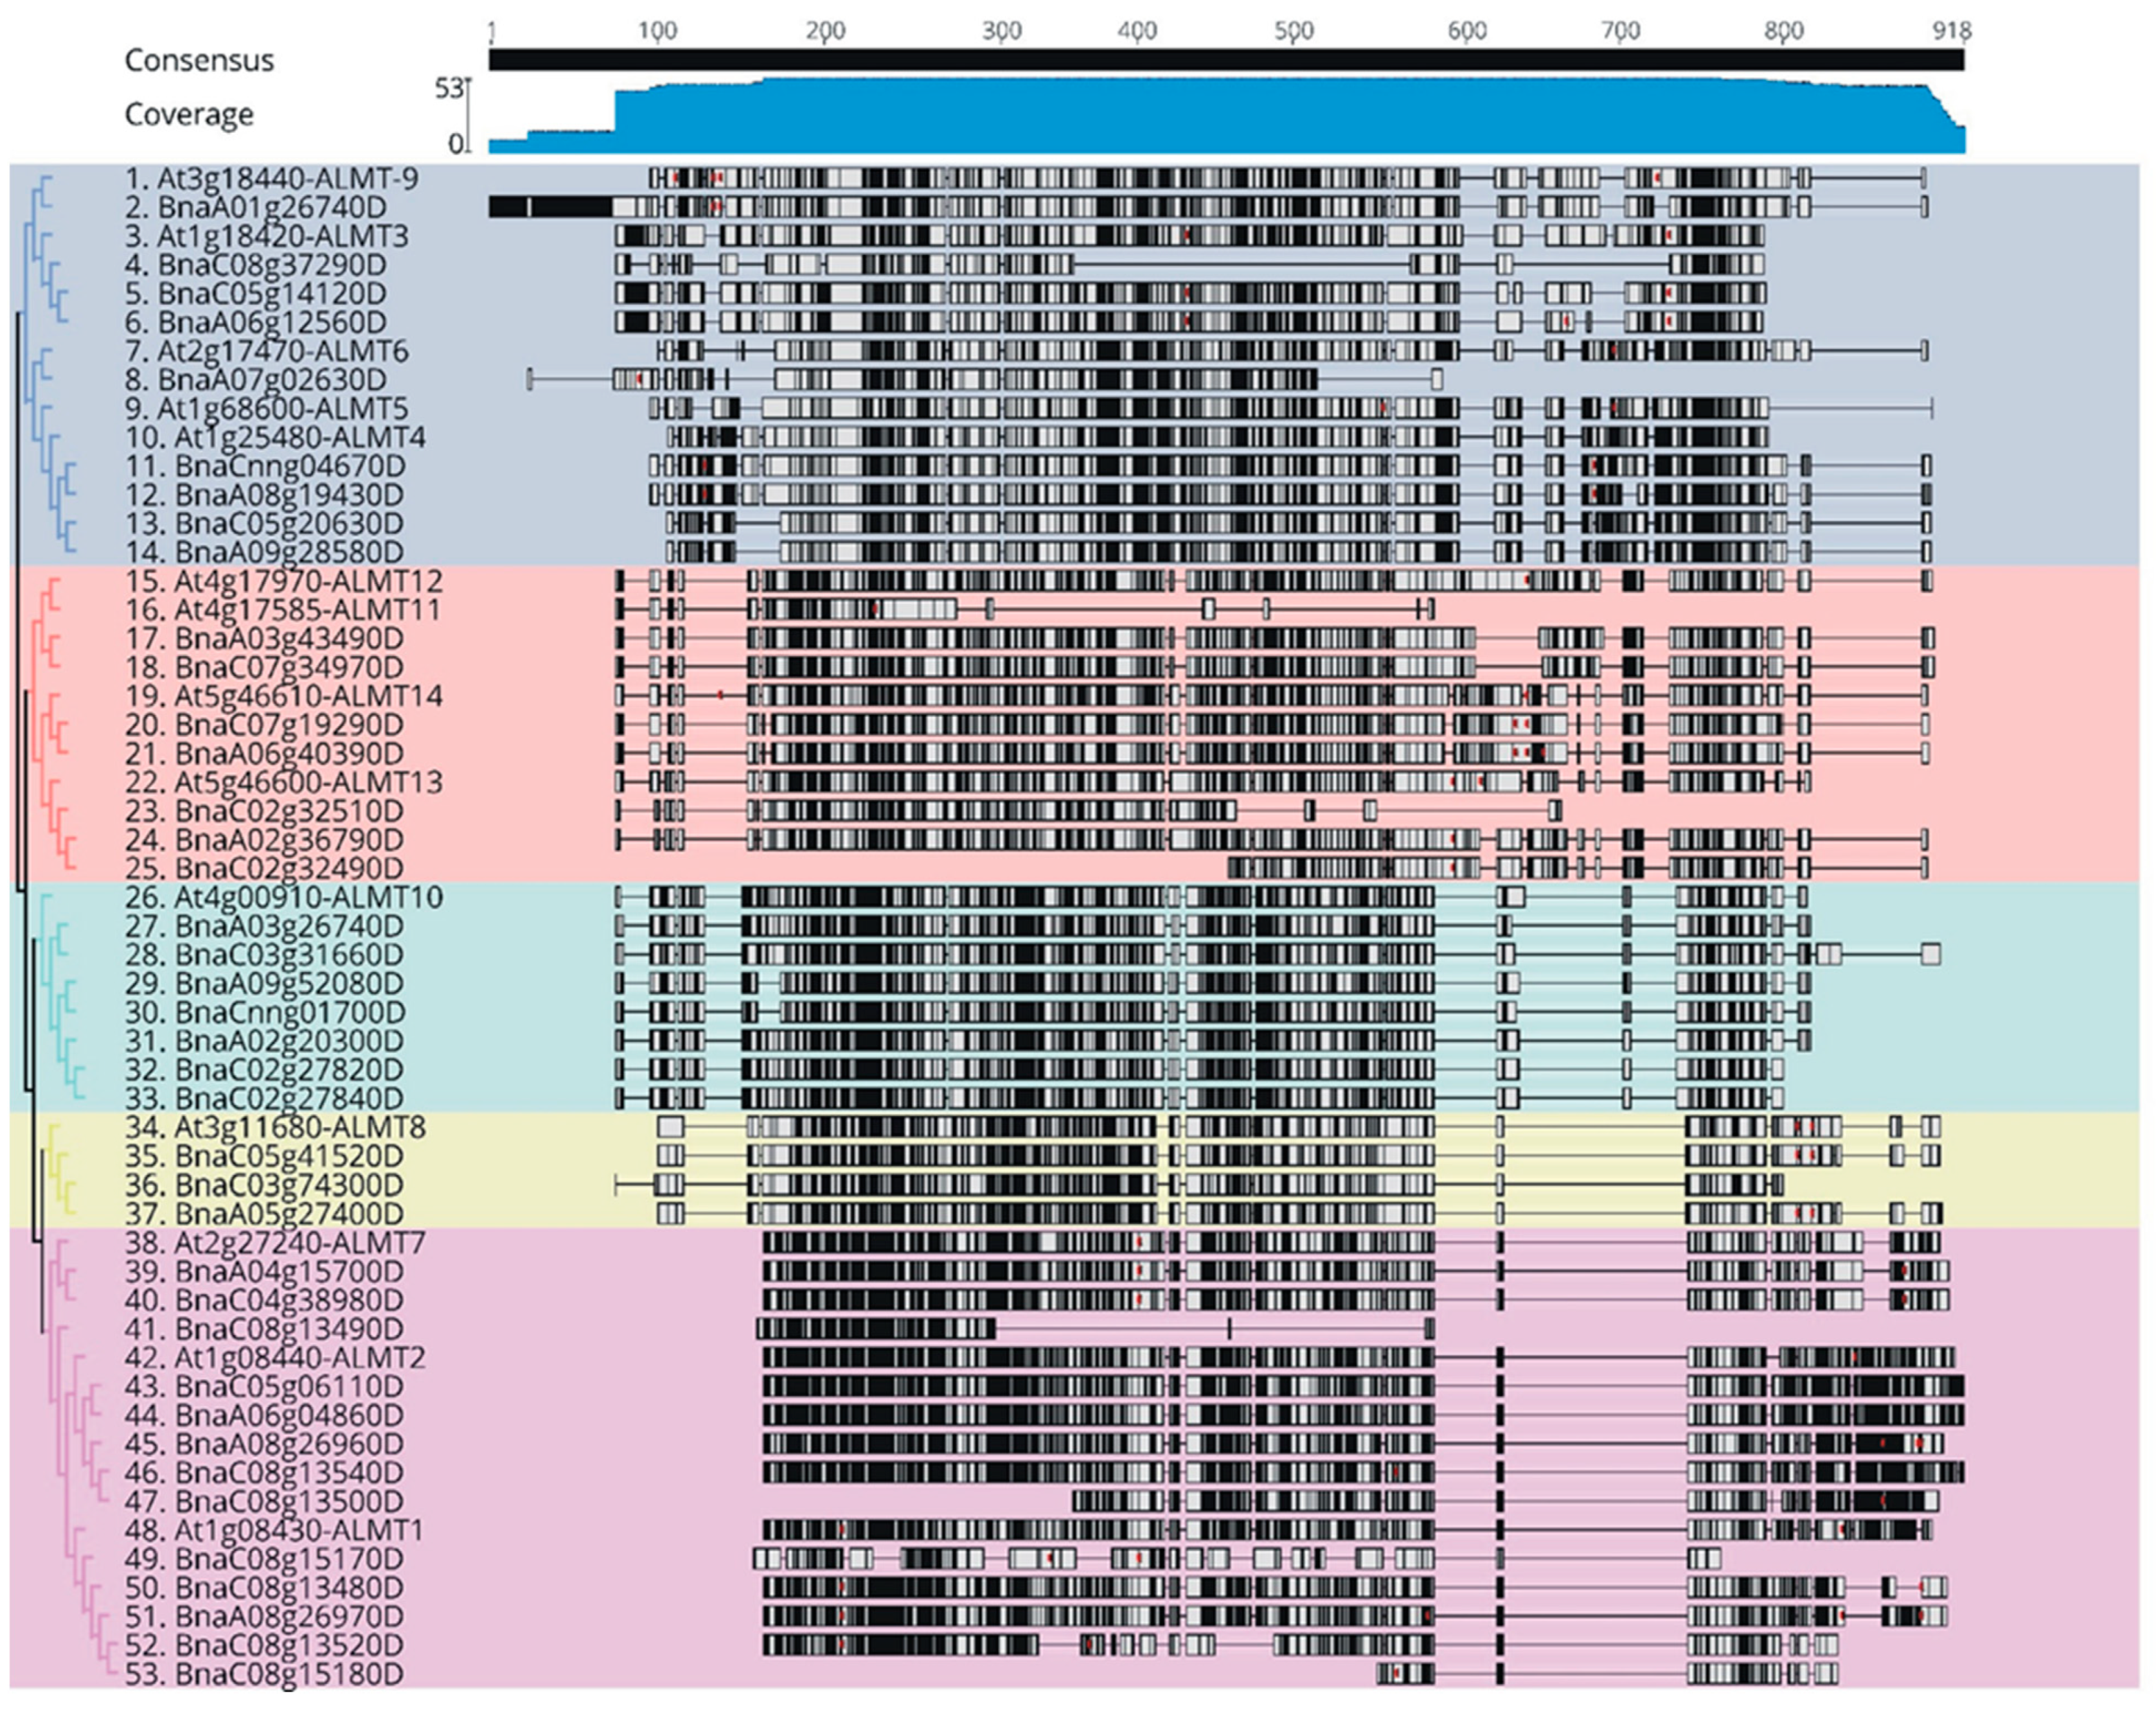
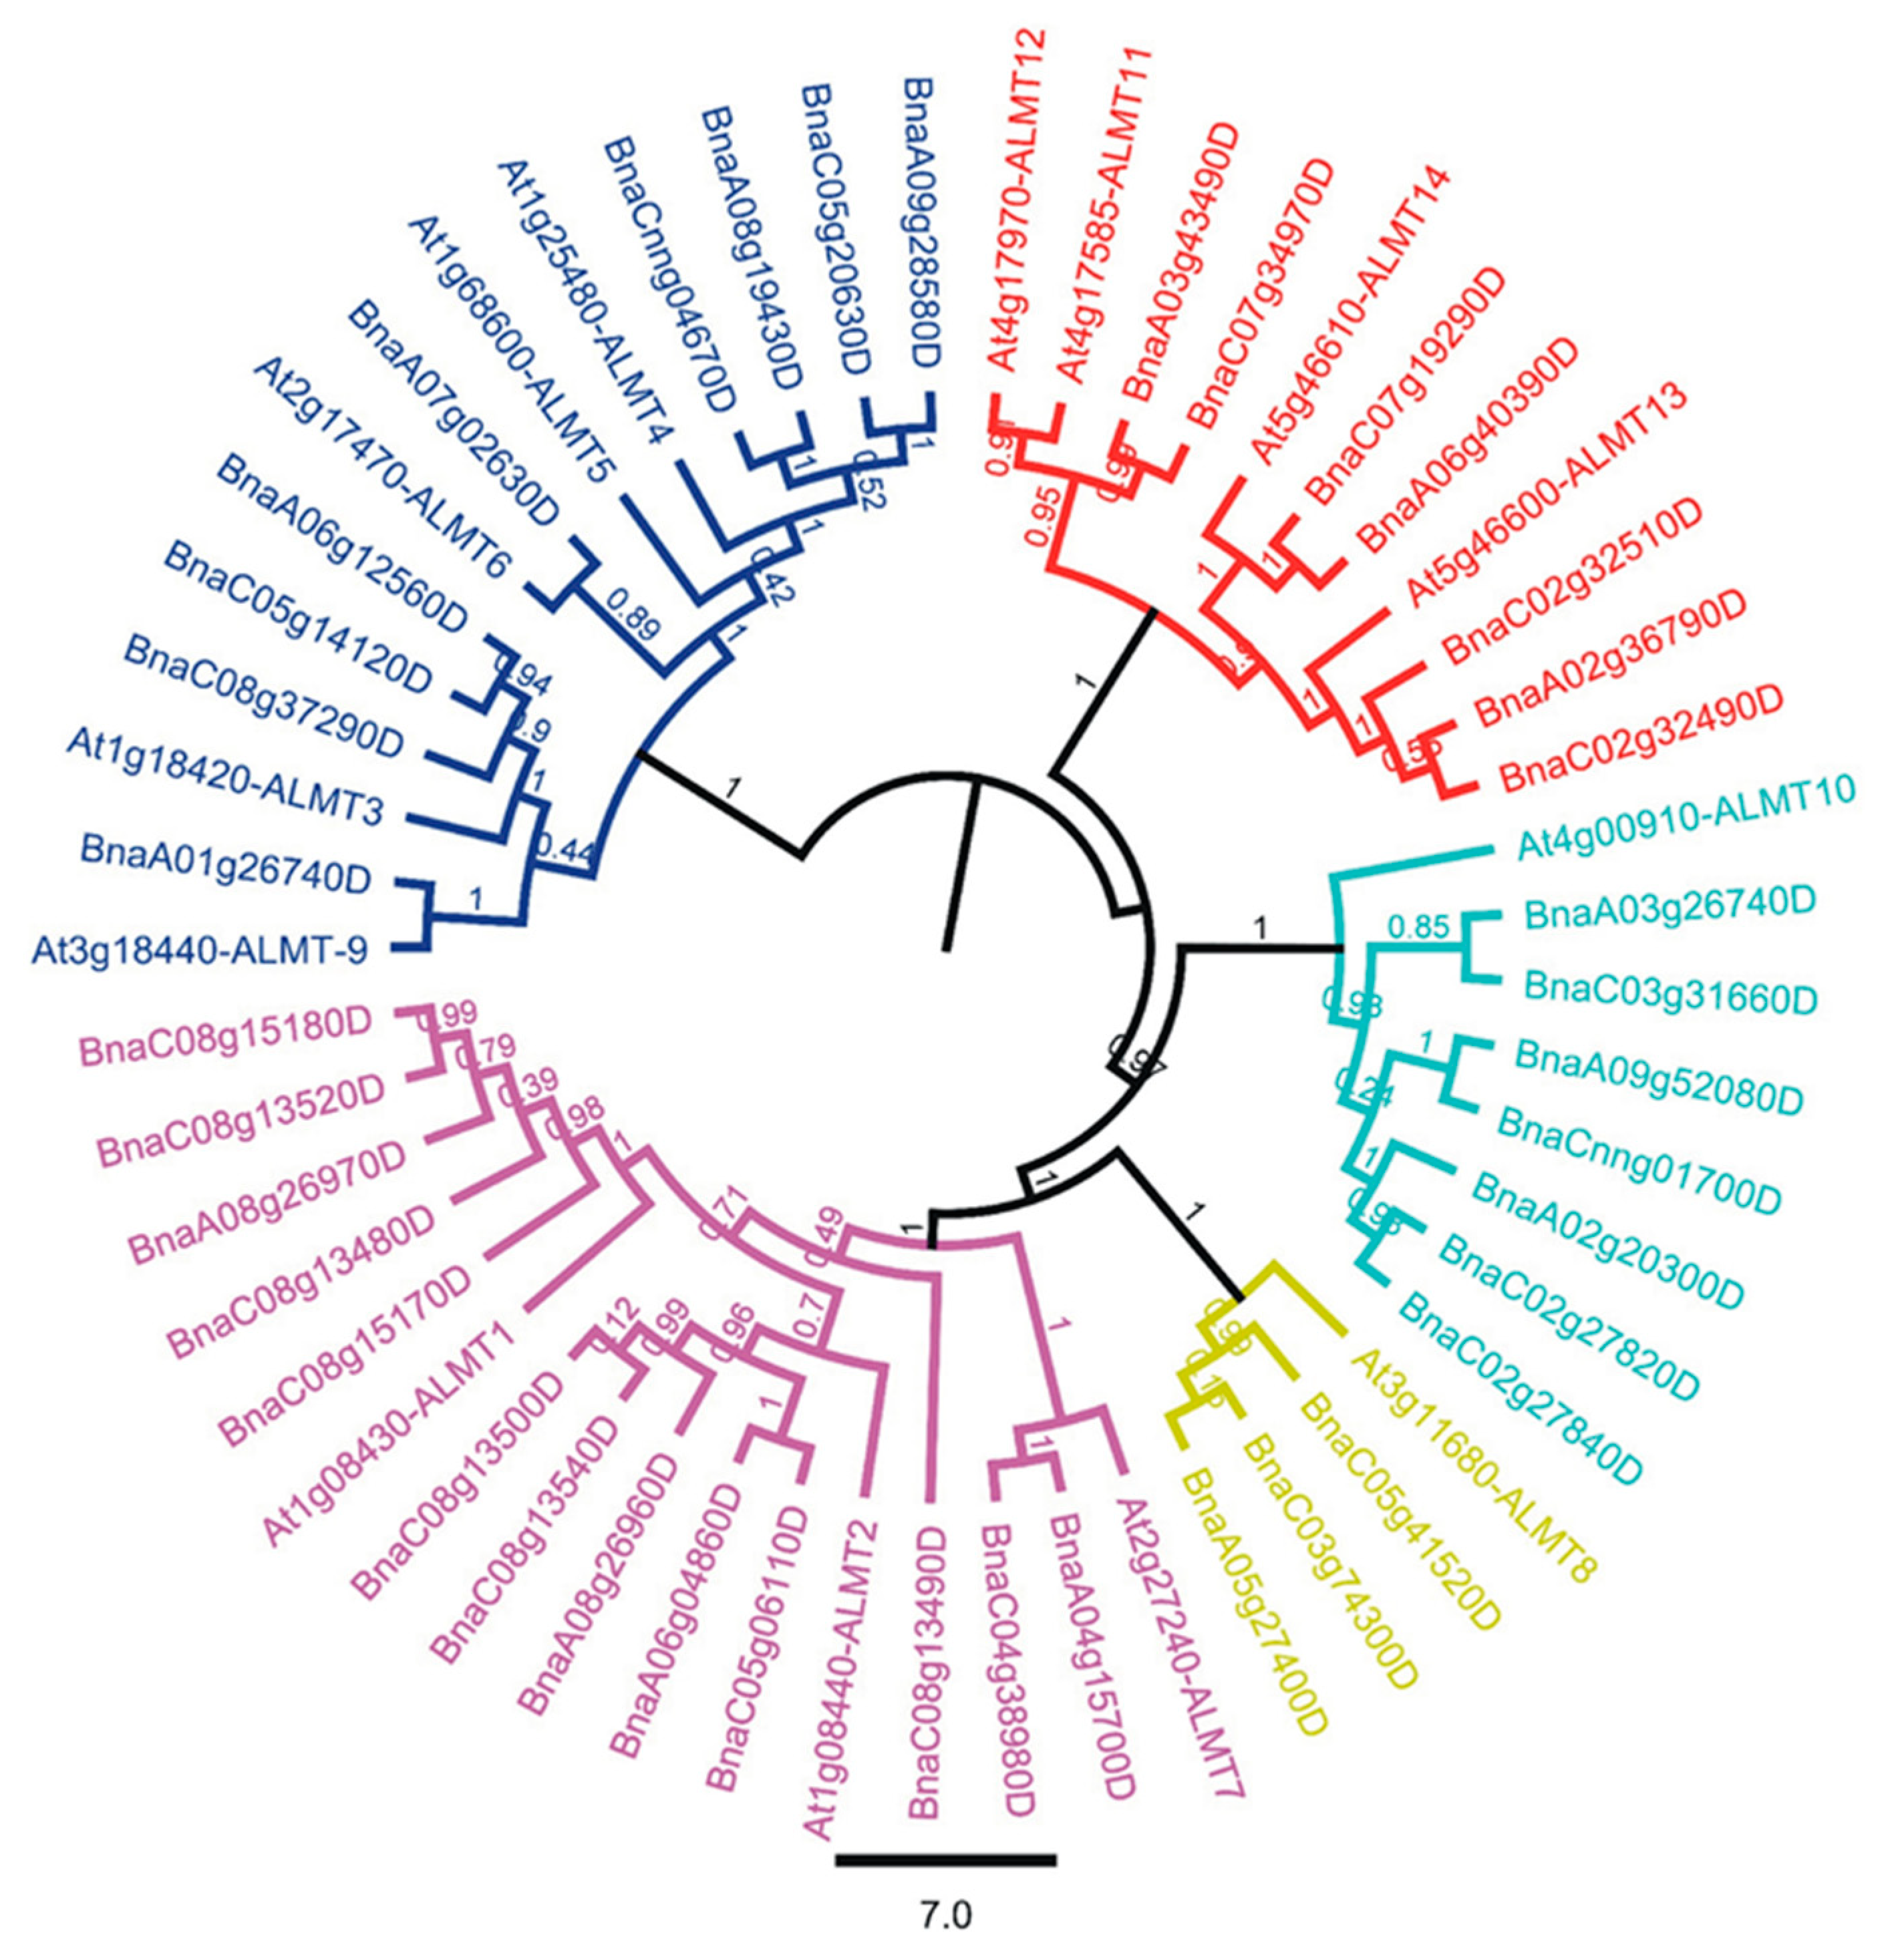
2.2. Evolutionary and Phylogenetic Relationship between Arabidopsis and B. napus ALMTs

To establish the phylogenetic relationships among the BnaALMT family genes and AtALMTs, we aligned the protein sequences of all 39 BnaALMT genes with 14 AtALMT using MAFFT, and the phylogenetic tree was constructed based on multi-alignment using FastTree plugin in Geneious 11. Based on its homology with fourteen members in Arabidopsis, the alignment and eventual construction of the ALMT genes in B. napus was established. Based on the genes’ relationship, the phylogenetic tree was divided into five distinct clades (Figure 1). Clade-1 was split into two subclades and 14 genes; Sub-clade-1 comprised six genes (At3g18440, BnaA01g26740D, At1g18420, BnaC08g37290D, BnaC05g14120D and BnaA06g12560D) while subclade-2 comprised eight genes (At2g17470, BnaA07g02630D, At1g68600, At1g25480, BnaA09g28580D, BnaC05g20630D, BnaA08g19430D and BnaCnng04670D). ALMT5 could not align (At1g68600) with any BnaALMT family member homologs. Clade-2 consisted of 11 genes and was divided into three subclasses comprising genes (At4g17585, At4g17970, BnaA03g43490D, BnaC07g34970D, At5g46610, BnaC07g19290D, BnaA06g40390D, At5g46600, BnaC02g32510D, BnaA02g36790D and BnaC02g32490D). It is worthy to note that AtALMT11 and AtALMT12 form parallel lineage to each other which might have arisen through gene duplication event, in Arabidopsis. Clade-3 consisted of eight genes (At4g00910, BnaA03g26740D, BnaC03g31660D, BnaA09g52080D, BnaCnng01700D, BnaA02g20300D, BnaC02g27820D and BnaC02g27840D), and Clade-4 included four genes (At3g11680, BnaC05g41520D, BnaC03g74300D and BnaA05g27400D). Further, Clade-5 was the largest clade of all which contained 16 genes and split into three subclades (At2g27240D, BnaA04g15700D, BnaC04g38980D, BnaC08g13490D, At1g08440D, BnaC05g06110D, BnaA06g04860D, BnaA08g26960D, BnaC08g13540D, BnaC0813500D, At1g08430D, BnaC08g15170D, BnaC08g13480D, BnaA08g26970D, BnaC08g13520D and BnaC08g15180D). BnaC08g13490D was stood alone and not grouped with any members of the AtALMT family genes.

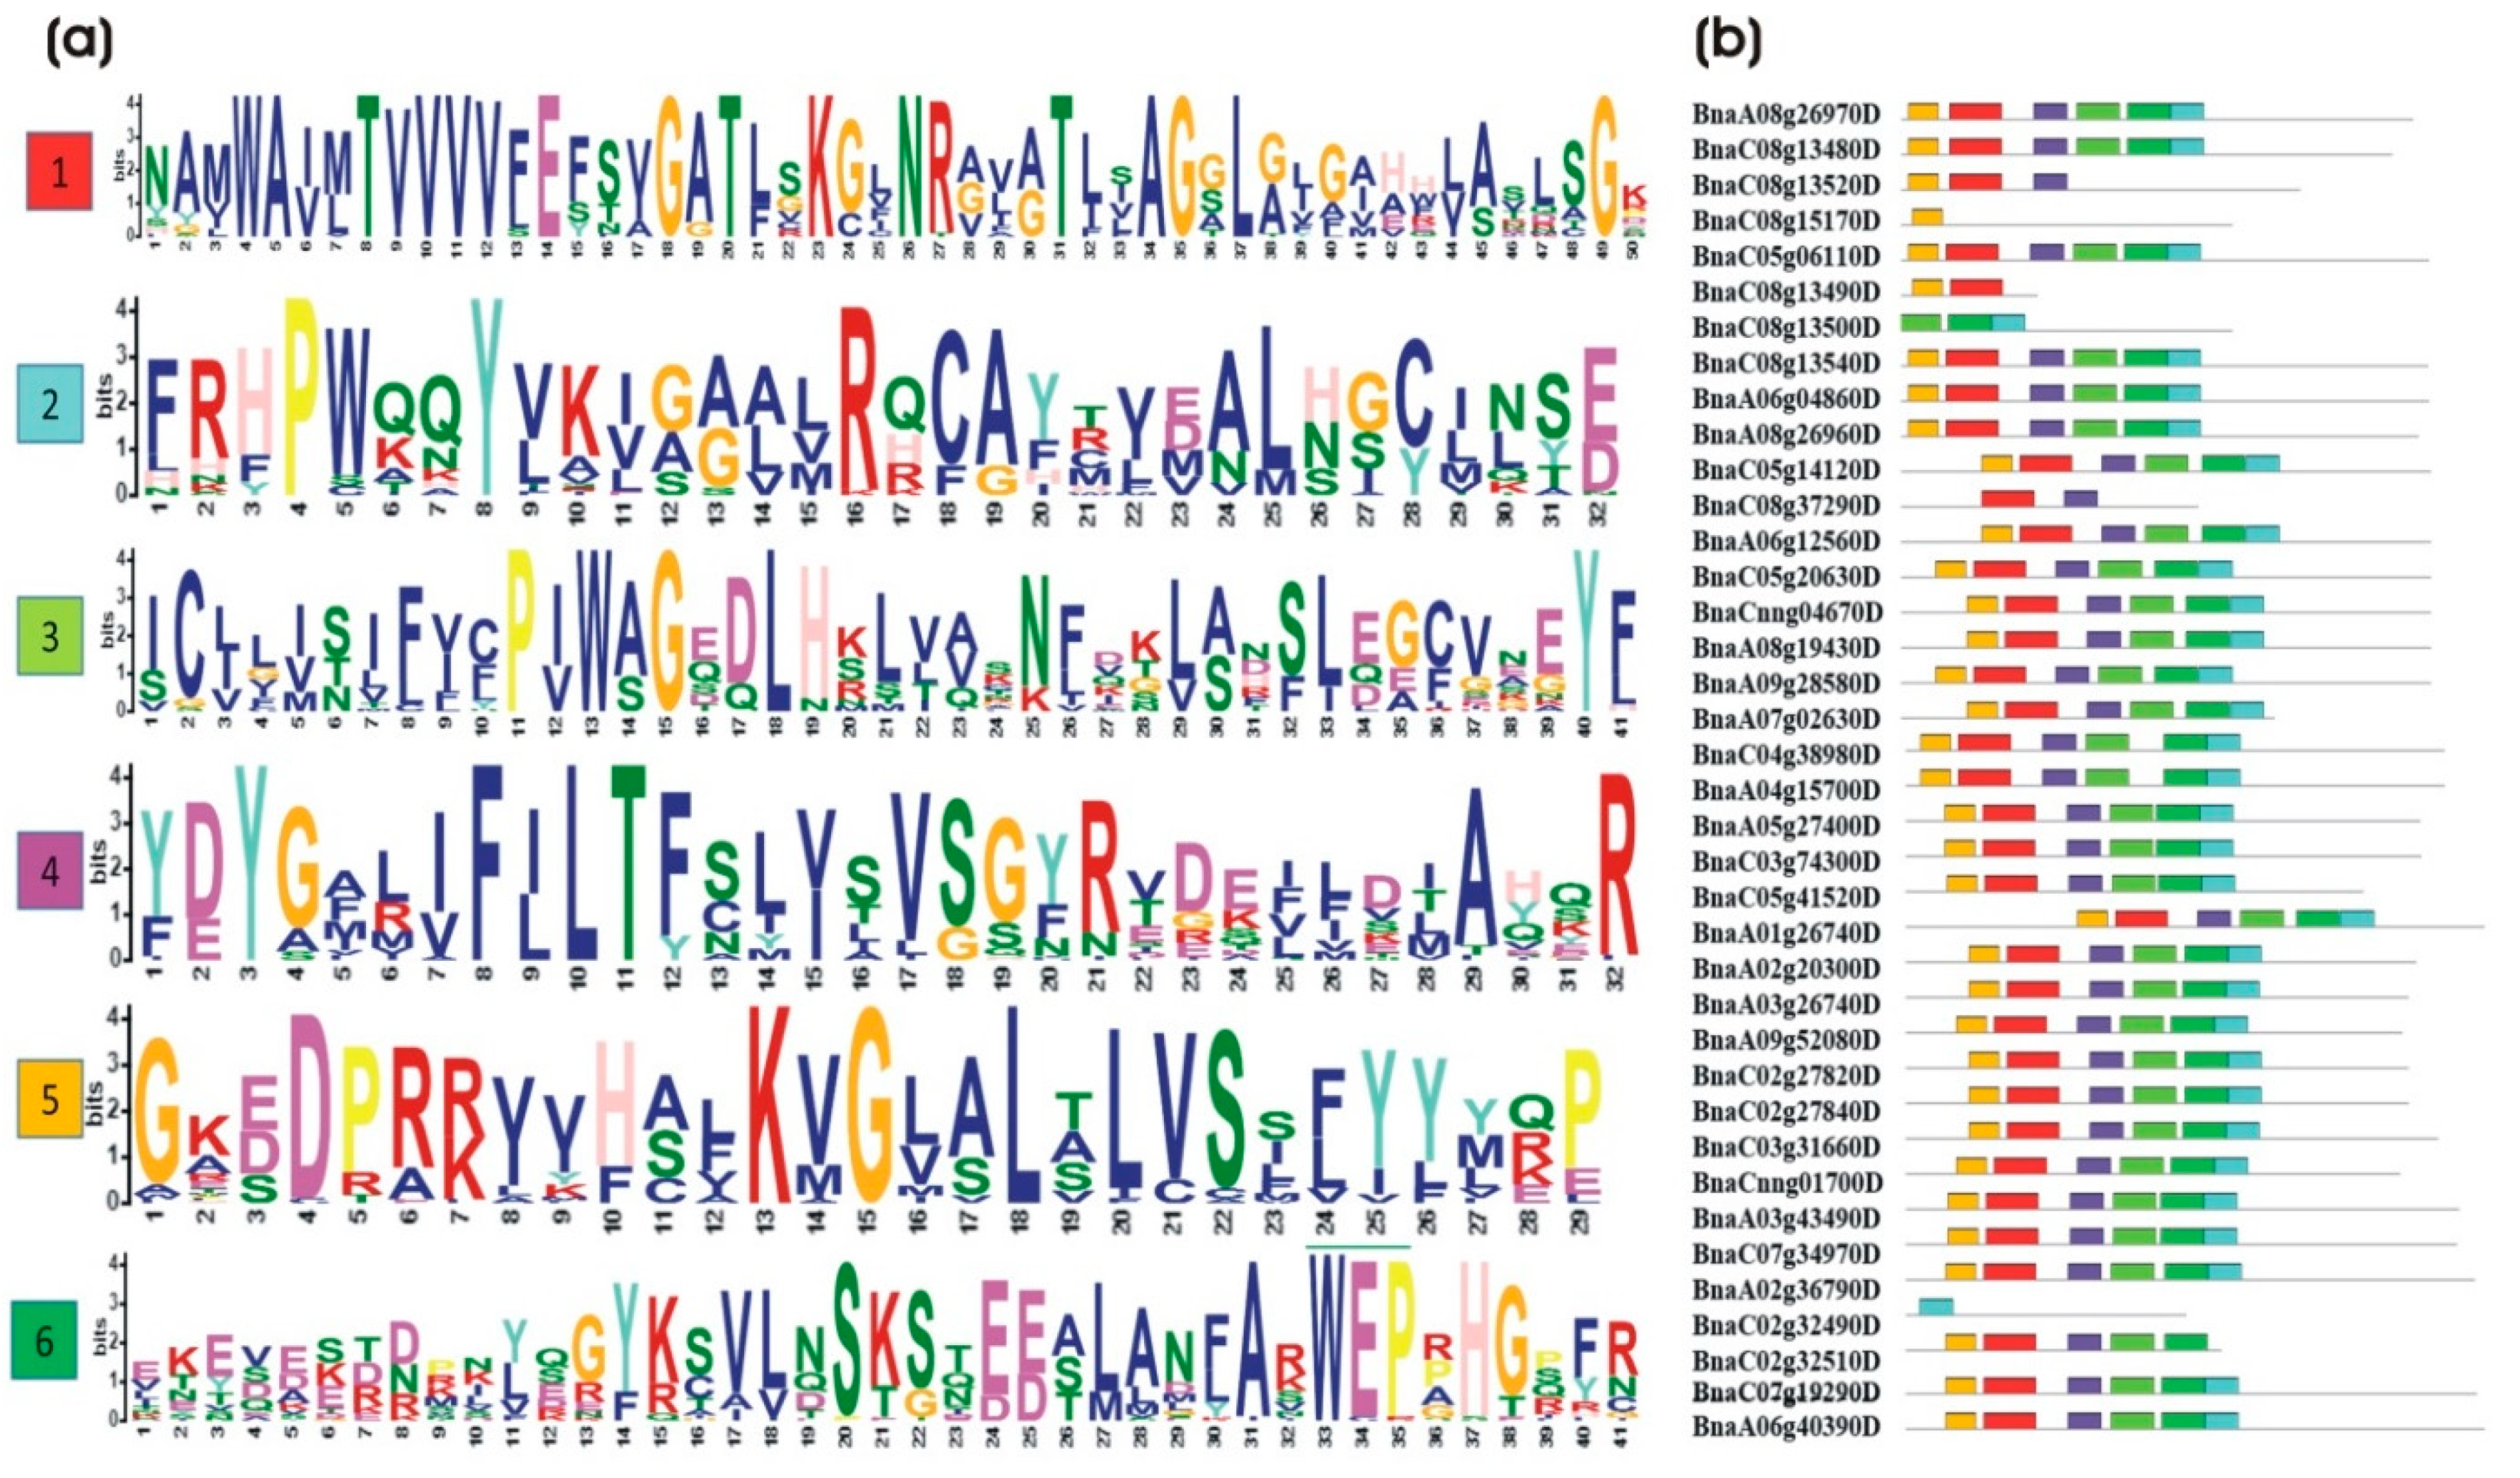
2.3. Gene Structure and Conserved Motif Analysis of the BnaALMT Genes Family

To gain an understanding of the phylogenetic relationship of critical sequence polymorphisms among the BnaALMT family genes with AtALMTs in their flanking areas, we analyzed the gene structure by comparing the protein sequences of BnaALMTs based on their gene information from the GENOSCOPE database. For the analysis of protein sequence variation, we had blasted the protein sequences of 39 BnaALMT gene families with 14 AtALMT members. In B. napus homologs of the ALMT families which were in adjacent branches of the phylogenetic tree, the same gene structure was exhibited (Figure 2), which could then divide the phylogenic variation of these ALMT genes into 5 independent classes. Among them, Class 1 had ten BnaALMT genes, Class 2 and Class 3 both had seven BnaALMT genes, Class 4 had three BnaALMT genes and Class 5 had 13 BnaALMT genes. Moreover, within each class BnaALMT genes and AtALMTs were highly variable and were arranged in different sequence lengths and numbers. For example, the length of the conserved sequence, the dissimilarities and the deletion of the BnaALMT genes ranged greatly among the various members of the BnaALMT gene family, varying between 115 and 666 bp, with numbers ranging from 1 to 918 bp lengths at top of the scale (Figure 2). The BnaALMT genes in Class1 were lengthier and had much more dissimilar regions in their homologues, whereas the BnaALMT genes in Class5 have more conserved gene regions than other classes. However, the deletion regions among the BnaALMT genes of Class 3, Class 4 and Class 5 were the same, varying between 600 to 800 bp lengths at top of the scale (Figure 2). In comparison, some of the genes had lost their protein sequences in various groups.
The orthological gene pairs between A. thaliana and B. napus were traced, with protein structural models for BnaALMTs aligned to AtALMTs generated with the MAFFT sequences used by the Arabidopsis thaliana family and B. napus ALMT family genes (Figure S1). BnaALMTs were much different in structures than AtALMTs. The findings of several sequences of alignment showed that the protein structural diversity of B. napus and A. thaliana ALMT genes (Figure S1) was obvious from Clade1, Clade2, Clade3, Clada4 and Clade5. Beta-strand paired with AtALMTs had been formed in the BnaALMT family sequence alignments, such as AtALMT6, AtALTM7, AtALMT11, AtALMT12, AtALMT13 and AtALMT14 homologous. The analysis of the gene structure of the ALMT families in Arabidopsis and B. napus indicated that the gene structure differed across various subgroups but was conserved in the same subgroup.
To identify a common motif among these proteins, all 39 genes of BnaALMT were subjected to the online MEME (http:/meme-suite.org/; accessed on 17 April 2020) tool. The analysis was conducted with the “motifs search” while the rest of the setting was maintained as default. A total of 6 motifs in the majority of B. napus ALMT’s family protein were identified in MEME suits. We found several highly conserved sequences including TVVVVFE, AG(X)L, PW(X)(X)(X)Y, R(X)CA, P(X)W(X)G, K(X)G(X)(X)L(X)LVS, F(X)LTF, and WEP in protein sequences of BnaALMTs. However, here we did not find any of their reported functions in literature except for the WEP sequence and the sequences highlighted from the motifs 3 and 6 residues which were highly similar to the earlier study in wheat. All of these sequences had significant functionality as they were evolutionary similar to their orthologues in different species. Most of the BnaALMTs contained 6 motifs except for BnaC08g15170D, BnaC08g133500D and BnaC08g37290D (Figure 3b). The BnaALMT proteins responsible for DNA binding were conserved in a motif-1. Motif-3 and Motif-5 were rich in G (glycine). Rich in valine (V) and glycine (G) were usually associated with dimerization of proteins. In BnaALMTs, the presence of G-rich motifs showed that these proteins could interact with several other proteins and thus make BnaALMTs better able to integrate with various biological processes in B. napus. Motif-2, Motif-4 and Motif-6 were highly variable among BnaALMT proteins which could be responsible for various biological functions in these BnaALMTs. The highly variable motif showed a wide range of functional diversity for BnaALMTs. Contractions between motif 2 and 6 in the ALMT genes that were likely due to segment deletion in these genes, were also evident in protein structures. Motif-6 included a WEP conserved sequence that was part of the standard fingerprint pattern (Trp-Glu-Pro) found in all ALMTs to evaluate the ALMT functions.
A broad range of functional diversities for BnaALMT was indicated by the presence of highly variable motifs. Some of the patterns of the BnaALMT genes were well spread in an exact position of sequences, whereas the other BnaALMT genes were placed in a pattern of an abnormal protein sequence (Figure 3b). The same lineage might have come from BnaC08g13490D and BnaC08g13500D, while these two genes had been split due to the deletion of the segment of genes. Apparent contractions were also found in the protein structures between motif 1 to 6 in BnaC02g32510D, BnaC08g13520D and BnaC08g37290D which was possibly the product of segment deletions in these genes which had lost one, three and four motifs, respectively (Figure 3b). The gene BnaC08g15180D was completely lost all the motifs (1 to 6). The genes of BnaC08g15170D and BnaC02g32490D were possible pseudogenes, with the loss or the gain of part of the A genome sections being able to result in protein expansion and contraction. In each subgroup, most closely related genes had a similar motif composition, although the motif composition varied significantly among the various subgroups. The similar motif arrangements between ALMT protein sub-groups indicated that in one specific subgroup the protein architecture was preserved. Overall, together with the results of phylogenetic analysis, the similar gene structure and conserved motif composition of ALMT members of the same group strongly supported the confidence of group classification.

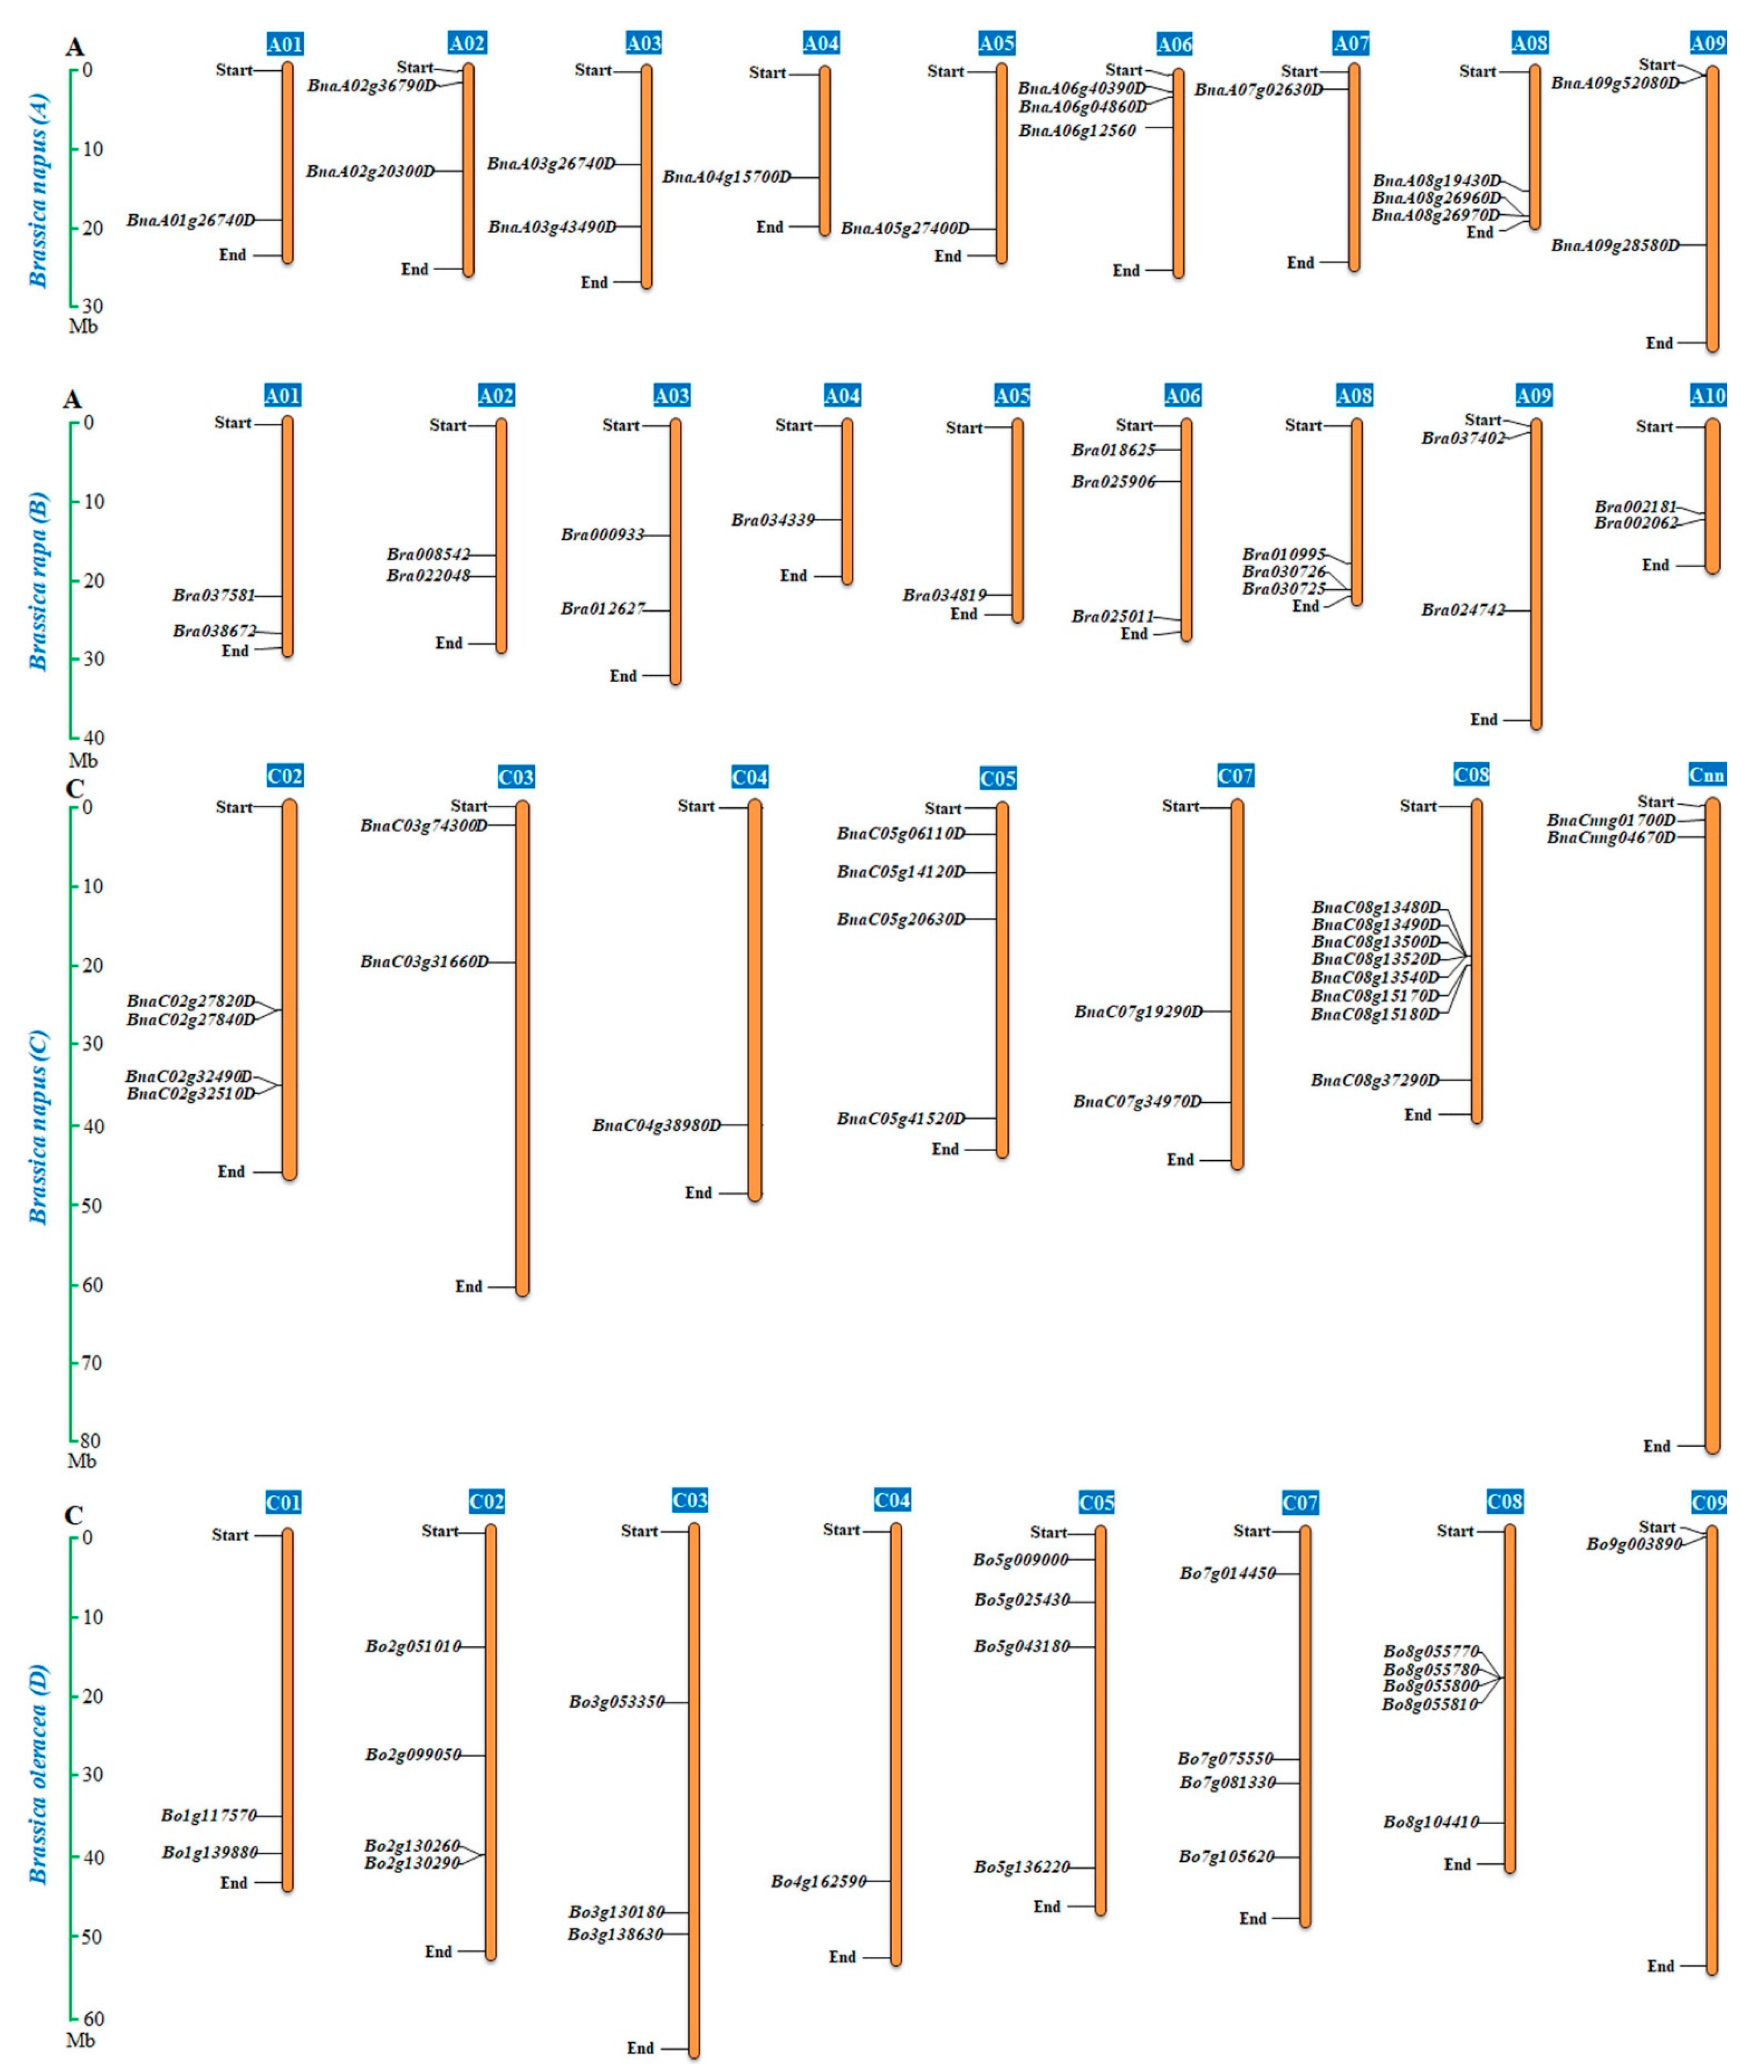
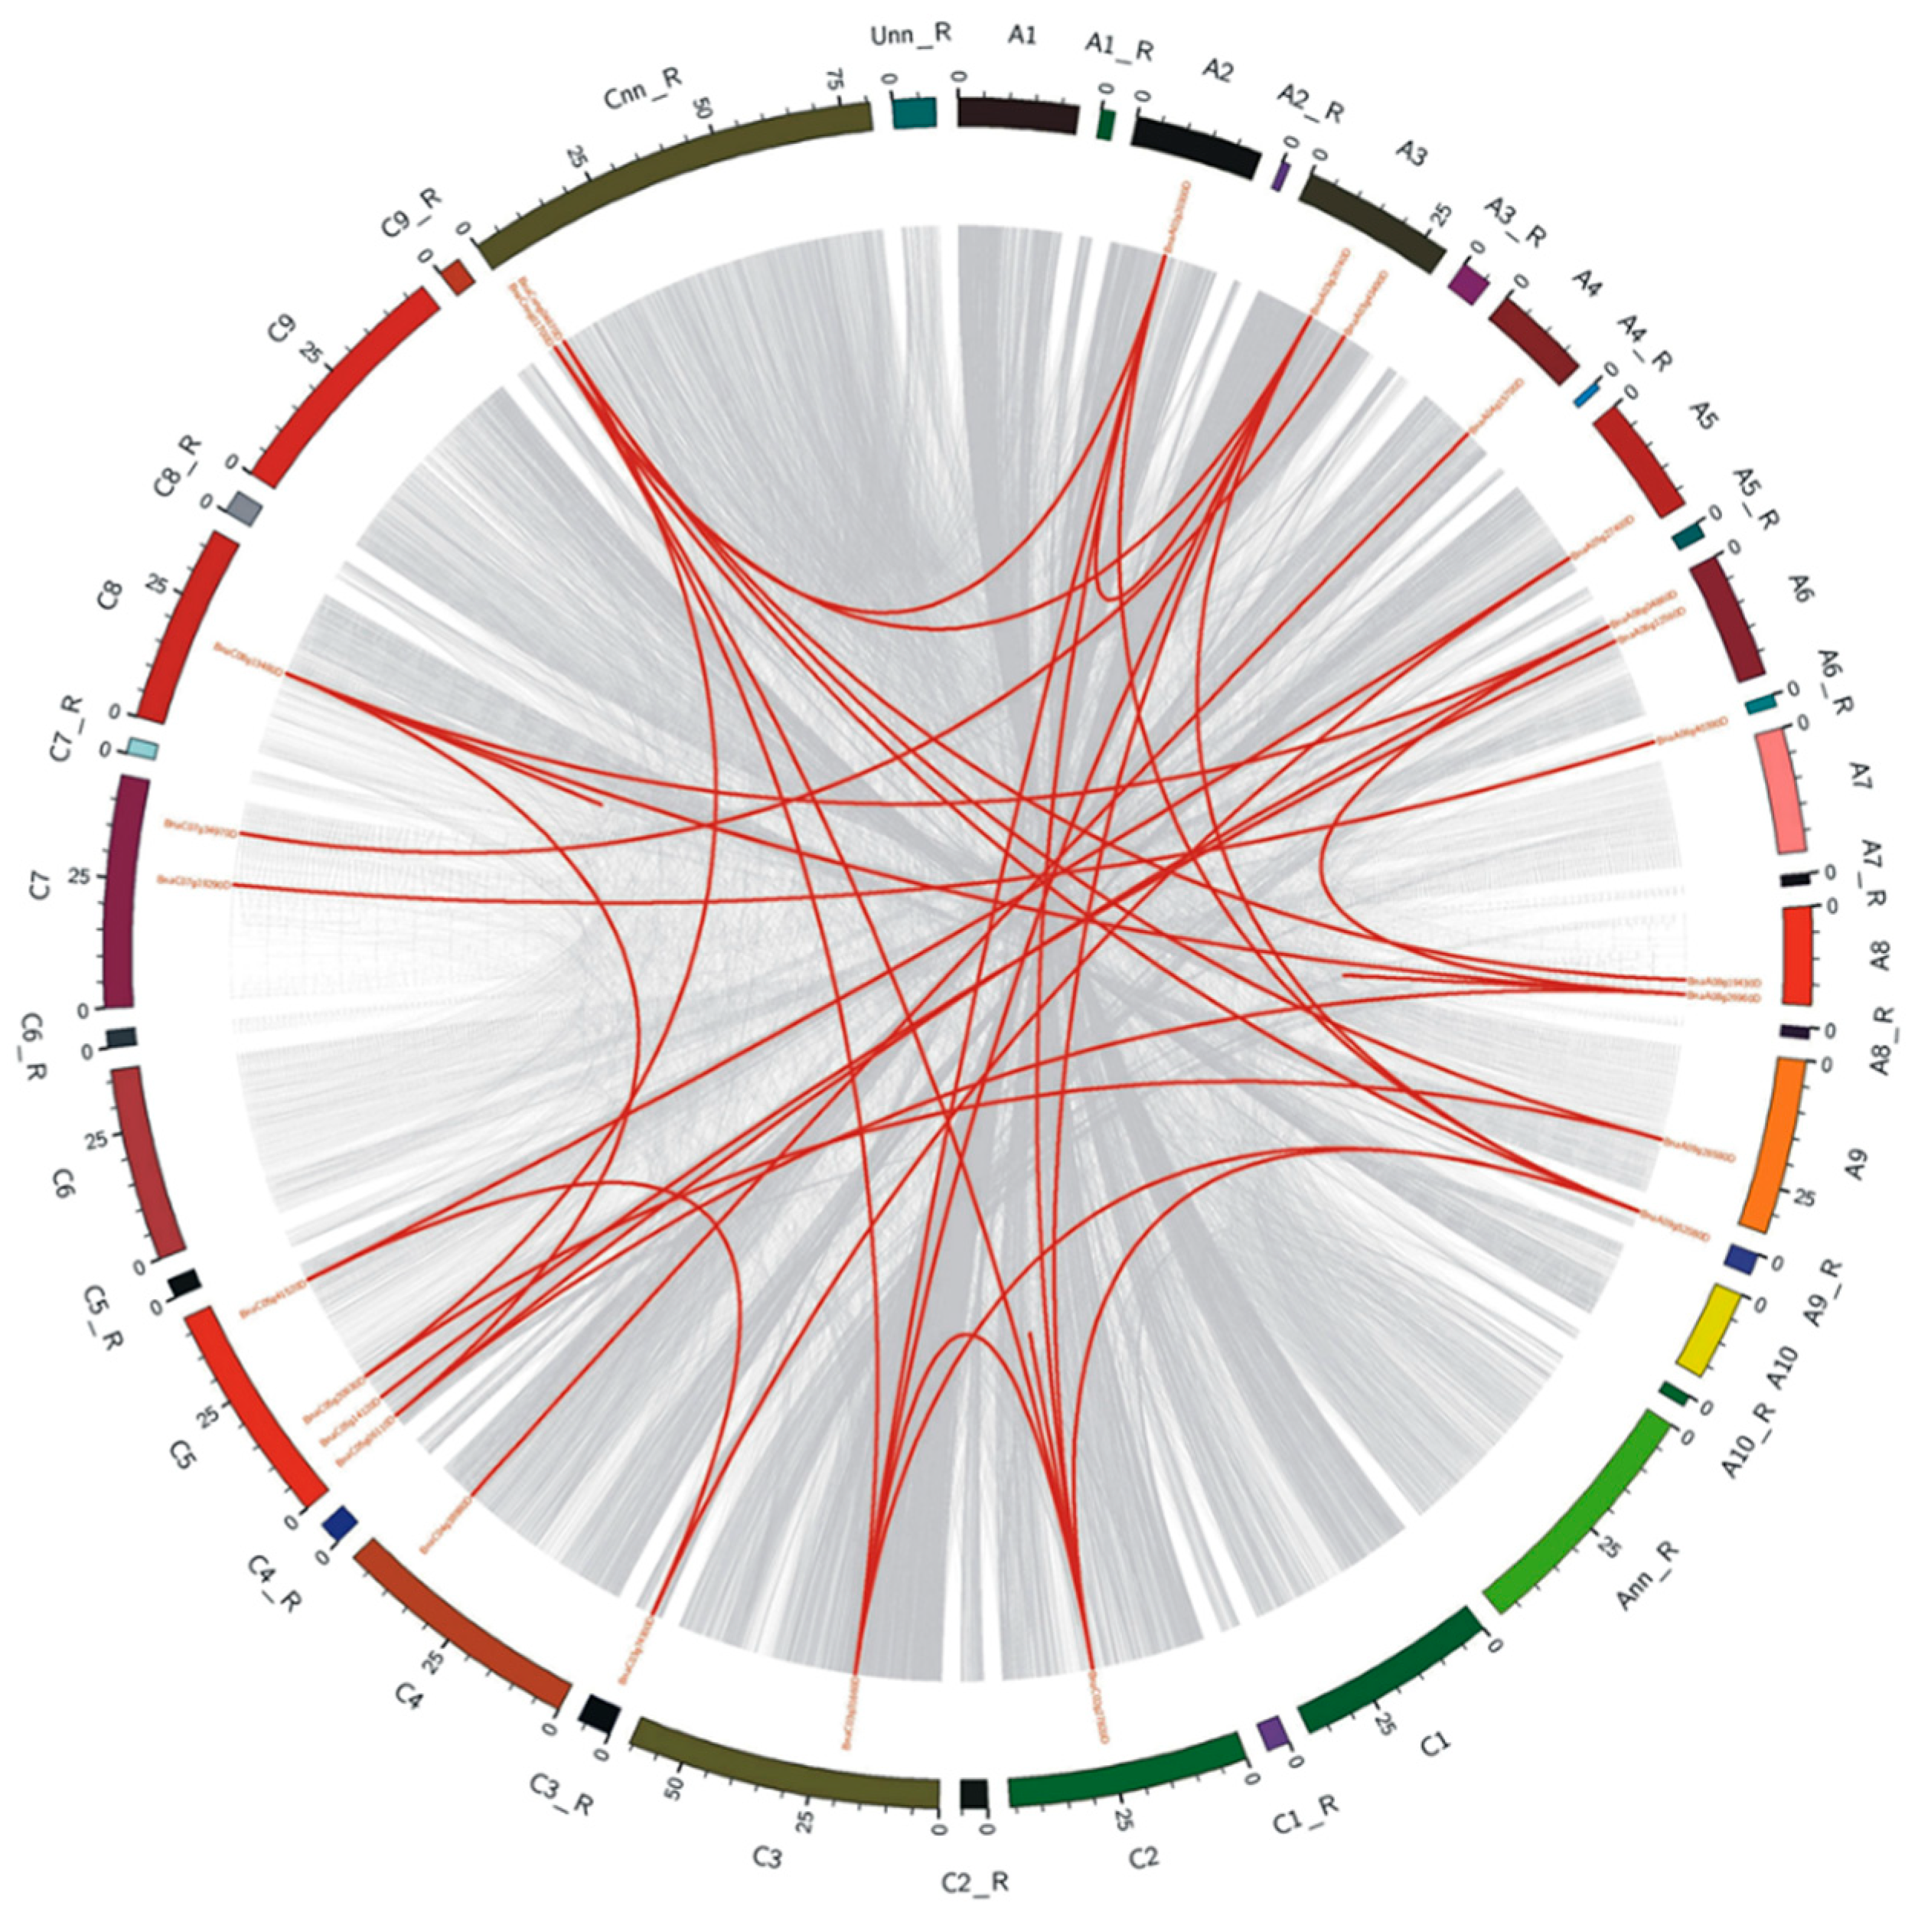
2.4. Chromosomal Distribution and Duplication of the BnaALMT Genes

To analyze the evolution of ALMTs using a syntenic genetic study, we traced the orthologous gene pairs among Brassica species. A total of 25 pairs of genes in orthology were found in B. napus (Figure 4). In contrast with A. thaliana, Brassica species have suffered an additional whole-genome triplication (WGT) [24]. The ALMT genes may have triplicate orthologous copies in B. rapa and B. oleracea, as WGT from the Brassica ancestor in the A. thaliana genome. Gene duplication analysis with the syntenic, phylogenetic and chromosome-site study had shown that 39 BnaALMT genes were scattered unevenly across 16 chromosomes, except A01, A10, and C07, with 16 in A sub-genome and 23 in the C sub-genome (Figure 5). Two members of BnaCnng04670D and BnaCnng01700D were found in the C sub-genome, but they could not be mapped to a particular chromosome. There were comparatively some chromosomes (e.g., ChrC08) that had relatively many genes, or relatively few genes (e.g., ChrA07). Chromosome C08 had the most numerous BnaALMT genes and eight BnaALMT genes have emerged in the gene cluster. The chromosome length and number of BnaALMT genes had no positive association. Furthermore, both BrALMTs and BoALMTs were mapped on their chromosomes except for ChrA07 in B. rapa, and ChrC06 and ChrC10 in B. oleraceae (Figure 5).
Gene family expands mainly via three pathways; tandem duplication, segmental duplication, and whole-genome duplication [25]. A tandem duplication case is defined as a chromosomal region within 200 kb containing two or more homologous genes [26]. To further uncover the evolution processes of the BnaALMT family, we analyzed the gene replication patterns using their CDS sequences (Figure 3a). Here, twenty-five BnaALMT genes (64.1%) were divided into seven chromosome tandem replication regions on chromosomes A03, A06, A08, C05 and C07 (Figure 4). Each tandem cluster had 2–3 duplicated genes. Besides the tandem-duplication events, 129 segment-specific duplication events were identified with 39 genes in ALMT using BLASTP and MCScanX methods (Figure 4), suggesting that the evolution of the BnaALMT gene family has been powered by segment-specific duplication events. Because almost all of the BrALMT’s and BoALMT’s homologous products retained ties with BnaALMTs, in addition to segmental duplication, complete genome duplication (polyploidy) was also a major driving force of BnaALMT.

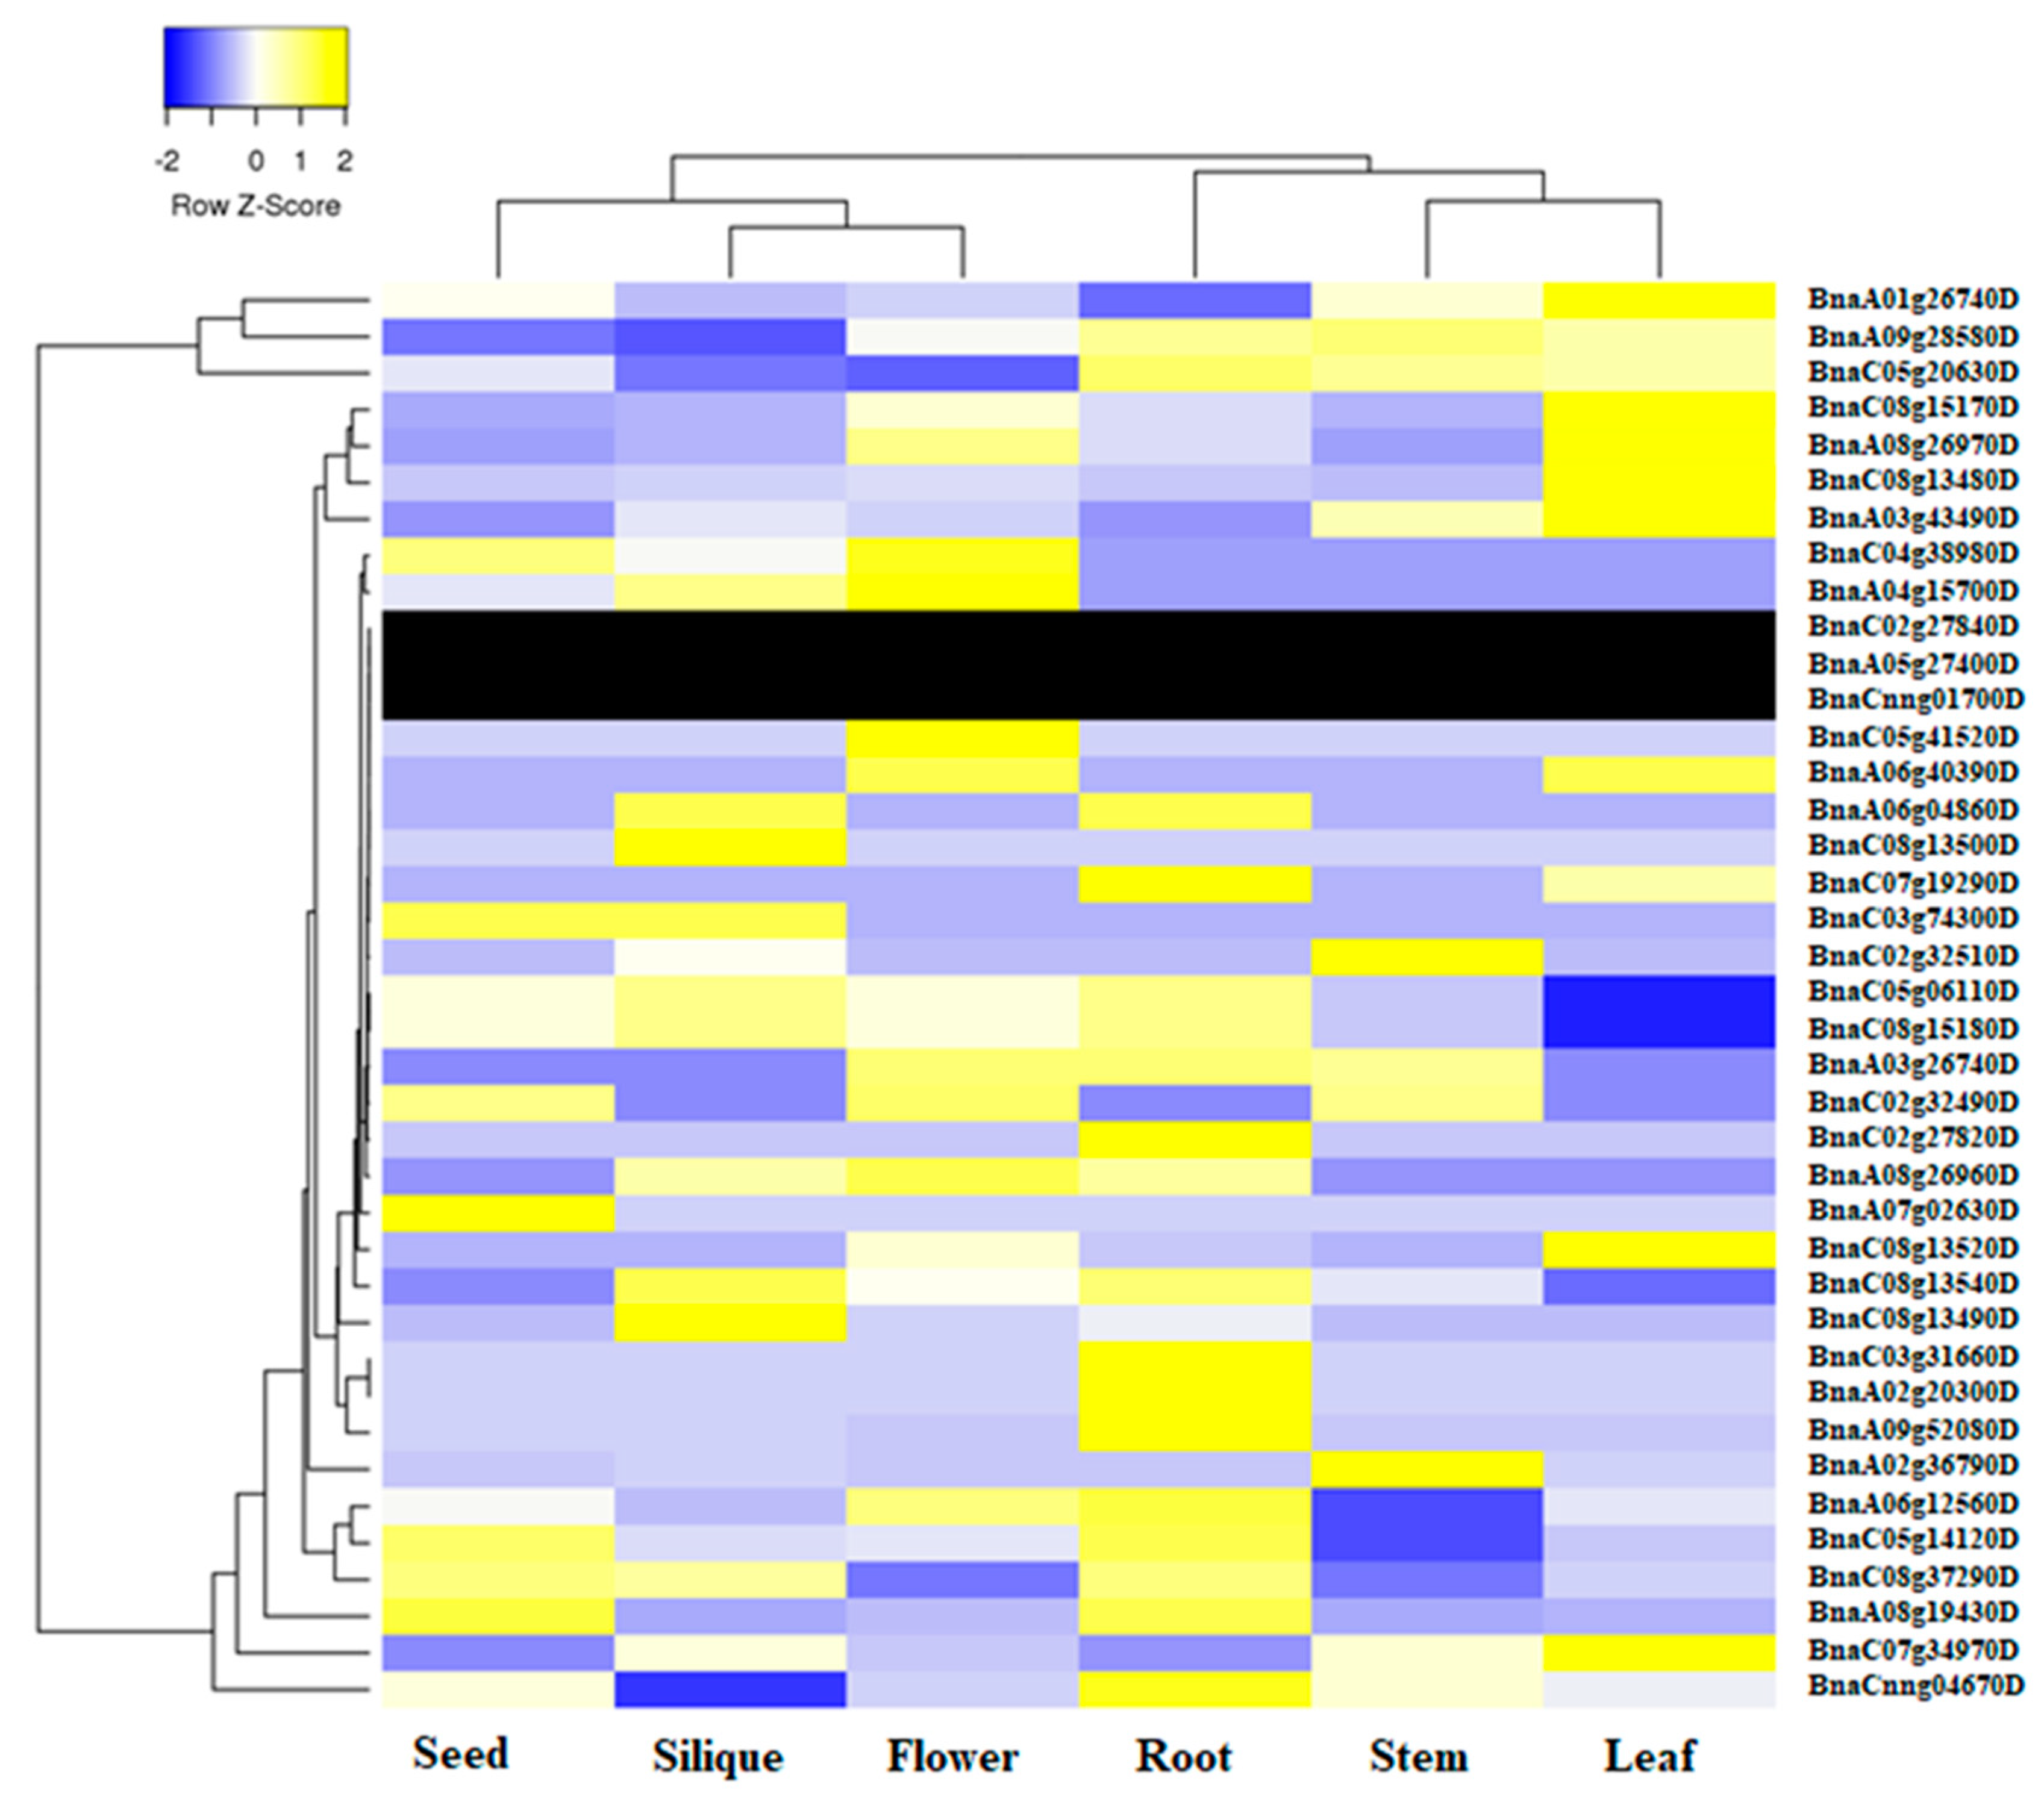
2.5. Expression Profile of BnaALMT Genes in Different Tissues

We used online transcription information for B. napus cultivar “Zhonghuang11” to define the tissue-specific expression profile of different genes in the BnaALMT gene family under nutrients sufficient conditions (Figure 6). In total, 18 BnaALMT genes homologous to AtALMT1, AtALMT2, AtALMT3, AtALMT4, AtALMT10, AtALMT13 and AtALMT14 had exceedingly high expression in root, while 11 BnaALMT genes homologous to AtALMT1, AtALMT4, AtALMT9, ALMT11, AtALMT12, and AtALMT14 had highly expression in leaves. In addition, BnaALMT members showed a diverse expression pattern in other tissues including seed, silique, flower and stem. Among the tissues evaluated for expression analysis, developing seeds shared the least BnaALMT members. Interestingly, not a single BnaALMT family member was found to have high transcript abundance in all the examined tissues indicating they had highly specific roles in different tissues.

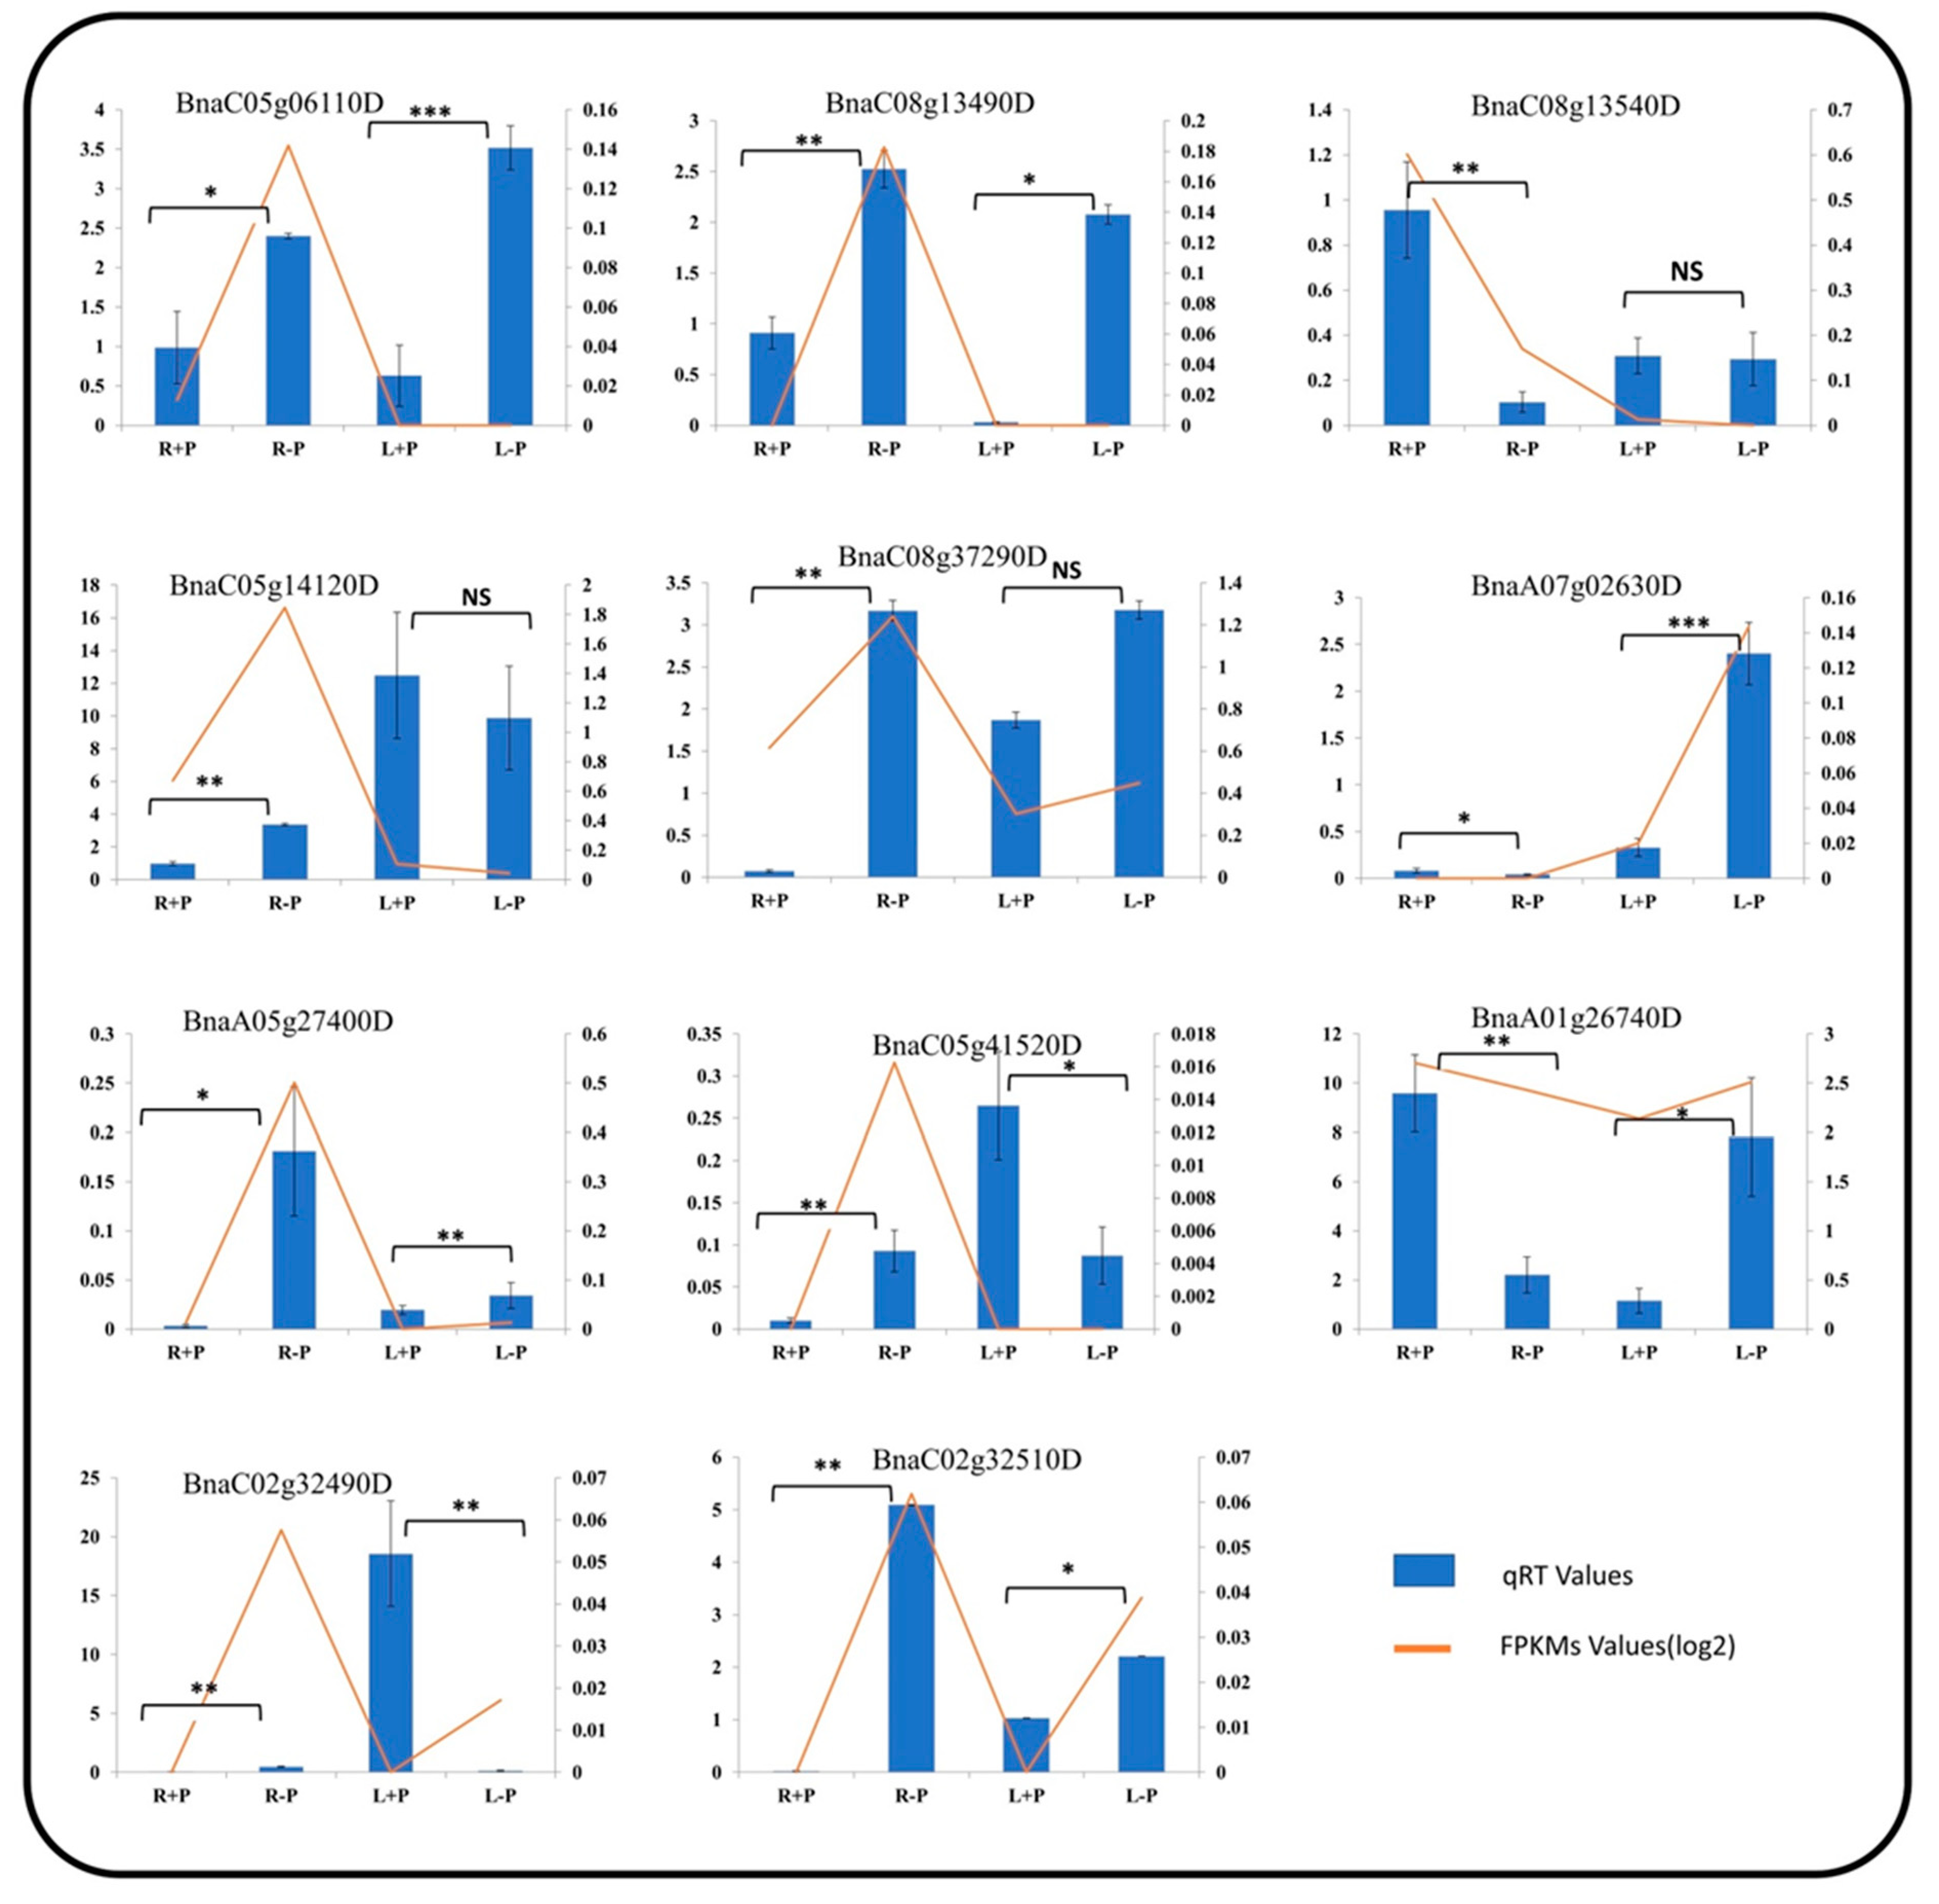
2.6. The Expression Pattern of BnaALMTs in Response to Phosphorus Stress

The Leaf (L) and root (R) of the B. napus cultivar “Zhongshuang11” under P sufficient and deficient conditions were used to examine the transcriptional profile of BnaALMT genes in response to P deficiency. The heat map was based on BnaALMT family genes expression values (FPKMs) derived from the RNA sequence data (Figure 7). A total of thirty-nine (39) BnaALMTs family genes showed altered gene expression responding to P deficiency. Most BnaALMT genes showed up-regulated in the roots as compared to the leaves. Nearly half of the BnaALMTs were up-regulated after P deprivation in the roots. In the treated roots, only three of the BnaALMT genes had low transcriptional abundance than control samples (sufficient P supply), including BnaA01g26740D, BnaA08g26970D, BnaC08g13540D; and in the treated leaves, most of the BnaALMT genes were down-regulated, except BnaC07g34970D, BnaA07g02630D, BnaCnng04670D as compared to the control. Additionally, four BnaALMT genes (BnaC08g13480D, BnaA08g19430D, BnaA09g28580D and BnaC03g31660D) that displayed quite a similar expression were all up-regulated in roots of the cultivar “Zhongshuang11” at both sufficient and deficient P supplies. Twenty-two BnaALMT genes were selected for qRT-PCR assay, and the results verified that the expression pattern of them was in compliance with the RNA sequence data in Figure 8. These results indicated that the BnaALMT family is possibly involved in P starvation responses.

3. Discussion

3.1. Phylogenetic Tree of BnaALMTs

ALMT plays a crucial role in the adaptation under acidic soil conditions [10]. Systematic phylogenic analysis shows that the ALMT family present in higher plants can already be divided into five clades [17,27]. To our knowledge, there is not any report in the literature describing BnaALMT gene family lineage and their gene functions in detail. Genome resequencing offers an efficient means of defining a significant number of variations in AtALMTs and BnaALMT genes. A total of 39 BnaALMT genes in the B. napus genome were identified in this study (Figure 1). Of them, 75% had high similarity homologous pairs (Figure 1). These BnaALMT genes were classifiable into five clusters according to the phylogenetic tree. Cluster 5 was the largest cluster with 13 members, followed by Cluster 1 of nine members, Cluster 2 and Cluster 3 of seven, while Cluster 4 was the smallest and comprised only three. Based on the protein sequence analysis of BnaALMTs and AtALMTs, we analyzed the phylogenetic diversity among them and found that the proteins were subdivided into 5 separate classes (Figure 2). The BnaALMT genes were highly variable and had re-arranged with their evolutionary patterns from AtALMTs. Based on their genome variation, the two species had lost their portions of their protein sequences during evolution, which suggests that certain of the genes of BnaALMT may be evolutionarily similar, but they have missed protein sequences that might have evolved new genes for a specific function or division of the labour (Figure 2). The current reference genome was given as an incomplete assembly and might not cover 100% of the genes of B. napus. Darmor-bzh’s reference genome only occupies approximately 79% of the genome of 1130 Mb [28]. We found that some known genes, including BnaA07g02630D, BnaC02g32510D, BnaC02g32490D, BnaC08g13490D, BnaC08g13500D and BnaC08g15180D in Figure 2 were possibly not fully assembled and annotated. If B. napus provide a high-quality registry genome, genes with missing sequences or inappropriate assembly can be reviewed and corrected. Moreover, it can be overlooked that modern reference genomes are likely to contain additional BnaALMT family members that could miss a partial sequence during evolution, or that an incomplete assembly of the existing reference genomes for BnaALMT genes is made available.

3.2. Protein Structure of BnaALMTs

The ALMTs’ protein structures found to date have similar characteristics: five to seven domains in the n-terminal region and a long C-terminus, with or without the whole protein up to 50% [15,18,19]. A feature structure study to describe changes in ALMT functions with structural changes, including protein truncation, domain transfers and one-point mutations, will provide insight into the functional position of the n and C-terminal domains [29]. β-strands paired to form small sheets of ß-sheet share often observed at sequence-specific DNA interfaces, where β-sheets lie flat inside the main groove and lateral chains connect with functional groupings on the edges of the adjacent base pairs on the exposed surface of the sheet [30]. Interestingly, our results of lineage analysis of the ALMT family showed only minor improvement on the inclusion of evolutionary information from multiple alignments (Figure S1), indicating that the sequence of evolutionarily related β-strands provides little additional information to distinguish edge and central strand. β-strands paired were formed with AtALMTs in sequence alignments of BnaALMT genes, and AtALMT-6,-7,-10,-11,-12,-13 and AtALMT-14 homologous sequence-specificity consists of β-strands (Figure S1). We analyzed the secondary structures of BnaALMT family genes used in our phylogenetic analysis to see which of the secondary structures among the same clade members were conserved or diverged over time. The BnaALMT genes possessing diverged structure might have evolved from their homologous to perform varying functions as the secondary structures were highly related to the functions (Figure S1). The higher-order protein structures of the BnaALMT genes with AtATLMTs (Figure S1) should be investigated for a more detailed study. Conserved sequence WEP was reported by different studies [15,17,18,31], previously. A study demonstrated that three conserved residues in TaALMT1 including E274, D275 and E284 (residue of WEP) are highly conserved throughout the entire ALMT family, both Al sensitive and insensitive ALMTs [15]. The mutation studies provide evidence that these residues including E284 of WEP are not involved directly in Al response but rather the change in these residues brings conformational changes to the tertiary structure of the protein and hence it causes a change in protein structure. Another study also reported that the residue E284 is part of a WEP fingerprint motif (Trp-Glu-Pro) which is conserved in all ALMTs [17] rather than targeting specific residues to investigate the structure-function of ALMTs [18]. In our study, we found that WEP is not conserved in all of the proteins of the ALMT family. It was missing in some genes and the reason is clear that those genes have either lost a part of the functional gene or those genes have split into two functional genes. Interestingly, the BnaC08g15180D gene was lost in motif function analysis. WEP had also mutated into WCR in only one gene of the BnaALMTs family. Looking into the functional characterization of those mutated genes in B. napus will also shed a light on the function of WEP. The function of WEP as a whole will probably be different from the function of E284 alone but the claim needs to be proved through experimental studies. The whole sequence of WEP needs to be mutated to get a clear picture of WEP rather than the function of E284.

3.3. Expansion of the ALMT Family in Brassica napus

Genome duplication was reported as a major factor in the growth of eukaryotic plants and animals [32]. The primary causes of gene duplication are often known to be whole-genome duplication [33]. In the B. napus ALMT gene evolutionary relationship classification two Arabidopsis thaliana members, ALMT-11 and ALMT-12 were found evolutionary parallel to each other in a tree (Figure 1) and might have arisen by gene duplication. Gene duplication is known to be one of the key drivers of genomic and genetic evolution. Thirty-nine BnaALMT genes (87.8%) were predicted to have syntenic connections in the B. napus genome with BoALMTs (30 genes) and BrALMTs (18 genes) in the current study. BnaALMT genes in A and C sub-genomes of B. napus are closely related to ALMT genes in the A sub-genome of B. rapa and C sub-genome of B. oleracea, respectively (Figure 4 and Figure 5). These findings indicated that the expansion of the ALMT family in B. napus was mainly caused by allotetraploids (Figure 5). Additionally, there were 129 segmental duplication occurrences of 25 of the 39 BnaALMT genes, while only nine tandem duplication occurrences were found (Figure 4). Brassica species, unlike the A. thaliana, experienced an extra-genomic tripliment, which contributed to the gene production and the diversification of Brassica plants [28]. In principle, therefore, three orthologs in B. rapa and B. oleracea should equate to one Arabidopsis gene, while B. napus should produce six syntenic copies in each Arabidopsis gene as it has been derived from the recent hybridization between B. rapa and B. oleracea [28]. In the present research, expansion of the BnaALMT genes in Arabidopsis resulted in the genes in B. napus more than two times and in B. rapa and B. oleracea one to two times more genes (Figure 5). A surprisingly significant number of family members have suggested that substantial replications, which also happened during development, have largely enlarged and rearranged the genome [34]. Polyploidization of genomes usually is followed by mass rearrangements of chromosomes [35]. ALMT genes were distributed in B. napus across 15 chromosomes, although the dispersion varied from B. napus to B. rapa sub-genome A to B. napus, to the C sub-genome of B. napus to the B. oleracea sub-genome (Figure 5) that indicates that during allopolyploidization and domestication large diversification and chromosomal rearrangements occurred.

3.4. Expression Profile of BnaALMT Genes in Response to P Deficiency

The low P availability in many soils is a widespread adversity that often restricts plant growth and development because phosphates are strongly fixed in sparingly soluble complexes [36]. A possible mechanism for enhancing the use of sparsely soluble P forms is the secretion of malate in plants by the Al-activated malate transporter (ALMT) gene family. In this study, thirty-nine members of the BnaALMT genes family have various expressions in the different tissues (seed, silique, flower, root, stem and leaf) of the B. napus cultivar “Zhongshuang 11” (Figure 6). Of them, 18 BnaALMTs were mainly expressed in roots; while 11 were more leaf expressed than any of other tissues (Figure 6).
Nearly half of the BnaALMT members were up-regulated in the roots with a few (BnaCnng04670D, BnaA07g02630D, BnaC07g34970D) in leaves by P-deprivation, although four (BnaC08g13480D, BnaA08g19430D, BnaA09g28580D, BnaC03g31660D) genes had shown similar expression levels in both P sufficient and deficient supplies. These observations indicated that different members of the ALMT family might perform different roles in plants in responding to P deficiency. The application of P in shallow lateral roots in a divided root system under Al-stress in hydroponics was observed to facilitate a malate exudation of genotypes of P-efficient soybean (glycine max), which was also related to superior Al-tolerance [37]. Twenty-six of 34 GmALMTs show up-regulated in root, leaf and flowers of soybean under phosphate starvation [1]. Pi starvation also greatly improved CsALMT1′s expression in Citrus sinensis [38]. Further analysis is required in B. napus cultivar “Zhongshuang 11” to investigate the role of the ALMT genes by producing their overexpression materials or Crispr-CAS9 mutants.

4. Materials and Methods

4.1. Materials

B. napus cultivars “Zhongsuang11” were used for this study. The seeds are provided by the Oil Crops Research Institute, Chinese Academy of Agriculture Science, Wuhan, China.

4.2. Identification and Extraction of ALMT Genes

There were 14 ALMTs in Arabidopsis and they were designated as from ALMT1 to ALMT14. The full-length genomic sequences, CDSs and protein sequences of BnaALMTs were retrieved from the B. napus genome database (http://www.genoscope.cns.fr/brassicanapus/; accessed on 11 April 2020) by BLAST using AtALMTs. The homologous genes of the entire family of ALMT genes were used to confirm that all the genes belonged to the family of ALMT through B. napus cultivar “Zhongshuang11” [23].

4.3. Multiple Alignments, Phylogenetic and Bioinformatics Analysis

Multiple sequence alignments of the ALMT protein sequences in Arabidopsis and B. napus were performed using ClustalW. All the BnaALMT protein sequences along with AtALMTs were subjected to Geneious software for phylogenetic tree, evolutionary relationship and gene structure analysis, and all those sequences that clad with AtALMTs were considered as BnaALMTs. The Phylogenetic tree and its secondary structures were constructed using MAFFT alignment and FastTree plugins in Geneious 11. For the construction of the tree, ALMT gene variations and secondary structures were used to retrieve the related sequences from NCBI. Duplicates and poorly aligned sequences were removed before constructing these figures. Gene duplication data were retrieved from Plaza 4.0 (https://bioinformatics.psb.ugent.be/plaza/; accessed on 15 April 2020), and conserved motifs were identified through MEME online suit (http://meme-suite.org/tools/meme/; accessed on 15 April 2020) with the default setting.

4.4. Chromosomal Location and Gene Duplication Analysis

Physical location information of the BnaALMT genes was retrieved from the CNS-Genoscope genomic database (http://www.genoscope.cns.fr/brassicanapus/; accessed on 16 April 2020) and was mapped to B. napus chromosomes using Circos [39]. Gene duplication events and collinearity relationships were analyzed using the Multiple Collinearity Scan toolkit (MCScanX, http://chibba.pgml.uga.edu/mcscan2/; accessed on 15 April 2020) [40]. The chromosome location information of the ALMT genes in Brassica species (B. napus, Brassica rapa and Brassica oleracea) were retrieved from the (http://www.genoscope.cns.fr/brassicanapus/; accessed on 18 April 2020) database and Ensemble (http://plants.ensembl.org; accessed on 18 April 2020). The MapInspect software was used to draw the gene chromosome location diagrams.

4.5. Transcriptional Profile of BnaALMT Family Genes

Tissue-specific expression data of the selected 39 BnaALMT genes were downloaded from National Genomics Data Centre (CRA001775) available online (http:bigd.big.ac.cn/; accessed on 19 May 2020). Gene expression levels were determined according to a previous study by [23]. The data were subjected to the “expression-based heat maps” tools of heat mapper, an online tool for converting numerical data into heat maps (http://www2.heatmapper.ca/; accessed on 23 May 2020). Heat maps were built using the row as scale type, clustering method as average linkage and distance measurement method as Euclidean.
The seedlings of B. napus cultivar “Zhongshuang11” were planted in Hoagland solution in an illuminated growth room (300–320 μmol m−2 s−2; 24 ℃ daytime/22 ℃ night; 16 h light/8 h dark) in three repeats for 14 days during June, 2020. The solution contained Ca (NO3)2 5.0 mM, KNO3 5.0 mM, KH2PO4 0.25 mM, MgSO4·7H2O 2.0 mM, H3BO3 46 µM, MnCl2 9.0 µM, CuCl2 0.3 µM, ZnCl2 0.8 µM, NaMoO4 0.32 µM and EDTA-Fe 50 µM. For P deficiency treatment, KH2PO4 was replaced by K2SO4. The q-PCR was performed for selected twenty-two genes to further validate RNA-seq data using LioBIO-RAD CFX96 qPCR detection system. The RNA-seq sequencing libraries were subsequently sequenced using Illumina HiSeq 2000 platform (Illumina, Salt Lake City, UT, USA) and the transcript abundance (FPKM value) of each gene was calculated based on the length of the gene and the reads mapped to that gene [41]. The FPKMs values of genes were used to produce a heat map using the program (http://www2.heatmapper.ca/; accessed on 28 May 2020). The roots (R) and leaves (L) of B. napus cultivar “Zhongshuang11” were individually harvested, and each sample included three independent biological replicates. The frozen samples were taken from −80 °C and were crushed into a fine powder. The total RNA of each sample was extracted using an RNA extraction kit (BioTeke, Beijing, China) according to the manufacturer’s recommendations. RNA set was extracted using Trizol reagent (Tiangen Biotech (Beijing) Co., Ltd., Beijing, China) and then treated with gDNA digester (Tianjin Novogene Bioinformatics Technology Co., Ltd. www.novogene.com; accessed on 19 June 2020) to remove the leftover genomic DNA. First-strand cDNA was synthesized from the total RNA using HonorTM II 1st Strand cDNA Synthesis SuperMix for qPCR (gDNA digester plus) kit provided by Novogene. q-PCR was performed using Unique AptamerTM qPCR SYBR® Green Master Mix (No Rox) provided by Novogene (Tianjin Novogene Bioinformatics Technology Co., Ltd. www.novogene.com; accessed on 19 June 2020). The melt–curve analyses were performed using the conditions previously used. The obtained ~6 Gb Illumina cleaned reads were aligned with reference Darmor-bzh genome [28]. Actin was used as the internal reference gene [42]. Specific primers were used for determining the expression level of the selected BnaALMTs in time series samples of treated plants (Table S1).

4.6. Statistical Analysis of Data

Statistics were performed by using Student’s t-test. Significance of differences was defined as * p < 0.05 and ** p < 0.01.

5. Conclusions

In summary, a total of thirty-nine BnaALMT genes were identified and were clustered into five branches in the phylogenetic tree based on protein sequences. The BnaALMT gene family shared high similarity with their Arabidopsis orthologues, which suggested that the BnaALMT genes family were evolutionary, conserved and each gene within the subfamily may share high similarity in biochemical and biological functions with other genes of the same subfamily in Arabidopsis. The distribution of BnaALMT genes in A and C sub-genomes of Brassica species and their syntenic relationships suggested that whole-genome duplication (polyploidy) and segmentary duplication were the main factors to extend the ALMT family of B. napus. Nearly half of the BnaALMTs were up-regulated after P deprivation in the roots. Further studies on mechanisms underlying the genotypic differences in BnaALMTs expression will facilitate the breeding of B. napus varieties with improving P use efficiency.

Supplementary Materials

The following are available online at https://0-www-mdpi-com.brum.beds.ac.uk/article/10.3390/ijms22094625/s1, Figure S1: The evolutionary history of beta-strand. Table S1: Specific primers were used for determining the expression level of the selected BnaALMTs in time series samples of treated plants. Figure S2: Expression patterns of the up-regulated BnaALMTs at a P sufficient supply and a P deficiency supply by Hoagland’s solution. Table S2: Primer sequences used in the qPCR experiment.

Author Contributions

Conceptualization, L.S.; methodology, I.D.; software, I.D., I.U., W.W., H.Z.; validation, L.S., I.U. and I.D.; formal analysis, I.D., H.Z., W.W. and I.U.; investigation, I.D.; resources, L.S.; data curation, I.D. and L.S.; writing—original draft preparation, I.D. and L.S.; writing—review and editing, L.S and I.D.; visualization, L.S.; supervision, L.S..; project administration, L.S.; funding acquisition, L.S. All authors have read and agreed to the published version of the manuscript.

Funding

This work was supported by the National Nature Science Foundation of China (Grant No. 31972498) and the National Key R&D Program of China (Grant No. 2017YFD0200200). We also acknowledge the Applied Basic Research Fronts Program of Wuhan city (Grant No. 2018020401011302) and the Natural and Fundamental Research Funds for the Central Universities of China (Grant No. 2662019PY013).

Conflicts of Interest

The authors declare there is no conflict interest.

References

  1. Peng, W.; Wu, W.; Peng, J.; Li, J.; Lin, Y.; Wang, Y.; Tian, J.; Sun, L.; Liang, C.; Liao, H. Characterization of the soybean GmALMT family genes and the function of GmALMT5 in response to phosphate starvation. J. Integr. Plant Biol. 2018, 60, 216–231. [Google Scholar] [CrossRef] [Green Version]
  2. Rausch, C.; Bucher, M. Molecular mechanisms of phosphate transport in plants. Planta 2002, 216, 23–37. [Google Scholar] [CrossRef] [PubMed]
  3. Kochian, L.V. Rooting for more phosphorus. Nature 2012, 488, 466–467. [Google Scholar] [CrossRef] [PubMed]
  4. Zeng, H.; Wang, G.; Zhang, Y.; Hu, X.; Pi, E.; Zhu, Y.; Wang, H.; Du, L. Genome-wide identification of phosphate-deficiency-responsive genes in soybean roots by high-throughput sequencing. Plant Soil 2016, 398, 207–227. [Google Scholar] [CrossRef]
  5. Runge-Metzger, A. Closing the Cycle: Obstacles to Efficient P Management for Improved Global Food Security. SCOPE 54—Phosphorus in the Global Environment—Transfers, Cycles and Management. 1995. Available online: http://www.icsu-scope.org/downloadpubs/scope54/3runge.htm (accessed on 16 June 2010).
  6. Plaxton, W.; Lambers, H. Annual Plant Reviews, Phosphorus Metabolism in Plants; John Wiley & Sons: Hoboken, NJ, USA, 2015; Volume 48, ISBN 1118958853. [Google Scholar]
  7. Liang, C.; Wang, J.; Zhao, J.; Tian, J.; Liao, H. Control of phosphate homeostasis through gene regulation in crops. Curr. Opin. Plant Biol. 2014, 21, 59–66. [Google Scholar] [CrossRef] [PubMed]
  8. Zhang, Z.; Liao, H.; Lucas, W.J. Molecular mechanisms underlying phosphate sensing, signaling, and adaptation in plants. J. Integr. Plant Biol. 2014, 56, 192–220. [Google Scholar] [CrossRef]
  9. Wang, W.; Ding, G.-D.; White, P.J.; Wang, X.-H.; Jin, K.-M.; Xu, F.-S.; Shi, L. Mapping and cloning of quantitative trait loci for phosphorus efficiency in crops: Opportunities and challenges. Plant Soil 2019, 439, 91–112. [Google Scholar] [CrossRef]
  10. Sharma, T.; Dreyer, I.; Kochian, L.; Piñeros, M.A. The ALMT family of organic acid transporters in plants and their involvement in detoxification and nutrient security. Front. Plant Sci. 2016, 7, 1488. [Google Scholar] [CrossRef] [Green Version]
  11. Ma, B.; Liao, L.; Zheng, H.; Chen, J.; Wu, B.; Ogutu, C.; Li, S.; Korban, S.S.; Han, Y. Genes encoding aluminum-activated malate transporter II and their association with fruit acidity in apple. Plant Genome 2015, 8. [Google Scholar] [CrossRef] [Green Version]
  12. Sasaki, T.; Yamamoto, Y.; Ezaki, B.; Katsuhara, M.; Ahn, S.J.; Ryan, P.R.; Delhaize, E.; Matsumoto, H. A wheat gene encoding an aluminum-activated malate transporter. Plant J. 2004, 37, 645–653. [Google Scholar] [CrossRef]
  13. Kobayashi, Y.; Kobayashi, Y.; Sugimoto, M.; Lakshmanan, V.; Iuchi, S.; Kobayashi, M.; Bais, H.P.; Koyama, H. Characterization of the complex regulation of AtALMT1 expression in response to phytohormones and other inducers. Plant Physiol. 2013, 162, 732–740. [Google Scholar] [CrossRef] [PubMed] [Green Version]
  14. Sukweenadhi, J.; Kim, Y.-J.; Choi, E.-S.; Koh, S.-C.; Lee, S.-W.; Kim, Y.-J.; Yang, D.C. Paenibacillus yonginensis DCY84T induces changes in Arabidopsis thaliana gene expression against aluminum, drought, and salt stress. Microbiol. Res. 2015, 172, 7–15. [Google Scholar] [CrossRef] [PubMed]
  15. Ligaba, A.; Dreyer, I.; Margaryan, A.; Schneider, D.J.; Kochian, L.; Piñeros, M. Functional, structural and phylogenetic analysis of domains underlying the Al sensitivity of the aluminum-activated malate/anion transporter, TaALMT1. Plant J. 2013, 76, 766–780. [Google Scholar] [CrossRef] [PubMed] [Green Version]
  16. Piñeros, M.A.; Cançado, G.M.A.; Maron, L.G.; Lyi, S.M.; Menossi, M.; Kochian, L. V Not all ALMT1-type transporters mediate aluminum-activated organic acid responses: The case of ZmALMT1—An anion-selective transporter. Plant J. 2008, 53, 352–367. [Google Scholar] [CrossRef] [PubMed]
  17. Dreyer, I.; Gomez-Porras, J.L.; Riaño Pachón, D.M.; Hedrich, R.; Geiger, D. Molecular evolution of slow and quick anion channels (SLACs and QUACs/ALMTs). Front. Plant. Sci. 2012, 3, 263. [Google Scholar] [CrossRef] [Green Version]
  18. Furuichi, T.; Sasaki, T.; Tsuchiya, Y.; Ryan, P.R.; Delhaize, E.; Yamamoto, Y. An extracellular hydrophilic carboxy-terminal domain regulates the activity of TaALMT1, the aluminum-activated malate transport protein of wheat. Plant J. 2010, 64, 47–55. [Google Scholar] [CrossRef] [PubMed]
  19. Motoda, H.; Sasaki, T.; Kano, Y.; Ryan, P.R.; Delhaize, E.; Matsumoto, H.; Yamamoto, Y. The membrane topology of ALMT1, an aluminum-activated malate transport protein in wheat (Triticum aestivum). Plant Signal. Behav. 2007, 2, 467–472. [Google Scholar] [CrossRef] [Green Version]
  20. Ding, G.; Zhao, Z.; Liao, Y.; Hu, Y.; Shi, L.; Long, Y.; Xu, F. Quantitative trait loci for seed yield and yield-related traits, and their responses to reduced phosphorus supply in Brassica napus. Ann. Bot. 2012, 109, 747–759. [Google Scholar] [CrossRef] [Green Version]
  21. Zhang, H.; Huang, Y.; Ye, X.; Xu, F. Genotypic variation in phosphorus acquisition from sparingly soluble P sources is related to root morphology and root exudates in Brassica napus. Sci. China Life Sci. 2011, 54, 1134–1142. [Google Scholar] [CrossRef] [Green Version]
  22. Wang, Y.-L.; Almvik, M.; Clarke, N.; Eich-Greatorex, S.; Øgaard, A.F.; Krogstad, T.; Lambers, H.; Clarke, J.L. Contrasting responses of root morphology and root-exuded organic acids to low phosphorus availability in three important food crops with divergent root traits. AoB Plants 2015, 7, plv097. [Google Scholar] [CrossRef]
  23. Iqbal, S.; Ali, U.; Fadlalla, T.; Li, Q.; Liu, H.; Lu, S.; Guo, L. Genome wide characterization of phospholipase A & C families and pattern of lysolipids and diacylglycerol changes under abiotic stresses in Brassica napus L. Plant Physiol. Biochem. 2020, 147, 101–112. [Google Scholar]
  24. Cheng, F.; Wu, J.; Wang, X. Genome triplication drove the diversification of Brassica plants. Hortic. Res. 2014, 1, 14024. [Google Scholar] [CrossRef] [Green Version]
  25. Xu, Y.; Zhao, Q.; Mei, S.; Wang, J. Genomic and transcriptomic alterations following hybridisation and genome doubling in trigenomic allohexaploid Brassica carinata × Brassica rapa. Plant Biol. 2012, 14, 734–744. [Google Scholar] [CrossRef] [PubMed]
  26. Xie, T.; Chen, C.; Li, C.; Liu, J.; Liu, C.; He, Y. Genome-wide investigation of WRKY gene family in pineapple: Evolution and expression profiles during development and stress. BMC Genom. 2018, 19, 490. [Google Scholar] [CrossRef] [PubMed] [Green Version]
  27. Barbier-Brygoo, H.; De Angeli, A.; Filleur, S.; Frachisse, J.-M.; Gambale, F.; Thomine, S.; Wege, S. Anion channels/transporters in plants: From molecular bases to regulatory networks. Annu. Rev. Plant Biol. 2011, 62, 25–51. [Google Scholar] [CrossRef] [PubMed]
  28. Chalhoub, B.; Denoeud, F.; Liu, S.; Parkin, I.A.P.; Tang, H.; Wang, X.; Chiquet, J.; Belcram, H.; Tong, C.; Samans, B. Early allopolyploid evolution in the post-Neolithic Brassica napus oilseed genome. Science (80-) 2014, 345, 950–953. [Google Scholar] [CrossRef] [PubMed] [Green Version]
  29. Sasaki, T.; Tsuchiya, Y.; Ariyoshi, M.; Ryan, P.R.; Furuichi, T.; Yamamoto, Y. A domain-based approach for analyzing the function of aluminum-activated malate transporters from wheat (Triticum aestivum) and Arabidopsis thaliana in Xenopus oocytes. Plant Cell Physiol. 2014, 55, 2126–2138. [Google Scholar] [CrossRef] [Green Version]
  30. Rutherford, K.; Van Duyne, G.D. DNA Sequence Recognition by Proteins, 2nd ed.; Elsevier Inc.: Amsterdam, The Netherlands, 2013; Volume 1, ISBN 9780123786319. [Google Scholar]
  31. Eisenach, C.; Baetz, U.; Huck, N.V.; Zhang, J.; De Angeli, A.; Beckers, G.J.M.; Martinoia, E. ABA-induced stomatal closure involves ALMT4, a phosphorylation-dependent vacuolar anion channel of Arabidopsis. Plant Cell 2017, 29, 2552–2569. [Google Scholar] [CrossRef] [Green Version]
  32. Taylor, J.S.; Raes, J. Duplication and divergence: The evolution of new genes and old ideas. Annu. Rev. Genet. 2004, 38, 615–643. [Google Scholar] [CrossRef] [Green Version]
  33. Wendel, J.F. Genome evolution in polyploids. Plant Mol. Evol. 2000, 42, 225–249. [Google Scholar]
  34. Liu, F.; Chang, X.-J.; Ye, Y.; Xie, W.-B.; Wu, P.; Lian, X.-M. Comprehensive sequence and whole-life-cycle expression profile analysis of the phosphate transporter gene family in rice. Mol. Plant 2011, 4, 1105–1122. [Google Scholar] [CrossRef] [Green Version]
  35. Flagel, L.E.; Wendel, J.F. Gene duplication and evolutionary novelty in plants. New Phytol. 2009, 183, 557–564. [Google Scholar] [CrossRef]
  36. Vance, C.P.; Uhde-Stone, C.; Allan, D.L. Phosphorus acquisition and use: Critical adaptations by plants for securing a nonrenewable resource. New Phytol. 2003, 157, 423–447. [Google Scholar] [CrossRef] [PubMed] [Green Version]
  37. Liao, H.; Wan, H.; Shaff, J.; Wang, X.; Yan, X.; Kochian, L.V. Phosphorus and aluminum interactions in soybean in relation to aluminum tolerance. Exudation of specific organic acids from different regions of the intact root system. Plant Physiol. 2006, 141, 674–684. [Google Scholar] [CrossRef] [PubMed] [Green Version]
  38. Yang, L.-T.; Jiang, H.-X.; Qi, Y.-P.; Chen, L.-S. Differential expression of genes involved in alternative glycolytic pathways, phosphorus scavenging and recycling in response to aluminum and phosphorus interactions in Citrus roots. Mol. Biol. Rep. 2012, 39, 6353–6366. [Google Scholar] [CrossRef] [PubMed]
  39. Krzywinski, M.; Schein, J.; Birol, I.; Connors, J.; Gascoyne, R.; Horsman, D.; Jones, S.J.; Marra, M.A. Circos: An information aesthetic for comparative genomics. Genome Res. 2009, 19, 1639–1645. [Google Scholar] [CrossRef] [PubMed] [Green Version]
  40. Wang, Y.; Tang, H.; DeBarry, J.D.; Tan, X.; Li, J.; Wang, X.; Lee, T.; Jin, H.; Marler, B.; Guo, H. MCScanX: A toolkit for detection and evolutionary analysis of gene synteny and collinearity. Nucleic Acids Res. 2012, 40, e49. [Google Scholar] [CrossRef] [PubMed] [Green Version]
  41. Li, Y.; Wang, X.; Zhang, H.; Wang, S.; Ye, X.; Shi, L.; Xu, F.; Ding, G. Molecular identification of the phosphate transporter family 1 (PHT1) genes and their expression profiles in response to phosphorus deprivation and other abiotic stresses in Brassica napus. PLoS ONE 2019, 14, e0220374. [Google Scholar] [CrossRef] [Green Version]
  42. Zhang, Q.; Chen, H.; He, M.; Zhao, Z.; Cai, H.; Ding, G.; Shi, L.; Xu, F. The boron transporter BnaC4. BOR1; 1c is critical for inflorescence development and fertility under boron limitation in Brassica napus. Plant Cell Environ. 2017, 40, 1819–1833. [Google Scholar] [CrossRef]
Figure 1. Phylogenetic tree of aluminum malate transporter (ALMT) genes family in Brassica napus and Arabidopsis thaliana. The phylogenetic tree was constructed by Genius software. The tree consists of five clades, different colors of the clades in the tree represent homologous genes of Brassica napus and Arabidopsis thaliana. The analysis involved 53 nucleotide sequences including 39 from Brassica napus and fourteen from Arabidopsis.
Ijms 22 04625 g001
Figure 2. The variation distribution of ALMT genes in the phylogenetic relationship was constructed by Genius 11. Sequence similarities among the ALMT genes family of the Brassica napus and Arabidopsis thaliana were aligned using MUSCLE (a new computer program for creating multiple alignments of protein sequences) alignment values. Brassica napus and Arabidopsis thaliana ALMTs were divided into five groups based on FastTree. Black boxes indicate sequence similarities and white boxes represent dissimilarities among the ALMT genes family. The length of the scale represents base pairs (bp) length which is placed at the top.
Ijms 22 04625 g002
Figure 3. Distribution of conserved motifs in BnaALMTs. Conserved motifs of BnaALMTs were analyzed by using MEME-suite Web serve using the protein sequences of thirty-nine BnaALMTs. Six conserved motifs were identified, and different motifs were distinguished by different colors. (a) The conserved motifs among BnaALMT proteins. The least motif of six contains WEP (Trp. Glu. Pro.) conserved sequences, which are conserved in all BnaALMT genes except one, and one gene is completely lost during sequence analysis. (b). The distribution of motifs along with the protein sequences. Thirty-one BnaALMT genes share all the six motifs, while few genes have lost the other domains, respectively. Only two genes have retained the single motif but have lost the other domains completely during evolution.
Ijms 22 04625 g003
Figure 4. Schematic representations for the chromosomal distribution and interchromosomal relationships of Brassica napus ALMT genes. Grey lines indicate all syntenic blocks in the Brassica napus genome, and the blue lines indicate syntenic ALMT gene pairs. The chromosome numbers are indicated at the top of each chromosome. R, random.
Ijms 22 04625 g004
Figure 5. Genomic distribution of ALMT genes in Brassica napus, Brassica rapa and B. oleracea chromosomes. The Brassica species (Brassica napus, Brassica rapa and B. oleracea) ALMT’s were plotted based on the location of genes, length of chromosomes, and position of centromeres. Each chromosome indicated the gene density by the frequency per 1 Mb.
Ijms 22 04625 g005
Figure 6. Transcript abundance of BnaALMT genes in various tissues of Brassica napus. The heatmap was constructed by taking Log2 values of the transcript per million fragments mapped (FPKM) generated from RNA-seq data. The color scale (blue-yellow) of the heatmap indicates expression values, respectively. While the black rows show that the expression of the genes was not detected in the RNAseq data. The cluster tree of the BnaALMT genes based on the expression level is shown on the left and top.
Ijms 22 04625 g006
Figure 7. Expression profiles of the BnaALMT family genes in the leaves and roots of Brassica napus at a sufficient P supply (control) and a deficient P supply (treated) in Hoagland’s solution. The color bar represents log2 expression levels (FPKM, per kilobase of exon per million fragments mapped) of each gene. Data represent the average of three biological replicates. The color scale (blue-red) of the heatmap indicates expression values, and the dark black line represents that BnaALMT genes were not detected by their transcript abundance, respectively. The cluster tree of the BnaALMT genes based on the expression level is shown on the left and top.
Ijms 22 04625 g007
Figure 8. Expression patterns of the up-regulated BnaALMTs at a P sufficient supply and a P deficiency supply in Hoagland’s solution. Three biological replicates were employed in this study. The relative expression of BnaALMTs in the Brassica napus root and leaf under contrasting P supplies was quantified by q-PCR; The bars represent q-PCR data while the line represents RNA-seq data. Student T-test was applied to treated and non-treated tissues (leaves and roots) to find out the statistical differences caused by phosphorous application in the tissues. ns= non-significant, * = significant at 0.05, ** = significant at 0.01 and *** = significant at 0.001. Three biological replicates. All primer sequences are listed in supplementary Table S1.
Ijms 22 04625 g008
Publisher’s Note: MDPI stays neutral with regard to jurisdictional claims in published maps and institutional affiliations.

