
Seasonal Regulation of Metabolism: The Effect of Wintertime Fasting and Autumnal Fattening on Key Central Regulators of Metabolism and the Metabolic Profile of the Raccoon Dog (Nyctereutes Procyonoides)

 ,
,
Abstract
:1. Introduction
2. Results
2.1. Body Mass
2.2. Hypothalamic Peptides and Receptors
2.3. Plasma Hormones and Inflammatory Markers
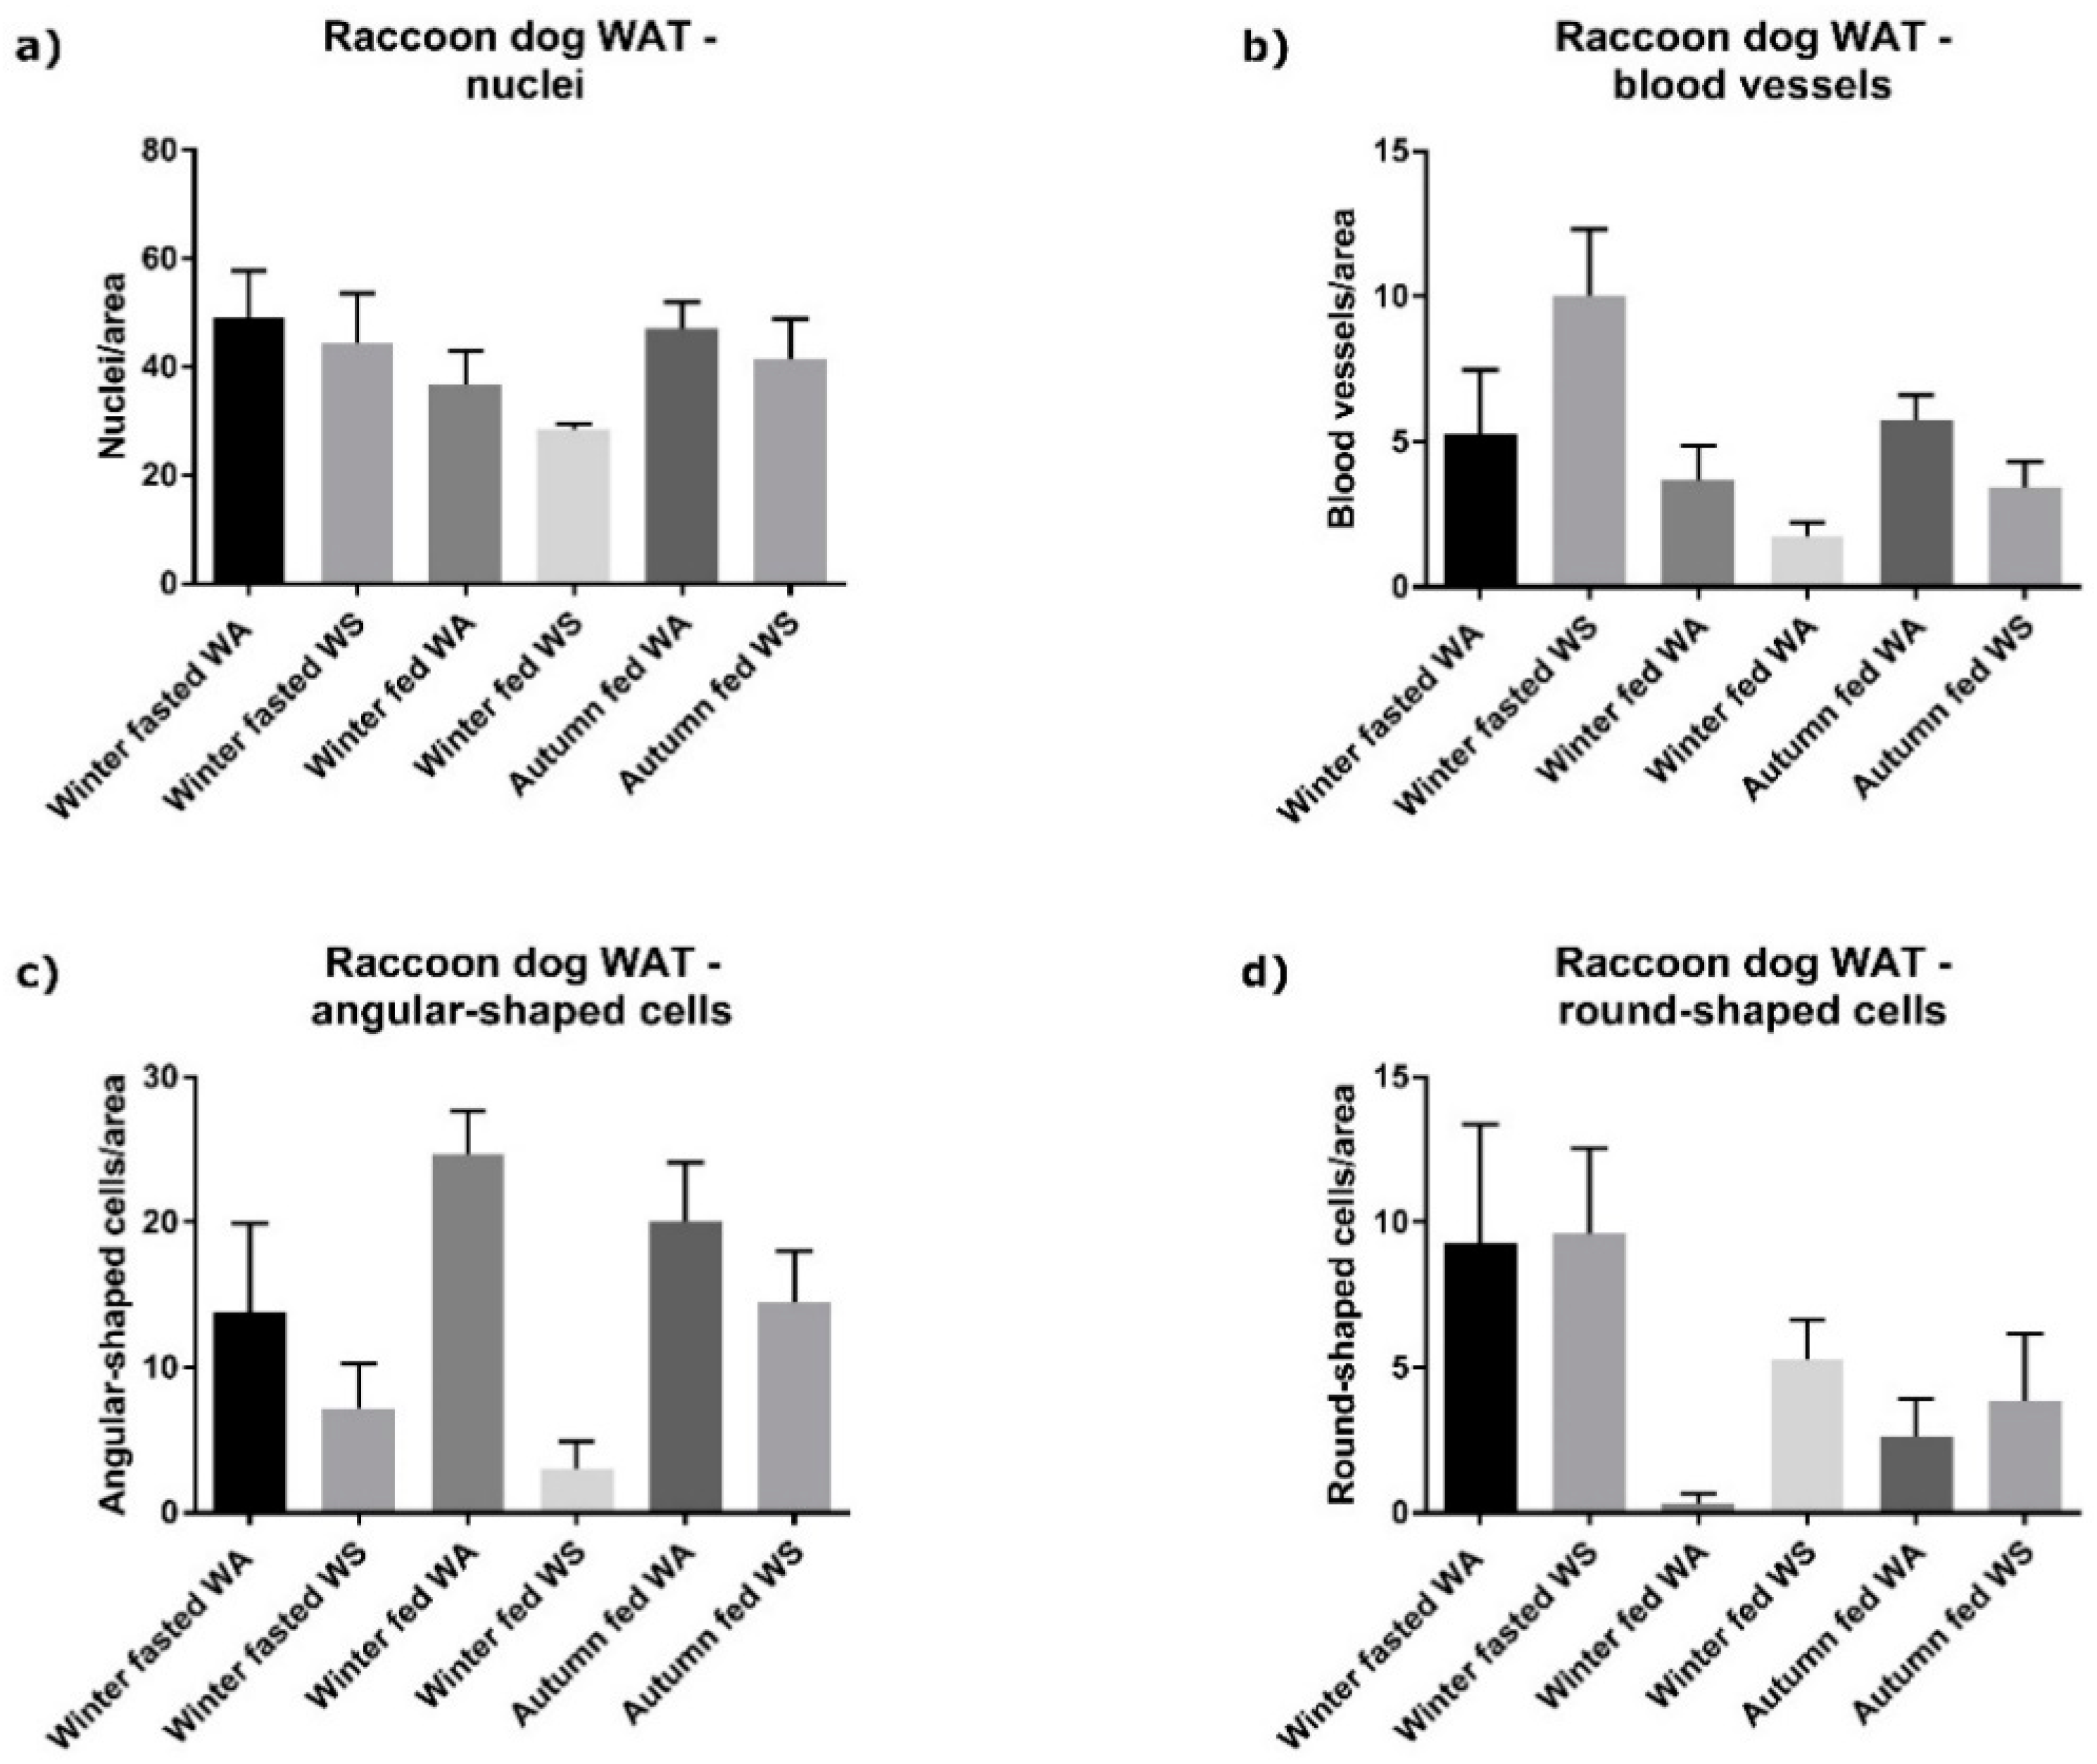
Histopathology of Adipose Tissue Vascularization and Inflammatory Structures
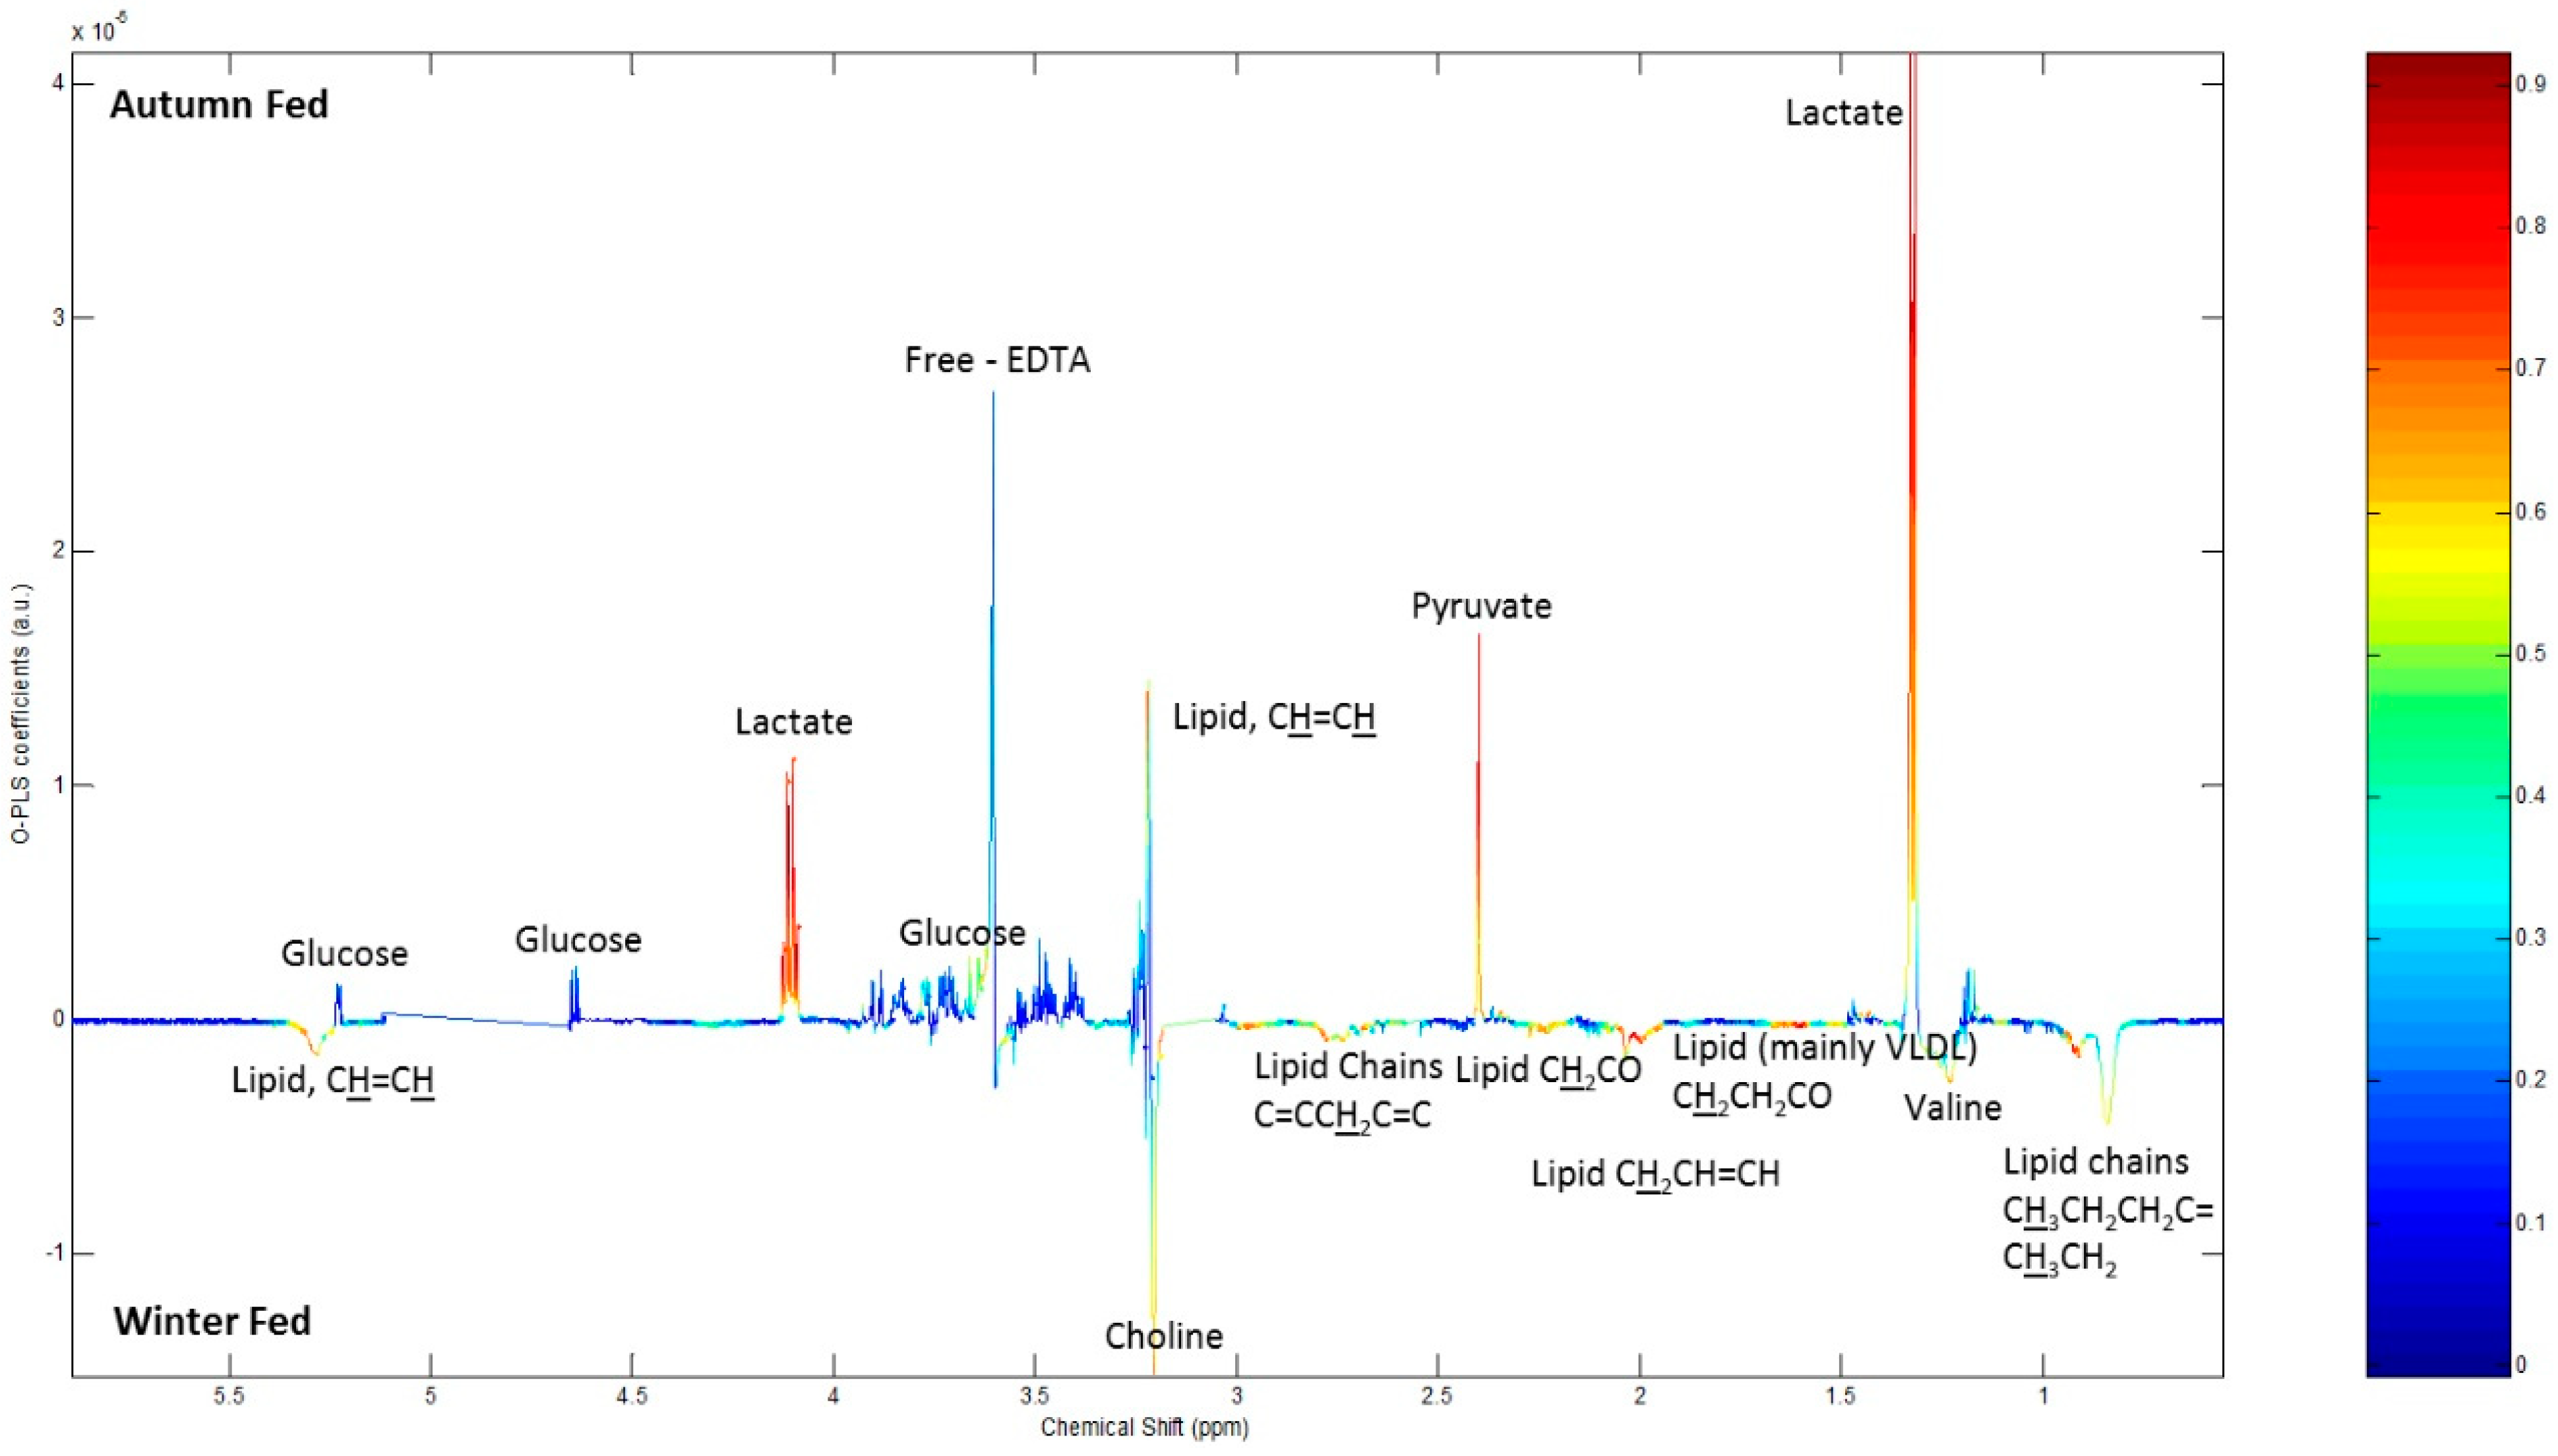
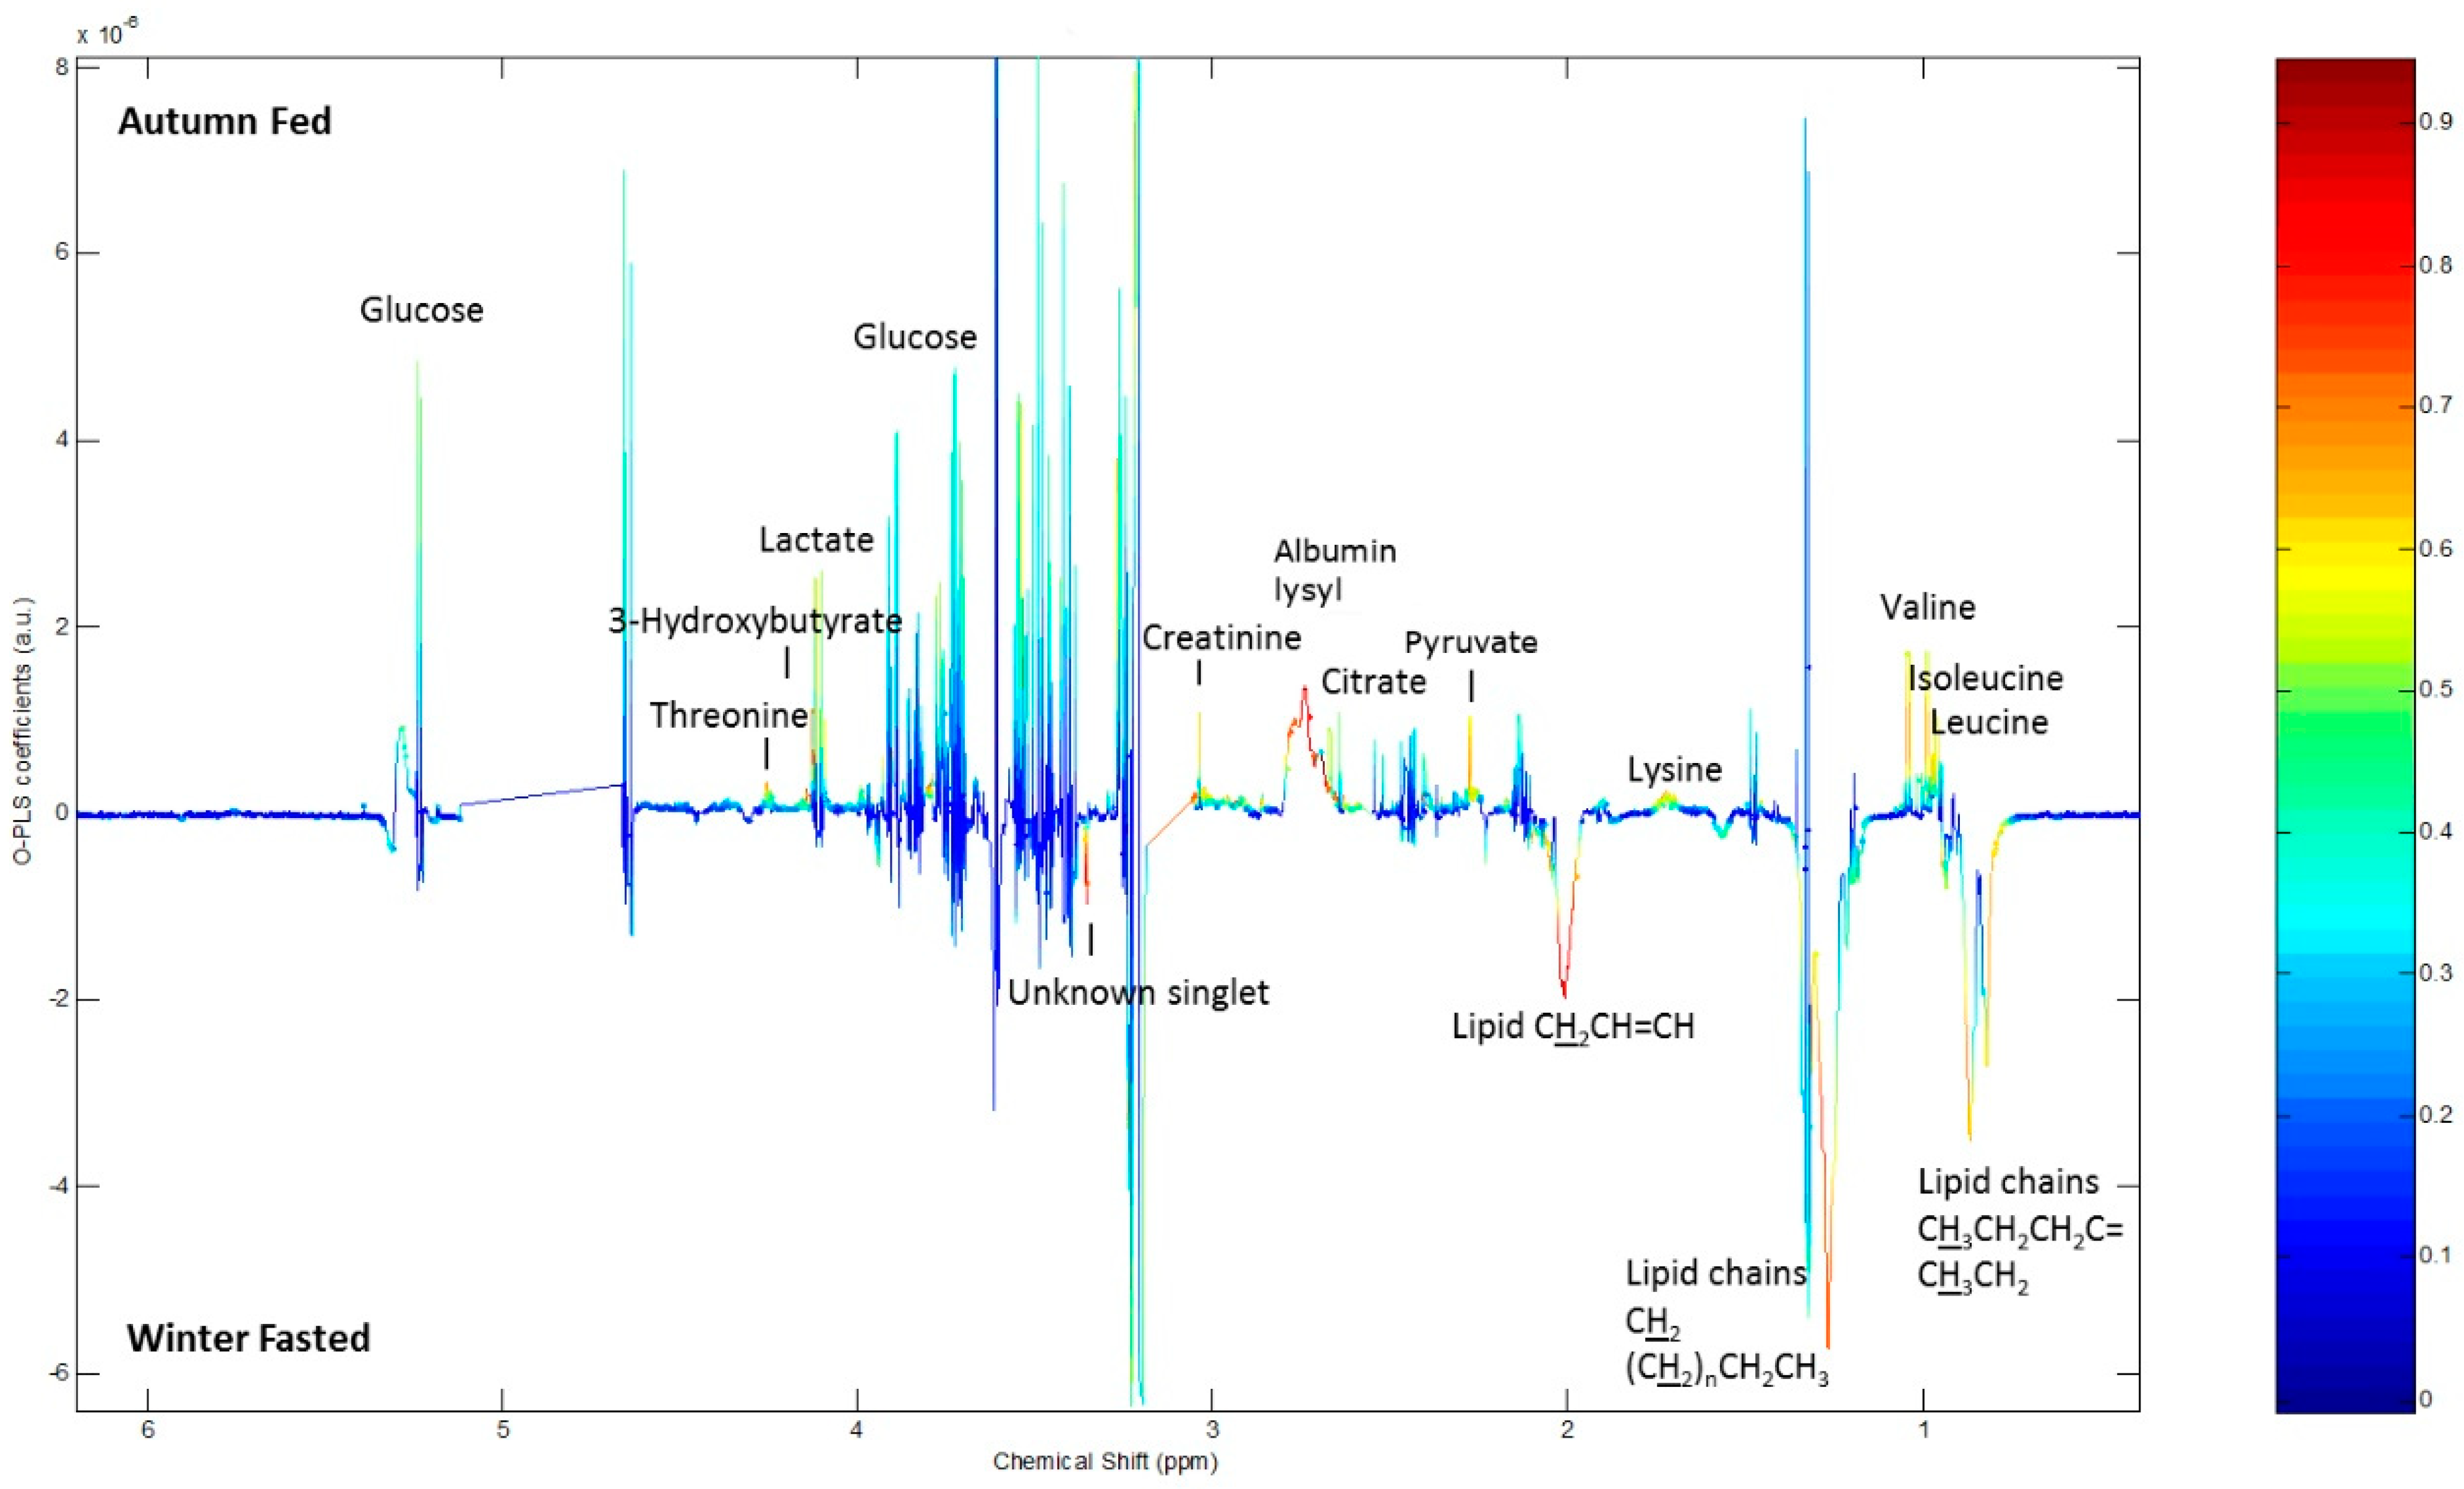
2.4. 1H NMR Analysis
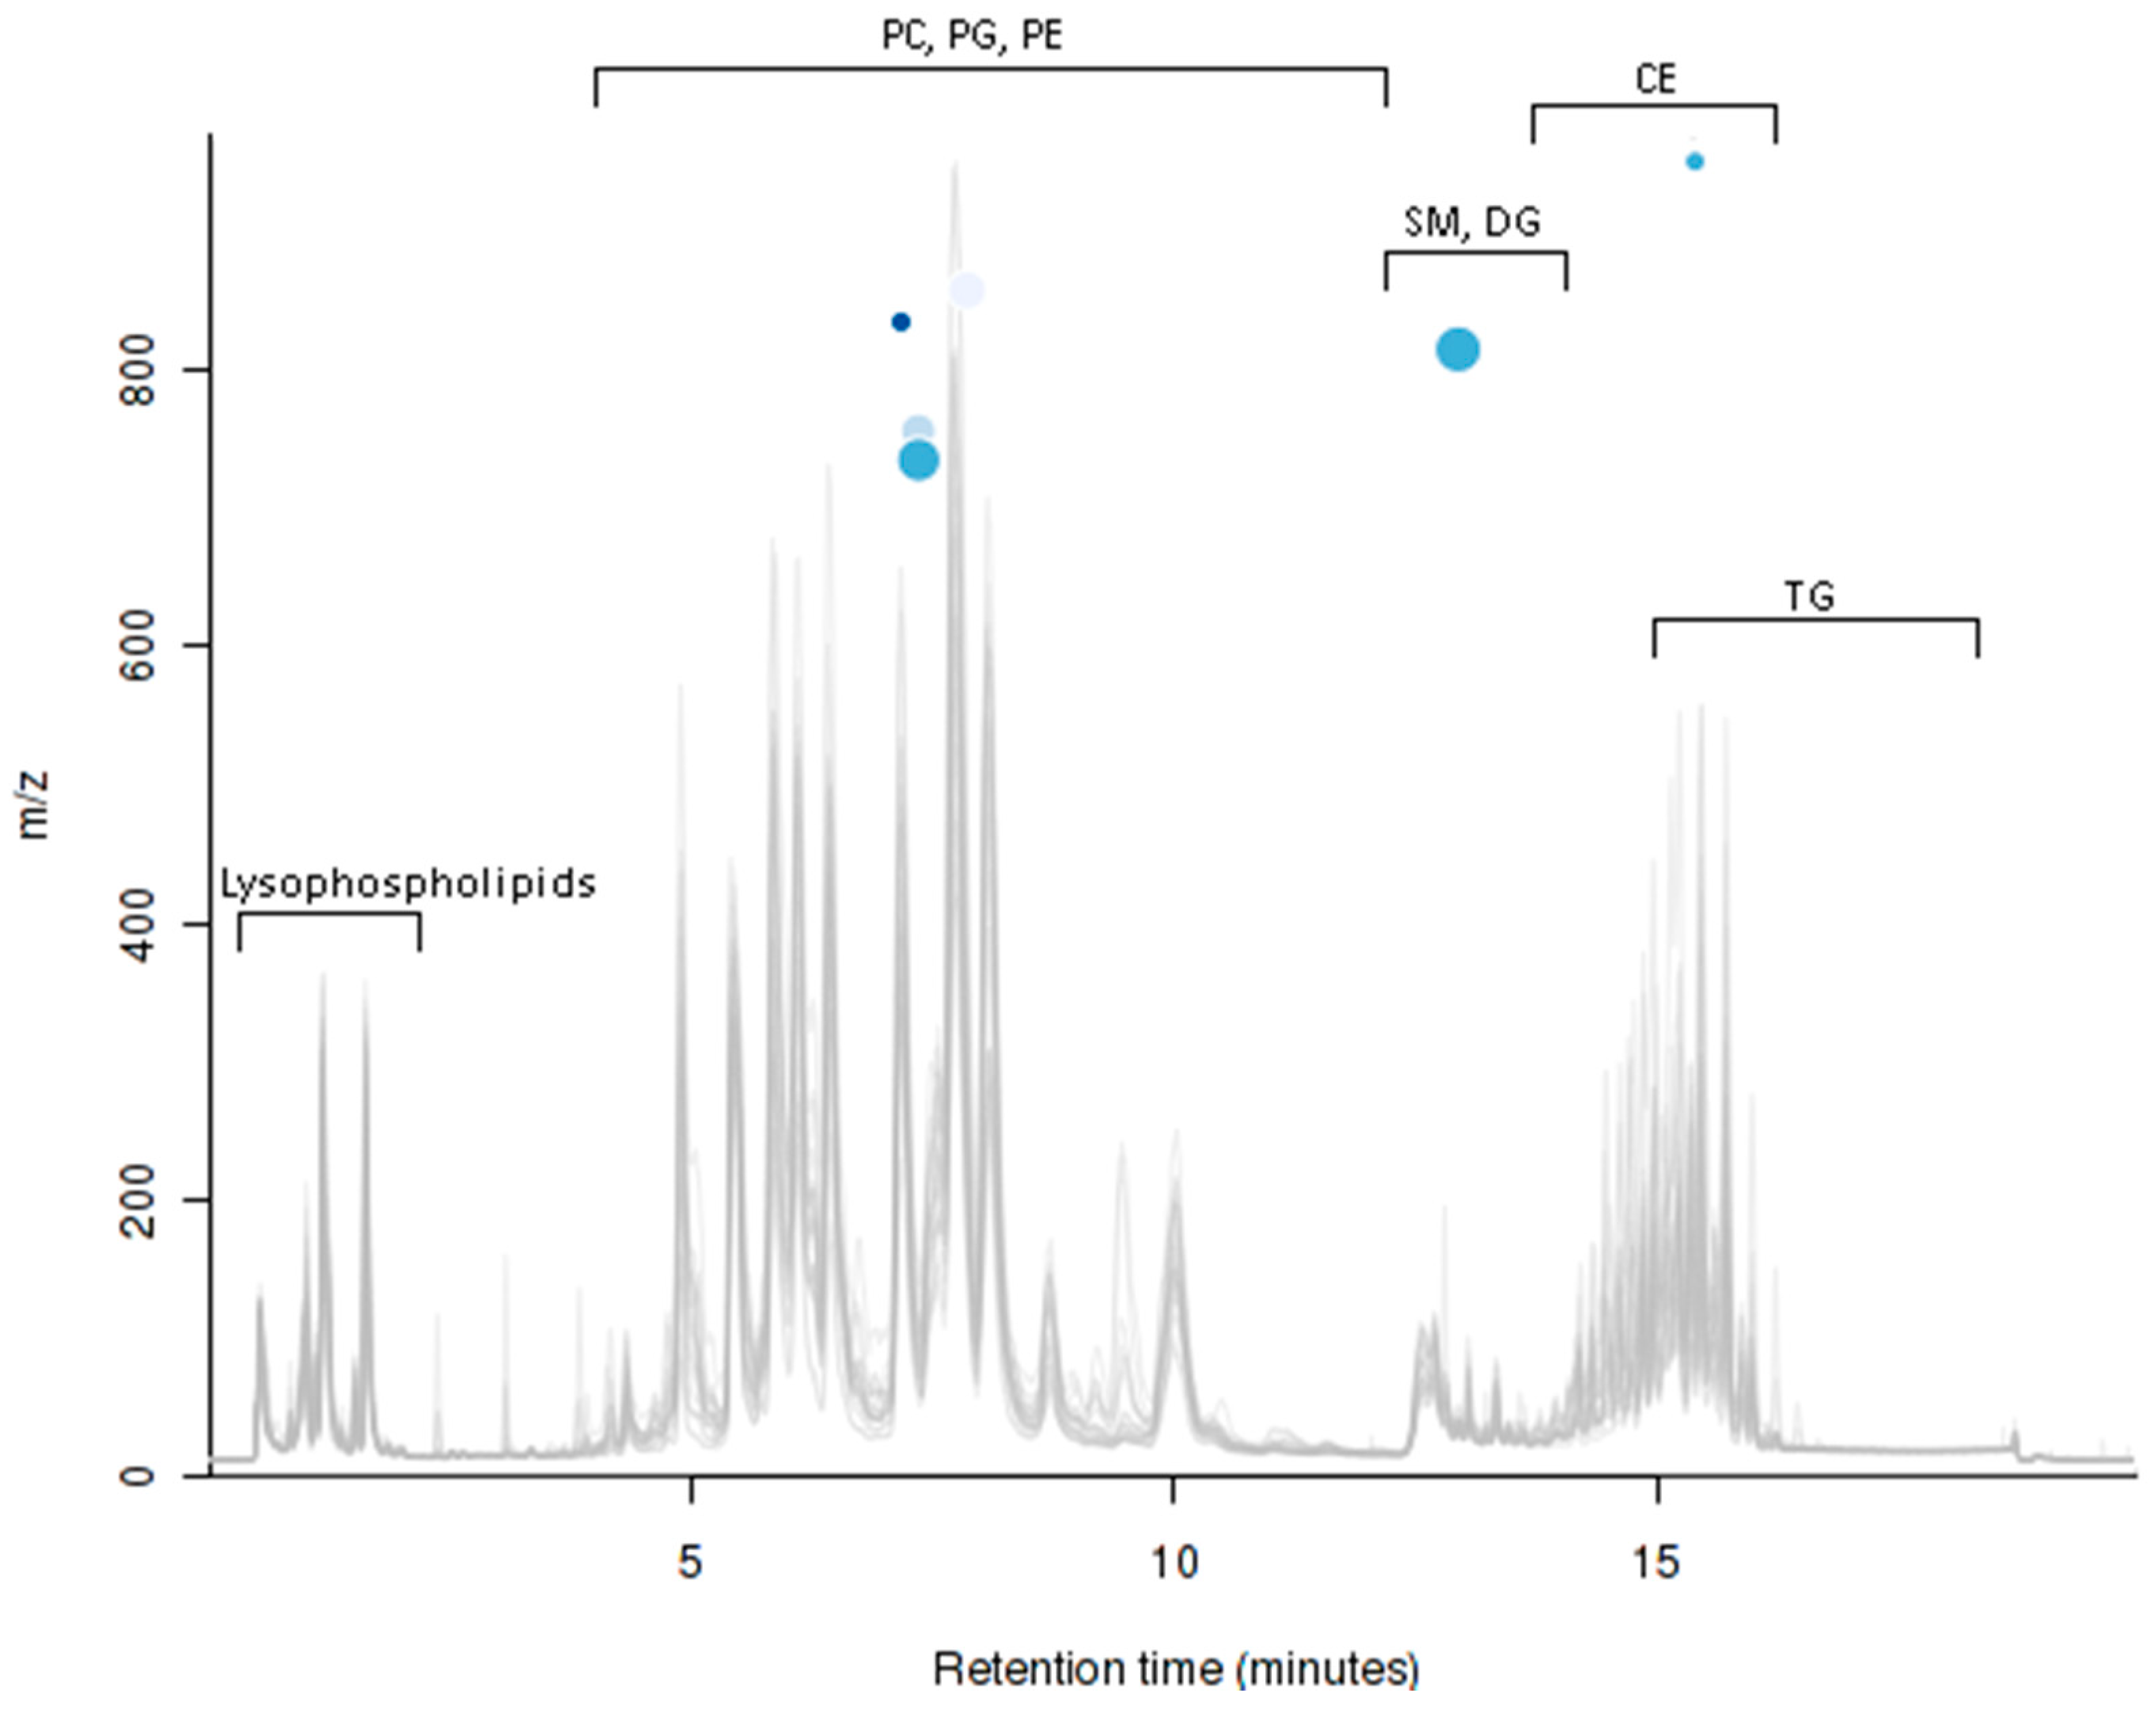
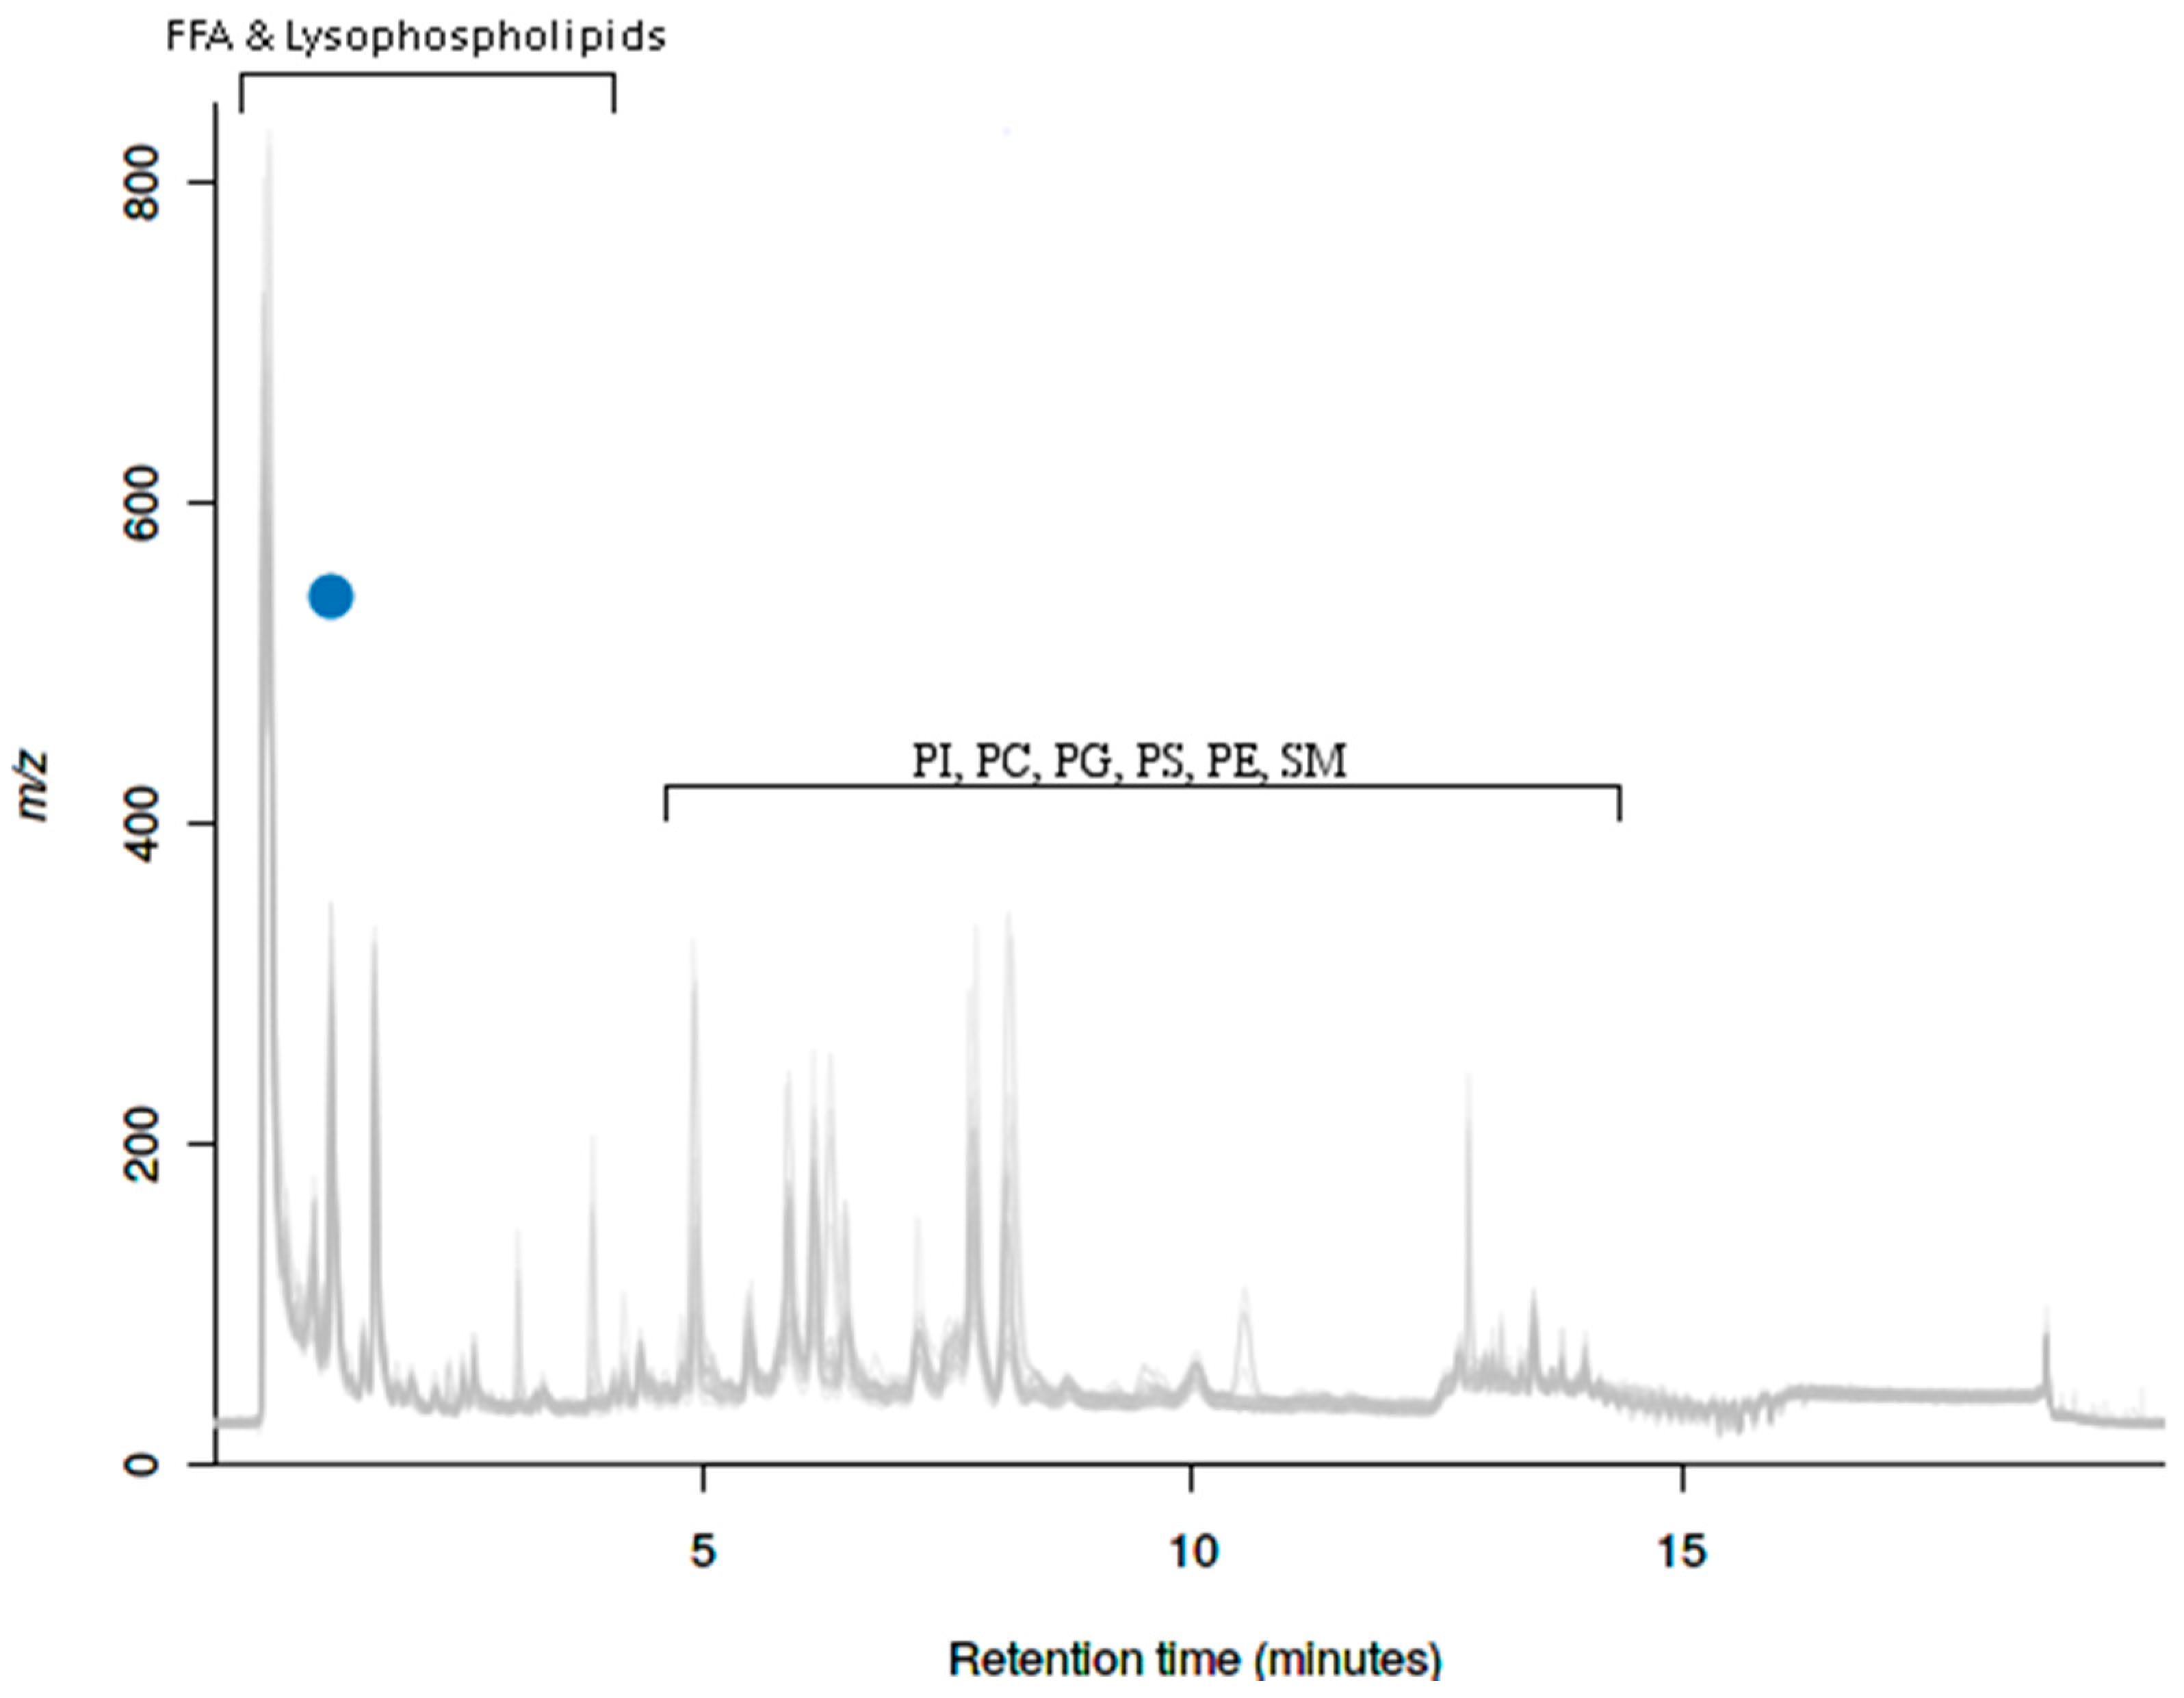
2.5. UPLC-MS Analysis
3. Discussion
4. Materials and Methods
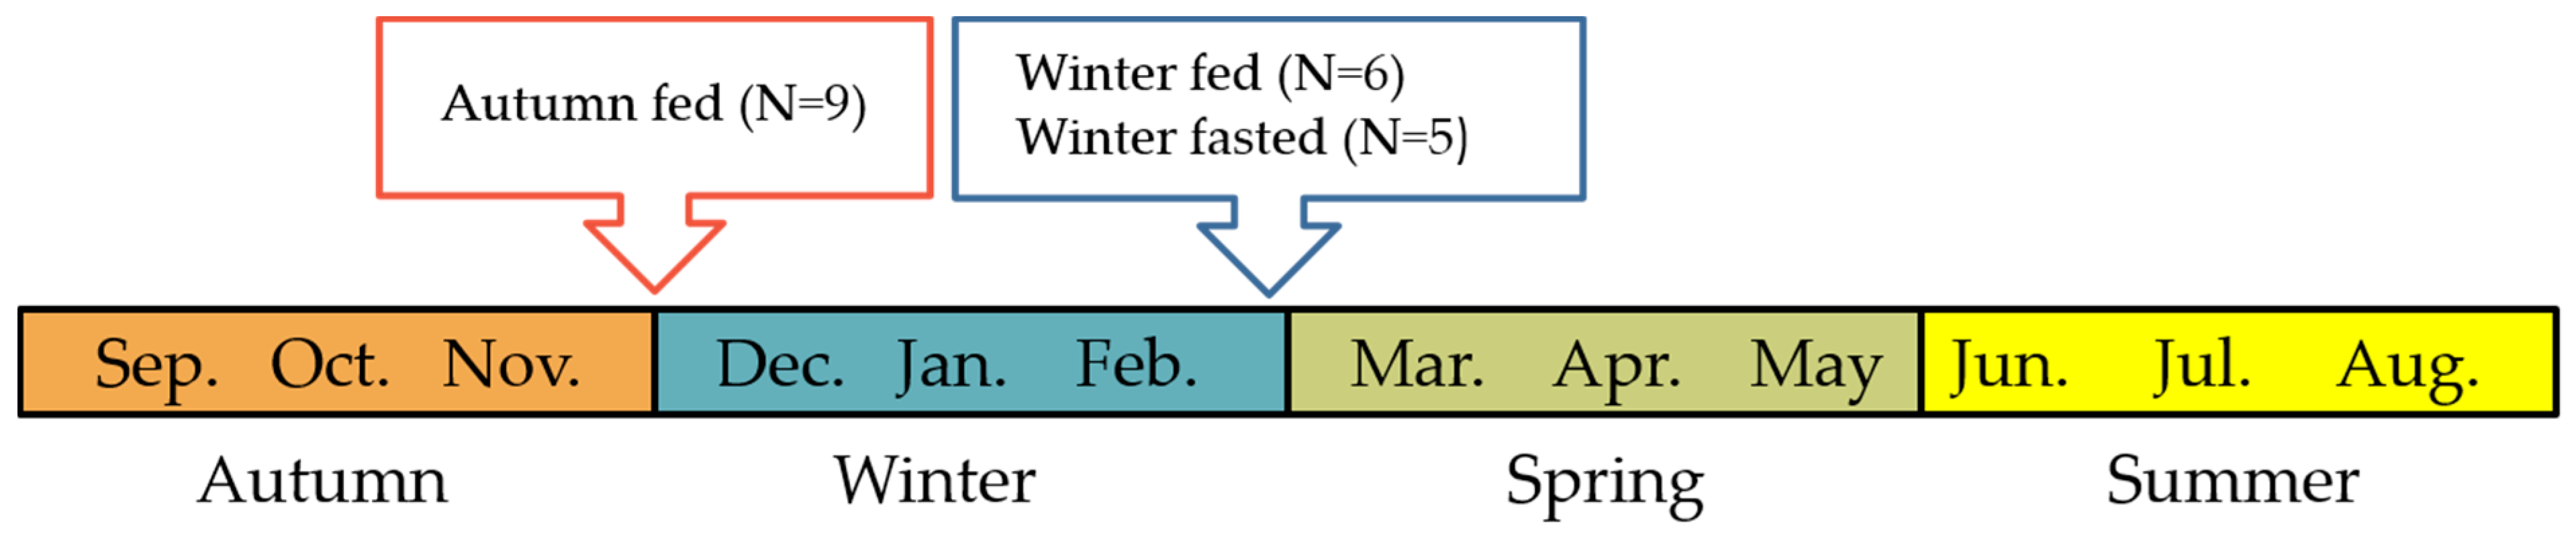
4.1. Animals
4.2. Hypothalamic Gene Expression Determination
4.3. Metabolic Profiling
4.4. Metabolomics
4.5. Histopathology of Adipose Tissue Vascularization and Inflammatory Structures
4.6. Statistical Analyses
5. Conclusions
Supplementary Materials
Author Contributions
Funding
Institutional Review Board Statement
Informed Consent Statement
Data Availability Statement
Acknowledgments
Conflicts of Interest
References
- Park, J.; Morley, T.S.; Kim, M.; Clegg, D.J.; Scherer, P.E. Obesity and cancer--mechanisms underlying tumour progression and recurrence. Nat. Rev. Endocrinol. 2014, 10, 455–465. [Google Scholar] [CrossRef] [Green Version]
- DeMarco, V.G.; Aroor, A.R.; Sowers, J.R. The pathophysiology of hypertension in patients with obesity. Nat. Rev. Endocrinol. 2014, 10, 364–376. [Google Scholar] [CrossRef] [PubMed] [Green Version]
- Kleinert, M.; Clemmensen, C.; Hofmann, S.M.; Moore, M.C.; Renner, S.; Woods, S.C.; Huypens, P.; Beckers, J.; de Angelis, M.H.; Schurmann, A.; et al. Animal models of obesity and diabetes mellitus. Nat. Rev. Endocrinol. 2018, 14, 140–162. [Google Scholar] [CrossRef] [PubMed] [Green Version]
- Van Gaal, L.F.; Mertens, I.L.; De Block, C.E. Mechanisms linking obesity with cardiovascular disease. Nature 2006, 444, 875–880. [Google Scholar] [CrossRef]
- Despres, J.P.; Lemieux, I. Abdominal obesity and metabolic syndrome. Nature 2006, 444, 881–887. [Google Scholar] [CrossRef] [PubMed]
- Kauhala, K.; Kowalczyk, R. Invasion of the raccoon dog Nyctereutes procyonoides in Europe: History of colonization, features behind its success, and threats to native fauna. Curr. Zool. 2011, 57, 584–598. [Google Scholar] [CrossRef] [Green Version]
- Mustonen, A.; Asikainen, J.; Kauhala, K.; Paakkonen, T.; Nieminen, P. Seasonal rhythms of body temperature in the free-ranging raccoon dog (Nyctereutes procyonoides) with special emphasis on winter sleep. Chronobiol. Int. 2007, 24, 1095–1107. [Google Scholar] [CrossRef]
- Asikainen, J.; Mustonen, A.; Hyvärinen, H.; Nieminen, P. Seasonal physiology of the wild raccoon dog (Nyctereutes procyonoides). Zool. Sci. 2004, 21, 385–391. [Google Scholar] [CrossRef] [Green Version]
- Nieminen, P.; Saarela, S.; Pyykönen, T.; Asikainen, J.; Mononen, J.; Mustonen, A. Endocrine response to fasting in the overwintering captive raccoon dog (Nyctereutes procyonoides). J. Exp. Zool. Part A Comp. Exp. Biol. 2004, 301, 919–929. [Google Scholar] [CrossRef]
- Mustonen, A.M.; Nieminen, P. A review of the physiology of a survival expert of big freeze, deep snow, and an empty stomach: The boreal raccoon dog (Nyctereutes procyonoides). J. Comp. Physiol. B 2018, 188, 15–25. [Google Scholar] [CrossRef]
- Asikainen, J.; Mustonen, A.; Nieminen, P.; Pasanen, S.; Araja-Matilainen, H.; Hyvärinen, H. Reproduction of the raccoon dog (Nyctereutes procyonoides) after feeding or food deprivation in winter. J. Anim. Physiol. Anim. Nutr. 2002, 86, 367–375. [Google Scholar] [CrossRef]
- Asikainen, J.; Mustonen, A.; Hyvärinen, H.; Nieminen, P. Seasonal Reproductive Endocrine Profile of the Raccoon Dog (Nyctereutes procyonoides)—Effects of Melatonin and Food Deprivation. J. Exp. Zool. Part A Comp. Exp. Biol. 2003, 299, 180–187. [Google Scholar] [CrossRef] [PubMed]
- Mustonen, A.; Nieminen, P.; Puukka, M.; Asikainen, J.; Saarela, S.; Karonen, S.; Kukkonen, J.V.K.; Hyvärinen, H. Physiological adaptations of the raccoon dog (Nyctereutes procyonoides) to seasonal fasting-fat and nitrogen metabolism and influence of continuous melatonin treatment. J. Comp. Physiol. B Biochem. Syst. Environ. Physiol. 2004, 174, 1–12. [Google Scholar] [CrossRef]
- Kinnunen, S.; Mänttäri, S.; Herzig, K.; Nieminen, P.; Mustonen, A.; Saarela, S. Maintenance of skeletal muscle energy homeostasis during prolonged wintertime fasting in the raccoon dog (Nyctereutes procyonoides). J. Comp. Physiol. B Biochem. Syst. Environ. Physiol. 2015, 185, 435–445. [Google Scholar] [CrossRef]
- Nieminen, P.; Finnilä, M.A.J.; Tuukkanen, J.; Jämsä, T.; Mustonen, A. Preservation of bone mass and biomechanical properties during winter sleep-the raccoon dog (Nyctereutes procyonoides) as a novel model species. Bone 2011, 48, 878–884. [Google Scholar] [CrossRef]
- Clarke, I.J. Hypothalamus as an endocrine organ. Compr. Physiol. 2015, 5, 217–253. [Google Scholar] [CrossRef]
- Morton, G.J.; Cummings, D.E.; Baskin, D.G.; Barsh, G.S.; Schwartz, M.W. Central nervous system control of food intake and body weight. Nature 2006, 443, 289–295. [Google Scholar] [CrossRef]
- Schwartz, M.W.; Woods, S.C.; Porte, D.; Seeley, R.J.; Baskin, D.G. Central nervous system control of food intake. Nature 2000, 404, 661–671. [Google Scholar] [CrossRef]
- Karhunen, L.; Herzig, K.H. Neuroendocrinological regulation of food intake. Regul. Pept. 2008, 149, 1–2. [Google Scholar] [CrossRef]
- Ebling, F.J.P. Hypothalamic control of seasonal changes in food intake and body weight. Front. Neuroendocrinol. 2015, 37, 97–107. [Google Scholar] [CrossRef]
- Adamantidis, A.; de Lecea, L. The hypocretins as sensors for metabolism and arousal. J. Physiol. 2009, 587, 33–40. [Google Scholar] [CrossRef]
- Heinonen, M.V.; Purhonen, A.K.; Mäkelä, K.A.; Herzig, K.H. Functions of orexins in peripheral tissues. Acta Physiol. 2008, 192, 471–485. [Google Scholar] [CrossRef]
- Makela, K.A.; Wigren, H.K.; Zant, J.C.; Sakurai, T.; Alhonen, L.; Kostin, A.; Porkka-Heiskanen, T.; Herzig, K.H. Characterization of sleep-wake patterns in a novel transgenic mouse line overexpressing human prepro-orexin/hypocretin. Acta Physiol. (Oxf.) 2010, 198, 237–249. [Google Scholar] [CrossRef] [PubMed]
- McGranaghan, P.A.; Piggins, H.D. Orexin A-like immunoreactivity in the hypothalamus and thalamus of the Syrian hamster (Mesocricetus auratus) and Siberian hamster (Phodopus sungorus), with special reference to circadian structures. Brain Res. 2001, 904, 234–244. [Google Scholar] [CrossRef]
- Rousseau, K.; Atcha, Z.; Loudon, A.S.I. Leptin and seasonal mammals. J. Neuroendocrinol. 2003, 15, 409–414. [Google Scholar] [CrossRef] [PubMed]
- Van Swieten, M.M.H.; Pandit, R.; Adan, R.A.H.; van der Plasse, G. The neuroanatomical function of leptin in the hypothalamus. J. Chem. Neuroanat. 2014, 61, 207–220. [Google Scholar] [CrossRef] [PubMed]
- Karras, S.N.; Koufakis, T.; Mustafa, O.G.; Kotsa, K. Anti-incretin effect: The other face of Janus in human glucose homeostasis. Obes. Rev. 2019, 20, 1597–1607. [Google Scholar] [CrossRef] [PubMed]
- Romijn, J.A.; Corssmit, E.P.; Havekes, L.M.; Pijl, H. Gut-brain axis. Curr. Opin. Clin. Nutr. Metab. Care 2008, 11, 518–521. [Google Scholar] [CrossRef] [PubMed]
- Sam, A.H.; Troke, R.C.; Tan, T.M.; Bewick, G.A. The role of the gut/brain axis in modulating food intake. Neuropharmacology 2012, 63, 46–56. [Google Scholar] [CrossRef]
- Nicholson, J.K.; Lindon, J.C. Systems biology: Metabonomics. Nature 2008, 455, 1054–1056. [Google Scholar] [CrossRef]
- Florant, G.L.; Healy, J.E. The regulation of food intake in mammalian hibernators: A review. J. Comp. Physiol. B 2012, 182, 451–467. [Google Scholar] [CrossRef]
- Schwartz, C.; Hampton, M.; Andrews, M.T. Hypothalamic gene expression underlying pre-hibernation satiety. Genes Brain Behav. 2015, 14, 310–318. [Google Scholar] [CrossRef]
- Morgan, P.J.; Ross, A.W.; Mercer, J.G.; Barrett, P. Photoperiodic programming of body weight through the neuroendocrine hypothalamus. J. Endocrinol. 2003, 177, 27–34. [Google Scholar] [CrossRef] [Green Version]
- Bartness, T.J.; Elliott, J.A.; Goldman, B.D. Control of torpor and body weight patterns by a seasonal timer in Siberian hamsters. Am. J. Physiol. R. Integr. Comp. Physiol. 1989, 257, R142–R149. [Google Scholar] [CrossRef] [PubMed]
- Reddy, A.B.; Cronin, A.S.; Ford, H.; Ebling, F.J.P. Seasonal regulation of food intake and body weight in the male Siberian hamster: Studies of hypothalamic orexin (hypocretin), neuropeptide Y (NPY) and pro-opiomelanocortin (POMC). Eur. J. Neurosci. 1999, 11, 3255–3264. [Google Scholar] [CrossRef] [PubMed]
- Schwartz, C.; Hampton, M.; Andrews, M.T. Seasonal and Regional Differences in Gene Expression in the Brain of a Hibernating Mammal. PLoS ONE 2013, 8, e58427. [Google Scholar] [CrossRef] [PubMed]
- Mercer, J.G.; Moar, K.M.; Ross, A.W.; Hoggard, N.; Morgan, P.J. Photoperiod regulates arcuate nucleus POMC, AGRP, and leptin receptor mRNA in Siberian hamster hypothalamus. Am. J. Physiol. Regul Integr. Comp. Physiol. 2000, 278, R271–R281. [Google Scholar] [CrossRef]
- Kinnunen, S.; Mänttäri, S.; Herzig, K.; Nieminen, P.; Mustonen, A.; Saarela, S. Effects of wintertime fasting and seasonal adaptation on AMPK and ACC in hypothalamus, adipose tissue and liver of the raccoon dog (Nyctereutes procyonoides). Comp. Biochem. Physiol. A Mol. Integr. Physiol. 2016, 192, 44–51. [Google Scholar] [CrossRef] [PubMed]
- Szczesna, M.; Zieba, D.A. Phenomenon of leptin resistance in seasonal animals: The failure of leptin action in the brain. Domest. Anim. Endocrinol. 2015, 52, 60–70. [Google Scholar] [CrossRef]
- Arora, S. Anubhuti Role of neuropeptides in appetite regulation and obesity—A review. Neuropeptides 2006, 40, 375–401. [Google Scholar] [CrossRef]
- Baldini, G.; Phelan, K.D. The melanocortin pathway and control of appetite-progress and therapeutic implications. J. Endocrinol. 2019, 241, R1–R33. [Google Scholar] [CrossRef]
- Savontaus, E.; Conwell, I.M.; Wardlaw, S.L. Effects of adrenalectomy on AGRP, POMC, NPY and CART gene expression in the basal hypothalamus of fed and fasted rats. Brain Res. 2002, 958, 130–138. [Google Scholar] [CrossRef]
- Williams, G.; Harrold, J.A.; Cutler, D.J. The hypothalamus and the regulation of energy homeostasis: Lifting the lid on a black box. Proc. Nutr. Soc. 2000, 59, 385–396. [Google Scholar] [CrossRef] [PubMed] [Green Version]
- Cinti, S.; Mitchell, G.; Barbatelli, G.; Murano, I.; Ceresi, E.; Faloia, E.; Wang, S.; Fortier, M.; Greenberg, A.S.; Obin, M.S. Adipocyte death defines macrophage localization and function in adipose tissue of obese mice and humans. J. Lipid Res. 2005, 46, 2347–2355. [Google Scholar] [CrossRef] [PubMed] [Green Version]
- Trayhurn, P. Hypoxia and adipose tissue function and dysfunction in obesity. Physiol. Rev. 2013, 93, 1–21. [Google Scholar] [CrossRef] [PubMed] [Green Version]
- Ligthart, S.; Vaez, A.; Vosa, U.; Stathopoulou, M.G.; de Vries, P.S.; Prins, B.P.; Van der Most, P.J.; Tanaka, T.; Naderi, E.; Rose, L.M.; et al. Genome Analyses of >200,000 Individuals Identify 58 Loci for Chronic Inflammation and Highlight Pathways that Link Inflammation and Complex Disorders. Am. J. Hum. Genet. 2018, 103, 691–706. [Google Scholar] [CrossRef] [Green Version]
- Saukkonen, T.; Mutt, S.J.; Jokelainen, J.; Saukkonen, A.M.; Raza, G.S.; Karhu, T.; Harkonen, P.; Eckel, J.; Herzig, K.H.; Rajala, U.; et al. Adipokines and inflammatory markers in elderly subjects with high risk of type 2 diabetes and cardiovascular disease. Sci. Rep. 2018, 8, 12816–12818. [Google Scholar] [CrossRef]
- Mokkala, K.; Houttu, N.; Koivuniemi, E.; Sorensen, N.; Nielsen, H.B.; Laitinen, K. GlycA, a novel marker for low grade inflammation, reflects gut microbiome diversity and is more accurate than high sensitive CRP in reflecting metabolomic profile. Metabolomics 2020, 16, 76. [Google Scholar] [CrossRef]
- Otis, J.P.; Sahoo, D.; Drover, V.A.; Yen, C.L.; Carey, H.V. Cholesterol and lipoprotein dynamics in a hibernating mammal. PLoS ONE 2011, 6, e29111. [Google Scholar] [CrossRef] [Green Version]
- Pietrocola, F.; Demont, Y.; Castoldi, F.; Enot, D.; Durand, S.; Semeraro, M.; Baracco, E.E.; Pol, J.; Bravo-San Pedro, J.M.; Bordenave, C.; et al. Metabolic effects of fasting on human and mouse blood in vivo. Autophagy 2017, 13, 567–578. [Google Scholar] [CrossRef]
- Steinhauser, M.L.; Olenchock, B.A.; O’Keefe, J.; Lun, M.; Pierce, K.A.; Lee, H.; Pantano, L.; Klibanski, A.; Shulman, G.I.; Clish, C.B.; et al. The circulating metabolome of human starvation. JCI Insight 2018, 3. [Google Scholar] [CrossRef]
- Soeters, P.B.; Shenkin, A.; Sobotka, L.; Soeters, M.R.; de Leeuw, P.W.; Wolfe, R.R. The anabolic role of the Warburg, Cori-cycle and Crabtree effects in health and disease. Clin. Nutr. 2021. [Google Scholar] [CrossRef]
- Wiesner, P.; Leidl, K.; Boettcher, A.; Schmitz, G.; Liebisch, G. Lipid profiling of FPLC-separated lipoprotein fractions by electrospray ionization tandem mass spectrometry. J. Lipid Res. 2009, 50, 574–585. [Google Scholar] [CrossRef] [Green Version]
- Lindblad-Toh, K.; Wade, C.M.; Mikkelsen, T.S.; Karlsson, E.K.; Jaffe, D.B.; Kamal, M.; Clamp, M.; Chang, J.L.; Kulbokas, E.J., III; Zody, M.C.; et al. Genome sequence, comparative analysis and haplotype structure of the domestic dog. Nature 2005, 438, 803–819. [Google Scholar] [CrossRef] [PubMed]
- Holmer-Jensen, J.; Karhu, T.; Mortensen, L.S.; Pedersen, S.B.; Herzig, K.H.; Hermansen, K. Differential effects of dietary protein sources on postprandial low-grade inflammation after a single high fat meal in obese non-diabetic subjects. Nutr. J. 2011, 10, 115. [Google Scholar] [CrossRef] [PubMed] [Green Version]
- Nicholson, J.K.; Foxall, P.J.D.; Spraul, M.; Farrant, R.D.; Lindon, J.C. 750 MHz 1H and 1H 13C NMR spectroscopy of human blood plasma. Anal. Chem. 1995, 67, 793–811. [Google Scholar] [CrossRef]
- Beckonert, O.; Keun, H.C.; Ebbels, T.M.; Bundy, J.; Holmes, E.; Lindon, J.C.; Nicholson, J.K. Metabolic profiling, metabolomic and metabonomic procedures for NMR spectroscopy of urine, plasma, serum and tissue extracts. Nat. Protoc. 2007, 2, 2692–2703. [Google Scholar] [CrossRef] [PubMed]
- Lindon, J.C.; Holmes, E.; Nicholson, J.K. Pattern recognition methods and applications in biomedical magnetic resonance. Prog. Nucl. Magn. Reson. Spectrosc. 2001, 39, 1–40. [Google Scholar] [CrossRef]
- Dieterle, F.; Ross, A.; Schlotterbeck, G.; Senn, H. Probabilistic quotient normalization as robust method to account for dilution of complex biological mixtures. Application in1H NMR metabonomics. Anal. Chem. 2006, 78, 4281–4290. [Google Scholar] [CrossRef] [PubMed]
- Tang, H.; Wang, Y.; Nicholson, J.K.; Lindon, J.C. Use of relaxation-edited one-dimensional and two dimensional nuclear magnetic resonance spectroscopy to improve detection of small metabolites in blood plasma. Anal. Biochem. 2004, 325, 260–272. [Google Scholar] [CrossRef]
- Gowda, H.; Ivanisevic, J.; Johnson, C.H.; Kurczy, M.E.; Benton, H.P.; Rinehart, D.; Nguyen, T.; Ray, J.; Kuehl, J.; Arevalo, B.; et al. Interactive XCMS online: Simplifying advanced metabolomic data processing and subsequent statistical analyses. Anal. Chem. 2014, 86, 6931–6939. [Google Scholar] [CrossRef]
- Tautenhahn, R.; Patti, G.J.; Rinehart, D.; Siuzdak, G. XCMS online: A web-based platform to process untargeted metabolomic data. Anal. Chem. 2012, 84, 5035–5039. [Google Scholar] [CrossRef] [Green Version]


| Weight (kg) | Winter Fasted (n = 5) | Winter Fed (n = 6) | Autumn Fed (n = 9) |
|---|---|---|---|
| Beginning of experiment | 13.3 ± 1.1 | 14.0 ± 1.2 | NA |
| End of experiment | 9.0 ± 0.9 ** | 11.2 ± 0.9 | 12.3 ± 1.2 *** |
| Winter Fasted (n = 5) | Winter Fed (n = 6) | Autumn Fed (n = 9) | ||
|---|---|---|---|---|
| Gut Hormones | GIP (pg/mL) PYY (pg/mL) | 4.02 ± 1.02 | 7.16 ± 1.22 | 12.63 ± 4.13 |
| 48.85 ± 4.07 | 65.41 ± 16.36 | 43.24 ± 6.70 | ||
| Cytokines/Chemokines | GM-CSF (pg/mL) IP-10 (pg/mL) IL-8 (ng/mL) IL-18 (pg/mL) MCP-1 (pg/mL) | 169.13 ± 40.04 | 102.48 ± 12.23 | 173.34 ± 72.44 |
| # | # | 37.27 ± 16.77 | ||
| 27.95 ± 7.11 | 16.96 ± 4.55 | 15.61 ± 2.12 | ||
| 100.19 ± 29.39 | 54.89 ± 9.38 | 365.02 ± 108.50 | ||
| 388.50 ± 72.11 | 187.37 ± 32.92 | 302.22 ± 95.58 | ||
| Adipokines | Resistin (ng/mL) | 56.75 ± 8.72 | 38.77 ± 3.98 | 42.48 ± 6.21 |
| Pituitary Gland Peptides | ACTH (pg/mL) GH (ng/mL) FSH (ng/mL) LH (ng/mL) | 209.86 ± 34.34 | 159.68 ± 43.70 | 159.50 ± 32.29 |
| 0.46 ± 0.28 | 0.37 ± 0.16 | 0.14 ± 0.07 | ||
| 91.90 ± 31.71 | 41.59 ± 17.96 | 76.66 ± 18.84 | ||
| 1.03 ± 0.25 | 0.52 ± 0.15 | 1.12 ± 0.18 |
Publisher’s Note: MDPI stays neutral with regard to jurisdictional claims in published maps and institutional affiliations. |
© 2021 by the authors. Licensee MDPI, Basel, Switzerland. This article is an open access article distributed under the terms and conditions of the Creative Commons Attribution (CC BY) license (https://creativecommons.org/licenses/by/4.0/).
Share and Cite
Niiranen, L.; Mäkelä, K.A.; Dona, A.; Krumsiek, J.; Karhu, T.; Mäkinen, M.J.; Thalmann, O.; Saarela, S.; Herzig, K.-H. Seasonal Regulation of Metabolism: The Effect of Wintertime Fasting and Autumnal Fattening on Key Central Regulators of Metabolism and the Metabolic Profile of the Raccoon Dog (Nyctereutes Procyonoides). Int. J. Mol. Sci. 2021, 22, 4965. https://0-doi-org.brum.beds.ac.uk/10.3390/ijms22094965
Niiranen L, Mäkelä KA, Dona A, Krumsiek J, Karhu T, Mäkinen MJ, Thalmann O, Saarela S, Herzig K-H. Seasonal Regulation of Metabolism: The Effect of Wintertime Fasting and Autumnal Fattening on Key Central Regulators of Metabolism and the Metabolic Profile of the Raccoon Dog (Nyctereutes Procyonoides). International Journal of Molecular Sciences. 2021; 22(9):4965. https://0-doi-org.brum.beds.ac.uk/10.3390/ijms22094965
Chicago/Turabian StyleNiiranen, Laura, Kari A. Mäkelä, Anthony Dona, Jan Krumsiek, Toni Karhu, Markus J. Mäkinen, Olaf Thalmann, Seppo Saarela, and Karl-Heinz Herzig. 2021. "Seasonal Regulation of Metabolism: The Effect of Wintertime Fasting and Autumnal Fattening on Key Central Regulators of Metabolism and the Metabolic Profile of the Raccoon Dog (Nyctereutes Procyonoides)" International Journal of Molecular Sciences 22, no. 9: 4965. https://0-doi-org.brum.beds.ac.uk/10.3390/ijms22094965