
Chronic Inflammatory Status Observed in Patients with Type 2 Diabetes Induces Modulation of Cytochrome P450 Expression and Activity


Abstract
:
1. Introduction
2. T2DM as an Inflammatory Disease
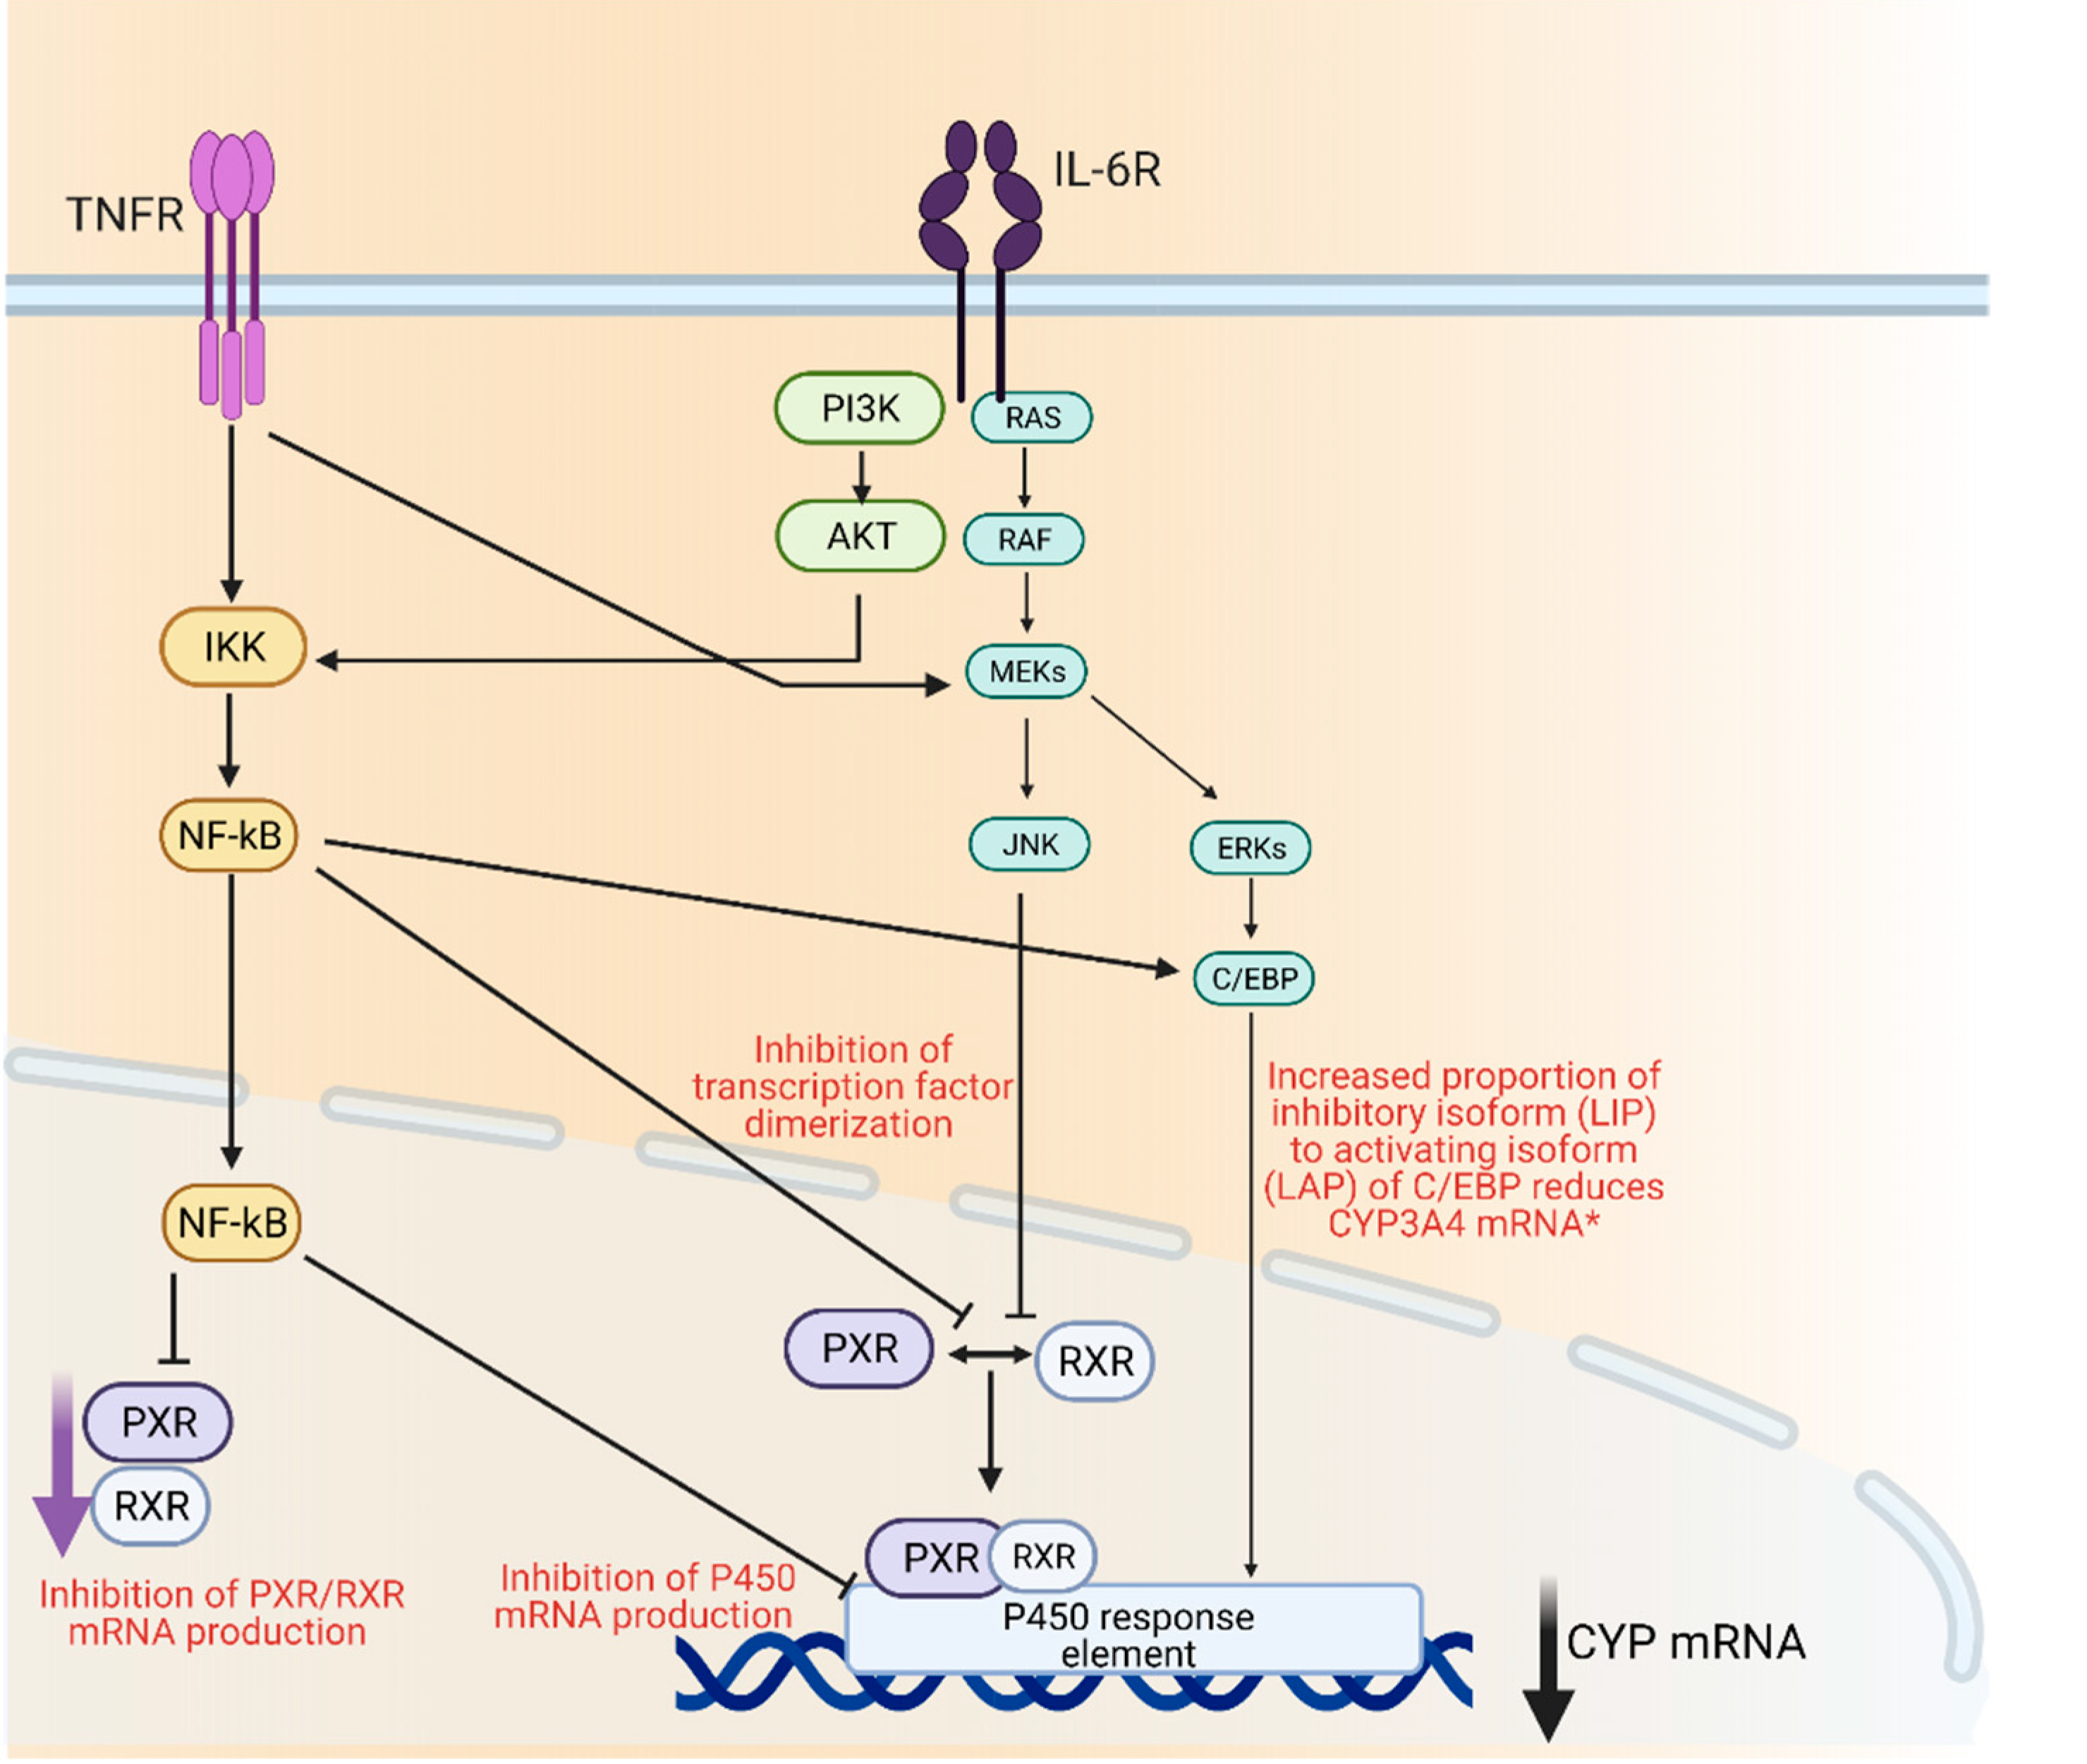
3. P450 Regulation and Inflammation
4. Insulin and Glycemic Levels
5. P450, Inflammation and T2DM
5.1. Animal Studies
5.2. Human Liver Microsomes and Probes
5.3. Clinical Evidence of Phenoconversion in T2DM
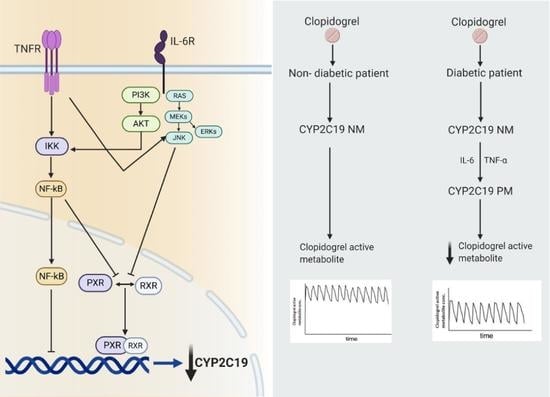
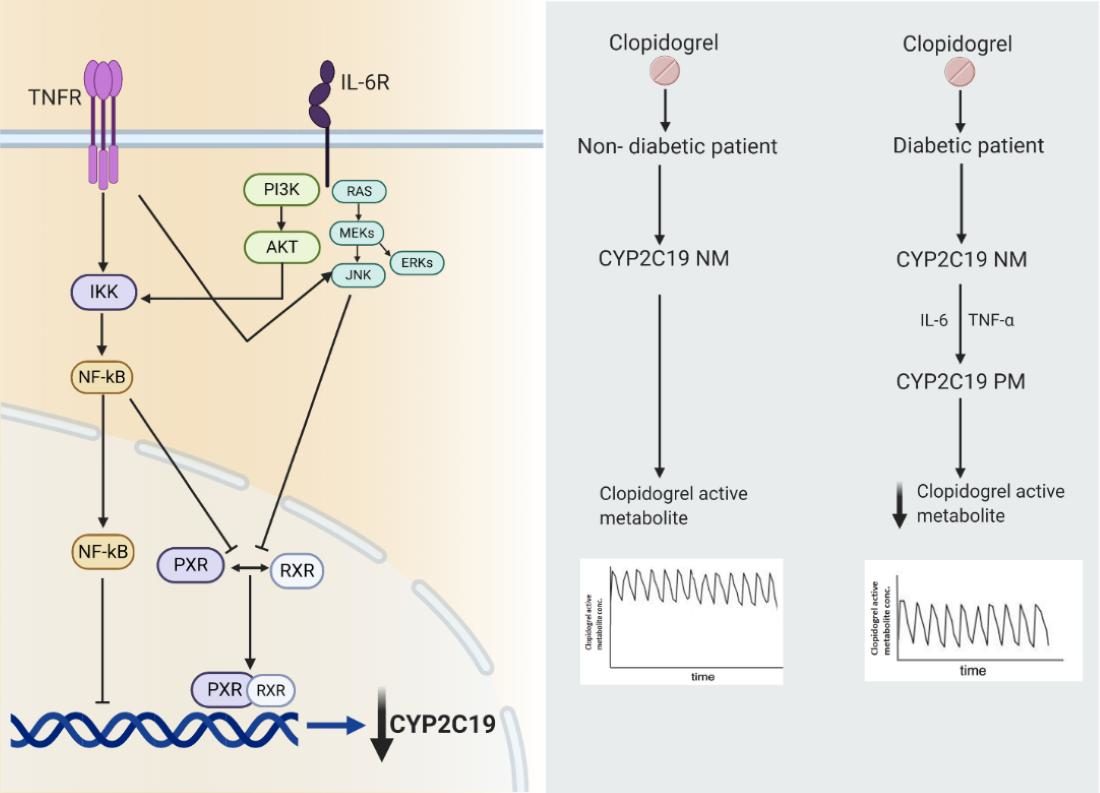
6. Clopidogrel: A Specific Example of Phenoconversion in T2DM
7. Conclusions
Supplementary Materials
Author Contributions
Funding
Institutional Review Board Statement
Informed Consent Statement
Acknowledgments
Conflicts of Interest
References
- Organization WH. Diabetes. Available online: https://0-www-ncbi-nlm-nih-gov.brum.beds.ac.uk/pmc/articles/PMC4860345/pdf/nihms-779960.pdf (accessed on 1 April 2021).
- Bergman, R.N.; Finegood, D.T.; Kahn, S.E. The evolution of beta-cell dysfunction and insulin resistance in type 2 diabetes. Eur. J. Clin. Investig. 2002, 32 (Suppl. 3), 35–45. [Google Scholar] [CrossRef] [PubMed]
- Atlas IDFD. Available online: www.diabetesatlas.org (accessed on 1 April 2021).
- Peron, E.P.; Ogbonna, K.C.; Donohoe, K.L. Antidiabetic medications and polypharmacy. Clin. Geriatr. Med. 2015, 31, 17–27. [Google Scholar] [CrossRef] [Green Version]
- Nathan, D.M.; Buse, J.B.; Davidson, M.B.; Ferrannini, E.; Holman, R.R.; Sherwin, R.; Zinman, B. Medical management of hyperglycemia in type 2 diabetes: A consensus algorithm for the initiation and adjustment of therapy: A consensus statement of the American Diabetes Association and the European Association for the Study of Diabetes. Diabetes Care 2009, 32, 193–203. [Google Scholar] [CrossRef] [Green Version]
- Bolen, S.; Feldman, L.; Vassy, J.; Wilson, L.; Yeh, H.C.; Marinopoulos, S.; Wiley, C.; Selvin, E.; Wilson, R.; Bass, E.; et al. Systematic review: Comparative effectiveness and safety of oral medications for type 2 diabetes mellitus. Ann. Intern. Med. 2007, 147, 386–399. [Google Scholar] [CrossRef]
- Manolopoulos, V.G. Pharmacogenomics and adverse drug reactions in diagnostic and clinical practice. Clin. Chem. Lab. Med. 2007, 45, 801–814. [Google Scholar] [CrossRef]
- Pearson, E.R. Pharmacogenetics in diabetes. Curr. Diab. Rep. 2009, 9, 172–181. [Google Scholar] [CrossRef]
- Pacanowski, M.A.; Hopley, C.W.; Aquilante, C.L. Interindividual variability in oral antidiabetic drug disposition and response: The role of drug transporter polymorphisms. Expert Opin. Drug Metab. Toxicol. 2008, 4, 529–544. [Google Scholar] [CrossRef] [PubMed]
- Chaudhury, A.; Duvoor, C.; Dendi, V.S.R.; Kraleti, S.; Chada, A.; Ravilla, R.; Marco, A.; Shekhawat, N.s.; Montales, M.T.; Kuriakose, K.; et al. Clinical Review of Antidiabetic Drugs: Implications for Type 2 Diabetes Mellitus Management. Front. Endocrinol. (Lausanne) 2017, 8, 6. [Google Scholar] [CrossRef] [Green Version]
- UK Prospective Diabetes Study (UKPDS) Group. Intensive blood-glucose control with sulphonylureas or insulin compared with conventional treatment and risk of complications in patients with type 2 diabetes (UKPDS 33). Lancet 1998, 352, 837–853. [Google Scholar] [CrossRef]
- Dharmalingam, M.; Yamasandhi, P.G. Nonalcoholic Fatty Liver Disease and Type 2 Diabetes Mellitus. Indian J. Endocrinol. Metab. 2018, 22, 421–428. [Google Scholar] [CrossRef] [PubMed]
- Xia, M.F.; Bian, H.; Gao, X. NAFLD and Diabetes: Two Sides of the Same Coin? Rationale for Gene-Based Personalized NAFLD Treatment. Front. Pharmacol. 2019, 10, 877. [Google Scholar] [CrossRef] [Green Version]
- Fuller, J.H.; McCartney, P.; Jarrett, R.J.; Keen, H.; Rose, G.; Shipley, M.J.; Hamilton, P.J. Hyperglycaemia and coronary heart disease: The Whitehall study. J. Chronic Dis. 1979, 32, 721–728. [Google Scholar] [CrossRef]
- Balkau, B.; Shipley, M.; Jarrett, R.J.; Pyorala, K.; Pyorala, M.; Forhan, A.; Eschwège, E. High blood glucose concentration is a risk factor for mortality in middle-aged nondiabetic men. 20-year follow-up in the Whitehall Study, the Paris Prospective Study, and the Helsinki Policemen Study. Diabetes Care 1998, 21, 360–367. [Google Scholar] [CrossRef] [PubMed]
- Holman, R.R.; Paul, S.K.; Bethel, M.A.; Matthews, D.R.; Neil, H.A. 10-year follow-up of intensive glucose control in type 2 diabetes. N. Engl. J. Med. 2008, 359, 1577–1589. [Google Scholar] [CrossRef] [Green Version]
- Zoungas, S.; Chalmers, J.; Ninomiya, T.; Li, Q.; Cooper, M.E.; Colagiuri, S.; Fulcher, G.; de Galan, B.E.; Harrap, S.; Hamet, P.; et al. Association of HbA1c levels with vascular complications and death in patients with type 2 diabetes: Evidence of glycaemic thresholds. Diabetologia 2012, 55, 636–643. [Google Scholar] [CrossRef]
- American Diabetes Association. Standards of Medical Care in Diabetesd. Diabetes Care 2019, 42, S90–S102. [Google Scholar]
- Tracy, T.S.; Chaudhry, A.S.; Prasad, B.; Thummel, K.E.; Schuetz, E.G.; Zhong, X.B.; Tien, Y.C.; Jeong, H.; Pan, X.; Shireman, L.; et al. Interindividual Variability in Cytochrome P450-Mediated Drug Metabolism. Drug Metab. Dispos. 2016, 44, 343–351. [Google Scholar] [CrossRef] [Green Version]
- Dostalek, M.; Court, M.H.; Yan, B.; Akhlaghi, F. Significantly reduced cytochrome P450 3A4 expression and activity in liver from humans with diabetes mellitus. Br. J. Pharmacol. 2011, 163, 937–947. [Google Scholar] [CrossRef] [Green Version]
- Estabrook, R.W. A passion for P450s (rememberances of the early history of research on cytochrome P450). Drug Metab. Dispos. 2003, 31, 1461–1473. [Google Scholar] [CrossRef]
- Guengerich, F.P. Cytochrome P450s and other enzymes in drug metabolism and toxicity. AAPS J. 2006, 8, E101–E111. [Google Scholar] [CrossRef] [PubMed] [Green Version]
- Zanger, U.M.; Schwab, M. Cytochrome P450 enzymes in drug metabolism: Regulation of gene expression, enzyme activities, and impact of genetic variation. Pharmacol. Ther. 2013, 138, 103–141. [Google Scholar] [CrossRef] [PubMed]
- Hart, S.N.; Wang, S.; Nakamoto, K.; Wesselman, C.; Li, Y.; Zhong, X.B. Genetic polymorphisms in cytochrome P450 oxidoreductase influence microsomal P450-catalyzed drug metabolism. Pharm. Genom. 2008, 18, 11–24. [Google Scholar] [CrossRef]
- Lamba, J.K.; Lin, Y.S.; Schuetz, E.G.; Thummel, K.E. Genetic contribution to variable human CYP3A-mediated metabolism. Adv. Drug Deliv. Rev. 2002, 54, 1271–1294. [Google Scholar] [CrossRef]
- Saitoh, A.; Sarles, E.; Capparelli, E.; Aweeka, F.; Kovacs, A.; Burchett, S.K.; Wiznia, A.; Nachman, S.; Fenton, T.; Spector, S.A. CYP2B6 genetic variants are associated with nevirapine pharmacokinetics and clinical response in HIV-1-infected children. AIDS 2007, 21, 2191–2199. [Google Scholar] [CrossRef] [PubMed]
- Shah, R.R.; Smith, R.L. Addressing phenoconversion: The Achilles’ heel of personalized medicine. Br. J. Clin. Pharmacol. 2015, 79, 222–2240. [Google Scholar] [CrossRef] [PubMed] [Green Version]
- Bathum, L.; Skjelbo, E.; Mutabingwa, T.K.; Madsen, H.; Hørder, M.; Brøsen, K. Phenotypes and genotypes for CYP2D6 and CYP2C19 in a black Tanzanian population. Br. J. Clin. Pharmacol. 1999, 48, 395–401. [Google Scholar] [CrossRef] [Green Version]
- Klomp, S.D.; Manson, M.L.; Guchelaar, H.J.; Swen, J.J. Phenoconversion of Cytochrome P450 Metabolism: A Systematic Review. J. Clin. Med. 2020, 9, 2890. [Google Scholar] [CrossRef] [PubMed]
- Williams, M.L.; Bhargava, P.; Cherrouk, I.; Marshall, J.L.; Flockhart, D.A.; Wainer, I.W. A discordance of the cytochrome P450 2C19 genotype and phenotype in patients with advanced cancer. Br. J. Clin. Pharmacol. 2000, 49, 485–488. [Google Scholar] [CrossRef] [Green Version]
- Helsby, N.A.; Lo, W.-Y.; Sharples, K.; Riley, G.; Murray, M.; Spells, K.; Dzhelai, M.; Simpson, A.; Findlay, M. CYP2C19 pharmacogenetics in advanced cancer: Compromised function independent of genotype. Br. J. Cancer 2008, 99, 1251–1255. [Google Scholar] [CrossRef] [Green Version]
- Veringa, A.; Avest, M.T.; Span, L.F.; van den Heuvel, E.R.; Touw, D.J.; Zijlstra, J.G.; Kosterink, J.G.W.; van der Werf, T.S.; Alffenaar, J.W.C. Voriconazole metabolism is influenced by severe inflammation: A prospective study. J. Antimicrob. Chemother. 2017, 72, 261–267. [Google Scholar] [CrossRef]
- Ohnishi, A.; Murakami, S.; Akizuki, S.; Mochizuki, J.; Echizen, H.; Takagi, I. In Vivo metabolic activity of CYP2C19 and CYP3A in relation to CYP2C19 genetic polymorphism in chronic liver disease. J. Clin. Pharmacol. 2005, 45, 1221–1229. [Google Scholar] [CrossRef] [PubMed]
- Burns, K.E.; Goldthorpe, M.A.; Porteus, F.; Browett, P.; Helsby, N.A. CYP2C19 genotype-phenotype discordance in patients with multiple myeloma leads to an acquired loss of drug-metabolising activity. Cancer Chemother. Pharmacol. 2014, 73, 651–655. [Google Scholar] [PubMed]
- Shah, R.R.; Smith, R.L. Phenocopy and phenoconversion: Do they complicate association studies? Pharmacogenomics 2012, 13, 981–984. [Google Scholar] [CrossRef]
- Shaw, J.E.; Sicree, R.A.; Zimmet, P.Z. Global estimates of the prevalence of diabetes for 2010 and 2030. Diabetes Res. Clin. Pract. 2010, 87, 4–14. [Google Scholar] [CrossRef]
- Chan, J.C.; Malik, V.; Jia, W.; Kadowaki, T.; Yajnik, C.S.; Yoon, K.H.; Hu, F.B. Diabetes in Asia: Epidemiology, risk factors, and pathophysiology. JAMA 2009, 301, 2129–2140. [Google Scholar] [CrossRef] [PubMed]
- Shoelson, S.E.; Lee, J.; Goldfine, A.B. Inflammation and insulin resistance. J. Clin. Investig. 2006, 116, 1793–1801. [Google Scholar] [CrossRef] [PubMed]
- Kushner, I. Regulation of the acute phase response by cytokines. Perspect. Biol. Med. 1993, 36, 611–622. [Google Scholar] [CrossRef]
- Akira, S.; Taga, T.; Kishimoto, T. Interleukin-6 in biology and medicine. Adv. Immunol. 1993, 54, 1–78. [Google Scholar]
- Lechleitner, M.; Koch, T.; Herold, M.; Dzien, A.; Hoppichler, F. Tumour necrosis factor-alpha plasma level in patients with type 1 diabetes mellitus and its association with glycaemic control and cardiovascular risk factors. J. Intern. Med. 2000, 248, 67–76. [Google Scholar] [CrossRef]
- McCarty, M.F. Interleukin-6 as a central mediator of cardiovascular risk associated with chronic inflammation, smoking, diabetes, and visceral obesity: Down-regulation with essential fatty acids, ethanol and pentoxifylline. Med. Hypotheses 1999, 52, 465–477. [Google Scholar] [CrossRef] [PubMed]
- Yudkin, J.S.; Yajnik, C.S.; Mohamed-Ali, V.; Bulmer, K. High levels of circulating proinflammatory cytokines and leptin in urban, but not rural, Indians. A potential explanation for increased risk of diabetes and coronary heart disease. Diabetes Care 1999, 22, 363–364. [Google Scholar] [CrossRef]
- Hotamisligil, G.S.; Shargill, N.S.; Spiegelman, B.M. Adipose expression of tumor necrosis factor-alpha: Direct role in obesity-linked insulin resistance. Science 1993, 259, 87–91. [Google Scholar] [CrossRef] [PubMed]
- Tuttle, H.A.; Davis-Gorman, G.; Goldman, S.; Copeland, J.G.; McDonagh, P.F. Proinflammatory cytokines are increased in type 2 diabetic women with cardiovascular disease. J. Diabetes Complicat. 2004, 18, 343–351. [Google Scholar] [CrossRef]
- Bastard, J.P.; Jardel, C.; Bruckert, E.; Blondy, P.; Capeau, J.; Laville, M.; Vidal, H.; Hainque, B. Elevated levels of interleukin 6 are reduced in serum and subcutaneous adipose tissue of obese women after weight loss. J. Clin. Endocrinol. Metab. 2000, 85, 3338–3342. [Google Scholar] [PubMed]
- Shah, R.R.; Smith, R.L. Inflammation-Induced phenoconversion of polymorphic drug metabolizing enzymes: Hypothesis with implications for personalized medicine. Drug Metab. Dispos. 2015, 43, 400–410. [Google Scholar] [CrossRef] [PubMed] [Green Version]
- Marques, M.P.; Coelho, E.B.; Santos, N.A.D.; Geleilete, T.J.; Lanchote, V.L. Dynamic and kinetic disposition of nisoldipine enantiomers in hypertensive patients presenting with type-2 diabetes mellitus. Eur. J. Clin. Pharmacol. 2002, 58, 607–614. [Google Scholar] [CrossRef]
- Goldfine, A.B.; Fonseca, V.; Shoelson, S.E. Therapeutic approaches to target inflammation in type 2 diabetes. Clin. Chem. 2011, 57, 162–167. [Google Scholar] [CrossRef] [Green Version]
- Dotson, S.; Freeman, R.; Failing, H.J.; Adler, G.K. Hypoglycemia increases serum interleukin-6 levels in healthy men and women. Diabetes Care 2008, 31, 1222–1223. [Google Scholar] [CrossRef] [Green Version]
- Crook, M.A.; Tutt, P.; Pickup, J.C. Elevated serum sialic acid concentration in NIDDM and its relationship to blood pressure and retinopathy. Diabetes Care 1993, 16, 57–60. [Google Scholar] [CrossRef]
- Pickup, J.C.; Mattock, M.B.; Chusney, G.D.; Burt, D. NIDDM as a disease of the innate immune system: Association of acute-phase reactants and interleukin-6 with metabolic syndrome X. Diabetologia 1997, 40, 1286–1292. [Google Scholar] [CrossRef] [Green Version]
- Fearnley, G.R.; Vincent, C.T.; Chakrabarti, R. Reduction of blood fibrinolytic activity in diabetes mellitus by insulin. Lancet 1959, 2, 1067. [Google Scholar] [CrossRef]
- Emerging Risk Factors Collaboration; Kaptoge, S.; Angelantonio, E.D.; Lowe, G.; Pepys, M.B.; Thompson, S.G.; Collins, R.; Danesh, J. C-Reactive protein concentration and risk of coronary heart disease, stroke, and mortality: An individual participant meta-analysis. Lancet 2010, 375, 132–140. [Google Scholar]
- Morgan, E.T. Impact of infectious and inflammatory disease on cytochrome P450-mediated drug metabolism and pharmacokinetics. Clin. Pharmacol Ther. 2009, 85, 434–438. [Google Scholar] [CrossRef]
- de Jong, L.M.; Jiskoot, W.; Swen, J.J.; Manson, M.L. Distinct Effects of Inflammation on Cytochrome P450 Regulation and Drug Metabolism: Lessons from Experimental Models and a Potential Role for Pharmacogenetics. Genes 2020, 11, 1509. [Google Scholar] [CrossRef] [PubMed]
- Aitken, A.E.; Richardson, T.A.; Morgan, E.T. Regulation of drug-metabolizing enzymes and transporters in inflammation. Annu. Rev. Pharmacol. Toxicol. 2006, 46, 123–149. [Google Scholar] [CrossRef] [PubMed]
- Mallick, P.; Taneja, G.; Moorthy, B.; Ghose, R. Regulation of drug-metabolizing enzymes in infectious and inflammatory disease: Implications for biologics-small molecule drug interactions. Expert Opin. Drug Metab. Toxicol. 2017, 13, 605–616. [Google Scholar] [CrossRef] [PubMed]
- Christensen, H.; Hermann, M. Immunological response as a source to variability in drug metabolism and transport. Front. Pharmacol. 2012, 3, 8. [Google Scholar] [CrossRef] [Green Version]
- Abdel-Razzak, Z.; Loyer, P.; Fautrel, A.; Gautier, J.C.; Corcos, L.; Turlin, B.; Beaune, P.; Guillouzo, A. Cytokines down-regulate expression of major cytochrome P-450 enzymes in adult human hepatocytes in primary culture. Mol. Pharmacol. 1993, 44, 707–715. [Google Scholar] [PubMed]
- Muntane-Relat, J.; Ourlin, J.C.; Domergue, J.; Maurel, P. Differential effects of cytokines on the inducible expression of CYP1A1, CYP1A2, and CYP3A4 in human hepatocytes in primary culture. Hepatology 1995, 22 Pt 1, 1143–1153. [Google Scholar] [CrossRef]
- Chen, Y.L.; Florentin, I.; Batt, A.M.; Ferrari, L.; Giroud, J.P.; Chauvelot-Moachon, L. Effects of interleukin-6 on cytochrome P450-dependent mixed-function oxidases in the rat. Biochem. Pharmacol. 1992, 44, 137–148. [Google Scholar] [CrossRef]
- Pous, C.; Giroud, J.P.; Damais, C.; Raichvarg, D.; Chauvelot-Moachon, L. Effect of recombinant human interleukin-1 beta and tumor necrosis factor alpha on liver cytochrome P-450 and serum alpha-1-acid glycoprotein concentrations in the rat. Drug Metab. Dispos. 1990, 18, 467–470. [Google Scholar] [PubMed]
- Craig, P.I.; Tapner, M.; Farrell, G.C. Interferon suppresses erythromycin metabolism in rats and human subjects. Hepatology 1993, 17, 230–235. [Google Scholar] [CrossRef] [PubMed]
- Kacevska, M.; Robertson, G.R.; Clarke, S.J.; Liddle, C. Inflammation and CYP3A4-mediated drug metabolism in advanced cancer: Impact and implications for chemotherapeutic drug dosing. Expert Opin. Drug Metab. Toxicol. 2008, 4, 137–149. [Google Scholar] [CrossRef]
- Donahue, B.S.; Morgan, E.T. Effects of vanadate on hepatic cytochrome P-450 expression in streptozotocin-diabetic rats. Drug Metab. Dispos. 1990, 18, 519–526. [Google Scholar] [PubMed]
- Morgan, E.T.; Goralski, K.B.; Piquette-Miller, M.; Renton, K.W.; Robertson, G.R.; Chaluvadi, M.R.; Charles, K.A.; Clarke, S.J.; Kacevska, M.; Liddle, C.; et al. Regulation of drug-metabolizing enzymes and transporters in infection, inflammation, and cancer. Drug Metab. Dispos. 2008, 36, 205–216. [Google Scholar] [CrossRef] [Green Version]
- Morohoshi, M.; Fujisawa, K.; Uchimura, I.; Numano, F. Glucose-Dependent interleukin 6 and tumor necrosis factor production by human peripheral blood monocytes In Vitro. Diabetes 1996, 45, 954–959. [Google Scholar] [CrossRef] [PubMed]
- Hancu, N.; Netea, M.G.; Baciu, I. High glucose concentrations increase the tumor necrosis factor-alpha production capacity by human peripheral blood mononuclear cells. Rom. J. Physiol. 1998, 35, 325–330. [Google Scholar]
- de Galan, B.E.; Netea, M.G.; Smits, P.; van der Meer, J.W. Hypoglycaemia downregulates endotoxin-induced production of tumour necrosis factor-alpha, but does not affect IL-1beta, IL-6, or IL-10. Cytokine 2003, 22, 71–76. [Google Scholar] [CrossRef]
- Kany, S.; Vollrath, J.T.; Relja, B. Cytokines in Inflammatory Disease. Int. J. Mol. Sci. 2019, 20, 6008. [Google Scholar] [CrossRef] [Green Version]
- Konukoglu, D.; Hatemi, H.; Bayer, H.; Bagriacik, N. Relationship between serum concentrations of interleukin-6 and tumor necrosis factor alpha in female Turkish subjects with normal and impaired glucose tolerance. Horm. Metab. Res. 2006, 38, 34–37. [Google Scholar] [CrossRef]
- Guha, M.; Bai, W.; Nadler, J.L.; Natarajan, R. Molecular mechanisms of tumor necrosis factor alpha gene expression in monocytic cells via hyperglycemia-induced oxidant stress-dependent and -independent pathways. J. Biol. Chem. 2000, 275, 17728–17739. [Google Scholar] [CrossRef] [PubMed] [Green Version]
- Mishima, Y.; Kuyama, A.; Tada, A.; Takahashi, K.; Ishioka, T.; Kibata, M. Relationship between serum tumor necrosis factor-alpha and insulin resistance in obese men with Type 2 diabetes mellitus. Diabetes Res. Clin. Pract. 2001, 52, 119–123. [Google Scholar] [CrossRef]
- Lofgren, P.; van Harmelen, V.; Reynisdottir, S.; Naslund, E.; Ryden, M.; Rossner, S.; Arner, P. Secretion of tumor necrosis factor-alpha shows a strong relationship to insulin-stimulated glucose transport in human adipose tissue. Diabetes 2000, 49, 688–692. [Google Scholar] [CrossRef] [Green Version]
- Mendonza, A.E.; Gohh, R.Y.; Akhlaghi, F. Blood and plasma pharmacokinetics of ciclosporin in diabetic kidney transplant recipients. Clin. Pharmacokinet. 2008, 47, 733–742. [Google Scholar] [CrossRef] [PubMed]
- Jamwal, R.; de la Monte, S.M.; Ogasawara, K.; Adusumalli, S.; Barlock, B.B.; Akhlaghi, F. Nonalcoholic Fatty Liver Disease and Diabetes Are Associated with Decreased CYP3A4 Protein Expression and Activity in Human Liver. Mol. Pharm. 2018, 15, 2621–2632. [Google Scholar] [CrossRef] [PubMed]
- Urry, E.; Jetter, A.; Landolt, H.P. Assessment of CYP1A2 enzyme activity in relation to type-2 diabetes and habitual caffeine intake. Nutr. Metab. (Lond.) 2016, 13, 66. [Google Scholar] [CrossRef] [PubMed] [Green Version]
- Sotaniemi, E.A. Diabetes and Elimination of Antipyrine inMan: An Analysis of 298 Patients Classified by Type of Diabetes, Age, Sex, Duration ofDisease and Liver Involvement. Pharmacol. Toxicol. 2002, 90, 155–160. [Google Scholar] [CrossRef] [PubMed]
- Wang, T.; Shankar, K.; Ronis, M.J.; Mehendale, H.M. Mechanisms and outcomes of drug- and toxicant-induced liver toxicity in diabetes. Crit. Rev. Toxicol. 2007, 37, 413–459. [Google Scholar] [CrossRef]
- Martignoni, M.; Groothuis, G.M.; de Kanter, R. Species differences between mouse, rat, dog, monkey and human CYP-mediated drug metabolism, inhibition and induction. Expert Opin. Drug Metab. Toxicol. 2006, 2, 875–894. [Google Scholar] [CrossRef] [PubMed]
- Shimojo, N.; Ishizaki, T.; Imaoka, S.; Funae, Y.; Fujii, S.; Okuda, K. Changes in amounts of cytochrome P450 isozymes and levels of catalytic activities in hepatic and renal microsomes of rats with streptozocin-induced diabetes. Biochem. Pharmacol. 1993, 46, 621–627. [Google Scholar] [CrossRef]
- Kim, Y.C.; Lee, A.K.; Lee, J.H.; Lee, I.; Lee, D.C.; Kim, S.H.; Kim, S.G.; Lee, M.G. Pharmacokinetics of theophylline in diabetes mellitus rats: Induction of CYP1A2 and CYP2E1 on 1,3-dimethyluric acid formation. Eur. J. Pharm. Sci. 2005, 26, 114–123. [Google Scholar] [CrossRef]
- Chen, G.M.; Hu, N.; Liu, L.; Xie, S.S.; Wang, P.; Li, J.; Xie, L.; Wang, G.J.; Liu, X.D. Pharmacokinetics of verapamil in diabetic rats induced by combination of high-fat diet and streptozotocin injection. Xenobiotica 2011, 41, 494–500. [Google Scholar] [CrossRef]
- Raza, H.; Ahmed, I.; John, A.; Sharma, A.K. Modulation of xenobiotic metabolism and oxidative stress in chronic streptozotocin-induced diabetic rats fed with Momordica charantia fruit extract. J. Biochem. Mol. Toxicol. 2000, 14, 131–139. [Google Scholar] [CrossRef]
- Bellward, G.D.; Chang, T.; Rodrigues, B.; McNeill, J.H.; Maines, S.; Ryan, D.E.; Levin, W.; Thomas, P.E. Hepatic cytochrome P-450j induction in the spontaneously diabetic BB rat. Mol. Pharmacol. 1988, 33, 140–143. [Google Scholar] [PubMed]
- Abdelmegeed, M.A.; Carruthers, N.J.; Woodcroft, K.J.; Kim, S.K.; Novak, R.F. Acetoacetate induces CYP2E1 protein and suppresses CYP2E1 mRNA in primary cultured rat hepatocytes. J. Pharmacol. Exp. Ther. 2005, 315, 203–213. [Google Scholar] [CrossRef]
- Shimojo, N. Cytochrome P450 changes in rats with streptozocin-induced diabetes. Int. J. Biochem. 1994, 26, 1261–1268. [Google Scholar]
- Woodcroft, K.J.; Hafner, M.S.; Novak, R.F. Insulin signaling in the transcriptional and posttranscriptional regulation of CYP2E1 expression. Hepatology 2002, 35, 263–273. [Google Scholar] [CrossRef] [PubMed]
- Favreau, L.V.; Schenkman, J.B. Composition changes in hepatic microsomal cytochrome P-450 during onset of streptozocin-induced diabetes and during insulin treatment. Diabetes 1988, 37, 577–584. [Google Scholar] [CrossRef] [PubMed]
- Chen, G.F.; Ronis, M.J.; Ingelman-Sundberg, M.; Badger, T.M. Hormonal regulation of microsomal cytochrome P4502E1 and P450 reductase in rat liver and kidney. Xenobiotica 1999, 29, 437–451. [Google Scholar] [CrossRef]
- Woodcroft, K.J.; Novak, R.F. Insulin effects on CYP2E1, 2B, 3A, and 4A expression in primary cultured rat hepatocytes. Chem. Biol. Interact. 1997, 107, 75–91. [Google Scholar] [CrossRef]
- Maximos, S.; Chamoun, M.; Gravel, S.; Turgeon, J.; Michaud, V. Tissue Specific Modulation of cyp2c and cyp3a mRNA Levels and Activities by Diet-Induced Obesity in Mice: The Impact of Type 2 Diabetes on Drug Metabolizing Enzymes in Liver and Extra-Hepatic Tissues. Pharmaceutics 2017, 9, 40. [Google Scholar] [CrossRef] [Green Version]
- Gawronska-Szklarz, B.; Musial, D.H.; Pawlik, A.; Paprota, B. Effect of experimental diabetes on pharmacokinetic parameters of lidocaine and MEGX in rats. Pol. J. Pharmacol. 2003, 55, 619–624. [Google Scholar]
- Hu, N.; Xie, S.; Liu, L.; Wang, X.; Pan, X.; Chen, G.; Zhang, L.; Liu, H.; Liu, X.; Liu, X.; et al. Opposite effect of diabetes mellitus induced by streptozotocin on oral and intravenous pharmacokinetics of verapamil in rats. Drug Metab. Dispos. 2011, 39, 419–425. [Google Scholar] [CrossRef] [PubMed] [Green Version]
- Ueyama, J.; Wang, D.; Kondo, T.; Saito, I.; Takagi, K.; Takagi, K.; Kamijima, M.; Nakajima, T.; Miyamoto, K.I.; Wakusawa, S.; et al. Toxicity of diazinon and its metabolites increases in diabetic rats. Toxicol. Lett. 2007, 170, 229–237. [Google Scholar] [CrossRef] [PubMed]
- Bae, S.K.; Kim, J.Y.; Yang, S.H.; Kim, J.W.; Kim, T.; Lee, M.G. Pharmacokinetics of oltipraz in rat models of diabetes mellitus induced by alloxan or streptozotocin. Life Sci. 2006, 78, 2287–2294. [Google Scholar] [CrossRef]
- Xu, F.; Zhu, L.; Qian, C.; Zhou, J.; Geng, D.; Li, P.; Xuan, W.; Wu, F.; Zhao, K.; Kong, W.; et al. Impairment of Intestinal Monocarboxylate Transporter 6 Function and Expression in Diabetic Rats Induced by Combination of High-Fat Diet and Low Dose of Streptozocin: Involvement of Butyrate-Peroxisome Proliferator-Activated Receptor-gamma Activation. Drug Metab. Dispos. 2019, 47, 556–566. [Google Scholar] [CrossRef] [PubMed]
- Liu, H.; Liu, L.; Li, J.; Mei, D.; Duan, R.; Hu, N.; Guo, H.; Zhong, Z.; Liu, X. Combined contributions of impaired hepatic CYP2C11 and intestinal breast cancer resistance protein activities and expression to increased oral glibenclamide exposure in rats with streptozotocin-induced diabetes mellitus. Drug Metab. Dispos. 2012, 40, 1104–1112. [Google Scholar] [CrossRef] [PubMed]
- Kim, Y.C.; Kang, H.E.; Lee, M.G. Pharmacokinetics of phenytoin and its metabolite, 4’-HPPH, after intravenous and oral administration of phenytoin to diabetic rats induced by alloxan or streptozotocin. Biopharm. Drug Dispos. 2008, 29, 51–61. [Google Scholar] [CrossRef] [PubMed]
- Liu, Y.; Nakagawa, Y.; Wang, Y.; Sakurai, R.; Tripathi, P.V.; Lutfy, K.; Friedman, T.C. Increased glucocorticoid receptor and 11{beta}-hydroxysteroid dehydrogenase type 1 expression in hepatocytes may contribute to the phenotype of type 2 diabetes in db/db mice. Diabetes 2005, 54, 32–40. [Google Scholar] [CrossRef] [PubMed] [Green Version]
- Schuetz, E.G.; Schmid, W.; Schutz, G.; Brimer, C.; Yasuda, K.; Kamataki, T.; Bornheim, L.; Myles, K.; Cole, T.J. The glucocorticoid receptor is essential for induction of cytochrome P-4502B by steroids but not for drug or steroid induction of CYP3A or P-450 reductase in mouse liver. Drug Metab. Dispos. 2000, 28, 268–278. [Google Scholar] [PubMed]
- Lam, J.L. Expression and Functional Analysis of Hepatic Cytochromes P450, Nuclear Receptors, and Membrane Transporters in 10- and 25-Week-Old db/db Mice. Drug Metab. Dispos. 2010, 38, 2252–2258. [Google Scholar] [CrossRef]
- Verrecchia, A.; Guaitani, A. Insulin-Mimetic effects of vanadate in preventing the increase of P450IIIA and P450IA subfamily proteins in streptozotocin-diabetic rats. Acta Diabetol. 1993, 30, 128–131. [Google Scholar] [CrossRef]
- Barnett, C.R.; Gibson, G.G.; Wolf, C.R.; Flatt, P.R.; Ioannides, C. Induction of cytochrome P450III and P450IV family proteins in streptozotocin-induced diabetes. Biochem. J. 1990, 268, 765–769. [Google Scholar] [CrossRef] [PubMed] [Green Version]
- Kudo, T.; Toda, T.; Ushiki, T.; Ohi, K.; Ikarashi, N.; Ochiai, W.; Sugiyama, K.l. Differences in the pharmacokinetics of Cyp3a substrates in TSOD and streptozotocin-induced diabetic mice. Xenobiotica 2010, 40, 282–290. [Google Scholar] [CrossRef] [PubMed]
- Thummel, K.E.; Schenkman, J.B. Effects of testosterone and growth hormone treatment on hepatic microsomal P450 expression in the diabetic rat. Mol. Pharmacol. 1990, 37, 119–129. [Google Scholar]
- Zhou, X.; Rougee, L.R.; Bedwell, D.W.; Cramer, J.W.; Mohutsky, M.A.; Calvert, N.A.; Moulton, R.D.; Cassidy, K.C.; Yumibe, N.P.; Adams, L.A.; et al. Difference in the Pharmacokinetics and Hepatic Metabolism of Antidiabetic Drugs in Zucker Diabetic Fatty and Sprague-Dawley Rats. Drug Metab. Dispos. 2016, 44, 1184–1192. [Google Scholar] [CrossRef] [Green Version]
- Wang, Z.; Yang, H.; Xu, J.; Zhao, K.; Chen, Y.; Liang, L.; Li, P.; Chan, N.; Geng, D.; Zhang, X.; et al. Prediction of Atorvastatin Pharmacokinetics in High-Fat Diet and Low-Dose Streptozotocin-Induced Diabetic Rats Using a Semiphysiologically Based Pharmacokinetic Model Involving Both Enzymes and Transporters. Drug Metab. Dispos. 2019, 47, 1066–1079. [Google Scholar] [CrossRef] [PubMed]
- Borbas, T.; Benko, B.; Dalmadi, B.; Szabo, I.; Tihanyi, K. Insulin in flavin-containing monooxygenase regulation. Flavin-containing monooxygenase and cytochrome P450 activities in experimental diabetes. Eur. J. Pharm. Sci. 2006, 28, 51–58. [Google Scholar] [CrossRef]
- Kroetz, D.L.; Yook, P.; Costet, P.; Bianchi, P.; Pineau, T. Peroxisome proliferator-activated receptor alpha controls the hepatic CYP4A induction adaptive response to starvation and diabetes. J. Biol. Chem. 1998, 273, 31581–31589. [Google Scholar] [CrossRef] [Green Version]
- Lee, D.Y.; Lee, M.G.; Shin, H.S.; Lee, I. Changes in omeprazole pharmacokinetics in rats with diabetes induced by alloxan or streptozotocin: Faster clearance of omeprazole due to induction of hepatic CYP1A2 and 3A1. J. Pharm. Pharm. Sci. 2007, 10, 420–433. [Google Scholar] [CrossRef] [PubMed] [Green Version]
- Kim, Y.C.; Oh, E.Y.; Kim, S.H.; Lee, M.G. Pharmacokinetics of diclofenac in rat model of diabetes mellitus induced by alloxan or steptozotocin. Biopharm. Drug Dispos. 2005, 27, 85–92. [Google Scholar] [CrossRef] [PubMed]
- Jain, S.; Zharikova, O.L.; Ravindran, S.; Nanovskya, T.N.; Mattison, D.R.; Hankins, G.D.; Ahmed, M.S. Glyburide metabolism by placentas of healthy and gestational diabetics. Am. J. Perinatol. 2008, 25, 169–174. [Google Scholar] [CrossRef] [PubMed]
- Moisés, E.C.D.; Duarte, L.D.B.; Cavalli, R.D.C.; Marques, M.P.; Lanchote, V.L.; Duarte, G.; da Cunha, S.P. Pharmacokinetics of lidocaine and its metabolite in peridural anesthesia administered to pregnant women with gestational diabetes mellitus. Eur. J. Clin. Pharmacol. 2008, 64, 1189–1196. [Google Scholar] [CrossRef]
- Akhlaghi, F.; Dostalek, M.; Falck, P.; E Mendonza, A.; Amundsen, R.; Gohh, R.Y.; Asberg, A. The concentration of cyclosporine metabolites is significantly lower in kidney transplant recipients with diabetes mellitus. Ther. Drug Monit. 2012, 34, 38–45. [Google Scholar] [CrossRef] [PubMed]
- Jacobson, P.A.; Oetting, W.S.; Brearley, A.M.; LeDuc, R.; Guan, W.; Schladt, D.; Matas, A.; Lamba, V.; Julian, B.A.; Mannon, R.B.; et al. Novel polymorphisms associated with tacrolimus trough concentrations: Results from a multicenter kidney transplant consortium. Transplantation 2011, 91, 300–308. [Google Scholar] [CrossRef]
- Korrapati, M.R.; Vestal, R.E.; Loi, C.M. Theophylline metabolism in healthy nonsmokers and in patients with insulin-dependent diabetes mellitus. Clin. Pharmacol. Ther. 1995, 57, 413–418. [Google Scholar] [CrossRef]
- Hall, H.M.; Banerjee, S.; McGuire, D.K. Variability of clopidogrel response in patients with type 2 diabetes mellitus. Diabetes Vasc. Dis. Res. 2011, 8, 245–253. [Google Scholar] [CrossRef]
- Gravel, S.; Chiasson, J.; Turgeon, J.; Grangeon, A.; Michaud, V. Modulation of CYP450 Activities in Patients with Type 2 Diabetes. Clin. Pharmacol. Ther. 2019, 106, 1280–1289. [Google Scholar] [CrossRef]
- Dickmann, L.J.; Patel, S.K.; Rock, D.A.; Wienkers, L.C.; Slatter, J.G. Effects of interleukin-6 (IL-6) and an anti-IL-6 monoclonal antibody on drug-metabolizing enzymes in human hepatocyte culture. Drug Metab. Dispos. 2011, 39, 1415–1422. [Google Scholar] [CrossRef] [Green Version]
- Vahabzadeh, M. Effect of Diabetes Mellitus on the Metabolism of Drugs and Toxins. J. Clin. Toxicol. 2015, 5, 2161-0495. [Google Scholar]
- Kirchheiner, J.; Brockmoller, J.; Meineke, I.; Bauer, S.; Rohde, W.; Meisel, C.; Roots, I. Impact of CYP2C9 amino acid polymorphisms on glyburide kinetics and on the insulin and glucose response in healthy volunteers. Clin. Pharmacol. Ther. 2002, 71, 286–296. [Google Scholar] [CrossRef] [PubMed]
- Rydberg, T.; Wahlin-Boll, E.; Melander, A. Determination of glibenclamide and its two major metabolites in human serum and urine by column liquid chromatography. J. Chromatogr. 1991, 564, 223–233. [Google Scholar] [CrossRef]
- Fujino, H.; Saito, T.; Tsunenari, Y.; Kojima, J.; Sakaeda, T. Metabolic properties of the acid and lactone forms of HMG-CoA reductase inhibitors. Xenobiotica 2004, 34, 961–971. [Google Scholar] [CrossRef]
- Kasiske, B.L.; Snyder, J.J.; Gilbertson, D.; Matas, A.J. Diabetes mellitus after kidney transplantation in the United States. Am. J. Transplant. 2003, 3, 178–185. [Google Scholar] [CrossRef]
- Fahr, A. Cyclosporin clinical pharmacokinetics. Clin. Pharmacokinet. 1993, 24, 472–495. [Google Scholar] [CrossRef]
- Hryniewiecka, E.; Zegarska, J.; Zochowska, D.; Samborowska, E.; Jazwiec, R.; Kosieradzki, M.; Nazarewski, S.; Dadlez, M.; Pączek, L. Cyclosporine Metabolites’ Metabolic Ratios May Be Markers of Cardiovascular Disease in Kidney Transplant Recipients Treated with Cyclosporine A-Based Immunosuppression Regimens. Cardiovasc. Toxicol. 2019, 19, 255–263. [Google Scholar] [CrossRef]
- Mancinelli, L.M.; Frassetto, L.; Floren, L.C.; Dressler, D.; Carrier, S.; Bekersky, I.; Benet, L.Z.; Christians, U. The pharmacokinetics and metabolic disposition of tacrolimus: A comparison across ethnic groups. Clin. Pharmacol. Ther. 2001, 69, 24–31. [Google Scholar] [CrossRef]
- Sattler, M.; Guengerich, F.P.; Yun, C.H.; Christians, U.; Sewing, K.F. Cytochrome P-450 3A enzymes are responsible for biotransformation of FK506 and rapamycin in man and rat. Drug Metab. Dispos. 1992, 20, 753–761. [Google Scholar]
- Lecointre, K.; Furlan, V.; Taburet, A.-M. In vitro effects of tacrolimus on human cytochrome P450. Fundam. Clin. Pharmacol. 2002, 16, 455–460. [Google Scholar] [CrossRef] [PubMed]
- Hong, C.-C. Cytochrome P450 1A2 (CYP1A2) activity and risk factors for breast cancer: A cross-sectional study. Breast Cancer Res. 2004, 6, R352–R365. [Google Scholar] [CrossRef] [PubMed] [Green Version]
- Beischlag, T.V.; Morales, J.L.; Hollingshead, B.D.; Perdew, G.H. The aryl hydrocarbon receptor complex and the control of gene expression. Crit. Rev. Eukaryot. Gene Expr. 2008, 18, 207–250. [Google Scholar] [CrossRef] [PubMed] [Green Version]
- Matzke, G.R.; Frye, R.F.; Early, J.J.; Straka, R.J.; Carson, S.W. Evaluation of the influence of diabetes mellitus on antipyrine metabolism and CYP1A2 and CYP2D6 activity. Pharmacotherapy 2000, 20, 182–190. [Google Scholar] [CrossRef] [PubMed]
- Villeneuve, J.P.; Pichette, V. Cytochrome P450 and liver diseases. Curr. Drug Metab. 2004, 5, 273–282. [Google Scholar] [CrossRef]
- Pucci, L.; Chirulli, V.; Marini, S.; Lucchesi, D.; Penno, G.; Gervasi, P.G.; Del Prato, S.; Longo, V. Expression and activity of CYP2E1 in circulating lymphocytes are not altered in diabetic individuals. Pharmacol. Res. 2005, 51, 561–565. [Google Scholar] [CrossRef]
- Drolet, B.; Pilote, S.; Gélinas, C.; Kamaliza, A.-D.; Blais-Boilard, A.; Virgili, J.; Patione, D.; Simard, C. Altered Protein Expression of Cardiac CYP2J and Hepatic CYP2C, CYP4A, and CYP4F in a Mouse Model of Type II Diabetes-A Link in the Onset and Development of Cardiovascular Disease? Pharmaceutics 2017, 9, 44. [Google Scholar] [CrossRef] [Green Version]
- Neyshaburinezhad, N.; Rouini, M.R.; Entezari, H.; Lavasani, H.; Ardakani, Y.H. Evaluation of changes in cytochrome P450 2C19 activity in type 2 diabetic rats before and after treatment, by using isolated perfused liver model. Iran. J. Basic Med. Sci. 2020, 23, 629–635. [Google Scholar] [PubMed]
- Angiolillo, D.J.; Fernandez-Ortiz, A.; Bernardo, E.; Ramírez, C.; Sabaté, M.; Jimenez-Quevedo, P.; Hernandez, R.; Morena, R.; Escaned, J.; Alfonso, F.; et al. Platelet function profiles in patients with type 2 diabetes and coronary artery disease on combined aspirin and clopidogrel treatment. Diabetes 2005, 54, 2430–2435. [Google Scholar] [CrossRef] [Green Version]
- Kazui, M.; Nishiya, Y.; Ishizuka, T.; Hagihara, K.; Farid, N.A.; Okazaki, O.; Ikeda, T.; Kurihara, A. Identification of the human cytochrome P450 enzymes involved in the two oxidative steps in the bioactivation of clopidogrel to its pharmacologically active metabolite. Drug Metab. Dispos. 2010, 38, 92–99. [Google Scholar] [CrossRef] [Green Version]
- Sun, Y.; Venugopal, J.; Guo, C.; Fan, Y.; Li, J.; Gong, Y.; Chan, Y.E.; Zhang, H.; Eitzman, D.T. Clopidogrel Resistance in a Murine Model of Diet-Induced Obesity Is Mediated by the Interleukin-1 Receptor and Overcome With DT-678. Arter. Thromb. Vasc. Biol. 2020, 40, 1533–1542. [Google Scholar]
- Sugidachi, A.; Ohno, K.; Jakubowski, J.A.; Ito, Y.; Tomizawa, A.; Mizuno, M. Induction of Diabetes Abolishes the Antithrombotic Effect of Clopidogrel in Apolipoprotein E-Deficient Mice. TH Open 2017, 1, e92–e100. [Google Scholar] [CrossRef] [Green Version]
- Erlinge, D.; Varenhorst, C.; Braun, O.O.; James, S.; Winters, K.J.; Jakubowski, J.A.; Brandt, J.T.; Sugidachi, A.; Siegbahn, A.; Wallentin, L. Patients with poor responsiveness to thienopyridine treatment or with diabetes have lower levels of circulating active metabolite, but their platelets respond normally to active metabolite added ex vivo. J. Am. Coll. Cardiol. 2008, 52, 1968–1977. [Google Scholar] [CrossRef] [Green Version]
- Sweeny, J.M.; Angiolillo, D.J.; Franchi, F.; Rollini, F.; Waksman, R.; Raveendran, G.; Dangas, G.; Khan, N.D.; Carlson, G.f.; Zhao, Y.; et al. Impact of Diabetes Mellitus on the Pharmacodynamic Effects of Ticagrelor Versus Clopidogrel in Troponin-Negative Acute Coronary Syndrome Patients Undergoing Ad Hoc Percutaneous Coronary Intervention. J. Am. Heart Assoc. 2017, 6, e005650. [Google Scholar] [CrossRef] [PubMed]
- Schuette, C.; Steffens, D.; Witkowski, M.; Stellbaum, C.; Bobbert, P.; Schultheiss, H.-P.; Rauch, U. The effect of clopidogrel on platelet activity in patients with and without type-2 diabetes mellitus: A comparative study. Cardiovasc. Diabetol. 2015, 14, 15. [Google Scholar] [CrossRef] [PubMed] [Green Version]
- Cavallari, L.H.; Lee, C.R.; Beitelshees, A.L.; Cooper-DeHoff, R.M.; Duarte, J.D.; Voora, D.; Kimmel, S.E.; McDonough, C.W.; Gong, Y.; Dave, C.V.; et al. Multisite Investigation of Outcomes with Implementation of CYP2C19 Genotype-Guided Antiplatelet Therapy After Percutaneous Coronary Intervention. JACC Cardiovasc. Interv. 2018, 11, 181–191. [Google Scholar] [CrossRef] [PubMed]
- Frye, R.F.; Schneider, V.M.; Frye, C.S.; Feldman, A.M. Plasma levels of TNF-alpha and IL-6 are inversely related to cytochrome P450-dependent drug metabolism in patients with congestive heart failure. J. Card. Fail. 2002, 8, 315–319. [Google Scholar] [CrossRef] [PubMed]
- Bogman, K.; Silkey, M.; Chan, S.P.; Tomlinson, B.; Weber, C. Influence of CYP2C19 genotype on the pharmacokinetics of R483, a CYP2C19 substrate, in healthy subjects and type 2 diabetes patients. Eur. J. Clin. Pharmacol. 2010, 66, 1005–1015. [Google Scholar] [CrossRef] [PubMed]


| Studies | n | P450s Studied | Effects (mRNA Protein, Activity) | Drug/Probe Level Change | References |
|---|---|---|---|---|---|
| Animals | |||||
| Liver microsomes from STZ-induced diabetic rats | 6 | 1a1 | Protein levels increased | - | [85] |
| 2e1 | Protein levels increased 4-fold | - | |||
| 4a1 | Protein levels increased 2-fold | - | |||
| Liver microsomes from High-Fat diet (HFD) mice | 45 HFD vs. ND | 3a11/25 | Decreased activity and mRNA levels | Deceased rate of 1-OH-midazolam formation | [93] |
| 2c | Decreased activity and mRNA levels | Decreased rate of M1-repaglinide and OH-tolbutamide formation | |||
| 2b | Decreased activity and mRNA levels | Decreased rate of OH-bupropion formation | |||
| 2d | No change in activity and mRNA levels | No change in OH-bufuralol formation rate | |||
| Liver microsomes from STZ-induced diabetic rats | 12 | 3a2/1 | Protein levels increased 1.5 to 2.5-fold | Verapamil AUC decreased by 22% | [95] |
| Protein levels decreased by 67–32% | Decreased AUCnorverapamil/AUCverapamil by 62% | ||||
| STZ-induced diabetic rats | 18 | 1a2 | Increased activity | Lidocaine decreased levels 3.4-fold | [94] |
| Increased activity | Monoethyl-glycylxylidide (MEGX) increased levels/AUC 2.0 to 2.3-fold | ||||
| Alloxan-induced diabetic rats | 8 | 1a2 | mRNA levels and expression increased 3.4-fold | Oltipraz decreased AUC by 40% | [97] |
| 2b1 | mRNA levels and expression increased 1.9- fold | Oltipraz decreased AUC by 40% | |||
| 3a1 | mRNA levels and expression increased 1.6-fold | Oltipraz decreased AUC by 40% | |||
| Liver microsomes from Alloxan- induced diabetic rats | 8 | 1a2 | mRNA levels and expression increased | Omeprazole faster CLNR | [112] |
| Liver microsomes from STZ-induced diabetic rats | 4 | 1a2 | Increased protein levels | Antipyrine increased CL 1.5-fold | [96] |
| Liver microsomes from Alloxan-induced diabetic rats | 6 | 1a2 | mRNA levels and expression increased 3-fold | Theophylline decreased AUC by 26.1% | [83] |
| 2e1 | mRNA levels and expression increased 3-fold | Theophylline decreased AUC by 26% | |||
| Liver microsomes from Alloxan-induced diabetic rats | 6 | 1a2 | mRNA levels and expression increased 3-fold | 1,3-Dimethyluric acid (1,3-DMU) increased AUC by 110% | [83] |
| Liver microsomes from Alloxan-induced diabetic rats | 9 | 2c11 | mRNA levels and expression decreased | Diclofenac slower CLNR 1.3-fold and increased AUC 1.2-fold | [113] |
| Liver microsomes from STZ-induced diabetic rats | 7 | 2c11 | Protein levels and expression decreased by 20% | Glibenclamide increased AUC 5.8-fold | [99] |
| Alloxan-induced diabetic rats | 8 | 2c6 | Protein expression increased | Phenytoin increased CLNR | [100] |
| STZ-induced diabetic rats | 5 | 3a4 | Increased expression | Atorvastatin decreased AUC 1.7-fold | [109] |
| Liver microsomes from STZ-induced diabetic rats | 4 | 2e1 | mRNA level and expression increased | - | [85] |
| Liver microsomes from Zucker diabetic fatty rats | 6 | 4a1/2/3 | mRNA and protein levels increased 3-8-fold | - | [111] |
| In vitro | |||||
| Primary cultured rat hepatocytes | 6 | 2b | mRNA and protein levels increased 2-fold | - | [92] |
| 2e1 | mRNA and protein levels increased 5-fold | - | |||
| Human | |||||
| HLM from diabetic patients | 6 patients with T2DM vs. no T2DM | 3A4 | mRNA and protein levels decreased 1.5-fold | - | [20] |
| 2E1 | mRNA and protein levels increased 2.5-fold | - | |||
| HLM from Gestational diabetic patients | 9 patients with GDM vs. GDM with Glyburide | 2C9 | Decreased metabolism | Glyburide (decreased rate of metabolite formation) | [114] |
| Gestational diabetic patients | 6 patients with GDM vs. no GDM | 1A2 | Decreased expression | Lidocaine increased AUC 1.8-fold | [115] |
| 3A4 | Decreased expression | Lidocaine increased AUC 1.8-fold | |||
| Diabetic patients | 9 patients with T2DM vs. no T2DM | 3A4 | Decreased activity | Nisoldipine decreased CL 1.7-fold | [48] |
| HLM from diabetic patients | 6 liver samples from T2DM vs. no T2DM | 3A4 | Decreased expression | Atorvastatin lactone decreased CL | [20] |
| Diabetic patients | 7 patients with T2DM vs. no T2DM | 3A4 | Decreased expression | Cyclosporine decreased AUC | [116] |
| Diabetic patients | 225 kidney transplant T2DM patients vs. no T2DM | 3A4/5 | Decreased activity | Tacrolimus increased trough levels | [117] |
| Diabetic patients | 8 patients with T2DM vs. no T2DM | 1A2 | Increased activity | Theophylline increased CL | [118] |
| Diabetic patients | 57 patients with T2DM vs. no T2DM | 1A2 | Increased activity | Caffeine decreased plasma levels | [78] |
| Diabetic patients | 2C19 | Increased expression and activity | Clopidogrel decreased plasma levels | [119] | |
| Diabetic Patients | 35 patients with T2DM vs. 38 patients no T2DM | 1A2 | Increased Activity | C4 hr paraxanthine/C4 hr caffeine | [120] |
| 2C19 | Decreased Activity | Decreased AUC0-8 hr OH-omeprazole/AUC0-8 hr omeprazole 1.9-fold | |||
| 2B6 | Decreased Activity | Decreased Ae0-8 hr OH-bupropion/Ae0-8 hr bupropion by 18-fold | |||
| 3A | Decreased Activity | Decreased AUC0-8 hr OH-midazolam/AUC0-8 hr midazolam 1.6-fold | |||
Publisher’s Note: MDPI stays neutral with regard to jurisdictional claims in published maps and institutional affiliations. |
© 2021 by the authors. Licensee MDPI, Basel, Switzerland. This article is an open access article distributed under the terms and conditions of the Creative Commons Attribution (CC BY) license (https://creativecommons.org/licenses/by/4.0/).
Share and Cite
Darakjian, L.; Deodhar, M.; Turgeon, J.; Michaud, V. Chronic Inflammatory Status Observed in Patients with Type 2 Diabetes Induces Modulation of Cytochrome P450 Expression and Activity. Int. J. Mol. Sci. 2021, 22, 4967. https://0-doi-org.brum.beds.ac.uk/10.3390/ijms22094967
Darakjian L, Deodhar M, Turgeon J, Michaud V. Chronic Inflammatory Status Observed in Patients with Type 2 Diabetes Induces Modulation of Cytochrome P450 Expression and Activity. International Journal of Molecular Sciences. 2021; 22(9):4967. https://0-doi-org.brum.beds.ac.uk/10.3390/ijms22094967
Chicago/Turabian StyleDarakjian, Lucy, Malavika Deodhar, Jacques Turgeon, and Veronique Michaud. 2021. "Chronic Inflammatory Status Observed in Patients with Type 2 Diabetes Induces Modulation of Cytochrome P450 Expression and Activity" International Journal of Molecular Sciences 22, no. 9: 4967. https://0-doi-org.brum.beds.ac.uk/10.3390/ijms22094967