
Molecular Imprinting Technology for Determination of Uric Acid

 , ,
, ,  , and
, and 
Abstract
:
1. Introduction
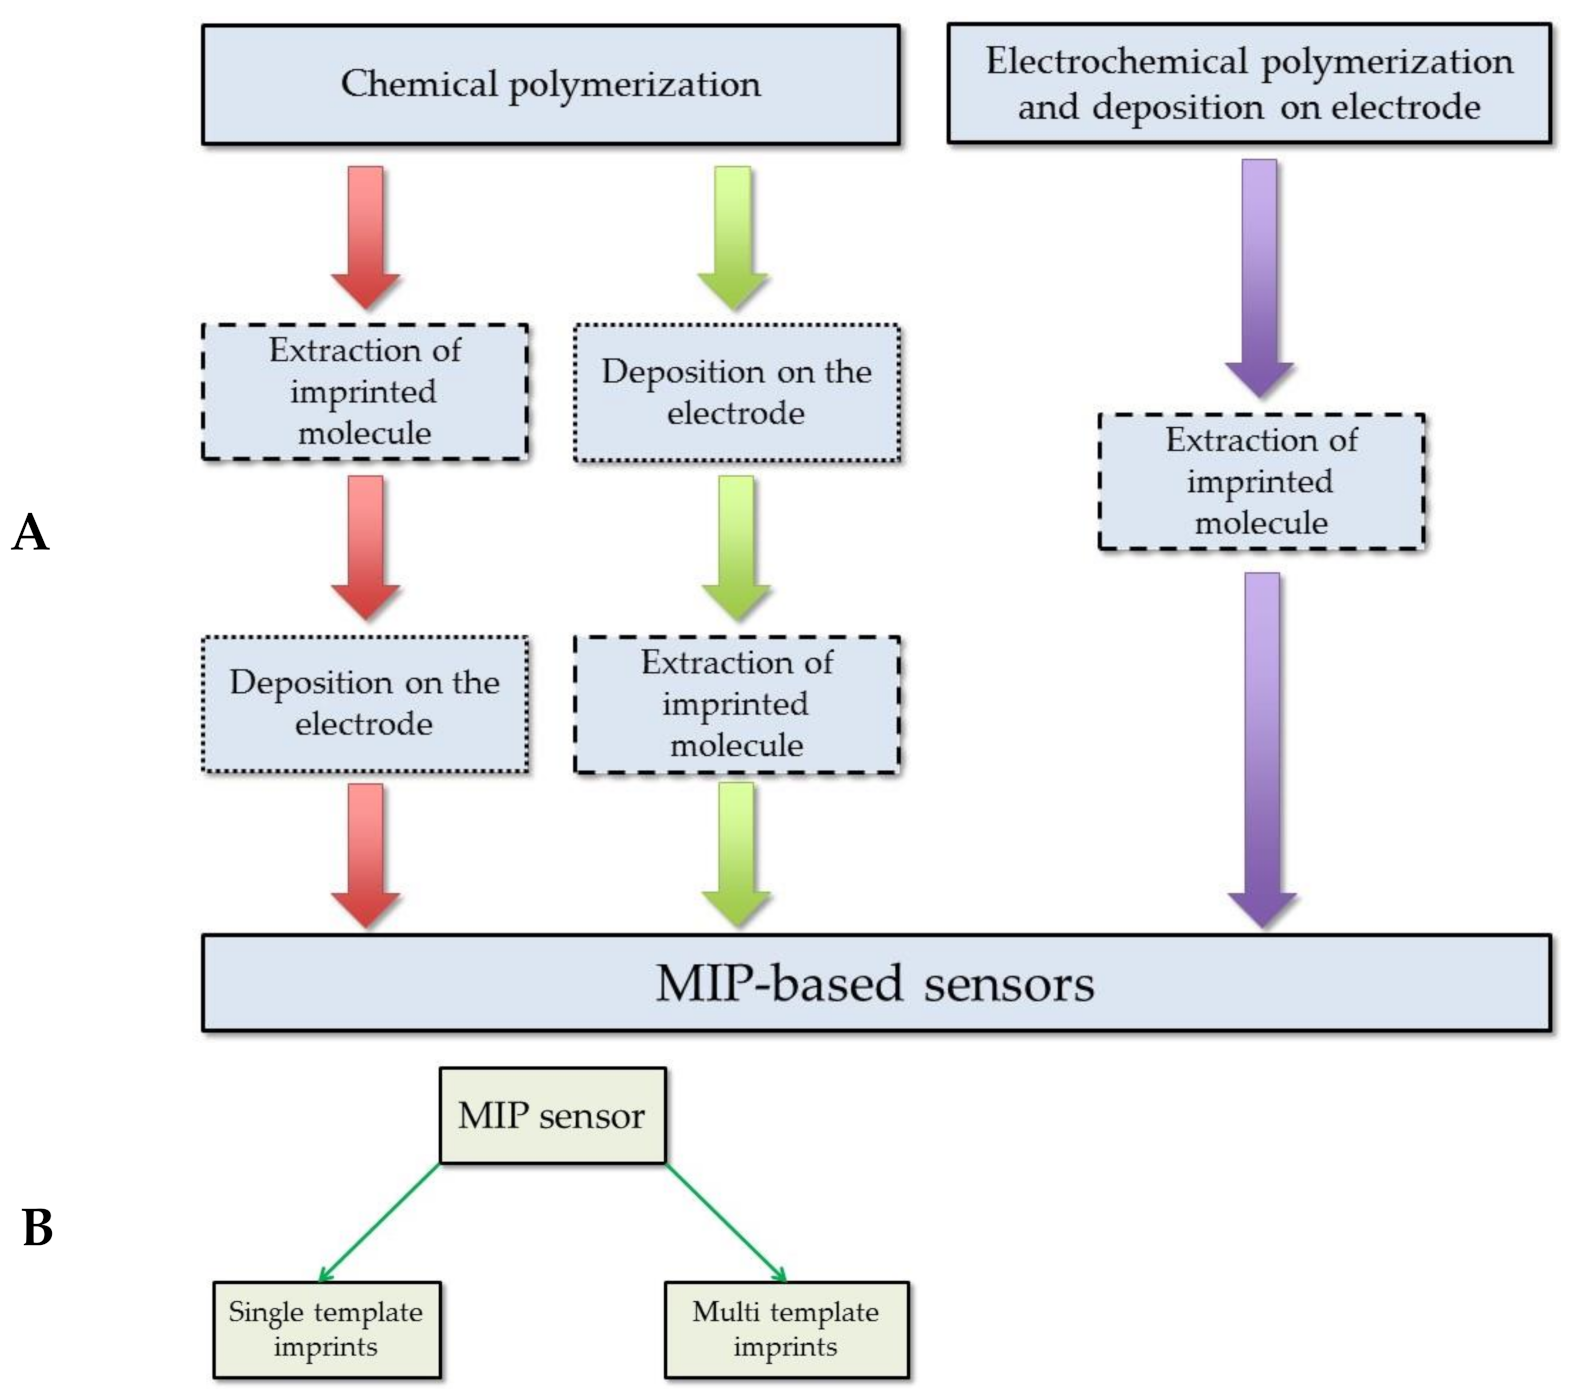
2. The Principals of Molecular Imprinting Technology Applied for the Formation of Sensing Platforms
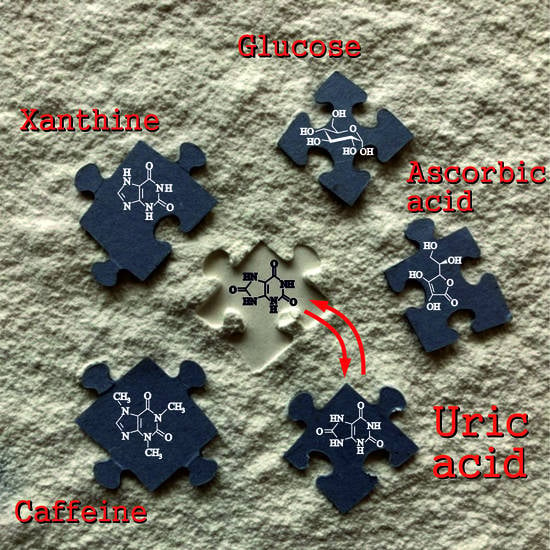
3. The Main Interfering Molecules for Uric Acid Determination
4. Molecular Imprinting Technologies for Determination of Uric Acid
5. Conclusions
Author Contributions
Funding
Acknowledgments
Conflicts of Interest
References
- Kushiyama, A.; Tanaka, K.; Hara, S.; Kawazu, S. Linking uric acid metabolism to diabetic complications. World J. Diabetes 2014, 5, 787–795. [Google Scholar] [CrossRef] [PubMed]
- Desideri, G.; Castaldo, G.; Lombardi, A.; Mussap, M.; Testa, A.; Pontremoli, R.; Punzi, L.; Borghi, C. Is it time to revise the normal range of serum uric acid levels. Eur. Rev. Med. Pharmacol. Sci. 2014, 18, 1295–1306. [Google Scholar] [PubMed]
- Albu, A.; Para, I.; Porojan, M. Uric acid and arterial stiffness. Ther. Clin. Risk Manag. 2020, 16, 39–54. [Google Scholar] [CrossRef] [PubMed] [Green Version]
- Benn, C.L.; Dua, P.; Gurrell, R.; Loudon, P.; Pike, A.; Storer, R.I.; Vangjeli, C. Physiology of hyperuricemia and urate-lowering treatments. Front. Med. 2018, 5, 160. [Google Scholar] [CrossRef] [Green Version]
- Siener, R.; Hesse, A. The effect of a vegetarian and different omnivorous diets on urinary risk factors for uric acidstone formation. Eur. J. Nutr. 2003, 42, 332–337. [Google Scholar] [CrossRef]
- Jood, S.; Kapoor, A.C. Protein and uric acid contents of cereal grains as affected by insect infestation. Food Chem. 1993, 46, 143–146. [Google Scholar] [CrossRef]
- Rose, C.; Parker, A.; Jefferson, B.; Cartmell, E. The characterization of feces and urine: A review of the literature to inform advanced treatment technology. Crit. Rev. Environ. Sci. Technol. 2015, 45, 1827–1879. [Google Scholar] [CrossRef] [Green Version]
- Han, Y.; Zhang, M.; Lu, J.; Zhang, L.; Han, J.; Zhao, F.; Chen, H.; Bao, Y.; Jia, W. Hyperuricemia and overexcretion of uric acid increase the risk of simple renal cysts in type 2 diabetes. Sci. Rep. 2017, 7, 3802. [Google Scholar] [CrossRef] [Green Version]
- Jin, M.; Yang, F.; Yang, I.; Yin, Y.; Luo, J.J.; Wang, H.; Yang, X.-F. Uric acid, hyperuricemia and vascular diseases. Front. Biosci. Landmark Ed. 2012, 17, 656–669. [Google Scholar] [CrossRef] [Green Version]
- Struck, W.A.; Elving, P.J. Electrolytic oxidation of uric acid: Products and mechanism. Biochemistry 1965, 4, 1343–1353. [Google Scholar] [CrossRef]
- Dbira, S.; Bensalah, N.; Bedoui, A. Mechanism and kinetics of electrochemical degradation of uric acid using conductive-diamond anodes. Environ. Technol. 2016, 37, 2993–3001. [Google Scholar] [CrossRef]
- Plausinaitis, D.; Sinkevicius, L.; Samukaite-Bubniene, U.; Ratautaite, V.; Ramanavicius, A. Evaluation of Electrochemical quartz crystal microbalance based sensor modified by uric acid-imprinted polypyrrole. Talanta 2020, 220, 121414. [Google Scholar] [CrossRef]
- Ratautaite, V.; Nesladek, M.; Ramanaviciene, A.; Baleviciute, I.; Ramanavicius, A. Evaluation of histamine imprinted polypyrrole deposited on boron doped nanocrystalline diamond. Electroanalysis 2014, 26, 2458–2464. [Google Scholar] [CrossRef]
- Wang, Y.; Liu, X.; Lu, Z.; Liu, T.; Zhao, L.; Ding, F.; Zou, P.; Wang, X.; Zhao, Q.; Rao, H. Molecularly imprinted polydopamine modified with nickel nanoparticles wrapped with carbon: Fabrication, characterization and electrochemical detection of uric acid. Microchim. Acta 2019, 186, 414. [Google Scholar] [CrossRef]
- Ratautaite, V.; Topkaya, S.N.; Mikoliunaite, L.; Ozsoz, M.; Oztekin, Y.; Ramanaviciene, A.; Ramanavicius, A. Molecularly imprinted polypyrrole for DNA determination. Electroanalysis 2013, 25, 1169–1177. [Google Scholar] [CrossRef]
- Ramanaviciene, A.; Ramanavicius, A. Molecularly imprinted polypyrrole-based synthetic receptor for direct detection of bovine leukemia virus glycoproteins. Biosens. Bioelectron. 2004, 20, 1076–1082. [Google Scholar] [CrossRef]
- Stojanovic, Z.; Erdőssy, J.; Keltai, K.; Scheller, F.W.; Gyurcsányi, R.E. Electrosynthesized molecularly imprinted polyscopoletin nanofilms for human serum albumin detection. Anal. Chim. Acta 2017, 977, 1–9. [Google Scholar] [CrossRef] [Green Version]
- Ramanavicius, S.; Ramanavicius, A. Conducting polymers in the design of biosensors and biofuel cells. Polymers 2021, 13, 49. [Google Scholar] [CrossRef]
- Ramanavicius, S.; Jagminas, A.; Ramanavicius, A. Advances in molecularly imprinted polymers based affinity sensors (Review). Polymers 2021, 13, 974. [Google Scholar] [CrossRef]
- Wolfart, F.; Hryniewicz, B.M.; Góes, M.S.; Corrêa, C.M.; Torresi, R.; Minadeo, M.A.; de Torresi, S.I.C.; Oliveira, R.D.; Marchesi, L.F.; Vidotti, M. Conducting polymers revisited: Applications in energy, electrochromism and molecular recognition. J. Solid State Electrochem. 2017, 21, 2489–2515. [Google Scholar] [CrossRef]
- Ahmad, O.S.; Bedwell, T.S.; Esen, C.; Garcia-Cruz, A.; Piletsky, S.A. Molecularly imprinted polymers in electrochemical and optical sensors. Trends Biotechnol. 2019, 37, 294–309. [Google Scholar] [CrossRef]
- Heinze, J.; Frontana-Uribe, B.A.; Ludwigs, S. Electrochemistry of conducting polymers—Persistent models and new concepts. Chem. Rev. 2010, 110, 4724–4771. [Google Scholar] [CrossRef]
- Li, N.; Nan, C.; Mei, X.; Sun, Y.; Feng, H.; Li, Y. Electrochemical sensor based on dual-template molecularly imprinted polymer and nanoporous gold leaf modified electrode for simultaneous determination of dopamine and uric acid. Microchim. Acta 2020, 187, 496. [Google Scholar] [CrossRef]
- Zheng, W.; Zhao, M.; Liu, W.; Yu, S.; Niu, L.; Li, G.; Li, H.; Liu, W. Electrochemical sensor based on molecularly imprinted polymer/reduced graphene oxide composite for simultaneous determination of uric acid and tyrosine. J. Electroanal. Chem. 2018, 813, 75–82. [Google Scholar] [CrossRef]
- Ratautaite, V.; Plausinaitis, D.; Baleviciute, I.; Mikoliunaite, L.; Ramanaviciene, A.; Ramanavicius, A. Characterization of caffeine-imprinted polypyrrole by a quartz crystal microbalance and electrochemical impedance spectroscopy. Sens. Actuators B Chem. 2015, 212, 63–71. [Google Scholar] [CrossRef]
- Lian, H.; Sun, Z.; Sun, X.; Liu, B. Graphene doped molecularly imprinted electrochemical sensor for uric acid. Anal. Lett. 2012, 45, 2717–2727. [Google Scholar] [CrossRef]
- Lange, U.; Roznyatouskaya, N.V.; Mirsky, V.M. Conducting polymers in chemical sensors and arrays. Anal. Chim. Acta 2008, 614, 1–26. [Google Scholar] [CrossRef] [PubMed]
- Malitesta, C.; Mazzotta, E.; Picca, R.A.; Poma, A.; Chianella, I.; Piletsky, S.A. MIP sensors—The electrochemical approach. Anal. Bioanal. Chem. 2012, 402, 1827–1846. [Google Scholar] [CrossRef]
- Ndunda, E.N. Molecularly imprinted polymers—A closer look at the control polymer used in determining the imprinting effect: A mini review. J. Mol. Recognit. 2020, 33, e2855. [Google Scholar] [CrossRef]
- Blanco-Lopez, M.C.; Lobo-Castanon, M.J.; Miranda-Ordieres, A.J.; Tunon-Blanco, P. Electrochemical sensors based on molecularly imprinted polymers. TrAC Trends Anal. Chem. 2004, 23, 36–48. [Google Scholar] [CrossRef]
- Yang, B.; Fu, C.; Li, J.; Xu, G. Frontiers in highly sensitive molecularly imprinted electrochemical sensors: Challenges and strategies. TrAC Trends Anal. Chem. 2018, 105, 52–67. [Google Scholar] [CrossRef]
- Kan, X.; Xing, Z.; Zhu, A.; Zhao, Z.; Xu, G.; Li, C.; Zhou, H. Molecularly imprinted polymers based electrochemical sensor for bovine hemoglobin recognition. Sens. Actuators B Chem. 2012, 168, 395–401. [Google Scholar] [CrossRef]
- Svenson, J.; Andersson, H.S.; Piletsky, S.A.; Nicholls, I.A. Spectroscopic studies of the molecular imprinting self-assembly process. J. Mol. Recognit. 1998, 11, 83–86. [Google Scholar] [CrossRef]
- Ansell, R.J.; Kuah, K.L. Imprinted polymers for chiral resolution of (±)-ephedrine: Understanding the pre-polymerisation equilibrium and the action of different mobile phase modifiers. Analyst 2005, 130, 179–187. [Google Scholar] [CrossRef]
- Zhao, W.; Li, B.; Xu, S.; Huang, X.; Luo, J.; Zhu, Y.; Liu, X. Electrochemical protein recognition based on macromolecular self-assembly of molecularly imprinted polymer: A new strategy to mimic antibody for label-free biosensing. J. Mater. Chem. B 2019, 7, 2311–2319. [Google Scholar] [CrossRef]
- Sharma, P.S.; Garcia-Cruz, A.; Cieplak, M.; Noworyta, K.R.; Kutner, W. ‘Gate effect’ in molecularly imprinted polymers: The current state of understanding. Curr. Opin. Electrochem. 2019, 16, 50–56. [Google Scholar] [CrossRef]
- Piletsky, S.A.; Panasyuk, T.L.; Piletskaya, E.V.; Nicholls, I.A.; Ulbricht, M. Receptor and transport properties of imprinted polymer membranes—A review. J. Membr. Sci. 1999, 157, 263–278. [Google Scholar] [CrossRef]
- Piletsky, S.A.; Turner, A.P.F. Electrochemical sensors based on molecularly imprinted polymers. Electroanalysis 2002, 14, 317–323. [Google Scholar] [CrossRef]
- Viveiros, R.; Rebocho, S.; Casimiro, T. Green strategies for molecularly imprinted polymer development. Polymers 2018, 10, 306. [Google Scholar] [CrossRef] [Green Version]
- Svenson, J.; Nicholls, I.A. On the thermal and chemical stability of molecularly imprinted polymers. Anal. Chim. Acta 2001, 435, 19–24. [Google Scholar] [CrossRef]
- Kupai, J.; Razali, M.; Buyuktiryaki, S.; Kecili, R.; Szekely, G. Long-Term stability and reusability of molecularly imprinted polymers. Polym. Chem. 2017, 8, 666–673. [Google Scholar] [CrossRef] [Green Version]
- Poma, A.; Guerreiro, A.; Whitcombe, M.J.; Piletska, E.V.; Turner, A.P.F.; Piletsky, S.A. Solid-Phase synthesis of molecularly imprinted polymer nanoparticles with a reusable template—“Plastic antibodies”. Adv. Funct. Mater. 2013, 23, 2821–2827. [Google Scholar] [CrossRef] [Green Version]
- Chen, L.; Xu, S.; Li, J. Recent advances in molecular imprinting technology: Current status, challenges and highlighted applications. Chem. Soc. Rev. 2011, 40, 2922–2942. [Google Scholar] [CrossRef]
- Chen, L.; Wang, X.; Lu, W.; Wu, X.; Li, J. Molecular imprinting: Perspectives and applications. Chem. Soc. Rev. 2016, 45, 2137–2211. [Google Scholar] [CrossRef]
- Yarman, A.; Scheller, F.W. How reliable is the electrochemical readout of MIP sensors? Sensors 2020, 20, 2677. [Google Scholar] [CrossRef]
- Chen, P.-Y.; Vittal, R.; Nien, P.-C.; Liou, G.-S.; Ho, K.-C. A novel molecularly imprinted polymer thin film as biosensor for uric acid. Talanta 2010, 80, 1145–1151. [Google Scholar] [CrossRef]
- Muñoz, J.; Montes, R.; Baeza, M. Trends in electrochemical impedance spectroscopy involving nanocomposite transducers: Characterization, architecture surface and bio-sensing. TrAC Trends Anal. Chem. 2017, 97, 201–215. [Google Scholar] [CrossRef]
- Plausinaitis, D.; Sinkevicius, L.; Mikoliunaite, L.; Plausinaitiene, V.; Ramanaviciene, A.; Ramanavicius, A. Electrochemical polypyrrole formation from pyrrole ‘adlayer’. Phys. Chem. Chem. Phys. 2017, 19, 1029–1038. [Google Scholar] [CrossRef]
- Faria, R.; Heneine, L.; Matencio, T.; Messaddeq, Y. Faradaic and non-faradaic electrochemical impedance spectroscopy as transduction techniques for sensing applications. Int. J. Biosens. Bioelectron. 2019, 5. [Google Scholar] [CrossRef]
- Liao, H.; Zhang, Z.; Li, H.; Nie, L.; Yao, S. Preparation of the molecularly imprinted polymers-based capacitive sensor specific for tegafur and its characterization by electrochemical impedance and piezoelectric quartz crystal microbalance. Electrochim. Acta 2004, 49, 4101–4107. [Google Scholar] [CrossRef]
- Zhang, C.; Xiao, Z.; Qin, T.; Yang, Z. Modification of nanocrystalline TiO2 coatings with molecularly imprinted TiO2 for uric acid recognition. J. Mol. Recognit. 2019, 32, e2775. [Google Scholar] [CrossRef]
- Sakamoto, H.; Hatsuda, R.; Miyamura, K.; Shiraishi, H.; Sugiyama, S. Electrochemical selective detection of uric acid using a copper-modified carbon electrode. Anal. Sci. 2011, 27, 333. [Google Scholar] [CrossRef] [PubMed] [Green Version]
- Movlaee, K.; Norouzi, P.; Beitollahi, H.; Rezapour, M.; Larijani, B. Highly selective differential pulse voltammetric determination of uric acid using modified glassy carbon electrode. Int. J. Electrochem. Sci. 2017, 12, 3241–3251. [Google Scholar] [CrossRef]
- Rajabi, H.; Noroozifar, M.; Sabbaghi, N. Electrochemical determination of uric acid using nano resin modified carbon paste electrode as a new sensor. J. Mater. Appl. Sci. 2017, 1, 1002–1006. [Google Scholar]
- Ahammad, A.S.; Li, X.-B.; Rahman, M.M.; Noh, K.-M.; Lee, J.-J. Characteristics of a poly (thionine) modified glassy carbon electrode and the detection of dopamine and uric acid. Int. J. Electrochem. Sci. 2013, 8, 7806–7815. [Google Scholar]
- Ghanbari, K.; Bonyadi, S. Modified glassy carbon electrode with polypyrrole nanocomposite for the simultaneous determination of ascorbic acid, dopamine, uric acid, and folic acid. J. Electrochem. Sci. Technol. 2020, 11, 68–83. [Google Scholar] [CrossRef]
- Adeosun, W.A.; Asiri, A.M.; Marwani, H.M.; Rahman, M.M. Enzymeless electrocatalytic detection of uric acid using polydopamine/polypyrrole copolymeric film. ChemistrySelect 2020, 5, 156–164. [Google Scholar] [CrossRef] [Green Version]
- Wang, M.; Cui, M.; Liu, W.; Liu, X. Highly dispersed conductive polypyrrole hydrogels as sensitive sensor for simultaneous determination of ascorbic acid, dopamine and uric acid. J. Electroanal. Chem. 2019, 832, 174–181. [Google Scholar] [CrossRef]
- Ozcan, L.; Sahin, M.; Sahin, Y. Electrochemical preparation of a molecularly imprinted polypyrrole-modified pencil graphite electrode for determination of ascorbic acid. Sensors 2008, 8, 5792–5805. [Google Scholar] [CrossRef] [Green Version]
- Özcan, A.; İlkbaş, S.; Atılır Özcan, A. Development of a disposable and low-cost electrochemical sensor for dopamine detection based on poly (pyrrole-3-carboxylic acid)-modified electrochemically over-oxidized pencil graphite electrode. Talanta 2017, 165, 489–495. [Google Scholar] [CrossRef]
- Ghanbari, K.; Hajheidari, N. ZnO–CuxO/Polypyrrole nanocomposite modified electrode for simultaneous determination of ascorbic acid, dopamine, and uric acid. Anal. Biochem. 2015, 473, 53–62. [Google Scholar] [CrossRef]
- Jain, R.; Jadon, N.; Pawaiya, A. Polypyrrole based next generation electrochemical sensors and biosensors: A review. TrAC Trends Anal. Chem. 2017, 97, 363–373. [Google Scholar] [CrossRef]
- Dai, H.; Wang, N.; Wang, D.; Zhang, X.; Ma, H.; Lin, M. Voltammetric uric acid sensor based on a glassy carbon electrode modified with a nanocomposite consisting of polytetraphenylporphyrin, polypyrrole, and graphene oxide. Microchim. Acta 2016, 183, 3053–3059. [Google Scholar] [CrossRef]
- Qian, T.; Yu, C.; Zhou, X.; Ma, P.; Wu, S.; Xu, L.; Shen, J. Ultrasensitive dopamine sensor based on novel molecularly imprinted polypyrrole coated carbon nanotubes. Biosens. Bioelectron. 2014, 58, 237–241. [Google Scholar] [CrossRef]
- Mazzotta, E.; Picca, R.A.; Malitesta, C.; Piletsky, S.A.; Piletska, E.V. Development of a sensor prepared by entrapment of MIP particles in electrosynthesised polymer films for electrochemical detection of ephedrine. Biosens. Bioelectron. 2008, 23, 1152–1156. [Google Scholar] [CrossRef]
- Roy, A.K.; Nisha, V.S.; Dhand, C.; Malhotra, B.D. Molecularly imprinted polyaniline film for ascorbic acid detection. J. Mol. Recognit. 2011, 24, 700–706. [Google Scholar] [CrossRef]
- Yang, Z.-P.; Liu, X.; Zhang, C.-J.; Liu, B.-Z. A high-performance nonenzymatic piezoelectric sensor based on molecularly imprinted transparent TiO2 film for detection of urea. Biosens. Bioelectron. 2015, 74, 85–90. [Google Scholar] [CrossRef]
- Ramanavicius, S.; Ramanavicius, A. Insights in the application of stoichiometric and non-stoichiometric titanium oxides for the design of sensors for the determination of gases and VOCs (TiO2 − x and TinO2n − 1 vs. TiO2). Sensors 2020, 20, 6833. [Google Scholar] [CrossRef]
- Sajini, T.; Gigimol, M.G.; Mathew, B. A brief overview of molecularly imprinted polymers supported on titanium dioxide matrices. Mater. Today Chem. 2019, 11, 283–295. [Google Scholar] [CrossRef]
- Tang, Q.; Li, Z.-Y.; Wei, Y.-B.; Yang, X.; Liu, L.-T.; Gong, C.-B.; Ma, X.-B.; Lam, M.H.-W.; Chow, C.-F. Photoresponsive surface molecularly imprinted polymer on ZnO nanorods for uric acid detection in physiological fluids. Mater. Sci. Eng. C 2016, 66, 33–39. [Google Scholar] [CrossRef]
- Viter, R.; Kunene, K.; Genys, P.; Jevdokimovs, D.; Erts, D.; Sutka, A.; Bisetty, K.; Viksna, A.; Ramanaviciene, A.; Ramanavicius, A. Photoelectrochemical bisphenol s sensor based on ZnO-nanoroads modified by molecularly imprinted polypyrrole. Macromol. Chem. Phys. 2020, 221, 1900232. [Google Scholar] [CrossRef]
- Mujahid, A.; Khan, A.I.; Afzal, A.; Hussain, T.; Raza, M.H.; Shah, A.T.; uz Zaman, W. Molecularly imprinted titania nanoparticles for selective recognition and assay of uric acid. Appl. Nanosci. 2015, 5, 527–534. [Google Scholar] [CrossRef] [Green Version]
- Sharma, P.S.; Pietrzyk-Le, A.; D’Souza, F.; Kutner, W. Electrochemically synthesized polymers in molecular imprinting for chemical sensing. Anal. Bioanal. Chem. 2012, 402, 3177–3204. [Google Scholar] [CrossRef] [Green Version]
- Chen, P.-Y.; Nien, P.-C.; Hu, C.-W.; Ho, K.-C. Detection of uric acid based on multi-walled carbon nanotubes polymerized with a layer of molecularly imprinted PMAA. Sens. Actuators B Chem. 2010, 146, 466–471. [Google Scholar] [CrossRef]
- Motghare, R.V.; Tadi, K.K.; Dhawale, P.; Deotare, S.; Kawadkar, A.K.; Chillawar, R.; Khan, S. Voltammetric determination of uric acid based on molecularly imprinted polymer modified carbon paste electrode. Electroanalysis 2015, 27, 825–832. [Google Scholar] [CrossRef]
- Prasad, B.B.; Sharma, P.S.; Lakshmi, D. Molecularly imprinted polymer-based solid-phase extraction combined with molecularly imprinted polymer-based sensor for detection of uric acid. J. Chromatogr. A 2007, 1173, 18–26. [Google Scholar] [CrossRef]
- Lakshmi, D.; Sharma, P.S.; Prasad, B.B. Development of uric acid sensor based on molecularly imprinted polymer-modified hanging mercury drop electrode. Electroanalysis 2006, 18, 918–927. [Google Scholar] [CrossRef]
- Patel, A.K.; Sharma, P.S.; Prasad, B.B. Electrochemical sensor for uric acid based on a molecularly imprinted polymer brush grafted to tetraethoxysilane derived sol-gel thin film graphite electrode. Mater. Sci. Eng. C 2009, 29, 1545–1553. [Google Scholar] [CrossRef]
- Zhang, C.; Si, S.; Yang, Z. A highly selective photoelectrochemical biosensor for uric acid based on core-shell Fe3O4@C nanoparticle and molecularly imprinted TiO2. Biosens. Bioelectron. 2015, 65, 115–120. [Google Scholar] [CrossRef]
- Prasad, B.B.; Fatma, S. One MoNomer doubly imprinted dendrimer nanofilm modified pencil graphite electrode for simultaneous electrochemical determination of norepinephrine and uric acid. Electrochim. Acta 2017, 232, 474–483. [Google Scholar] [CrossRef]
- Khasanah, M.; Harsini, M.; Widati, A.A. Imprinting zeolite-modified glassy carbon as a voltammetric sensor for uric acid. Indones. J. Chem. 2013, 13, 108–113. [Google Scholar] [CrossRef] [Green Version]


| Ref. | MIP or MIT, Electrode | Deposition Method | Extraction of Uric Acid | Evaluation Methods | Linear Range | LOD | Interfering Molecules |
|---|---|---|---|---|---|---|---|
| [24] | 2-amino-5-mercapto-1, 3, 4-thiadiazole (AMT) with reduced graphene oxide on GCE | Electrochemical: CV | With the ethanol solution for 30 min | TEM, AFM, The selected-area electron diffraction (SAED), SEM, XPS, CV, EIS, and DPV in presence of redox probe. | 0.01–100 μM | 0.0032 μM | Dopamine, epinephrine, adenine, xanthine, ascorbic acid, and glucose. |
| [23] | o-phenylenediamine with nanoporous gold leaf on GCE | Electrochemical: CV | In 0.2 M H2SO4 by CV, 20 cycles from −0.5 V to + 0.5 V at a scan rate of 100 mV/s. | SEM CV, EIS, and DPV in presence of redox probe. | 5.0–160 μM | 0.4 μM | Urea, ascorbic acid, glucose, 3,4-dihydroxyphenylacetic acid (DOPAC), epinephrine, norepinephrine. |
| [51] | TiO2 on QCM electrode | NPs of TiO2 formed by sol-gel hydrolysis of Ti(O-nBu)4, on electrode transferred by dipping in TiO2 with MIT containing solution | Drying at 80 °C for 2 h and then calcination in air at 350 °C for 3 h | Piezoelectricity | 0.04–45 μM | 0.01 μM | Ascorbic acid, urea, glucose, glutamic acid, purine, and cytosine |
| [26] | Graphene doped chitosan on GCE | Electrochemical: chronoamperometry | By CV, 40 cycles from 1.5 V to −1.0 V at a scan rate of 0.8 V/s in 0.1 M PBS. | SEM, FTIR, CV, EIS, chronocoulometry, in presence of redox probe. | 0.02–10.0 μM | - | Ascorbic acid, dopamine, and urea. |
| [74] | Poly-methacrylic acid (PMAA) on the surface of multi-walled carbon nanotubes (MWCNTs) on GCE | MIP particles formed by chemical polymerization, a certain amount of MIP particles dropped on electrode and evaporated the solvent | Methanol/water (3:1, v:v) | SEM, CV, linear sweep voltammetry, chronoamperometry. | 80–500 μM | 22 μM | Ascorbic acid. |
| [75] | Methacrylate, on carbon paste electrode | MIP particles formed by thermal polymerization, MIP particles mixed with graphite and eicosane to form a carbon paste | MIP particles washed for nine times using 50 mL, 0.1 N HCl and ethanol mixture (1:1 v/v) with stirring for 4 h. | FTIR, CV, differential pulse adsorptive stripping voltammetry (DPAdSV), EIS | 0.5–100 μM | 0.1 μM | Glucose, glycine, tryptophan, and ascorbic acid. |
| [14] | Carbon-entrapped nickel NPs (Ni@BC) coated with polydopamine, on GCE | Electrochemical: CV | The methanol/acetic acid solution (9:1, v/v) for 5 min. | XRD, SEM, TEM, XPS DPV | 0.01–30 μM | 0.008 μM | Ascorbic acid, dopamine, glutamic acid, arginine, glucose, sucrose, adenine, hypoxanthine, xanthine, guanine, and allantoin. |
| [76] | [poly(melamine-co-chloranil), on HMDE | Chemical polymerization of MIP, on HDME coated chronoamperometrically | Hot water, 80 °C | IR Differential pulse, cathodic stripping voltammetric (DPCSV) | 0.015–2.75 μM | 0.005 μM | Caffeine, theophylline, xanthine, hypoxanthine, allantoin, cytosine, glucose, thiourea, ascorbic acid, adenine, urea, histidine, uracil, and cytosine. |
| [77] | [poly(melamine-co-chloranil), on HMDE | Chemical polymerization of MIP, on HDME coated chronoamperometrically | Hot water, 80 °C | Differential pulse, cathodic stripping voltammetric (DPCSV), CV | 0.65–23.8 μM | 0.14 μM | Caffeine, theophylline, xanthine, hypoxanthine, allantoin, cytosine, glucose, thiourea, ascorbic acid, adenine, urea, histidine, uracil and cytosine. |
| [78] | poly(melamine-co-chloranil), brush grafted to tetraethoxysilane derived sol-gel thin film graphite electrode | Chemical polymerization of MIP; sol-gel of SiO4 in presence of MIP: spin coated on electrode | Hot water, 80 °C | SEM, IR, Differential pulse, cathodic stripping voltammetric (DPCSV). | 87–1000 μM | 24 μM | Caffeine, theophylline, xanthine, hypoxanthine, allantoin, cytosine, glucose, thiourea, ascorbic acid, adenine, urea, histidine, uracil, and cytosine. |
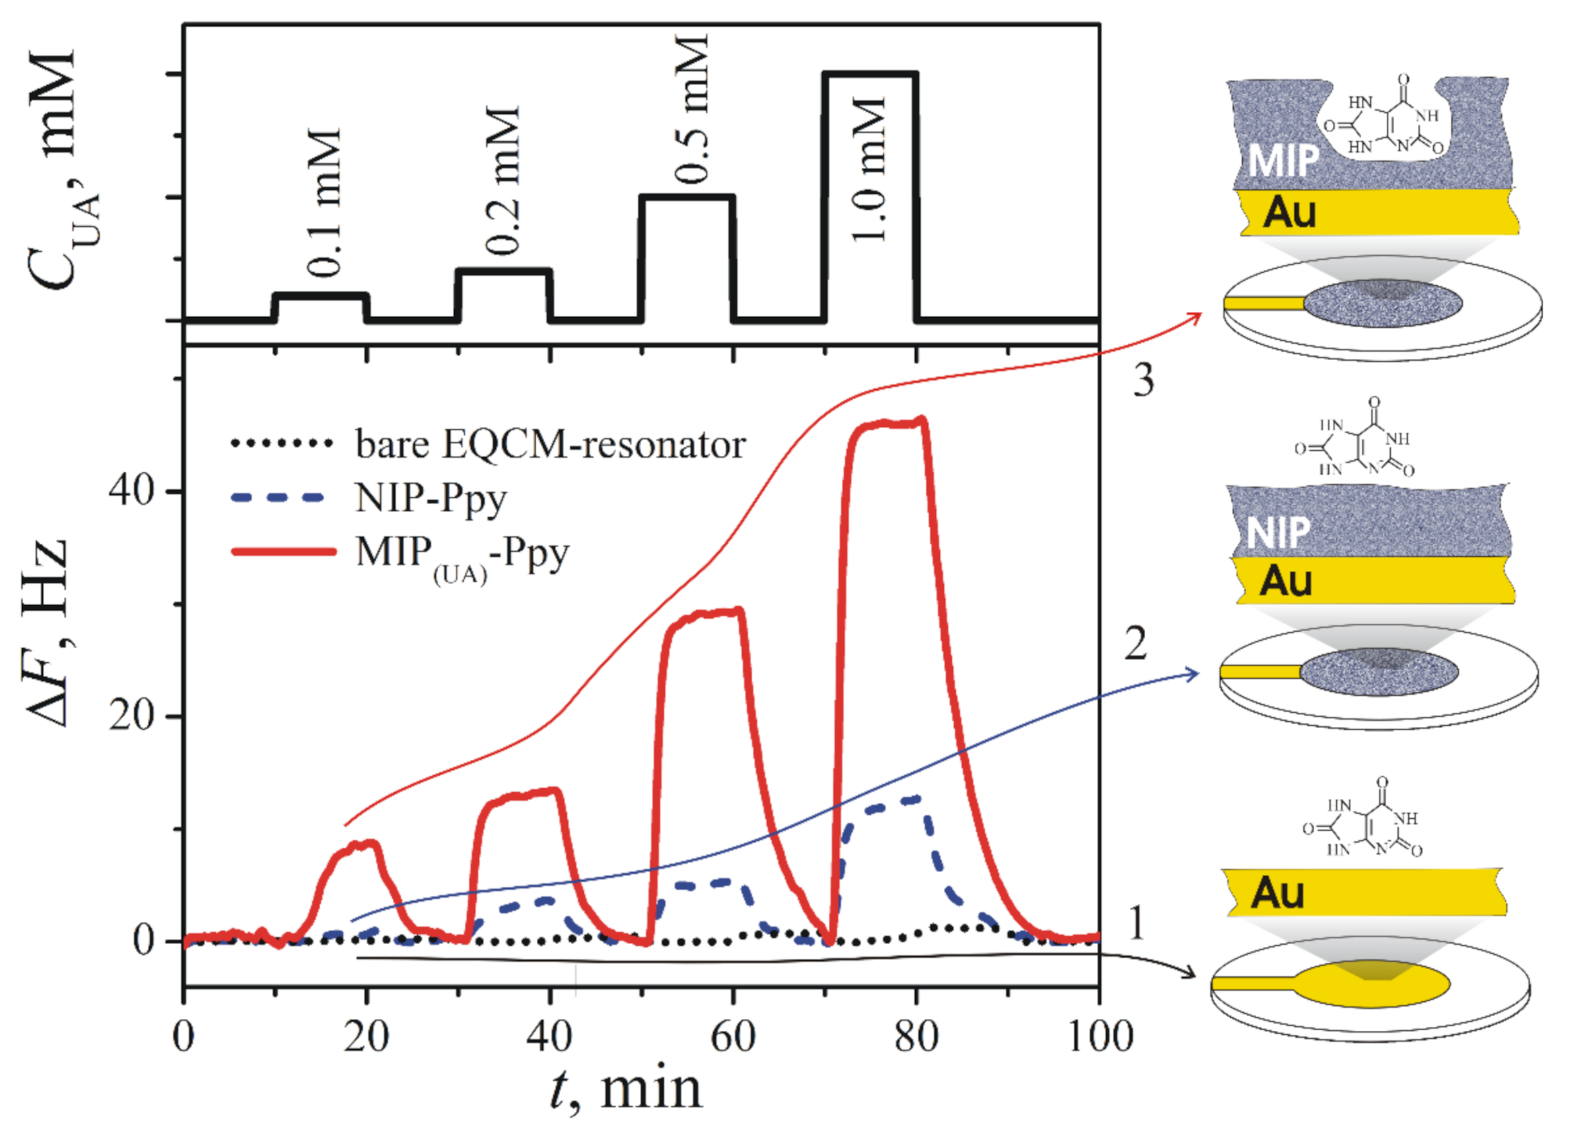
| [12] | Polypyrrole on EQCM electrode | Electrochemical: chronoamperometrically | PBS, for 30 min, at 1 mL/min of HPLC pump. | Piezoelectricity | 0.1–1 mM | – | Caffeine, glucose. |
| [79] | Fe3O4@C modified with molecularly imprinted TiO2 on the magnetic GCE | Sol-gel hydrolysis TiO2 on electrode transferred by dipping in TiO2 with MIT containing solution | Multiple extractions (n = 8, extraction time 10 min) with 10 mL hot water (ca. 80 °C). | Photocurrent response, XRD, CV, TEM | 0.3–34 μM | 0.02 μM | Ascorbic acid, glutamic acid, cytosine, glucose, purine, and urea. |
| [80] | hyperbranched polymer (dendrimer) with dispersed GNPs-fMWCNTs on the PGE | Free radical polymerization of MIP particles, that were spin coated on the PGE | TEA-methanol (1:1, v/v) | SEM, DPASV | 0.01–0.27 μM | 0.0023 μM | Ascorbic acid, epinephrine, dopamine, L-tyrosine, L-tryptophan, creatinine, creatine, serotonine, glycine, glutamic acid, glucose, urea. |
| [81] | Imprinted zeotlite on GCE | Hydrothermal synthesis of zeolite. Zeolite on electrode transferred by potential cycling. | Warm water | XRD, FTIR, voltammetry | 5.6–28 nM | 5.9 nM | Ascorbic acid, creatine, and creatinine |
Publisher’s Note: MDPI stays neutral with regard to jurisdictional claims in published maps and institutional affiliations. |
© 2021 by the authors. Licensee MDPI, Basel, Switzerland. This article is an open access article distributed under the terms and conditions of the Creative Commons Attribution (CC BY) license (https://creativecommons.org/licenses/by/4.0/).
Share and Cite
Ratautaite, V.; Samukaite-Bubniene, U.; Plausinaitis, D.; Boguzaite, R.; Balciunas, D.; Ramanaviciene, A.; Neunert, G.; Ramanavicius, A. Molecular Imprinting Technology for Determination of Uric Acid. Int. J. Mol. Sci. 2021, 22, 5032. https://0-doi-org.brum.beds.ac.uk/10.3390/ijms22095032
Ratautaite V, Samukaite-Bubniene U, Plausinaitis D, Boguzaite R, Balciunas D, Ramanaviciene A, Neunert G, Ramanavicius A. Molecular Imprinting Technology for Determination of Uric Acid. International Journal of Molecular Sciences. 2021; 22(9):5032. https://0-doi-org.brum.beds.ac.uk/10.3390/ijms22095032
Chicago/Turabian StyleRatautaite, Vilma, Urte Samukaite-Bubniene, Deivis Plausinaitis, Raimonda Boguzaite, Domas Balciunas, Almira Ramanaviciene, Grażyna Neunert, and Arunas Ramanavicius. 2021. "Molecular Imprinting Technology for Determination of Uric Acid" International Journal of Molecular Sciences 22, no. 9: 5032. https://0-doi-org.brum.beds.ac.uk/10.3390/ijms22095032