
Immunomodulatory Effects of Vitamin D Supplementation in a Deficient Population

 , , , , , and
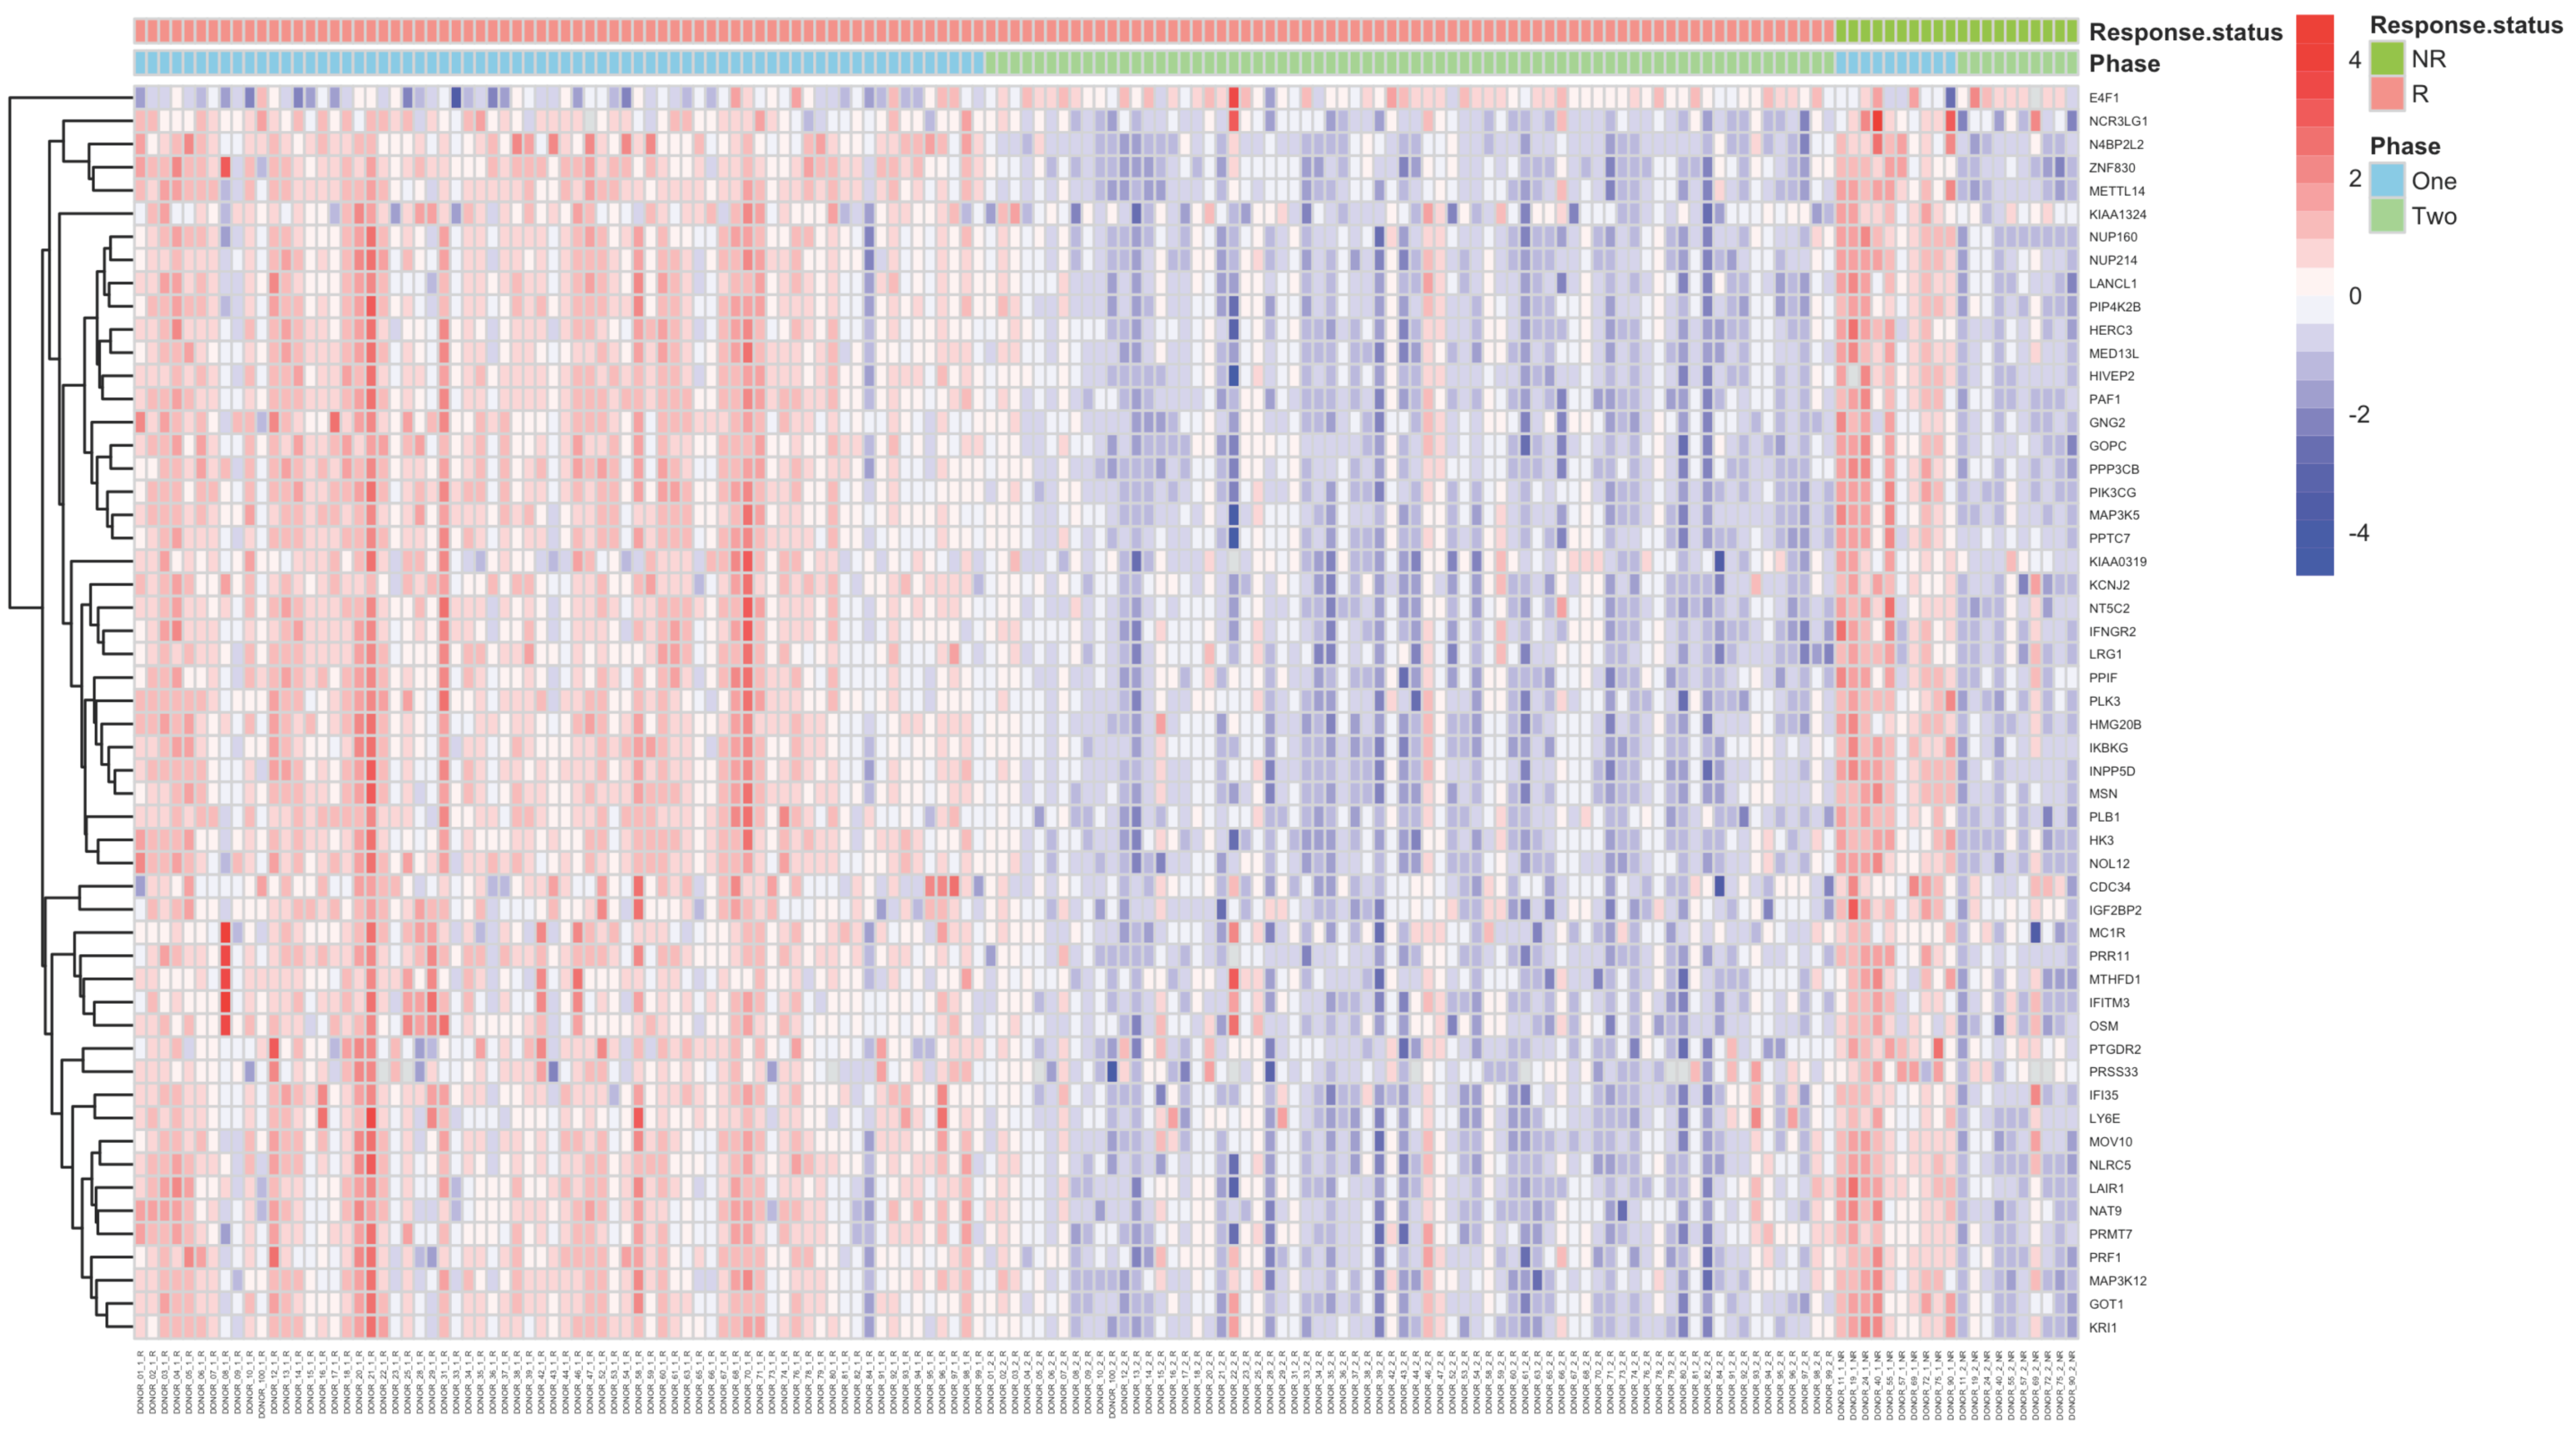
Abstract
:1. Introduction
2. Results
2.1. Cohort Description
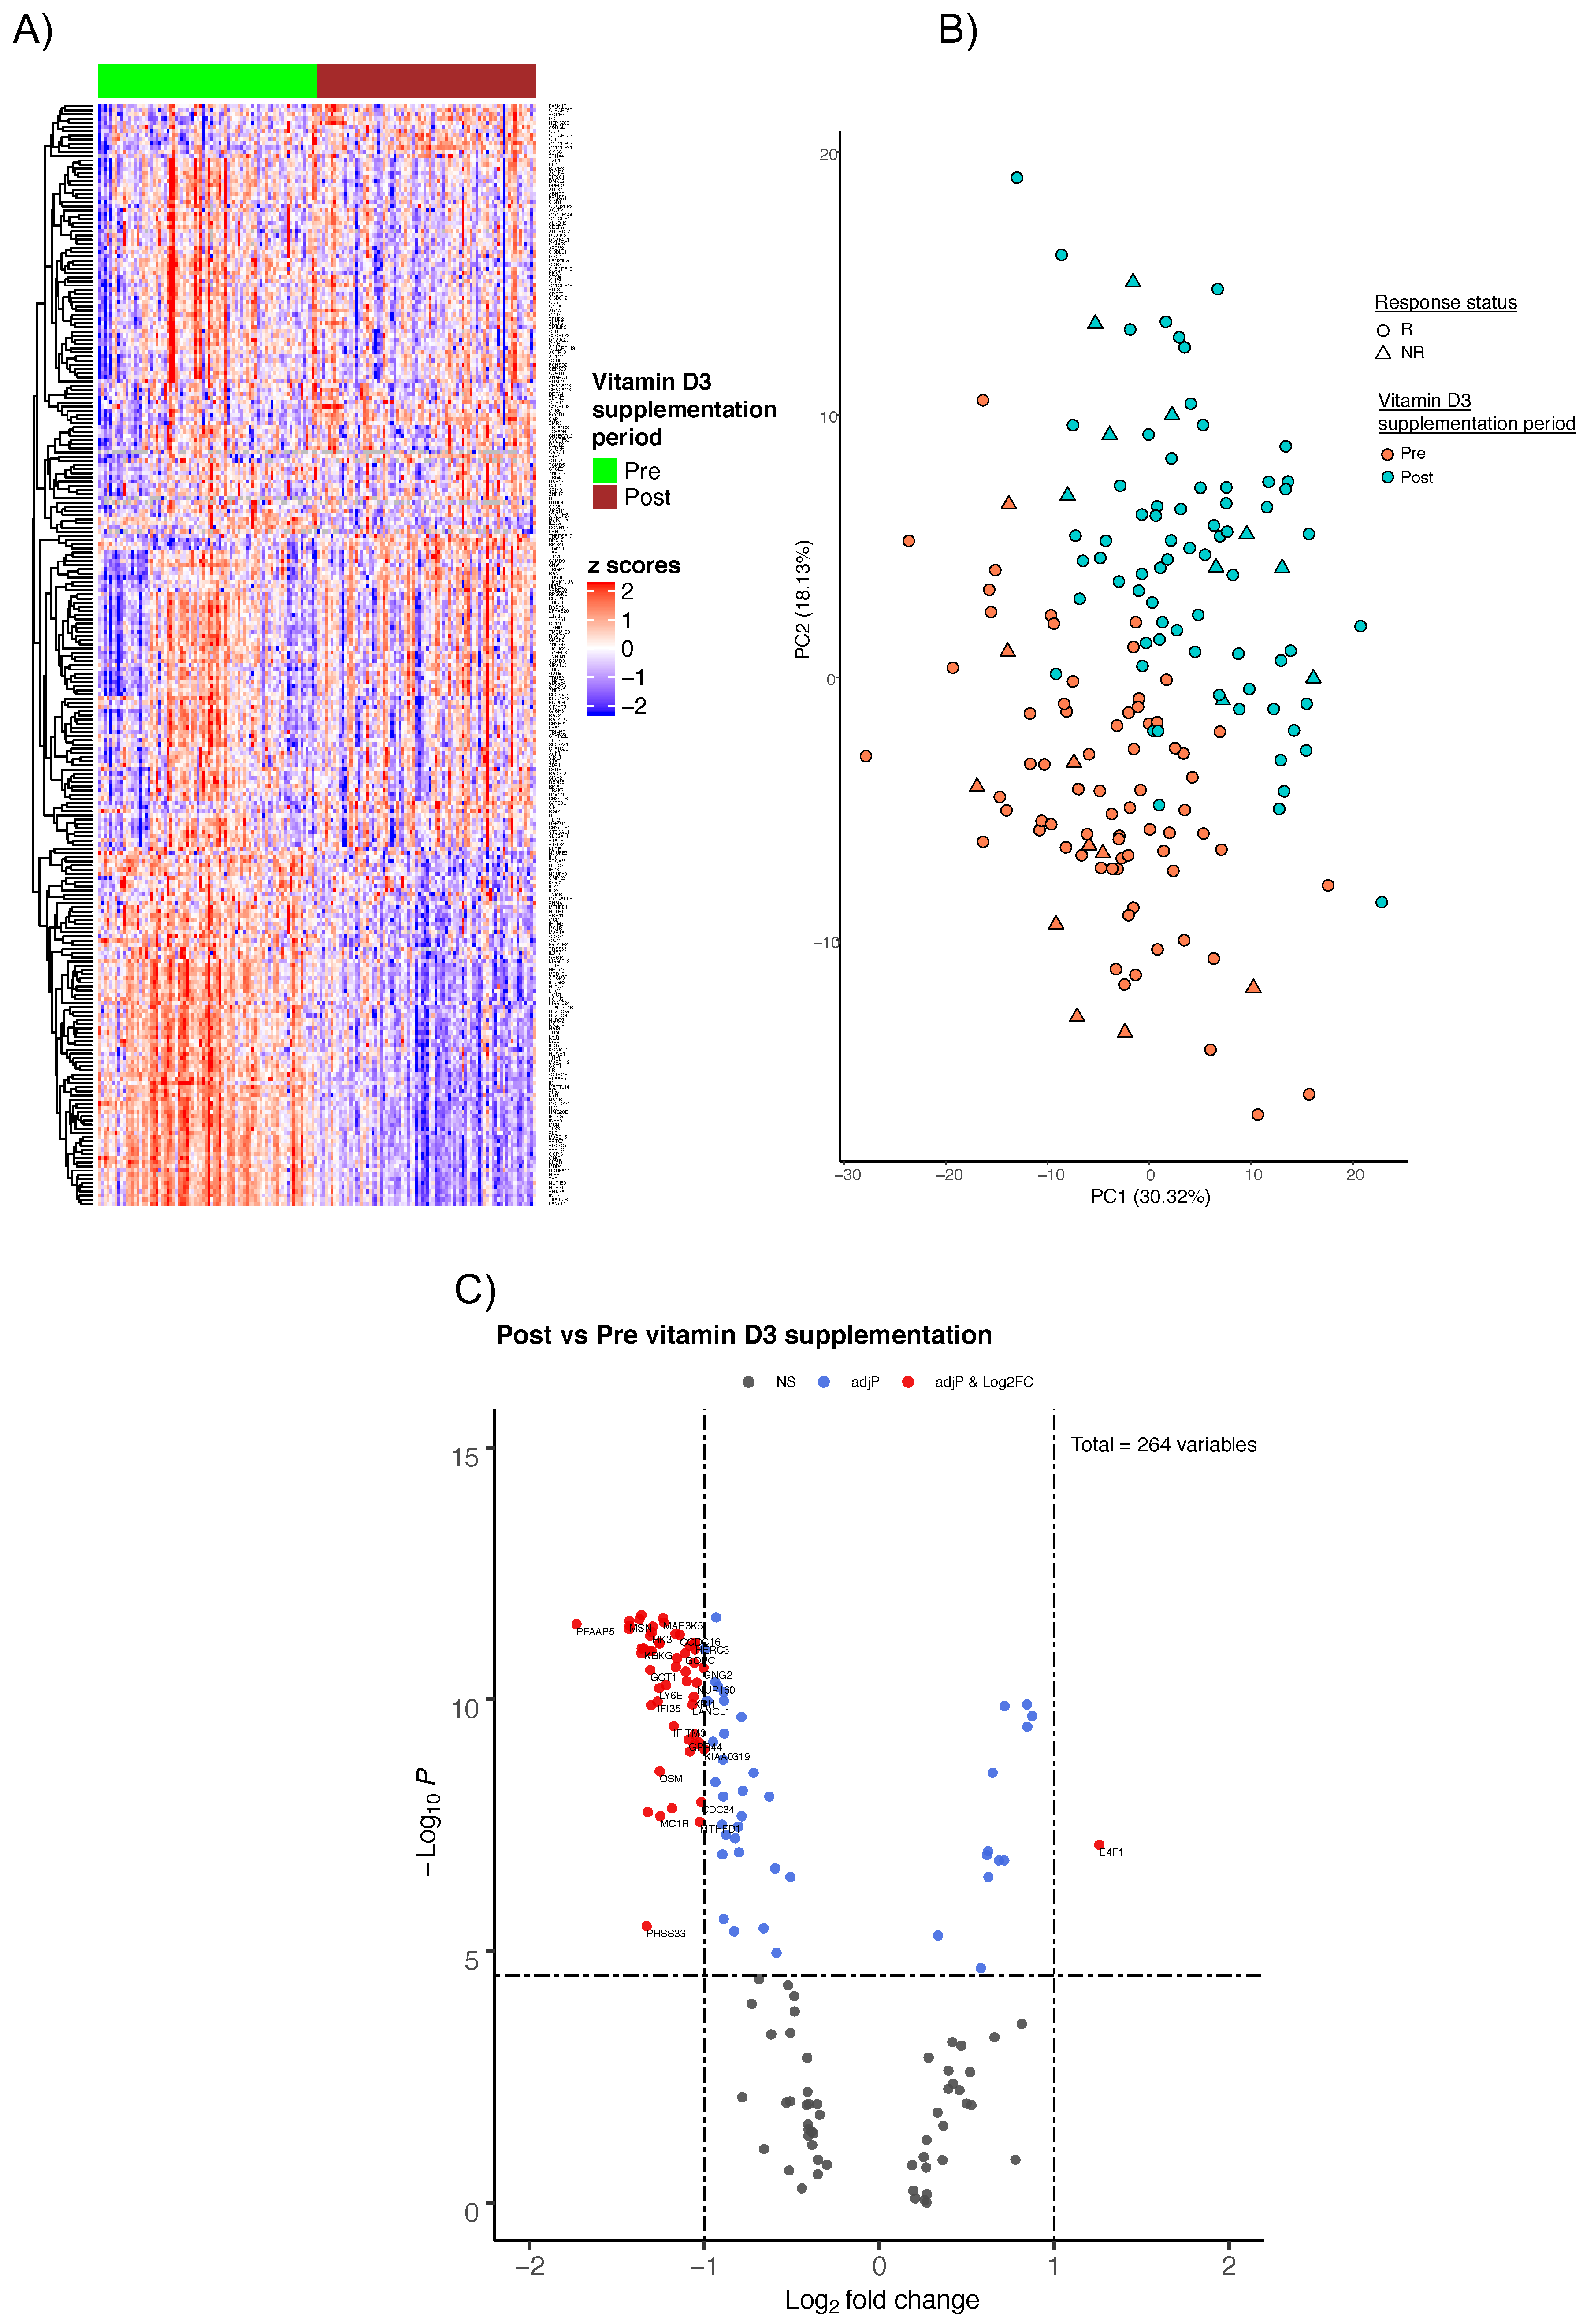
2.2. Gene Expression Profiles
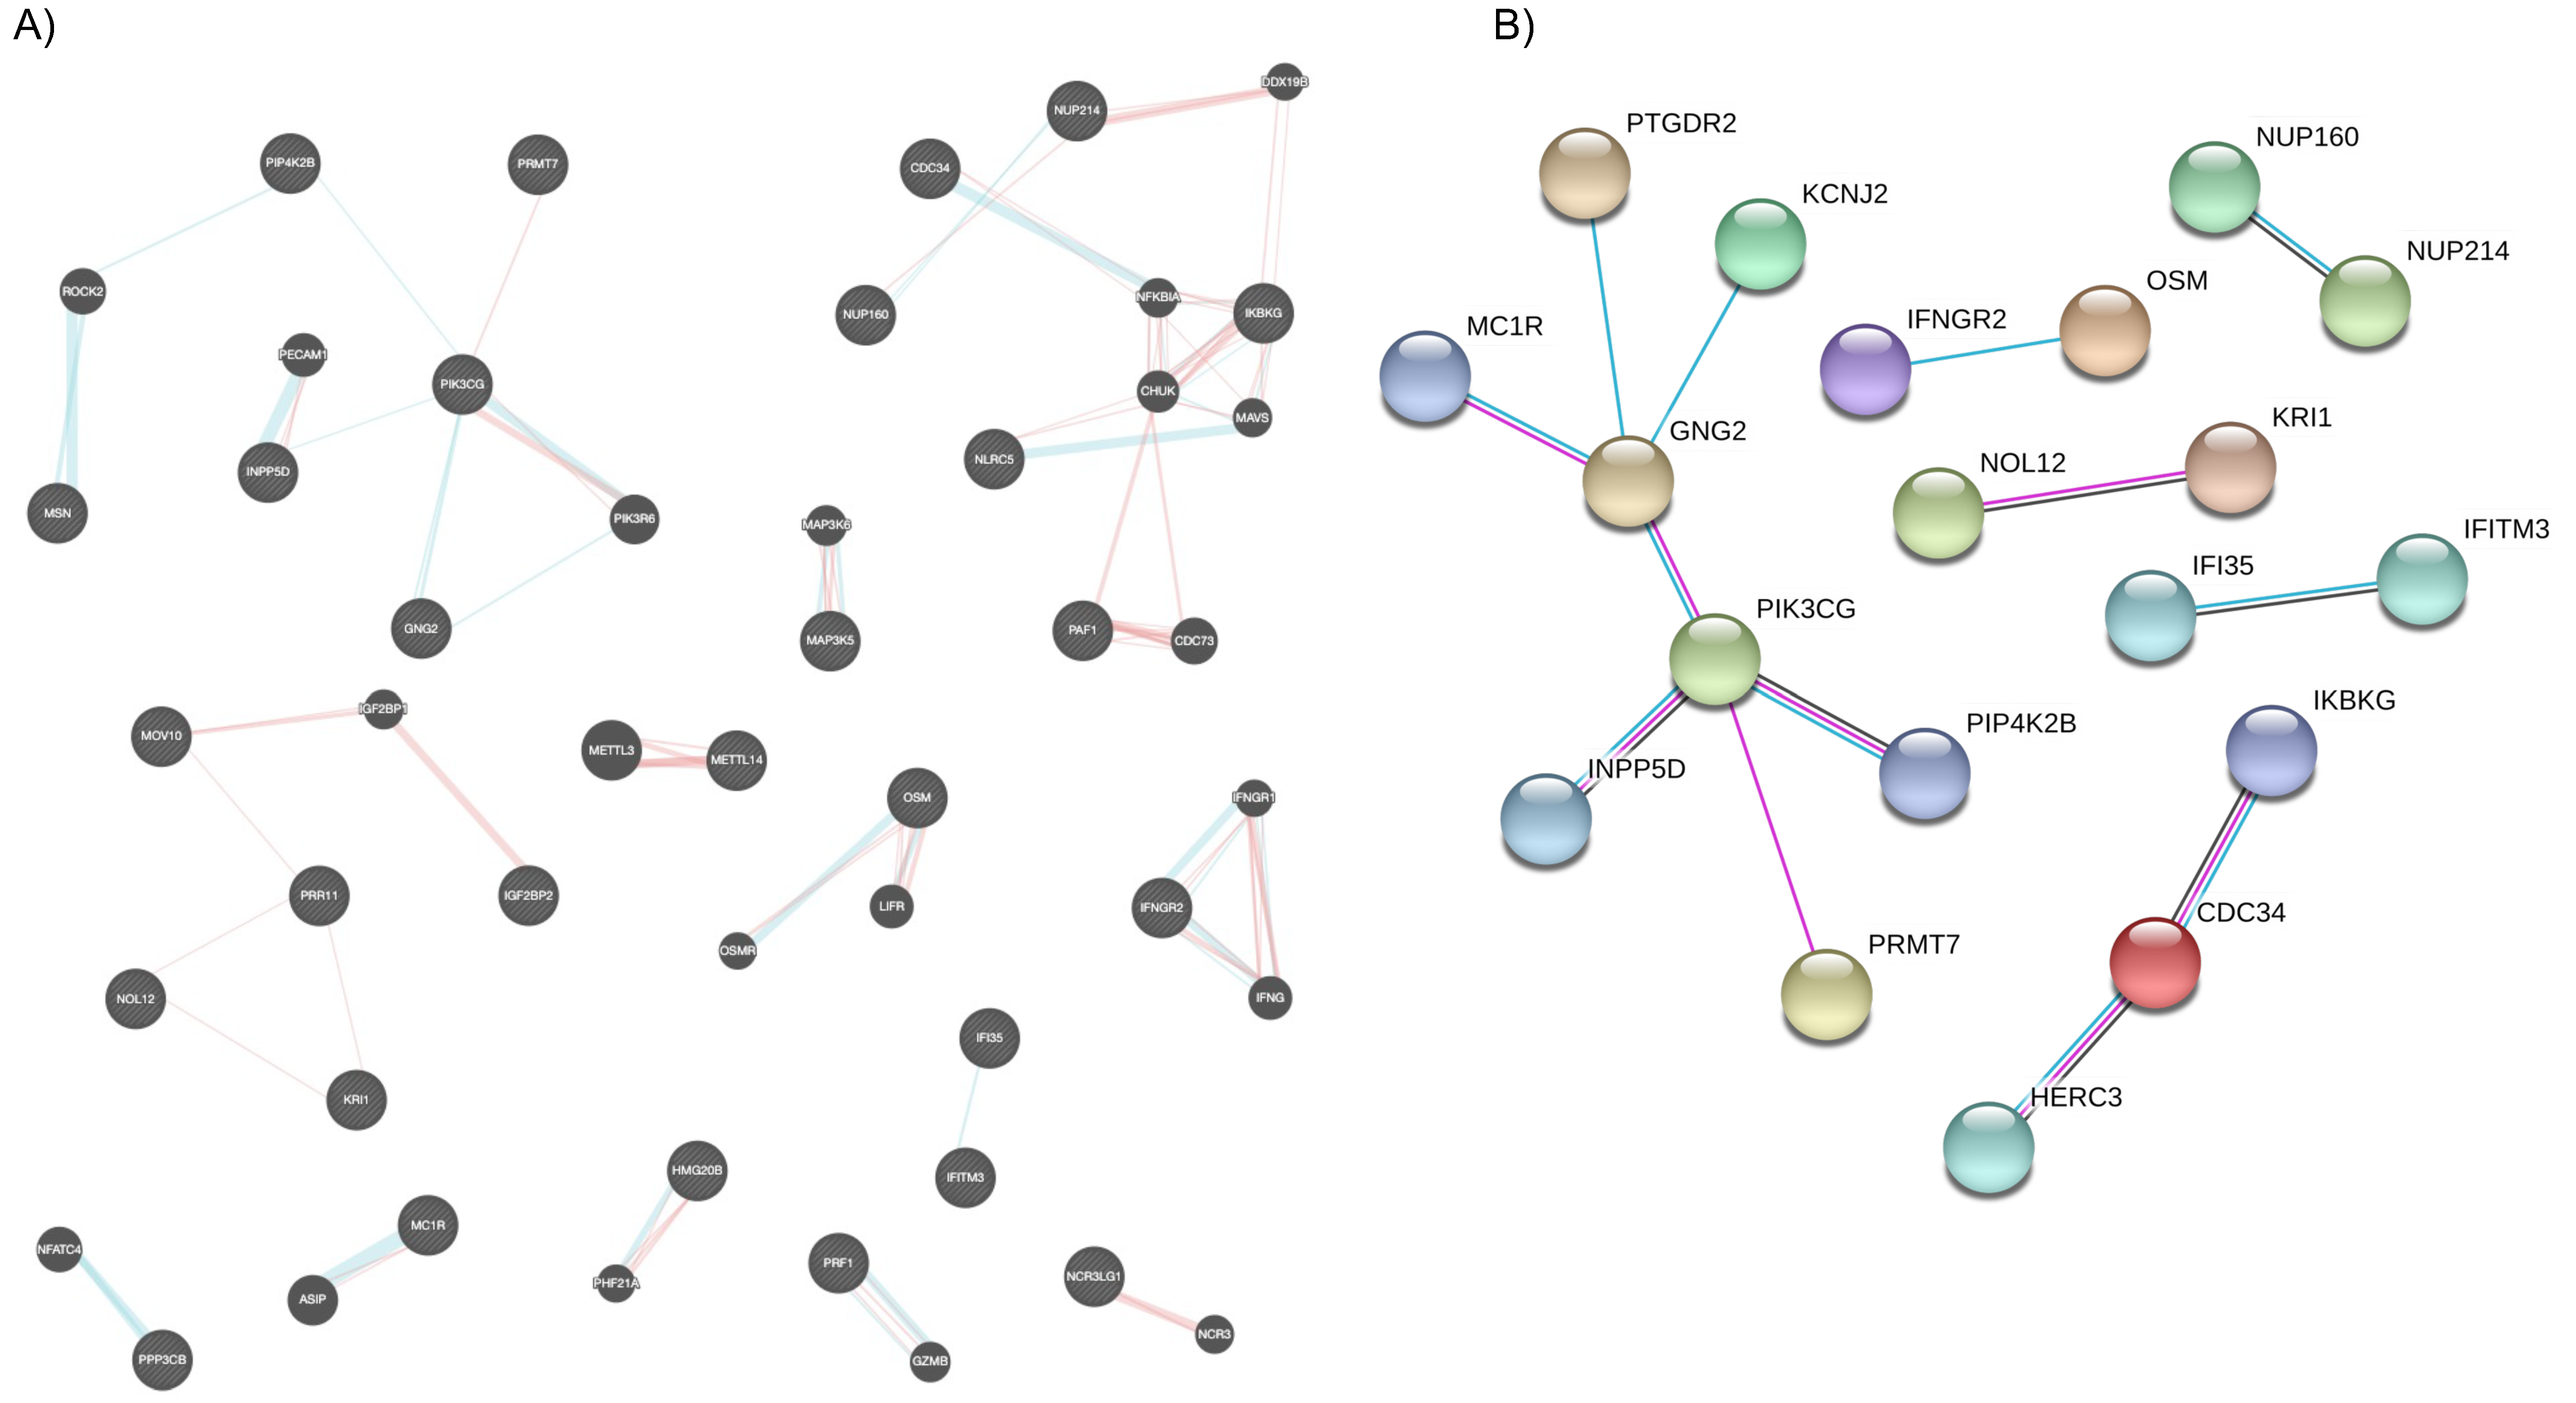
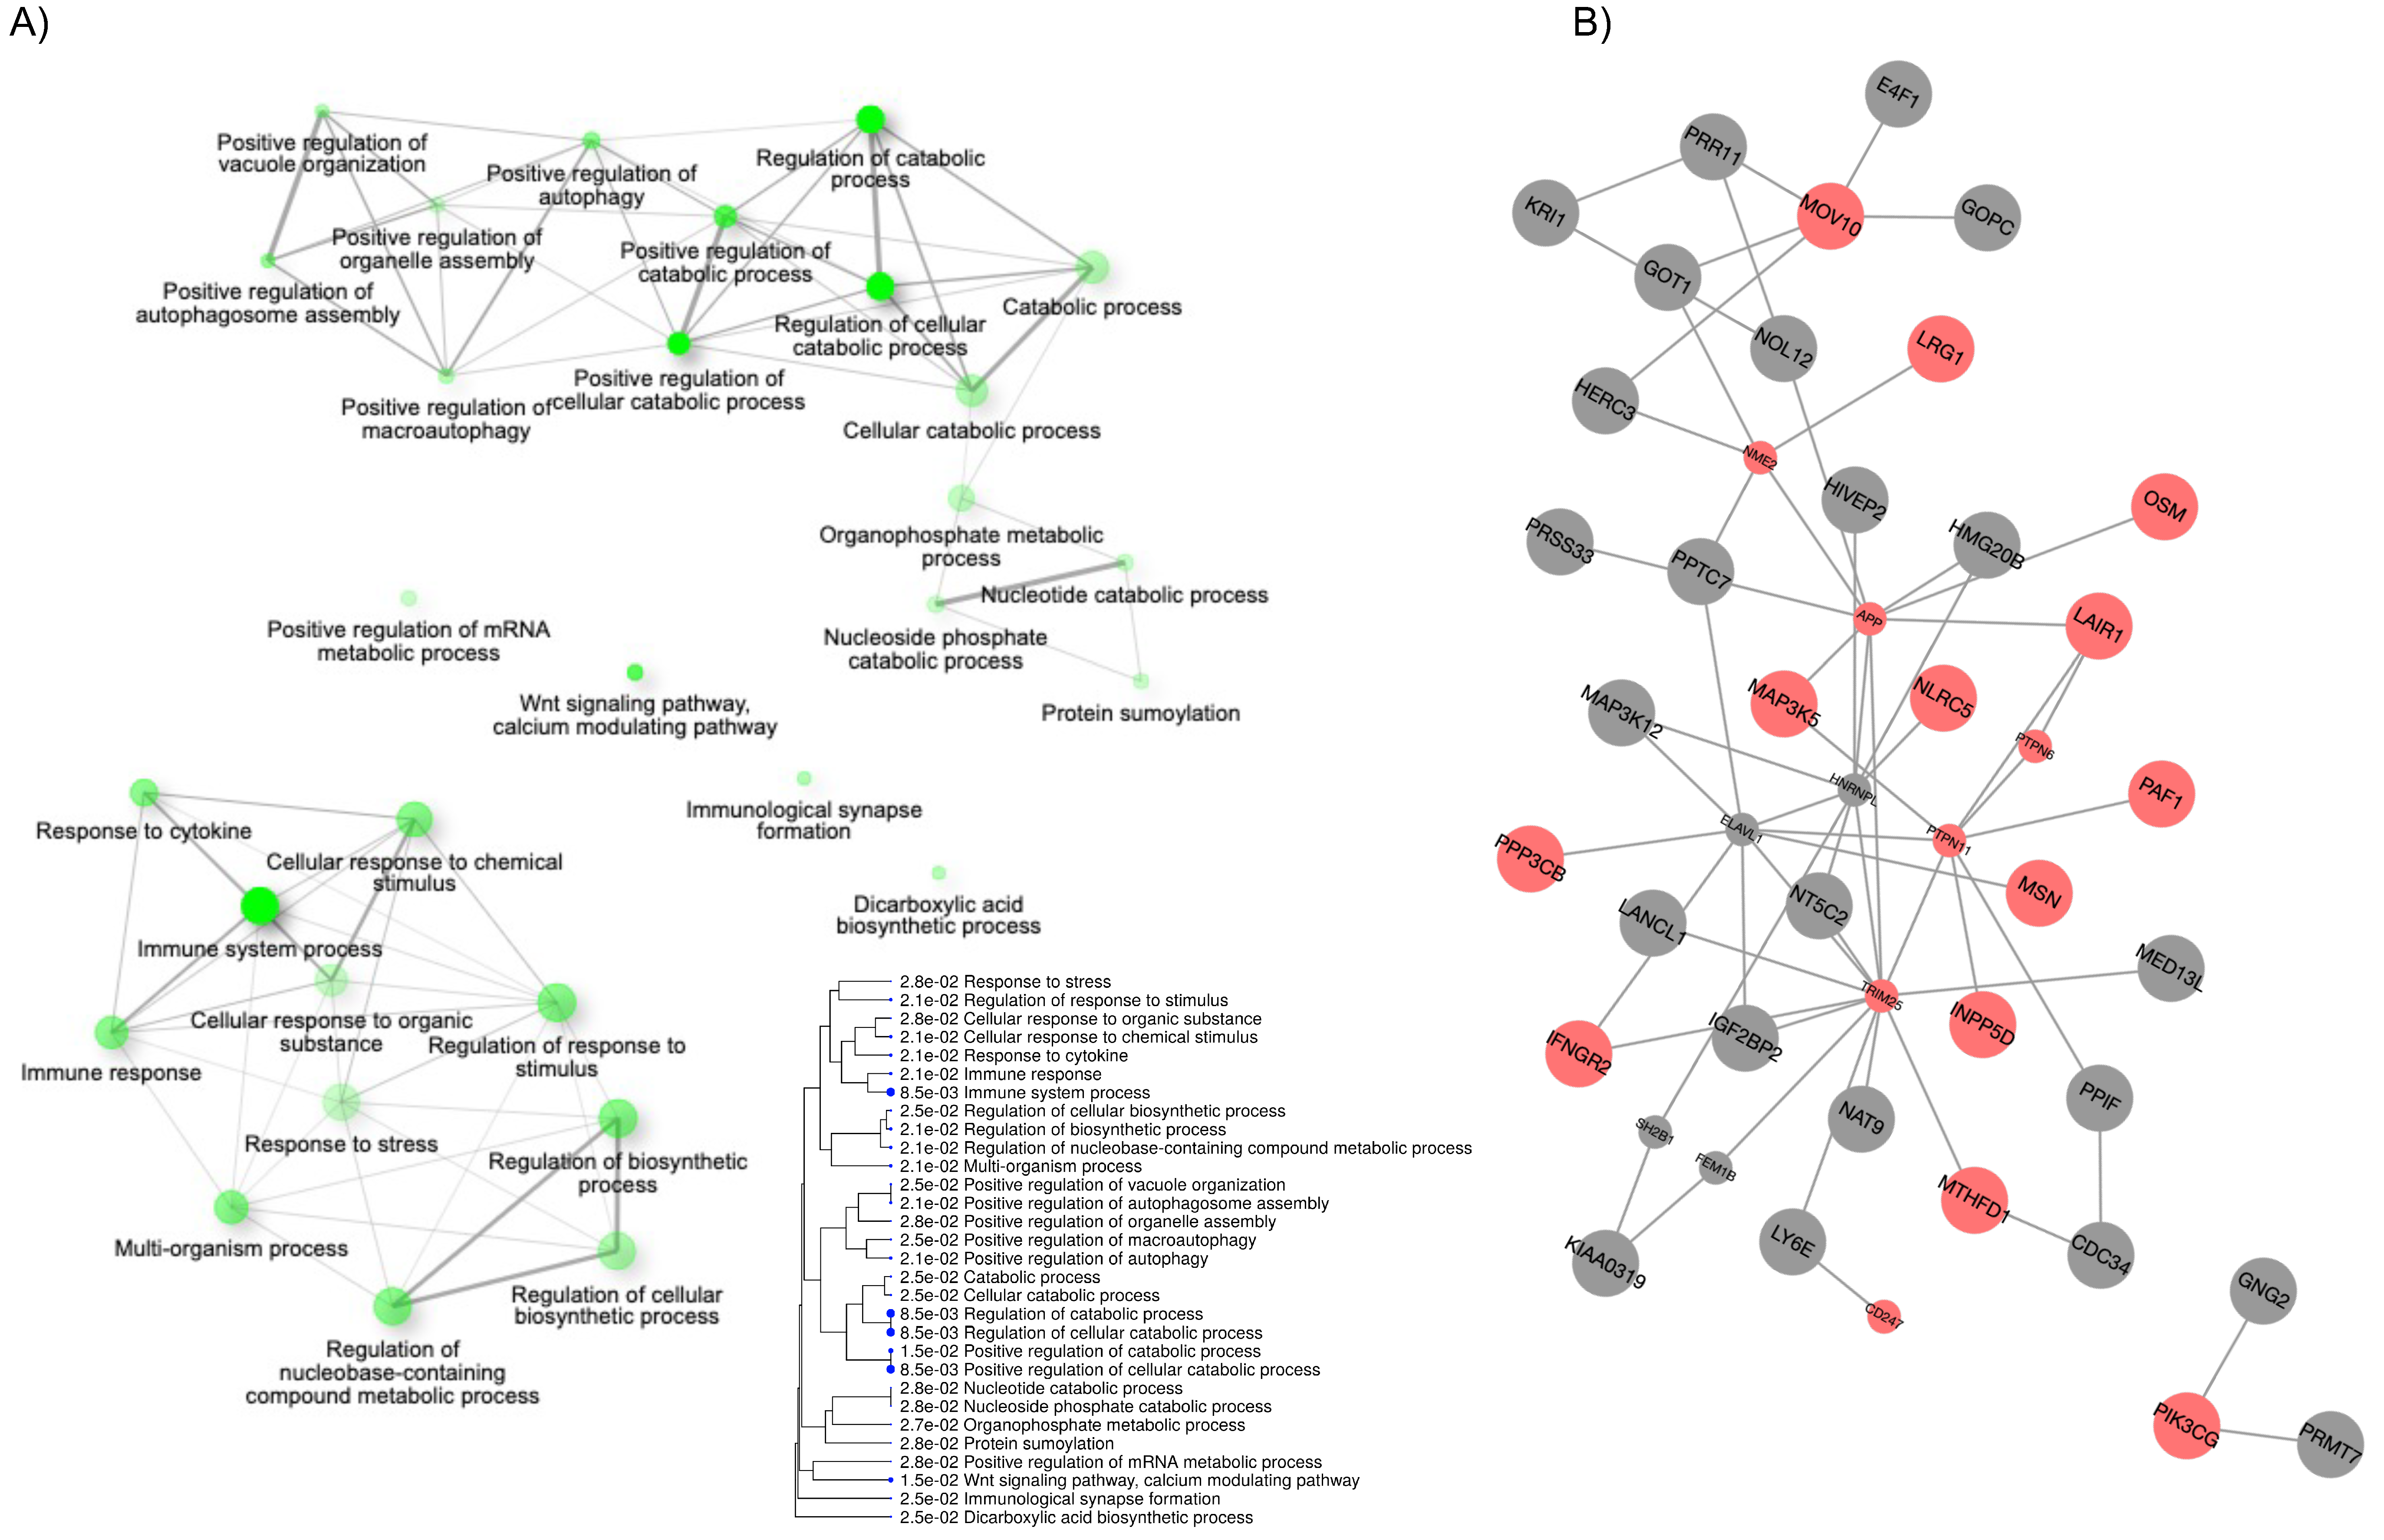
2.3. Biological Processes Modulated by Vitamin D
3. Discussion
4. Materials and Methods
4.1. Study Design and Sample Collection
4.2. Transcriptome Fingerprint Assay—A Reduced Blood Transcriptomic Panel
4.3. Gene Expression Profiling and Statistical Analysis
4.4. Networks, Gene Ontology, and Annotation
4.5. Literature LabTM Gene Retriever
5. Conclusions
Supplementary Materials
Author Contributions
Funding
Institutional Review Board Statement
Informed Consent Statement
Data Availability Statement
Acknowledgments
Conflicts of Interest
Abbreviations
| BMI | Body-mass index |
| CAMP | cathelicidin antimicrobial peptide |
| CD14 | cluster of differentiation 14 |
| COVID-19 | Coronavirus disease |
| Ct, dCt, ddCt | Threshold cycle, normalized Ct, differential dCt |
| CYP27B1 | cytochrome P450 family 27 subfamily B member 1 |
| DC | Dendritic cell |
| DEGs | Differentially expressed genes |
| GO | Gene Ontology |
| GPCR | G protein-coupled receptors |
| IFN | Interferon |
| IL6 | Interleukin 6 |
| LGIC | ligand-gated ion channel |
| MAP | Mitogen-activated protein |
| MeSH terms | Medical subject headings terms |
| NF-kB | Nuclear factor kappa B subunit 1 |
| NR | Non responders |
| ORT | Over representation test |
| PCA | Principal component analysis |
| PCR | Polymerase chain reaction |
| PI3K | Phospho-inositol-3 kinase |
| PIP2 | Phosphatidylinositol (4,5)-bisphosphate |
| PIP3 | Phosphatidylinositol (3,4,5)-trisphosphate |
| PMID | PubMed ID |
| R | Responders |
| ROS | Reactive oxygen species |
| RTKs | Receptor tyrosine kinases |
| SARS-CoV-2 | severe acute respiratory syndrome coronavirus 2 |
| Th1 cell | T helper type 1 cell |
| TFA | Transcriptomic Fingerprint Assay |
| TLR | Toll-like receptor |
| TNF | Tumor necrosis factor |
| Treg cell | T regulatory cell |
| VDR | Vitamin D receptor |
| VDRE | Vitamin D response element |
| Vitamin D3 | 25-(OH)D or cholecalciferol |
References
- Busse, B.; Bale, H.A.; Zimmermann, E.A.; Panganiban, B.; Barth, H.D.; Carriero, A.; Vettorazzi, E.; Zustin, J.; Hahn, M.; Ager, J.W.; et al. Vitamin D Deficiency Induces Early Signs of Aging in Human Bone, Increasing the Risk of Fracture. Sci. Transl. Med. 2013, 5, 193ra88. [Google Scholar] [CrossRef] [PubMed]
- Singh, P.; Kumar, M.; Al Khodor, S. Vitamin D Deficiency in the Gulf Cooperation Council: Exploring the Triad of Genetic Predisposition, the Gut Microbiome and the Immune System. Front. Immunol. 2019, 10, 1042. [Google Scholar] [CrossRef]
- Lips, P. Worldwide Status of Vitamin D Nutrition. J. Steroid Biochem. Mol. Biol. 2010, 121, 297–300. [Google Scholar] [CrossRef]
- Chakhtoura, M.; Rahme, M.; Chamoun, N.; El-Hajj Fuleihan, G. Vitamin D in the Middle East and North Africa. Bone Rep. 2018, 8, 135–146. [Google Scholar] [CrossRef]
- Nimri, L.F. Vitamin D Status of Female UAE College Students and Associated Risk Factors. J. Public Health Oxf. Engl. 2018, 40, e284–e290. [Google Scholar] [CrossRef] [PubMed]
- Buyukuslu, N.; Esin, K.; Hizli, H.; Sunal, N.; Yigit, P.; Garipagaoglu, M. Clothing Preference Affects Vitamin D Status of Young Women. Nutr. Res. 2014, 34, 688–693. [Google Scholar] [CrossRef] [PubMed]
- Sharif, E.A.; Rizk, N.M. The Prevalence of Vitamin D Deficiency among Female College Students at Qatar University. Saudi Med. J. 2011, 32, 964–965. [Google Scholar]
- Hall, L.M.; Kimlin, M.G.; Aronov, P.A.; Hammock, B.D.; Slusser, J.R.; Woodhouse, L.R.; Stephensen, C.B. Vitamin D Intake Needed to Maintain Target Serum 25-Hydroxyvitamin D Concentrations in Participants with Low Sun Exposure and Dark Skin Pigmentation Is Substantially Higher than Current Recommendations. J. Nutr. 2010, 140, 542–550. [Google Scholar] [CrossRef] [Green Version]
- Gallagher, J.C.; Sai, A.; Templin, T.; Smith, L. Dose Response to Vitamin D Supplementation in Postmenopausal Women: A Randomized Trial. Ann. Intern. Med. 2012, 156, 425–437. [Google Scholar] [CrossRef]
- Heaney, R.P.; Davies, K.M.; Chen, T.C.; Holick, M.F.; Barger-Lux, M.J. Human Serum 25-Hydroxycholecalciferol Response to Extended Oral Dosing with Cholecalciferol. Am. J. Clin. Nutr. 2003, 77, 204–210. [Google Scholar] [CrossRef] [Green Version]
- Yao, P.; Sun, L.; Lu, L.; Ding, H.; Chen, X.; Tang, L.; Xu, X.; Liu, G.; Hu, Y.; Ma, Y.; et al. Effects of Genetic and Nongenetic Factors on Total and Bioavailable 25(OH)D Responses to Vitamin D Supplementation. J. Clin. Endocrinol. Metab. 2017, 102, 100–110. [Google Scholar] [CrossRef] [PubMed]
- Singh, P.; Rawat, A.; Alwakeel, M.; Sharif, E.; Al Khodor, S. The Potential Role of Vitamin D Supplementation as a Gut Microbiota Modifier in Healthy Individuals. Sci. Rep. 2020, 10, 21641. [Google Scholar] [CrossRef]
- Di Rosa, M.; Malaguarnera, M.; Nicoletti, F.; Malaguarnera, L. Vitamin D3: A Helpful Immuno-Modulator. Immunology 2011, 134, 123–139. [Google Scholar] [CrossRef]
- Sintzel, M.B.; Rametta, M.; Reder, A.T. Vitamin D and Multiple Sclerosis: A Comprehensive Review. Neurol. Ther. 2018, 7, 59–85. [Google Scholar] [CrossRef] [Green Version]
- Kostoglou-Athanassiou, I.; Athanassiou, P.; Lyraki, A.; Raftakis, I.; Antoniadis, C. Vitamin D and Rheumatoid Arthritis. Ther. Adv. Endocrinol. Metab. 2012, 3, 181–187. [Google Scholar] [CrossRef]
- Hassanalilou, T.; Khalili, L.; Ghavamzadeh, S.; Shokri, A.; Payahoo, L.; Bishak, Y.K. Role of Vitamin D Deficiency in Systemic Lupus Erythematosus Incidence and Aggravation. Auto Immun. Highlights 2017, 9, 1. [Google Scholar] [CrossRef] [Green Version]
- Parizadeh, S.M.; Jafarzadeh-Esfehani, R.; Hassanian, S.M.; Mottaghi-Moghaddam, A.; Ghazaghi, A.; Ghandehari, M.; Alizade-Noghani, M.; Khazaei, M.; Ghayour-Mobarhan, M.; Ferns, G.A.; et al. Vitamin D in Inflammatory Bowel Disease: From Biology to Clinical Implications. Complement. Ther. Med. 2019, 47, 102189. [Google Scholar] [CrossRef]
- Yang, C.-Y.; Leung, P.S.C.; Adamopoulos, I.E.; Gershwin, M.E. The Implication of Vitamin D and Autoimmunity: A Comprehensive Review. Clin. Rev. Allergy Immunol. 2013, 45, 217–226. [Google Scholar] [CrossRef]
- Martineau, A.R.; Jolliffe, D.A.; Hooper, R.L.; Greenberg, L.; Aloia, J.F.; Bergman, P.; Dubnov-Raz, G.; Esposito, S.; Ganmaa, D.; Ginde, A.A.; et al. Vitamin D Supplementation to Prevent Acute Respiratory Tract Infections: Systematic Review and Meta-Analysis of Individual Participant Data. BMJ 2017, 356, i6583. [Google Scholar] [CrossRef] [Green Version]
- Brenner, H.; Holleczek, B.; Schöttker, B. Vitamin D Insufficiency and Deficiency and Mortality from Respiratory Diseases in a Cohort of Older Adults: Potential for Limiting the Death Toll during and beyond the COVID-19 Pandemic? Nutrients 2020, 12, 2488. [Google Scholar] [CrossRef]
- Zemb, P.; Bergman, P.; Camargo, C.A.; Cavalier, E.; Cormier, C.; Courbebaisse, M.; Hollis, B.; Minisola, S.; Pilz, S.; Pludowski, P.; et al. Vitamin D Deficiency and COVID-19 Pandemic. J. Glob. Antimicrob. Resist. 2020, 22, 133–134. [Google Scholar] [CrossRef]
- Grant, W.B.; Lahore, H.; McDonnell, S.L.; Baggerly, C.A.; French, C.B.; Aliano, J.L.; Bhattoa, H.P. Evidence That Vitamin D Supplementation Could Reduce Risk of Influenza and COVID-19 Infections and Deaths. Nutrients 2020, 12, 988. [Google Scholar] [CrossRef] [Green Version]
- Meltzer, D.O.; Best, T.J.; Zhang, H.; Vokes, T.; Arora, V.; Solway, J. Association of Vitamin D Deficiency and Treatment with COVID-19 Incidence. MedRxiv 2020. [Google Scholar] [CrossRef]
- La Vignera, S.; Cannarella, R.; Condorelli, R.A.; Torre, F.; Aversa, A.; Calogero, A.E. Sex-Specific SARS-CoV-2 Mortality: Among Hormone-Modulated ACE2 Expression, Risk of Venous Thromboembolism and Hypovitaminosis D. Int. J. Mol. Sci. 2020, 21, 2948. [Google Scholar] [CrossRef]
- Hastie, C.E.; Mackay, D.F.; Ho, F.; Celis-Morales, C.A.; Katikireddi, S.V.; Niedzwiedz, C.L.; Jani, B.D.; Welsh, P.; Mair, F.S.; Gray, S.R.; et al. Vitamin D Concentrations and COVID-19 Infection in UK Biobank. Diabetes Metab. Syndr. 2020, 14, 561–565. [Google Scholar] [CrossRef]
- Jeon, S.-M.; Shin, E.-A. Exploring Vitamin D Metabolism and Function in Cancer. Exp. Mol. Med. 2018, 50, 20. [Google Scholar] [CrossRef] [PubMed] [Green Version]
- Lamkanfi, M.; Kanneganti, T.-D. Regulation of Immune Pathways by the NOD-like Receptor NLRC5. Immunobiology 2012, 217, 13–16. [Google Scholar] [CrossRef] [PubMed] [Green Version]
- Zhao, Y.; Shao, F. NLRC5: A NOD-like Receptor Protein with Many Faces in Immune Regulation. Cell Res. 2012, 22, 1099–1101. [Google Scholar] [CrossRef] [Green Version]
- Huang, D.W.; Sherman, B.T.; Lempicki, R.A. Bioinformatics Enrichment Tools: Paths toward the Comprehensive Functional Analysis of Large Gene Lists. Nucleic Acids Res. 2009, 37, 1–13. [Google Scholar] [CrossRef] [Green Version]
- Alhamdoosh, M.; Ng, M.; Wilson, N.J.; Sheridan, J.M.; Huynh, H.; Wilson, M.J.; Ritchie, M.E. Combining Multiple Tools Outperforms Individual Methods in Gene Set Enrichment Analyses. Bioinform. Oxf. Engl. 2017, 33, 414–424. [Google Scholar] [CrossRef]
- Ge, S.X.; Jung, D.; Yao, R. ShinyGO: A Graphical Gene-Set Enrichment Tool for Animals and Plants. Bioinform. Oxf. Engl. 2020, 36, 2628–2629. [Google Scholar] [CrossRef] [PubMed]
- Liao, Y.; Wang, J.; Jaehnig, E.J.; Shi, Z.; Zhang, B. WebGestalt 2019: Gene Set Analysis Toolkit with Revamped UIs and APIs. Nucleic Acids Res. 2019, 47, W199–W205. [Google Scholar] [CrossRef] [PubMed] [Green Version]
- Glaab, E.; Baudot, A.; Krasnogor, N.; Schneider, R.; Valencia, A. EnrichNet: Network-Based Gene Set Enrichment Analysis. Bioinformatics 2012, 28, i451–i457. [Google Scholar] [CrossRef] [PubMed] [Green Version]
- Wang, J.; Ma, Z.; Carr, S.A.; Mertins, P.; Zhang, H.; Zhang, Z.; Chan, D.W.; Ellis, M.J.C.; Townsend, R.R.; Smith, R.D.; et al. Proteome Profiling Outperforms Transcriptome Profiling for Coexpression Based Gene Function Prediction. Mol. Cell. Proteom. MCP 2017, 16, 121–134. [Google Scholar] [CrossRef] [PubMed] [Green Version]
- Sevilla, J.L.; Segura, V.; Podhorski, A.; Guruceaga, E.; Mato, J.M.; Martínez-Cruz, L.A.; Corrales, F.J.; Rubio, A. Correlation between Gene Expression and GO Semantic Similarity. IEEE/ACM Trans. Comput. Biol. Bioinform. 2005, 2, 330–338. [Google Scholar] [CrossRef]
- Supek, F.; Bošnjak, M.; Škunca, N.; Šmuc, T. REVIGO Summarizes and Visualizes Long Lists of Gene Ontology Terms. PLoS ONE 2011, 6, e21800. [Google Scholar] [CrossRef] [Green Version]
- Pike, J.W.; Meyer, M.B. The Vitamin D Receptor: New Paradigms for the Regulation of Gene Expression by 1,25-Dihydroxyvitamin D3. Endocrinol. Metab. Clin. N. Am. 2010, 39, 255–269. [Google Scholar] [CrossRef] [PubMed] [Green Version]
- Nurminen, V.; Seuter, S.; Carlberg, C. Primary Vitamin D Target Genes of Human Monocytes. Front. Physiol. 2019, 10, 194. [Google Scholar] [CrossRef] [Green Version]
- Carlberg, C. Vitamin D Signaling in the Context of Innate Immunity: Focus on Human Monocytes. Available online: https://pubmed.ncbi.nlm.nih.gov/31572402/?from_term=Primary+Vitamin+D+Target+Genes+of+Human+Monocytes&from_sort=pubdate&from_size=200&from_pos=1 (accessed on 11 June 2020).
- Shirvani, S.S.; Nouri, M.; Sakhinia, E.; Babaloo, Z.; Jadideslam, G.; Shahriar, A.; Farhadi, J.; Khabbazi, A. The Expression and Methylation Status of Vitamin D Receptor Gene in Behcet’s Disease. Immun. Inflamm. Dis. 2019, 7, 308–317. [Google Scholar] [CrossRef]
- Carlberg, C.; Campbell, M.J. Vitamin D Receptor Signaling Mechanisms: Integrated Actions of a Well-Defined Transcription Factor. Steroids 2013, 78, 127–136. [Google Scholar] [CrossRef] [Green Version]
- Gombart, A.F. The Vitamin D-Antimicrobial Peptide Pathway and Its Role in Protection against Infection. Future Microbiol. 2009, 4, 1151–1165. [Google Scholar] [CrossRef] [Green Version]
- Sadeghi, K.; Wessner, B.; Laggner, U.; Ploder, M.; Tamandl, D.; Friedl, J.; Zügel, U.; Steinmeyer, A.; Pollak, A.; Roth, E.; et al. Vitamin D3 Down-Regulates Monocyte TLR Expression and Triggers Hyporesponsiveness to Pathogen-Associated Molecular Patterns. Eur. J. Immunol. 2006, 36, 361–370. [Google Scholar] [CrossRef]
- Dickie, L.J.; Church, L.D.; Coulthard, L.R.; Mathews, R.J.; Emery, P.; McDermott, M.F. Vitamin D3 Down-Regulates Intracellular Toll-like Receptor 9 Expression and Toll-like Receptor 9-Induced IL-6 Production in Human Monocytes. Rheumatol. Oxf. Engl. 2010, 49, 1466–1471. [Google Scholar] [CrossRef] [PubMed] [Green Version]
- Yazdanpanah, E.; Mahmoudi, M.; Sahebari, M.; Rezaieyazdi, Z.; Esmaeili, S.-A.; Tabasi, N.; Jaberi, S.; Sahebkar, A.; Rastin, M. Vitamin D3 Alters the Expression of Toll-like Receptors in Peripheral Blood Mononuclear Cells of Patients with Systemic Lupus Erythematosus. J. Cell. Biochem. 2017, 118, 4831–4835. [Google Scholar] [CrossRef]
- He, L.; Liu, T.; Shi, Y.; Tian, F.; Hu, H.; Deb, D.K.; Chen, Y.; Bissonnette, M.; Li, Y.C. Gut Epithelial Vitamin D Receptor Regulates Microbiota-Dependent Mucosal Inflammation by Suppressing Intestinal Epithelial Cell Apoptosis. Endocrinology 2018, 159, 967–979. [Google Scholar] [CrossRef] [PubMed] [Green Version]
- Du, J.; Chen, Y.; Shi, Y.; Liu, T.; Cao, Y.; Tang, Y.; Ge, X.; Nie, H.; Zheng, C.; Li, Y.C. 1,25-Dihydroxyvitamin D Protects Intestinal Epithelial Barrier by Regulating the Myosin Light Chain Kinase Signaling Pathway. Inflamm. Bowel Dis. 2015, 21, 2495–2506. [Google Scholar] [CrossRef]
- Rao Muvva, J.; Parasa, V.R.; Lerm, M.; Svensson, M.; Brighenti, S. Polarization of Human Monocyte-Derived Cells with Vitamin D Promotes Control of Mycobacterium Tuberculosis Infection. Front. Immunol. 2019, 10, 3157. [Google Scholar] [CrossRef] [PubMed]
- Reichel, H.; Koeffler, H.P.; Bishop, J.E.; Norman, A.W. 25-Hydroxyvitamin D3 Metabolism by Lipopolysaccharide-Stimulated Normal Human Macrophages. J. Clin. Endocrinol. Metab. 1987, 64, 1–9. [Google Scholar] [CrossRef] [PubMed]
- Liu, P.T.; Stenger, S.; Li, H.; Wenzel, L.; Tan, B.H.; Krutzik, S.R.; Ochoa, M.T.; Schauber, J.; Wu, K.; Meinken, C.; et al. Toll-like Receptor Triggering of a Vitamin D-Mediated Human Antimicrobial Response. Science 2006, 311, 1770–1773. [Google Scholar] [CrossRef] [PubMed]
- Laaksi, I.; Ruohola, J.-P.; Tuohimaa, P.; Auvinen, A.; Haataja, R.; Pihlajamäki, H.; Ylikomi, T. An Association of Serum Vitamin D Concentrations <40 Nmol/L with Acute Respiratory Tract Infection in Young Finnish Men. Am. J. Clin. Nutr. 2007, 86, 714–717. [Google Scholar] [CrossRef] [PubMed] [Green Version]
- Karatekin, G.; Kaya, A.; Salihoğlu, O.; Balci, H.; Nuhoğlu, A. Association of Subclinical Vitamin D Deficiency in Newborns with Acute Lower Respiratory Infection and Their Mothers. Eur. J. Clin. Nutr. 2009, 63, 473–477. [Google Scholar] [CrossRef] [Green Version]
- Walker, V.P.; Modlin, R.L. The Vitamin D Connection to Pediatric Infections and Immune Function. Pediatr. Res. 2009, 65, 106R–113R. [Google Scholar] [CrossRef] [Green Version]
- Chun, R.F.; Adams, J.S.; Hewison, M. Back to the Future: A New Look at “old” Vitamin D. J. Endocrinol. 2008, 198, 261–269. [Google Scholar] [CrossRef] [Green Version]
- Verjans, E.-T.; Zels, S.; Luyten, W.; Landuyt, B.; Schoofs, L. Molecular Mechanisms of LL-37-Induced Receptor Activation: An Overview. Peptides 2016, 85, 16–26. [Google Scholar] [CrossRef] [PubMed]
- Winkler, D.G.; Faia, K.L.; DiNitto, J.P.; Ali, J.A.; White, K.F.; Brophy, E.E.; Pink, M.M.; Proctor, J.L.; Lussier, J.; Martin, C.M.; et al. PI3K-δ and PI3K-γ Inhibition by IPI-145 Abrogates Immune Responses and Suppresses Activity in Autoimmune and Inflammatory Disease Models. Chem. Biol. 2013, 20, 1364–1374. [Google Scholar] [CrossRef] [Green Version]
- Cyprian, F.; Lefkou, E.; Varoudi, K.; Girardi, G. Immunomodulatory Effects of Vitamin D in Pregnancy and Beyond. Front. Immunol. 2019, 10, 2739. [Google Scholar] [CrossRef] [PubMed] [Green Version]
- Baeke, F.; Takiishi, T.; Korf, H.; Gysemans, C.; Mathieu, C. Vitamin D: Modulator of the Immune System. Curr. Opin. Pharmacol. 2010, 10, 482–496. [Google Scholar] [CrossRef] [PubMed]
- Zhang, H.; Wu, H.; Liu, L.; Li, H.; Shih, D.Q.; Zhang, X. 1,25-Dihydroxyvitamin D3 Regulates the Development of Chronic Colitis by Modulating Both T Helper (Th)1 and Th17 Activation. APMIS Acta Pathol. Microbiol. Immunol. Scand. 2015, 123, 490–501. [Google Scholar] [CrossRef]
- Lemire, J.M.; Adams, J.S.; Kermani-Arab, V.; Bakke, A.C.; Sakai, R.; Jordan, S.C. 1,25-Dihydroxyvitamin D3 Suppresses Human T Helper/Inducer Lymphocyte Activity in Vitro. J. Immunol. Baltim. Md 1950 1985, 134, 3032–3035. [Google Scholar]
- Cantorna, M.T.; Snyder, L.; Lin, Y.-D.; Yang, L. Vitamin D and 1,25(OH)2D Regulation of T Cells. Nutrients 2015, 7, 3011–3021. [Google Scholar] [CrossRef] [PubMed] [Green Version]
- Jeffery, L.E.; Burke, F.; Mura, M.; Zheng, Y.; Qureshi, O.S.; Hewison, M.; Walker, L.S.K.; Lammas, D.A.; Raza, K.; Sansom, D.M. 1,25-Dihydroxyvitamin D3 and IL-2 Combine to Inhibit T Cell Production of Inflammatory Cytokines and Promote Development of Regulatory T Cells Expressing CTLA-4 and FoxP3. J. Immunol. Baltim. Md 1950 2009, 183, 5458–5467. [Google Scholar] [CrossRef] [PubMed] [Green Version]
- Joshi, S.; Pantalena, L.-C.; Liu, X.K.; Gaffen, S.L.; Liu, H.; Rohowsky-Kochan, C.; Ichiyama, K.; Yoshimura, A.; Steinman, L.; Christakos, S.; et al. 1,25-Dihydroxyvitamin D(3) Ameliorates Th17 Autoimmunity via Transcriptional Modulation of Interleukin-17A. Mol. Cell. Biol. 2011, 31, 3653–3669. [Google Scholar] [CrossRef] [PubMed] [Green Version]
- Tan, Q.; Li, J.; Peng, J.; Liu, Z.; Liu, J.; Zhang, H.; Yuan, Q.; Pan, Z.; Liu, L. E4F1 Silencing Inhibits the Cell Growth through Cell-Cycle Arrest in Malignant Transformed Cells Induced by Hydroquinone. J. Biochem. Mol. Toxicol. 2019, 33, e22269. [Google Scholar] [CrossRef]
- Hatchi, E.; Rodier, G.; Lacroix, M.; Caramel, J.; Kirsh, O.; Jacquet, C.; Schrepfer, E.; Lagarrigue, S.; Linares, L.K.; Lledo, G.; et al. E4F1 Deficiency Results in Oxidative Stress–Mediated Cell Death of Leukemic Cells. J. Exp. Med. 2011, 208, 1403–1417. [Google Scholar] [CrossRef] [PubMed]
- Le Cam, L.; Linares, L.K.; Paul, C.; Julien, E.; Lacroix, M.; Hatchi, E.; Triboulet, R.; Bossis, G.; Shmueli, A.; Rodriguez, M.S.; et al. E4F1 Is an Atypical Ubiquitin Ligase That Modulates P53 Effector Functions Independently of Degradation. Cell 2006, 127, 775–788. [Google Scholar] [CrossRef] [PubMed] [Green Version]
- Manson, J.E.; Brannon, P.M.; Rosen, C.J.; Taylor, C.L. Vitamin D Deficiency—Is There Really a Pandemic? N. Engl. J. Med. 2016, 375, 1817–1820. [Google Scholar] [CrossRef]
- Fletcher, J.; Cooper, S.C.; Ghosh, S.; Hewison, M. The Role of Vitamin D in Inflammatory Bowel Disease: Mechanism to Management. Nutrients 2019, 11, 1019. [Google Scholar] [CrossRef] [Green Version]
- Lagishetty, V.; Misharin, A.V.; Liu, N.Q.; Lisse, T.S.; Chun, R.F.; Ouyang, Y.; McLachlan, S.M.; Adams, J.S.; Hewison, M. Vitamin D Deficiency in Mice Impairs Colonic Antibacterial Activity and Predisposes to Colitis. Endocrinology 2010, 151, 2423–2432. [Google Scholar] [CrossRef] [Green Version]
- Maurya, V.K.; Aggarwal, M. Factors Influencing the Absorption of Vitamin D in GIT: An Overview. J. Food Sci. Technol. 2017, 54, 3753–3765. [Google Scholar] [CrossRef]
- Garand, M.; Cai, B.; Kollmann, T.R. Environment Impacts Innate Immune Ontogeny. Innate Immun. 2017, 23, 3–10. [Google Scholar] [CrossRef]
- MacGillivray, D.M.; Kollmann, T.R. The Role of Environmental Factors in Modulating Immune Responses in Early Life. Front. Immunol. 2014, 5, 434. [Google Scholar] [CrossRef] [PubMed] [Green Version]
- Al-Daghri, N.M.; Yakout, S.M.; Wani, K.; Khattak, M.N.K.; Garbis, S.D.; Chrousos, G.P.; Al-Attas, O.S.; Alokail, M.S. IGF and IGFBP as an Index for Discrimination between Vitamin D Supplementation Responders and Nonresponders in Overweight Saudi Subjects. Medicine 2018, 97, e0702. [Google Scholar] [CrossRef] [PubMed]
- Altman, M.C.; Rinchai, D.; Baldwin, N.; Whalen, E.; Garand, M.; Kabeer, B.A.; Toufiq, M.; Presnell, S.; Chiche, L.; Jourde-Chiche, N.; et al. A Novel Repertoire of Blood Transcriptome Modules Based on Co-Expression Patterns Across Sixteen Disease and Physiological States. bioRxiv 2019, 525709. [Google Scholar] [CrossRef] [Green Version]
- Chaussabel, D.; Baldwin, N. Democratizing Systems Immunology with Modular Transcriptional Repertoires Analyses. Nat. Rev. Immunol. 2014, 14, 271–280. [Google Scholar] [CrossRef]
- Chaussabel, D.; Quinn, C.; Shen, J.; Patel, P.; Glaser, C.; Baldwin, N.; Stichweh, D.; Blankenship, D.; Li, L.; Munagala, I.; et al. A Modular Analysis Framework for Blood Genomics Studies: Application to Systemic Lupus Erythematosus. Immunity 2008, 29, 150–164. [Google Scholar] [CrossRef] [Green Version]
- Febbo, P.G.; Mulligan, M.G.; Slonina, D.A.; Stegmaier, K.; Di Vizio, D.; Martinez, P.R.; Loda, M.; Taylor, S.C. Literature Lab: A Method of Automated Literature Interrogation to Infer Biology from Microarray Analysis. BMC Genom. 2007, 8, 461. [Google Scholar] [CrossRef] [Green Version]
- Development and Characterization of a Fixed Repertoire of Blood Transcriptome Modules Based on Co-Expression Patterns Across Immunological States|BioRxiv. Available online: https://www.biorxiv.org/content/10.1101/525709v2 (accessed on 1 June 2020).
- Shirvani, A.; Kalajian, T.A.; Song, A.; Holick, M.F. Disassociation of Vitamin D’s Calcemic Activity and Non-Calcemic Genomic Activity and Individual Responsiveness: A Randomized Controlled Double-Blind Clinical Trial. Sci. Rep. 2019, 9, 17685. [Google Scholar] [CrossRef]
- Eekhout, I.; van de Wiel, M.A.; Heymans, M.W. Methods for Significance Testing of Categorical Covariates in Logistic Regression Models after Multiple Imputation: Power and Applicability Analysis. BMC Med. Res. Methodol. 2017, 17, 129. [Google Scholar] [CrossRef]
- Warde-Farley, D.; Donaldson, S.L.; Comes, O.; Zuberi, K.; Badrawi, R.; Chao, P.; Franz, M.; Grouios, C.; Kazi, F.; Lopes, C.T.; et al. The GeneMANIA Prediction Server: Biological Network Integration for Gene Prioritization and Predicting Gene Function. Nucleic Acids Res. 2010, 38, W214–W220. [Google Scholar] [CrossRef] [PubMed]
- Szklarczyk, D.; Gable, A.L.; Lyon, D.; Junge, A.; Wyder, S.; Huerta-Cepas, J.; Simonovic, M.; Doncheva, N.T.; Morris, J.H.; Bork, P.; et al. STRING V11: Protein-Protein Association Networks with Increased Coverage, Supporting Functional Discovery in Genome-Wide Experimental Datasets. Nucleic Acids Res. 2019, 47, D607–D613. [Google Scholar] [CrossRef] [Green Version]


Publisher’s Note: MDPI stays neutral with regard to jurisdictional claims in published maps and institutional affiliations. |
© 2021 by the authors. Licensee MDPI, Basel, Switzerland. This article is an open access article distributed under the terms and conditions of the Creative Commons Attribution (CC BY) license (https://creativecommons.org/licenses/by/4.0/).
Share and Cite
Garand, M.; Toufiq, M.; Singh, P.; Huang, S.S.Y.; Tomei, S.; Mathew, R.; Mattei, V.; Al Wakeel, M.; Sharif, E.; Al Khodor, S. Immunomodulatory Effects of Vitamin D Supplementation in a Deficient Population. Int. J. Mol. Sci. 2021, 22, 5041. https://0-doi-org.brum.beds.ac.uk/10.3390/ijms22095041
Garand M, Toufiq M, Singh P, Huang SSY, Tomei S, Mathew R, Mattei V, Al Wakeel M, Sharif E, Al Khodor S. Immunomodulatory Effects of Vitamin D Supplementation in a Deficient Population. International Journal of Molecular Sciences. 2021; 22(9):5041. https://0-doi-org.brum.beds.ac.uk/10.3390/ijms22095041
Chicago/Turabian StyleGarand, Mathieu, Mohammed Toufiq, Parul Singh, Susie Shih Yin Huang, Sara Tomei, Rebecca Mathew, Valentina Mattei, Mariam Al Wakeel, Elham Sharif, and Souhaila Al Khodor. 2021. "Immunomodulatory Effects of Vitamin D Supplementation in a Deficient Population" International Journal of Molecular Sciences 22, no. 9: 5041. https://0-doi-org.brum.beds.ac.uk/10.3390/ijms22095041