
Characterization of an Immortalized Human Microglial Cell Line as a Tool for the Study of Diabetic Retinopathy


Abstract
:1. Introduction
2. Results
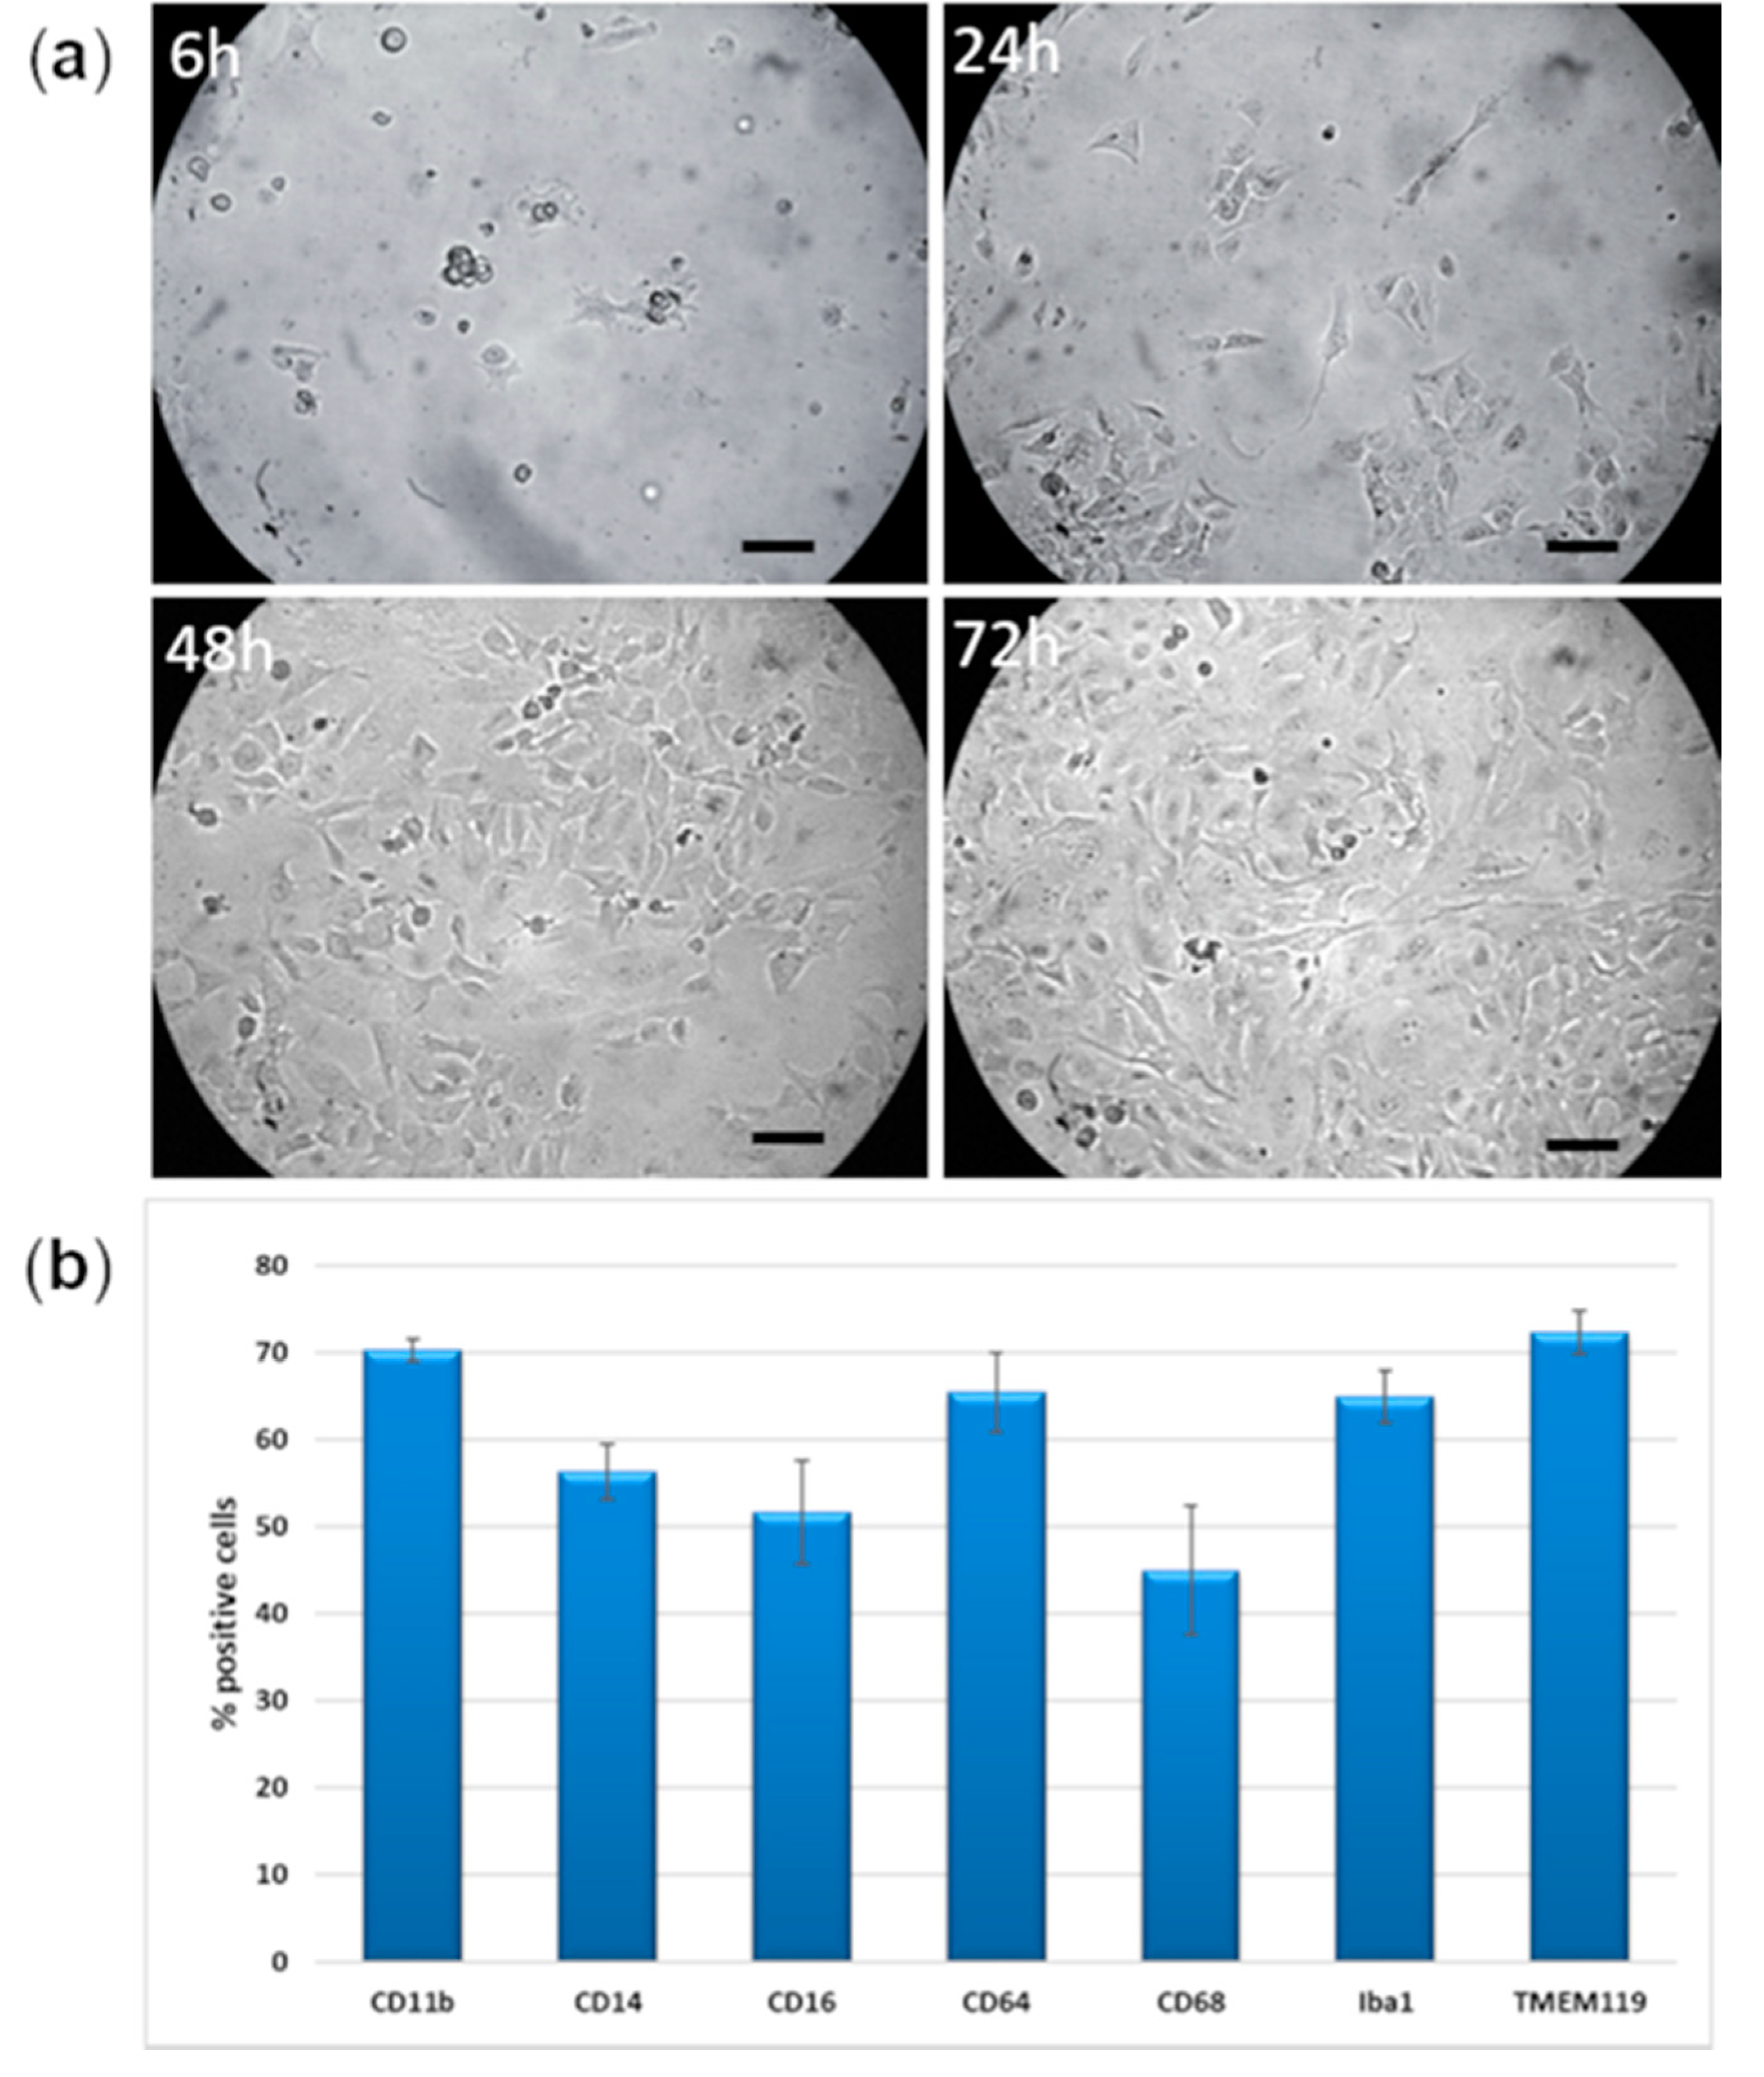
2.1. Morphology
2.2. Human Microglia Markers
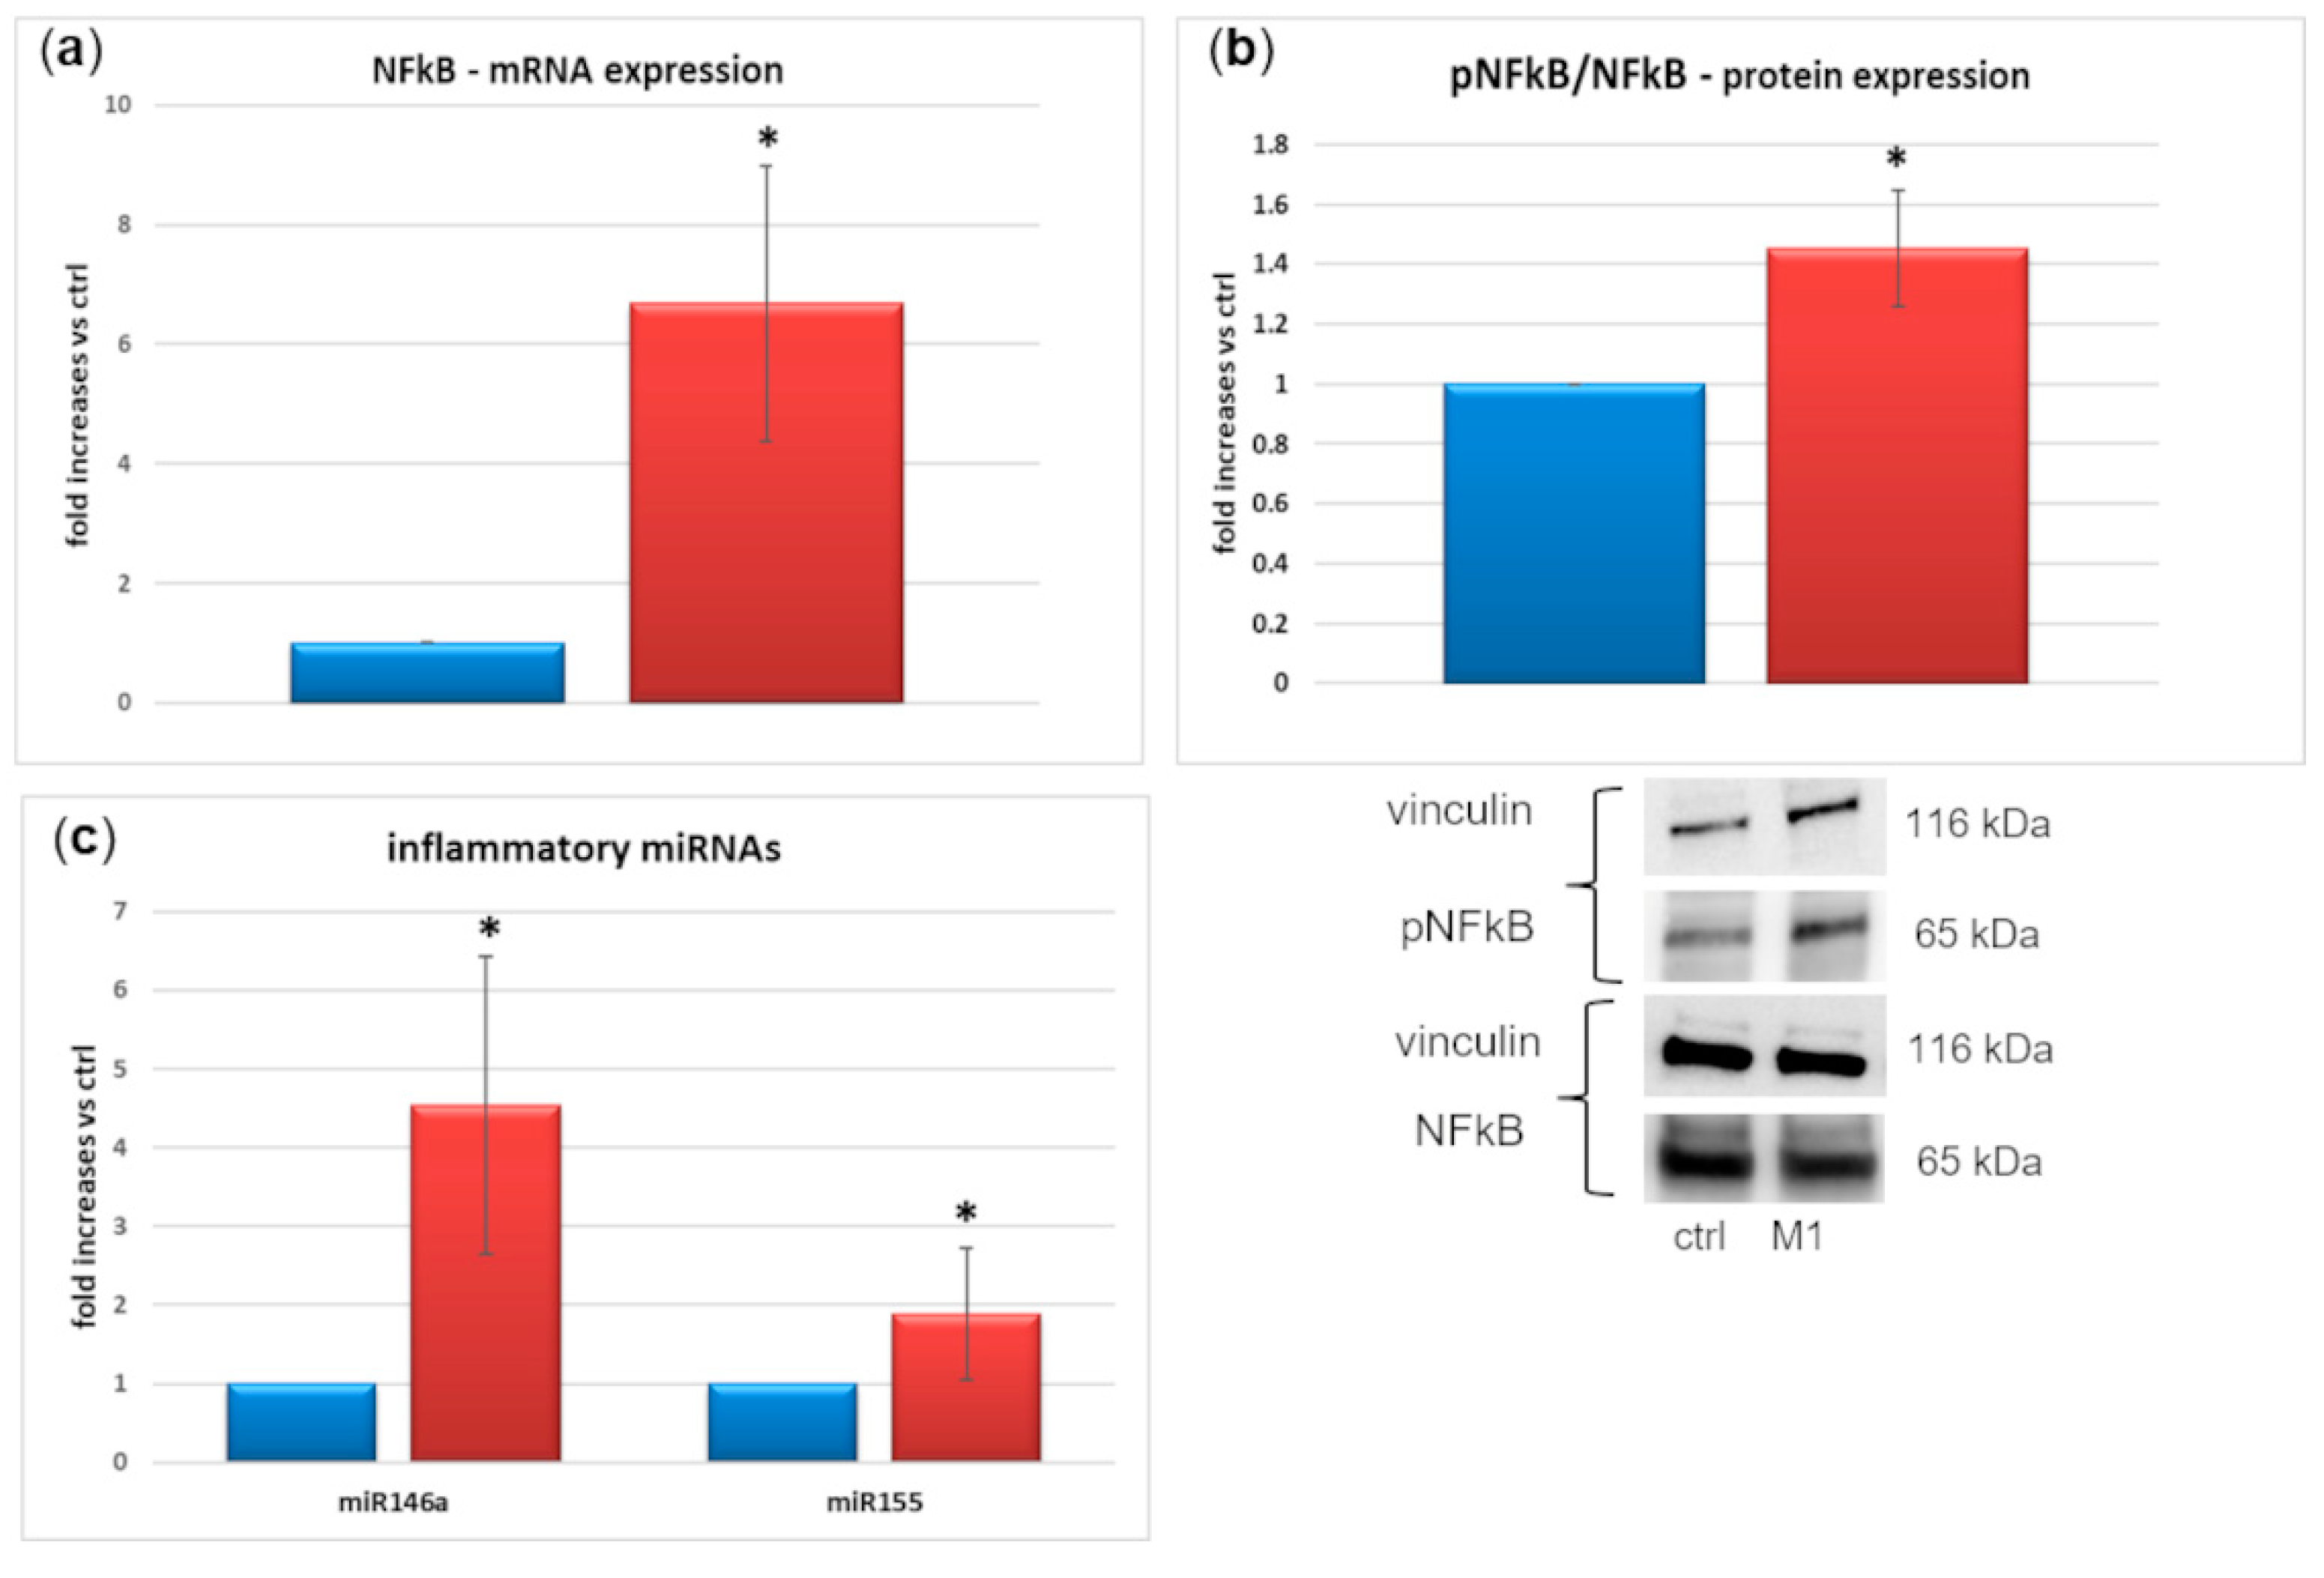
2.3. M1 Activation
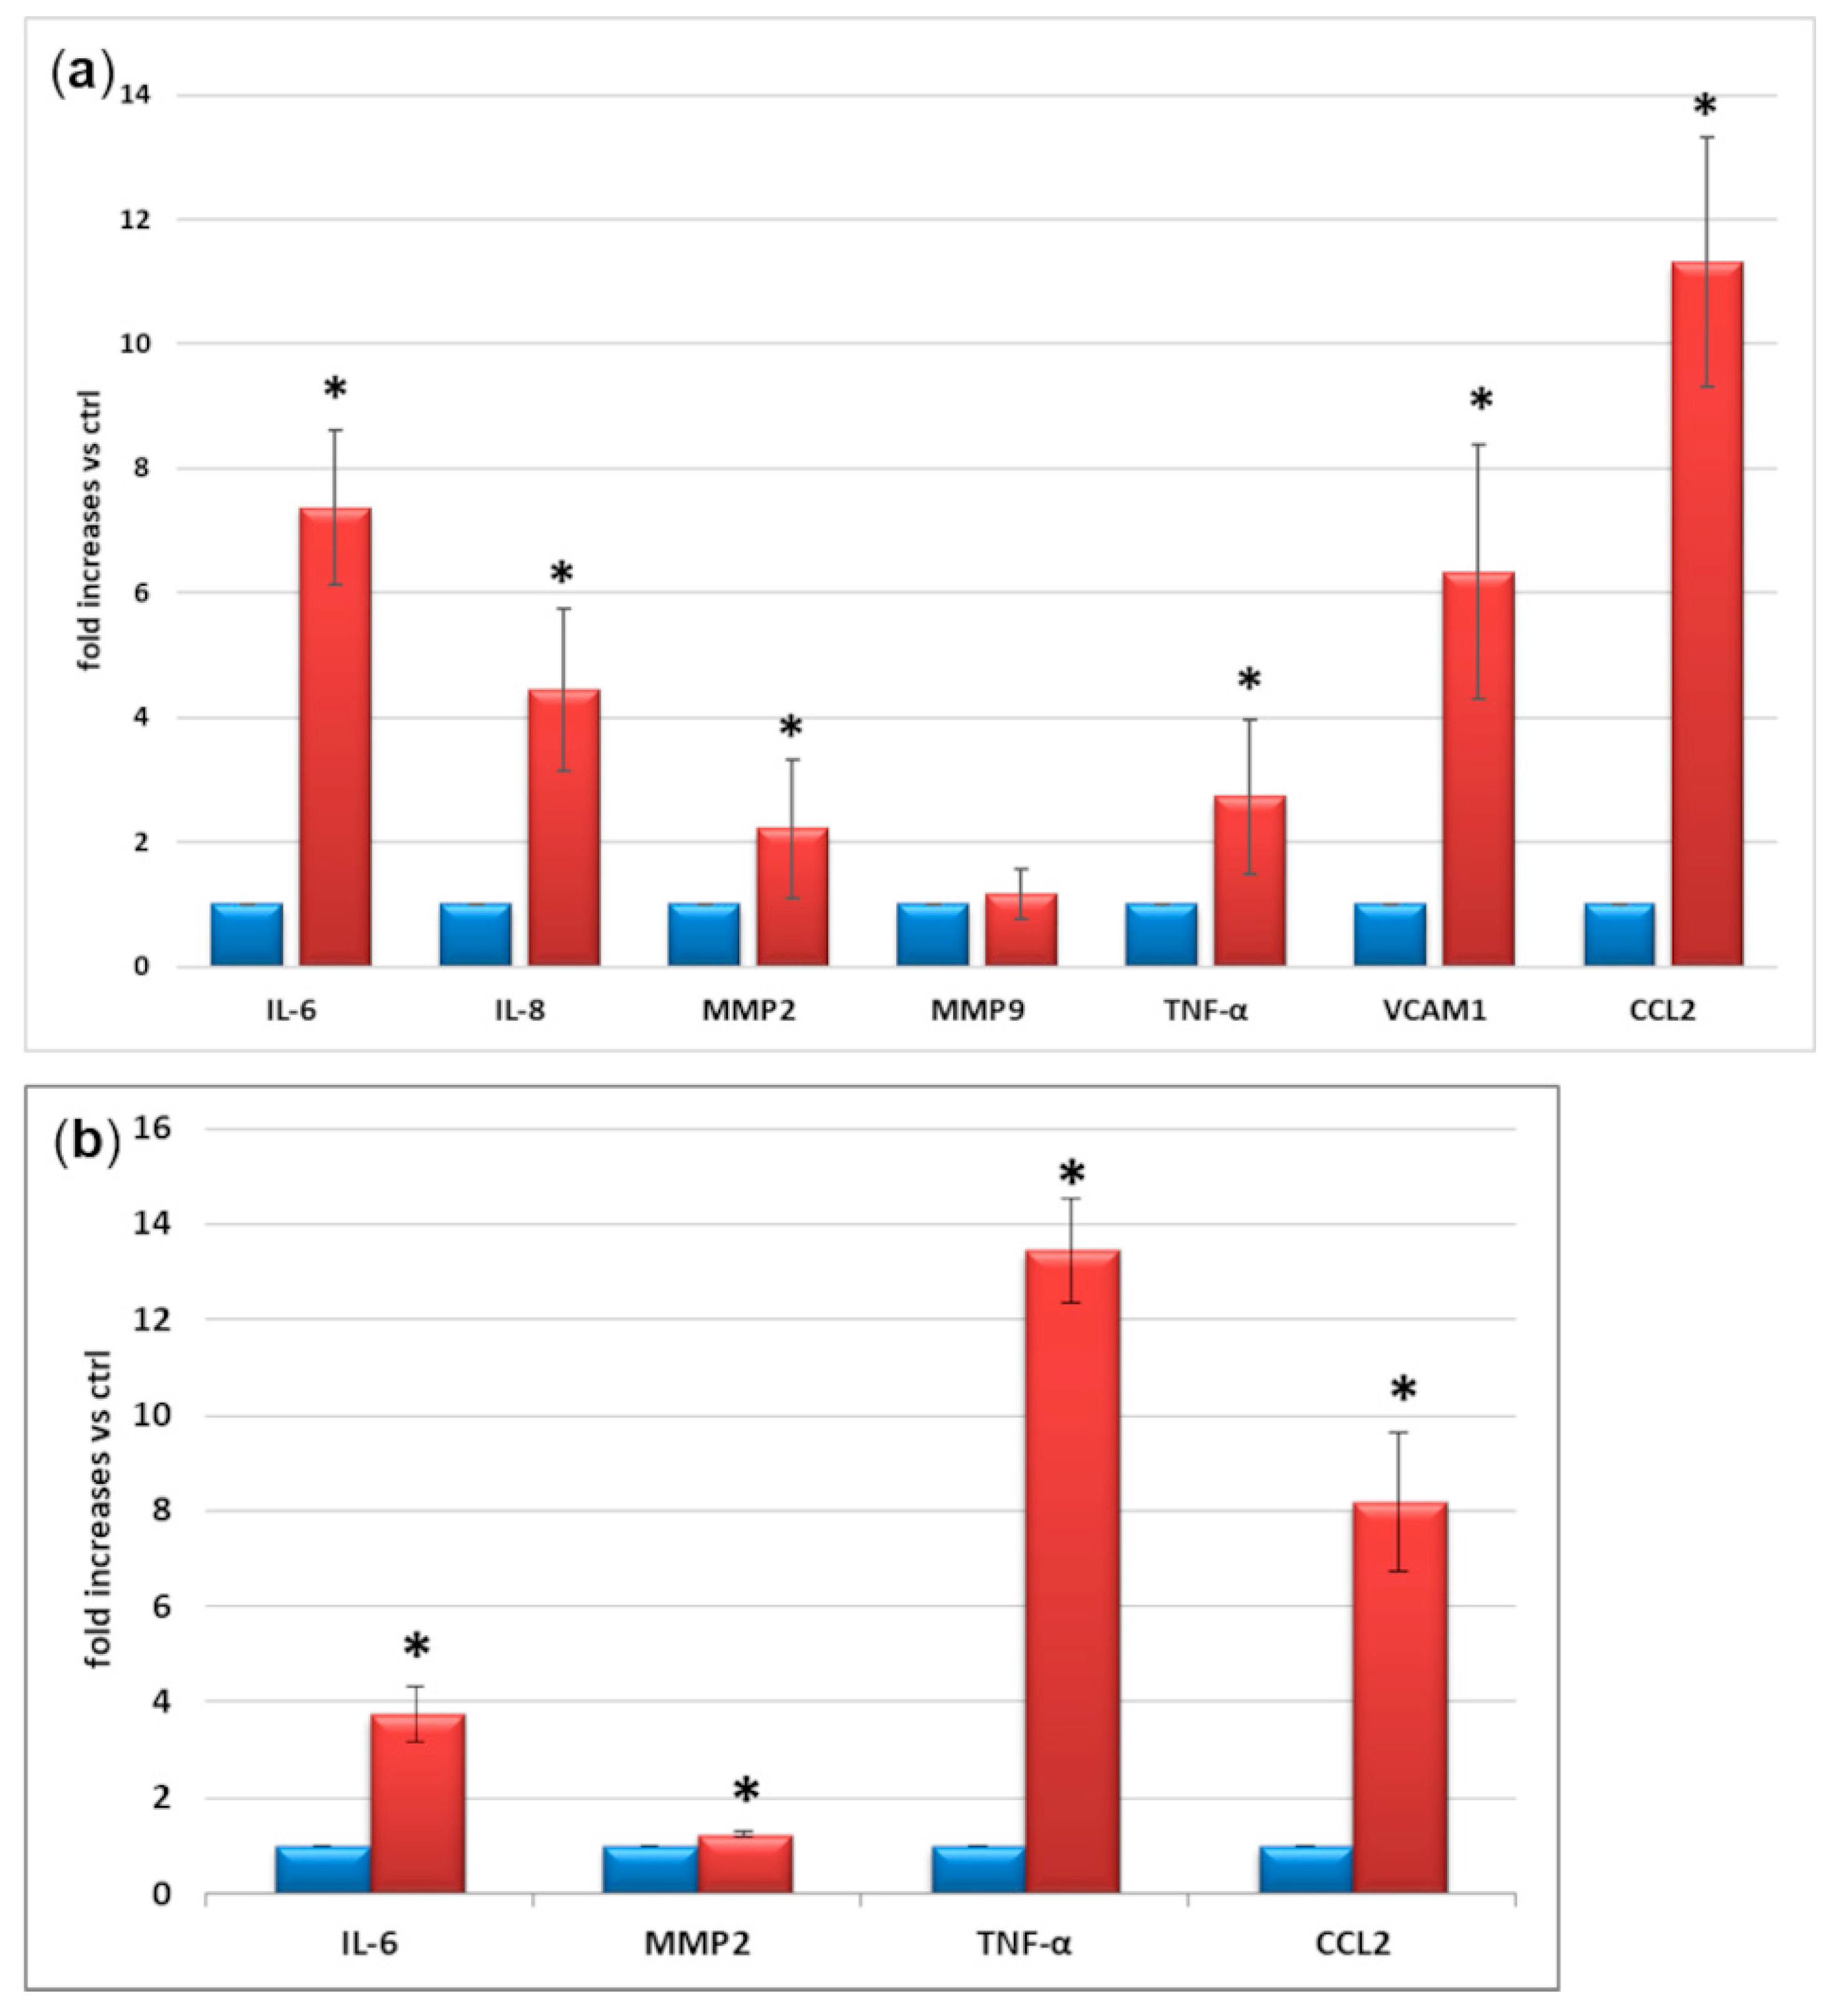
2.4. Expression and Secretion of Inflammatory Factors
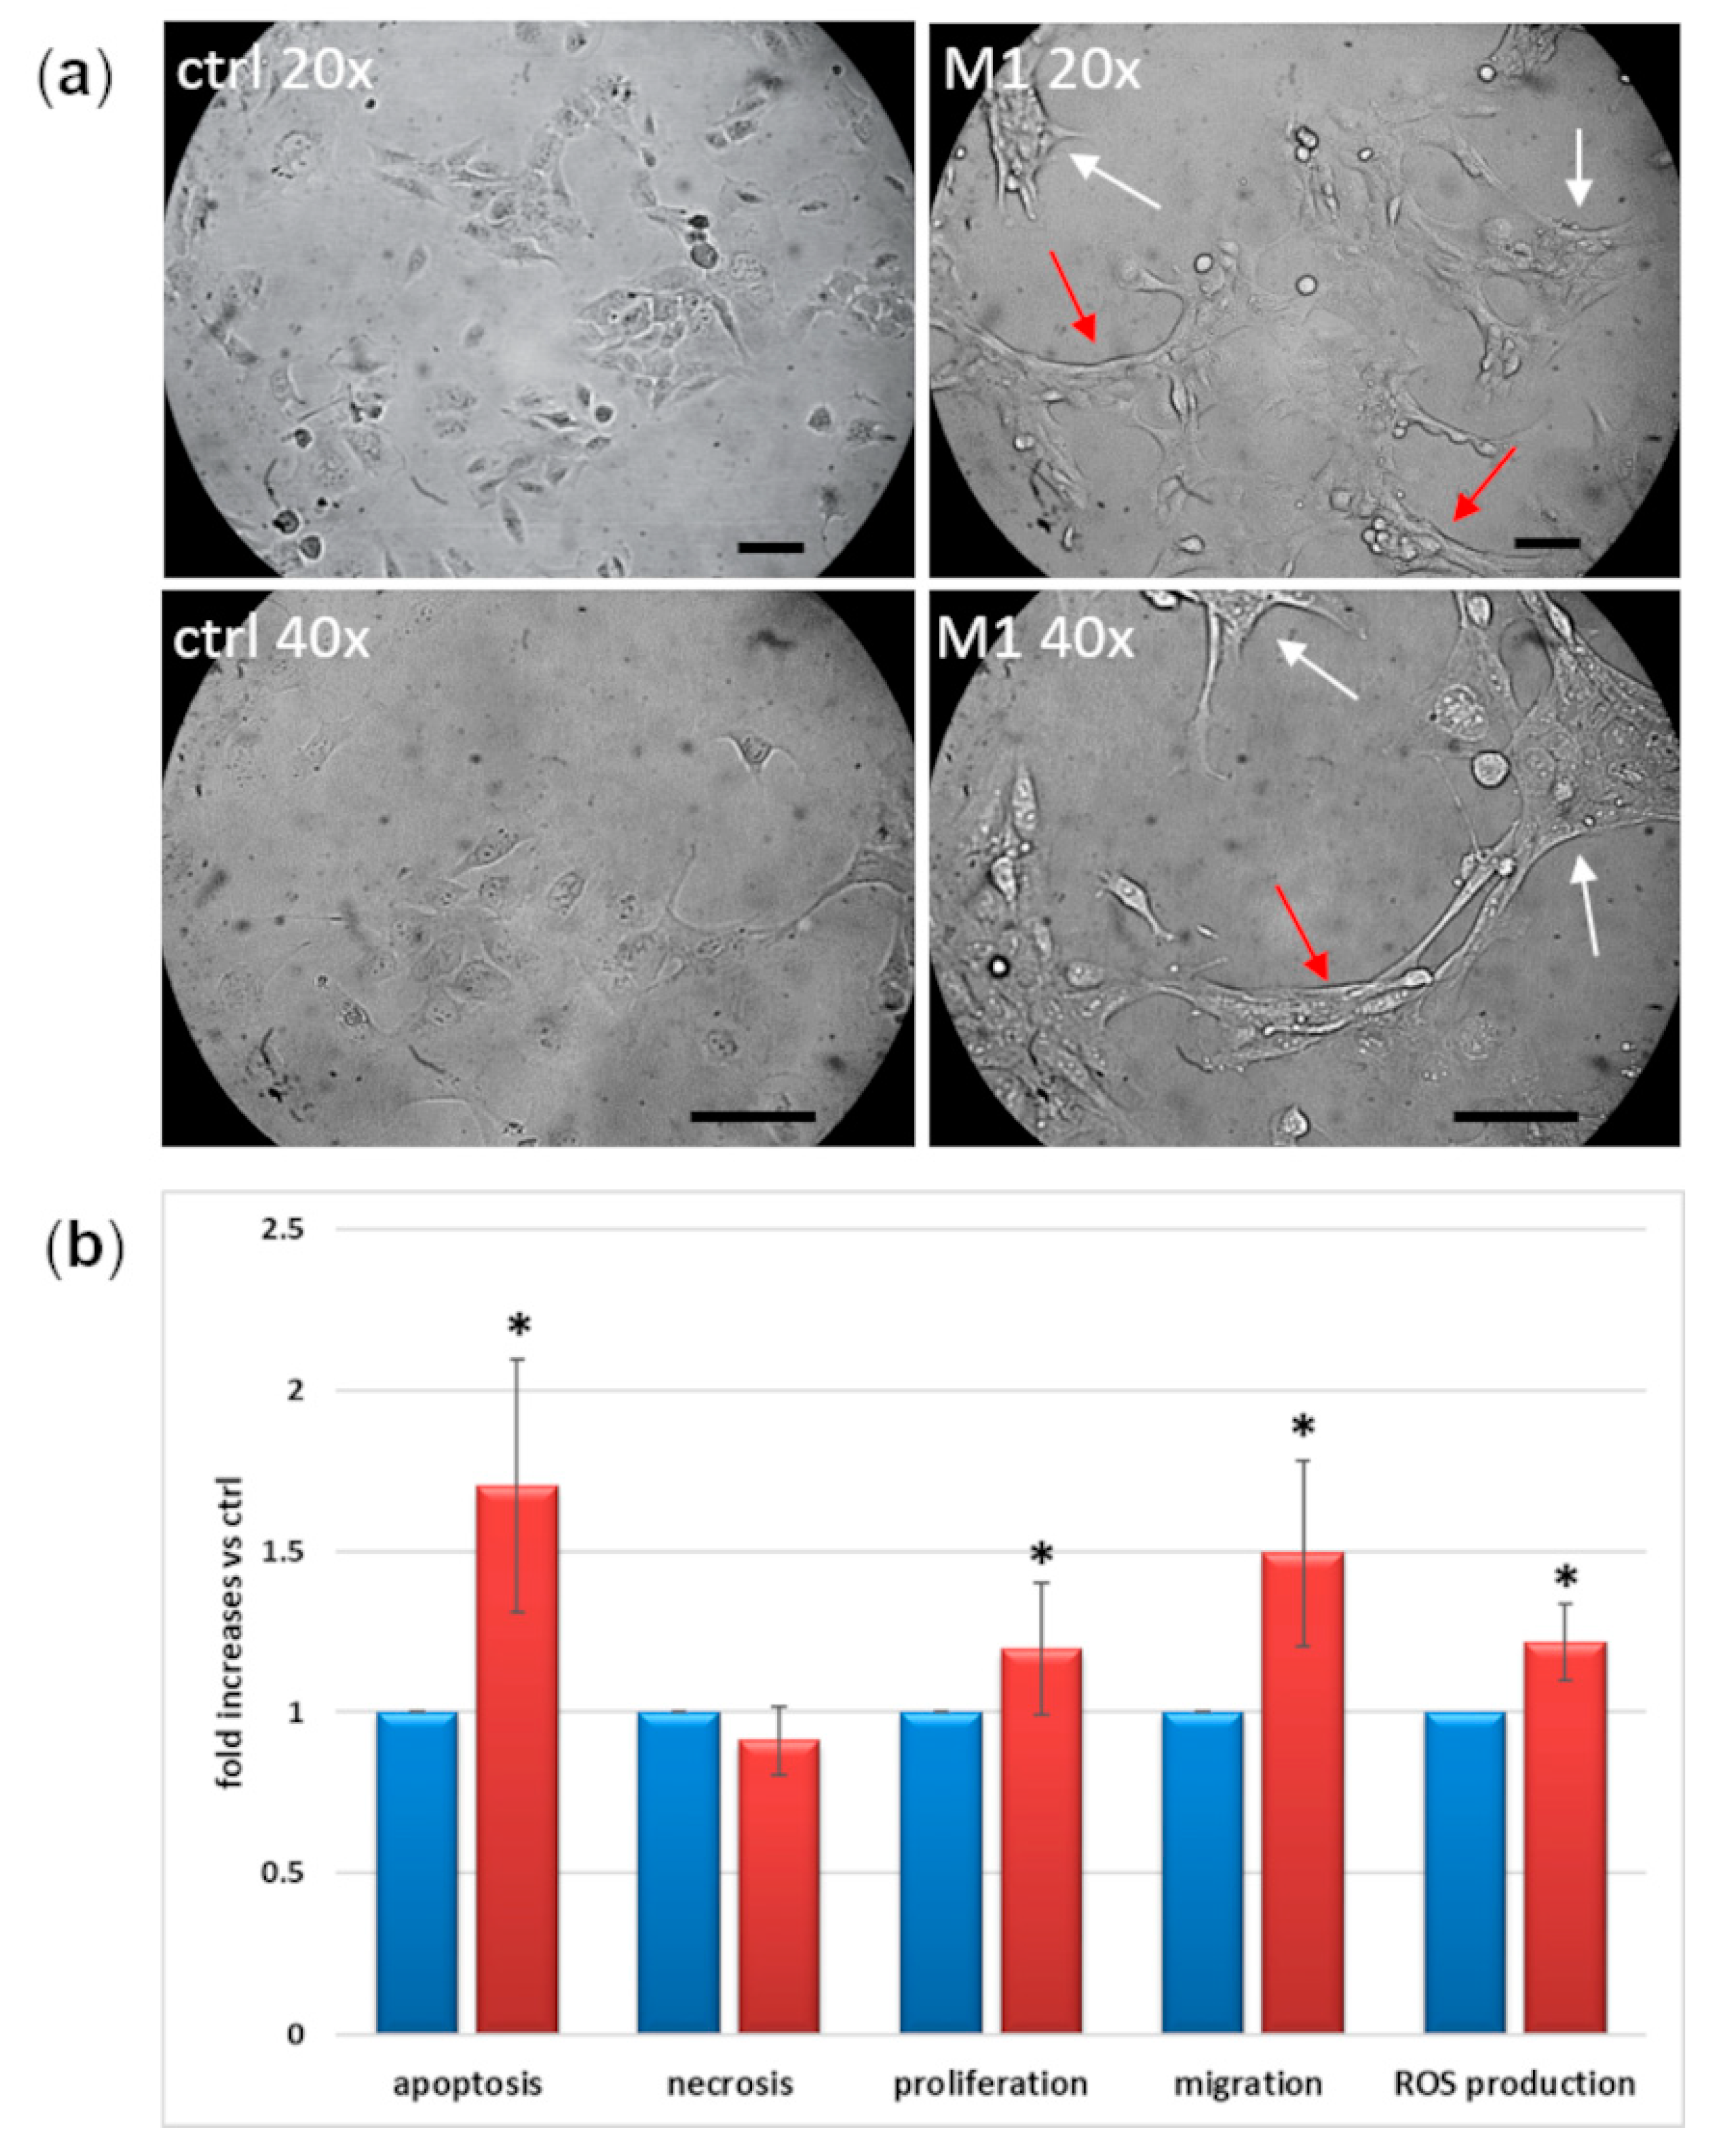
2.5. Morphological and Functional Changes
3. Discussion
4. Conclusions
5. Materials and Methods
5.1. Cell Culture
5.2. M1 Activation
5.3. Griess Reaction
5.4. Western Blot Analysis
5.5. Expression of Microglial Markers
5.6. Quantitative Real Time PCR (qRT-PCR)
5.7. Cytokine Secretion
5.8. Cell Function Parameters
5.9. miRNAs
5.10. Statistical Analysis
Supplementary Materials
Author Contributions
Funding
Institutional Review Board Statement
Informed Consent Statement
Data Availability Statement
Conflicts of Interest
References
- Simó, R.; Hernández, C.; European Consortium for the Early Treatment of Diabetic Retinopathy (EUROCONDOR). Neurodegeneration in the diabetic eye: New insights and therapeutic perspectives. Trends Endocrinol. Metab. 2014, 25, 23–33. [Google Scholar] [CrossRef] [PubMed]
- Arroba, A.I.; Valverde, Á. Modulation of microglia in the retina: New insights into diabetic retinopathy. Acta Diabetol. 2017, 54, 527–533. [Google Scholar] [CrossRef] [PubMed]
- Armulik, A.; Abramsson, A.; Betsholtz, C. Endothelial/pericyte interactions. Circ. Res. 2005, 97, 512–523. [Google Scholar] [CrossRef] [PubMed] [Green Version]
- Kettenmann, H.; Hanisch, U.K.; Noda, M.; Verkhratsky, A. Physiology of microglia. Physiol. Rev. 2011, 91, 461–553. [Google Scholar] [CrossRef]
- Arroba, A.I.; Campos-Caro, A.; Aguilar-Diosdado, M.; Valverde, Á. IGF-1, Inflammation and Retinal Degeneration: A Close Network. Front. Aging Neurosci. 2018, 10, 203. [Google Scholar] [CrossRef]
- Kinuthia, U.M.; Wolf, A.; Langmann, T. Microglia and Inflammatory Responses in Diabetic Retinopathy. Front. Immunol. 2020, 11, 564077. [Google Scholar] [CrossRef]
- Quan, Y.; Jiang, C.T.; Xue, B.; Zhu, S.G.; Wang, X. High glucose stimulates TNFα and MCP-1 expression in rat microglia via ROS and NF-κB pathways. Acta Pharmacol. Sin. 2011, 32, 188–193. [Google Scholar] [CrossRef] [Green Version]
- Du, Y.; Smith, M.A.; Miller, C.M.; Kern, T.S. Diabetes-induced nitrative stress in the retina, and correction by aminoguanidine. J. Neurochem. 2002, 80, 771–779. [Google Scholar] [CrossRef]
- Simpson, D.S.A.; Oliver, P.L. ROS Generation in Microglia: Understanding Oxidative Stress and Inflammation in Neurodegenerative Disease. Antioxidants 2020, 9, 743. [Google Scholar] [CrossRef]
- Dong, N.; Chang, L.; Wang, B.; Chu, L. Retinal neuronal MCP-1 induced by AGEs stimulates TNF-α expression in rat microglia via p38, ERK, and NF-κB pathways. Mol. Vis. 2014, 20, 616–628. [Google Scholar]
- Baptista, F.I.; Aveleira, C.A.; Castilho, Á.F.; Ambrósio, A.F. Elevated Glucose and Interleukin-1β Differentially Affect Retinal Microglial Cell Proliferation. Mediat. Inflamm. 2017, 2017, 4316316. [Google Scholar] [CrossRef] [PubMed] [Green Version]
- Hsieh, C.F.; Liu, C.K.; Lee, C.T.; Yu, L.E.; Wang, J.Y. Acute glucose fluctuation impacts microglial activity, leading to inflammatory activation or self-degradation. Sci. Rep. 2019, 9, 840. [Google Scholar] [CrossRef] [PubMed] [Green Version]
- Mazzeo, A.; Arroba, A.I.; Beltramo, E.; Valverde, A.M.; Porta, M. Somatostatin protects human retinal pericytes from inflammation mediated by microglia. Exp. Eye Res. 2017, 164, 46–54. [Google Scholar] [CrossRef] [PubMed]
- Davis, R.L.; Buck, D.J.; McCracken, K.; Cox, G.W.; Das, S. Interleukin-1β-induced inflammatory signaling in C20 human microglial cells. Neuroimmunol. Neuroinflamm. 2018, 5, 11. [Google Scholar] [CrossRef]
- Chiavari, M.; Ciotti, G.M.P.; Navarra, P.; Lisi, L. Pro-Inflammatory Activation of A New Immortalized Human Microglia Cell Line. Brain Sci. 2019, 9, 111. [Google Scholar] [CrossRef] [Green Version]
- Da Pozzo, E.; Tremolanti, C.; Costa, B.; Giacomelli, C.; Milenkovic, V.M.; Bader, S.; Wetzel, C.H.; Rupprecht, R.; Taliani, S.; Settimo, F.D.; et al. Microglial Pro-Inflammatory and Anti-Inflammatory Phenotypes Are Modulated by Translocator Protein Activation. Int. J. Mol. Sci. 2019, 20, 4467. [Google Scholar] [CrossRef] [Green Version]
- Janabi, N.; Peudenier, S.; Héron, B.; Ng, K.H.; Tardieu, M. Establishment of human microglial cell lines after transfection of primary cultures of embryonic microglial cells with the SV40 large T antigen. Neurosci. Lett. 1995, 195, 105–108. [Google Scholar] [CrossRef]
- Beltramo, E.; Berrone, E.; Tarallo, S.; Porta, M. Different apoptotic responses of human and bovine pericytes to fluctuating glucose levels and protective role of thiamine. Diabetes Metab. Res. Rev. 2009, 25, 566–576. [Google Scholar] [CrossRef]
- Beltramo, E.; Nizheradze, K.; Berrone, E.; Tarallo, S.; Porta, M. Thiamine and benfotiamine prevent apoptosis induced by high glucose-conditioned extracellular matrix in human retinal pericytes. Diabetes Metab. Res. Rev. 2009, 25, 647–656. [Google Scholar] [CrossRef]
- Chen, M.; Xu, H. Parainflammation, chronic inflammation, and age-related macular degeneration. J. Leukoc. Biol. 2015, 98, 713–725. [Google Scholar] [CrossRef] [Green Version]
- Annovazzi, L.; Mellai, M.; Bovio, E.; Mazzetti, S.; Pollo, B.; Schiffer, D. Microglia immunophenotyping in gliomas. Oncol. Lett. 2018, 15, 998–1006. [Google Scholar] [CrossRef] [PubMed] [Green Version]
- Li, B.; Bedard, K.; Sorce, S.; Hinz, B.; Dubois-Dauphin, M.; Krause, K.H. NOX4 expression in human microglia leads to constitutive generation of reactive oxygen species and to constitutive IL-6 expression. J. Innate Immun. 2009, 1, 570–581. [Google Scholar] [CrossRef] [PubMed]
- Dello Russo, C.; Cappoli, N.; Coletta, I.; Mezzogori, D.; Paciello, F.; Pozzoli, G.; Navarra, P.; Battaglia, A. The human microglial HMC3 cell line: Where do we stand? A systematic literature review. J. Neuroinflamm. 2018, 15, 259. [Google Scholar] [CrossRef] [PubMed] [Green Version]
- Peterson, P.K.; Hu, S.; Anderson, W.R.; Chao, C.C. Nitric oxide production and neurotoxicity mediated by activated microglia from human versus mouse brain. J. Infect. Dis. 1994, 170, 457–460. [Google Scholar] [CrossRef] [PubMed]
- Rock, R.B.; Hu, S.; Deshpande, A.; Munir, S.; May, B.J.; Baker, C.A.; Peterson, P.K.; Kapur, V. Transcriptional response of human microglial cells to interferon-gamma. Genes Immun. 2005, 6, 712–719. [Google Scholar] [CrossRef]
- Melief, J.; Koning, N.; Schuurman, K.G.; Van De Garde, M.D.; Smolders, J.; Hoek, R.M.; Van Eijk, M.; Hamann, J.; Huitinga, I. Phenotyping primary human microglia: Tight regulation of LPS responsiveness. Glia 2012, 60, 1506–1517. [Google Scholar] [CrossRef]
- Van der Poel, M.; Hoepel, W.; Hamann, J.; Huitinga, I.; Dunnen, J.D. IgG Immune Complexes Break Immune Tolerance of Human Microglia. J. Immunol. 2020, 205, 2511–2518. [Google Scholar] [CrossRef]
- Arroba, A.I.; Alcalde-Estevez, E.; García-Ramírez, M.; Cazzoni, D.; de la Villa, P.; Sánchez-Fernández, E.M.; Mellet, C.O.; García Fernández, J.M.; Hernández, C.; Simó, R.; et al. Modulation of microglia polarization dynamics during diabetic retinopathy in db/db mice. Biochim. Biophys. Acta 2016, 1862, 1663–1674. [Google Scholar] [CrossRef]
- Hinkerohe, D.; Smikalla, D.; Haghikia, A.; Heupel, K.; Haase, C.G.; Dermietzel, R.; Faustmann, P.M. Effects of cytokines on microglial phenotypes and astroglial coupling in an inflammatory coculture model. Glia 2005, 52, 85–97. [Google Scholar] [CrossRef]
- Sheng, W.; Zong, Y.; Mohammad, A.; Ajit, D.; Cui, J.; Han, D.; Hamilton, J.L.; Simonyi, A.; Sun, A.Y.; Gu, Z.; et al. Pro-inflammatory cytokines and lipopolysaccharide induce changes in cell morphology, and upregulation of ERK1/2, iNOS and sPLA2-IIA expression in astrocytes and microglia. J. Neuroinflamm. 2011, 8, 121. [Google Scholar] [CrossRef] [Green Version]
- Abu el Asrar, A.M.; Maimone, D.; Morse, P.H.; Gregory, S.; Reder, A.T. Cytokines in the vitreous of patients with proliferative diabetic retinopathy. Am. J. Ophthalmol. 1992, 114, 731–736. [Google Scholar] [CrossRef]
- Yuuki, T.; Kanda, T.; Kimura, Y.; Kotajima, N.; Tamura, J.; Kobayashi, I.; Kishi, S. Inflammatory cytokines in vitreous fluid and serum of patients with diabetic vitreoretinopathy. J. Diabetes Complicat. 2001, 15, 257–259. [Google Scholar] [CrossRef]
- Lee, S.C.; Dickson, D.W.; Liu, W.; Brosnan, C.F. Induction of nitric oxide synthase activity in human astrocytes by interleukin-1 beta and interferon-gamma. J. Neuroimmunol. 1993, 46, 19–24. [Google Scholar] [CrossRef]
- Wong, G.H.; Bartlett, P.F.; Clark-Lewis, I.; Battye, F.; Schrader, J.W. Inducible expression of H-2 and Ia antigens on brain cells. Nature 1984, 310, 688–691. [Google Scholar] [CrossRef] [PubMed]
- Kawanokuchi, J.; Mizuno, T.; Takeuchi, H.; Kato, H.; Wang, J.; Mitsuma, N.; Suzumura, A. Production of interferon-gamma by microglia. Mult. Scler. J. 2006, 12, 558–564. [Google Scholar] [CrossRef] [PubMed]
- Laffer, B.; Bauer, D.; Wasmuth, S.; Busch, M.; Jalilvand, T.V.; Thanos, S.; Meyer Zu Hörste, G.; Loser, K.; Langmann, T.; Heiligenhaus, A.; et al. Loss of IL-10 Promotes Differentiation of Microglia to a M1 Phenotype. Front. Cell. Neurosci. 2019, 13, 430. [Google Scholar] [CrossRef]
- Ehrlich, L.C.; Hu, S.; Peterson, P.K.; Chao, C.C. IL-10 down-regulates human microglial IL-8 by inhibition of NF-kappaB activation. Neuroreport 1998, 9, 1723–1726. [Google Scholar] [CrossRef]
- Munder, M. Arginase: An emerging key player in the mammalian immune system. Br. J. Pharm. 2009, 158, 638–651. [Google Scholar] [CrossRef] [Green Version]
- Spittau, B.; Dokalis, N.; Prinz, M. The Role of TGFβ Signaling in Microglia Maturation and Activation. Trends Immunol. 2020, 41, 836–848. [Google Scholar] [CrossRef]
- Ehrlich, L.C.; Hu, S.; Sheng, W.S.; Sutton, R.L.; Rockswold, G.L.; Peterson, P.K.; Chao, C.C. Cytokine regulation of human microglial cell IL-8 production. J. Immunol. 1998, 160, 1944–1948. [Google Scholar]
- Altmann, C.; Schmidt, M.H.H. The Role of Microglia in Diabetic Retinopathy: Inflammation, Microvasculature Defects and Neurodegeneration. Int. J. Mol. Sci. 2018, 19, 110. [Google Scholar] [CrossRef] [PubMed] [Green Version]
- Schuetz, E.; Thanos, S. Microglia-targeted pharmacotherapy in retinal neurodegenerative diseases. Curr. Drug Targets 2004, 5, 619–627. [Google Scholar] [CrossRef] [PubMed]
- Zeng, H.Y.; Green, W.R.; Tso, M.O. Microglial activation in human diabetic retinopathy. Arch. Ophthalmol. 2008, 126, 227–232. [Google Scholar] [CrossRef] [Green Version]
- Zimmerman, M.A.; Huang, Q.; Li, F.; Liu, X.; Li, C.Y. Cell death-stimulated cell proliferation: A tissue regeneration mechanism usurped by tumors during radiotherapy. Semin. Radiat. Oncol. 2013, 23, 288–295. [Google Scholar] [CrossRef] [Green Version]
- Ping, S.; Li, Y.; Liu, S.; Zhang, Z.; Wang, J.; Zhou, Y.; Liu, K.; Huang, J.; Chen, D.; Wang, J.; et al. Simultaneous Increases in Proliferation and Apoptosis of Vascular Smooth Muscle Cells Accelerate Diabetic Mouse Venous Atherosclerosis. PLoS ONE 2015, 10, e0141375. [Google Scholar] [CrossRef] [Green Version]
- Askew, K.; Li, K.; Olmos-Alonso, A.; Garcia-Moreno, F.; Liang, Y.; Richardson, P.; Tipton, T.; Chapman, M.A.; Riecken, K.; Beccari, S.; et al. Coupled Proliferation and Apoptosis Maintain the Rapid Turnover of Microglia in the Adult Brain. Cell Rep. 2017, 18, 391–405. [Google Scholar] [CrossRef] [PubMed] [Green Version]
- Lee, P.; Lee, J.; Kim, S.; Lee, M.S.; Yagita, H.; Kim, S.Y.; Kim, H.; Suk, K. NO as an autocrine mediator in the apoptosis of activated microglial cells: Correlation between activation and apoptosis of microglial cells. Brain Res. 2001, 892, 380–385. [Google Scholar] [CrossRef]
- Nishikawa, T.; Edelstein, D.; Du, X.L.; Yamagishi, S.; Matsumura, T.; Kaneda, Y.; Yorek, M.A.; Beebe, D.; Oates, P.J.; Hammes, H.P.; et al. Normalizing mitochondrial superoxide production blocks three pathways of hyperglycaemic damage. Nature 2000, 404, 787–790. [Google Scholar] [CrossRef]
- Subedi, L.; Lee, J.H.; Gaire, B.P.; Kim, S.Y. Sulforaphane Inhibits MGO-AGE-Mediated Neuroinflammation by Suppressing NF-κB, MAPK, and AGE-RAGE Signaling Pathways in Microglial Cells. Antioxidants 2020, 9, 792. [Google Scholar] [CrossRef]
- Chen, C.; Wu, S.; Hong, Z.; Chen, X.; Shan, X.; Fischbach, S.; Xiao, X. Chronic hyperglycemia regulates microglia polarization through ERK5. Aging 2019, 11, 697–706. [Google Scholar] [CrossRef]
- Taganov, K.D.; Boldin, M.P.; Chang, K.J.; Baltimore, D. NF-kappaB-dependent induction of microRNA miR-146, an inhibitor targeted to signaling proteins of innate immune responses. Proc. Natl. Acad. Sci. USA 2006, 103, 12481–12486. [Google Scholar] [CrossRef] [PubMed] [Green Version]
- Devier, D.J.; Lovera, J.F.; Lukiw, W.J. Increase in NF-κB-sensitive miRNA-146a and miRNA-155 in multiple sclerosis (MS) and pro-inflammatory neurodegeneration. Front. Mol. Neurosci. 2015, 8, 5. [Google Scholar] [CrossRef] [Green Version]
- Pogue, A.I.; Li, Y.Y.; Cui, J.G.; Zhao, Y.; Kruck, T.P.; Percy, M.E.; Tarr, M.A.; Lukiw, W.J. Characterization of an NF-kappaB-regulated, miRNA-146a-mediated down-regulation of complement factor H (CFH) in metal-sulfate-stressed human brain cells. J. Inorg. Biochem. 2009, 103, 1591–1595. [Google Scholar] [CrossRef] [PubMed]
- Hill, J.M.; Zhao, Y.; Clement, C.; Neumann, D.M.; Lukiw, W.J. HSV-1 infection of human brain cells induces miRNA-146a and Alzheimer-type inflammatory signaling. Neuroreport 2009, 20, 1500–1505. [Google Scholar] [CrossRef] [PubMed] [Green Version]
- Cardoso, A.L.; Guedes, J.R.; de Lima, M.C. Role of microRNAs in the regulation of innate immune cells under neuroinflammatory conditions. Curr. Opin. Pharm. 2016, 26, 1–9. [Google Scholar] [CrossRef] [PubMed] [Green Version]
- Sweeney, M.D.; Ayyadurai, S.; Zlokovic, B.V. Pericytes of the neurovascular unit: Key functions and signaling pathways. Nat. Neurosci. 2016, 19, 771–783. [Google Scholar] [CrossRef]
- Navarro, R.; Compte, M.; Álvarez-Vallina, L.; Sanz, L. Immune Regulation by Pericytes: Modulating Innate and Adaptive Immunity. Front. Immunol. 2016, 7, 480. [Google Scholar] [CrossRef] [Green Version]


Publisher’s Note: MDPI stays neutral with regard to jurisdictional claims in published maps and institutional affiliations. |
© 2022 by the authors. Licensee MDPI, Basel, Switzerland. This article is an open access article distributed under the terms and conditions of the Creative Commons Attribution (CC BY) license (https://creativecommons.org/licenses/by/4.0/).
Share and Cite
Mazzeo, A.; Porta, M.; Beltramo, E. Characterization of an Immortalized Human Microglial Cell Line as a Tool for the Study of Diabetic Retinopathy. Int. J. Mol. Sci. 2022, 23, 5745. https://0-doi-org.brum.beds.ac.uk/10.3390/ijms23105745
Mazzeo A, Porta M, Beltramo E. Characterization of an Immortalized Human Microglial Cell Line as a Tool for the Study of Diabetic Retinopathy. International Journal of Molecular Sciences. 2022; 23(10):5745. https://0-doi-org.brum.beds.ac.uk/10.3390/ijms23105745
Chicago/Turabian StyleMazzeo, Aurora, Massimo Porta, and Elena Beltramo. 2022. "Characterization of an Immortalized Human Microglial Cell Line as a Tool for the Study of Diabetic Retinopathy" International Journal of Molecular Sciences 23, no. 10: 5745. https://0-doi-org.brum.beds.ac.uk/10.3390/ijms23105745