
Theragnostic Efficacy of K18 Response in Alcohol Use Disorder with Clinically Significant Fibrosis Using Gut-Liver Axis


Abstract
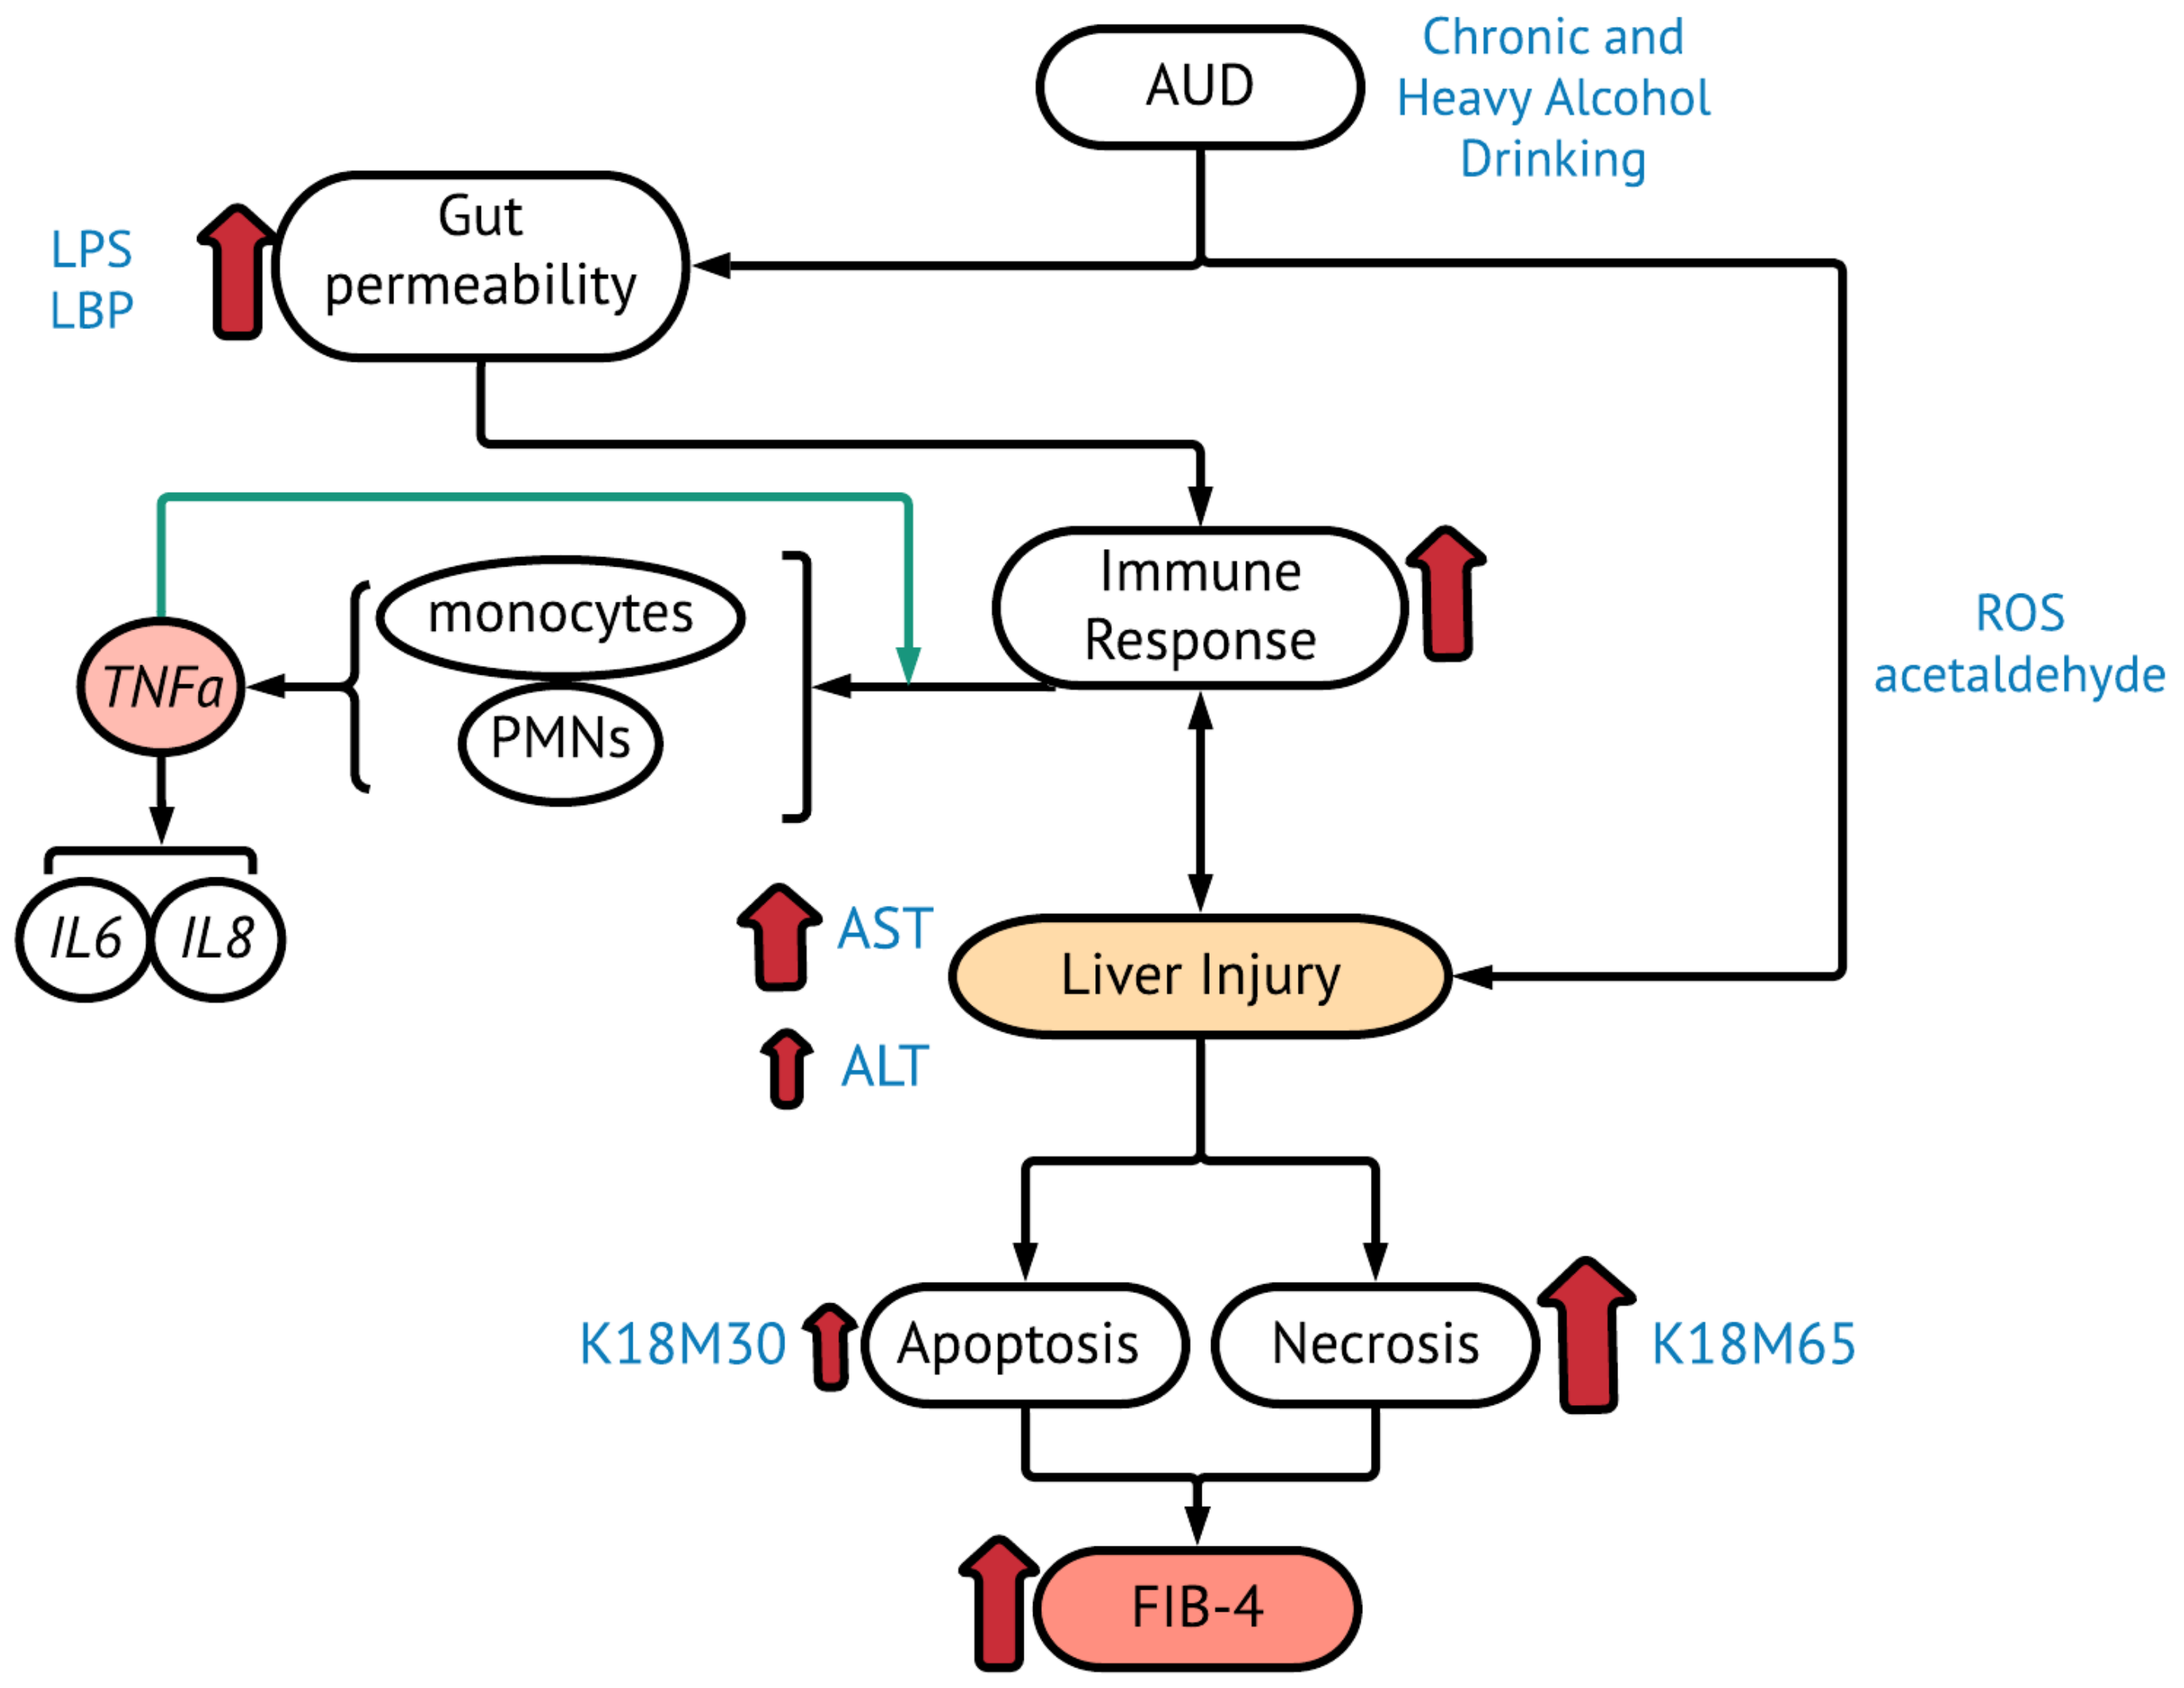
:1. Introduction
2. Results
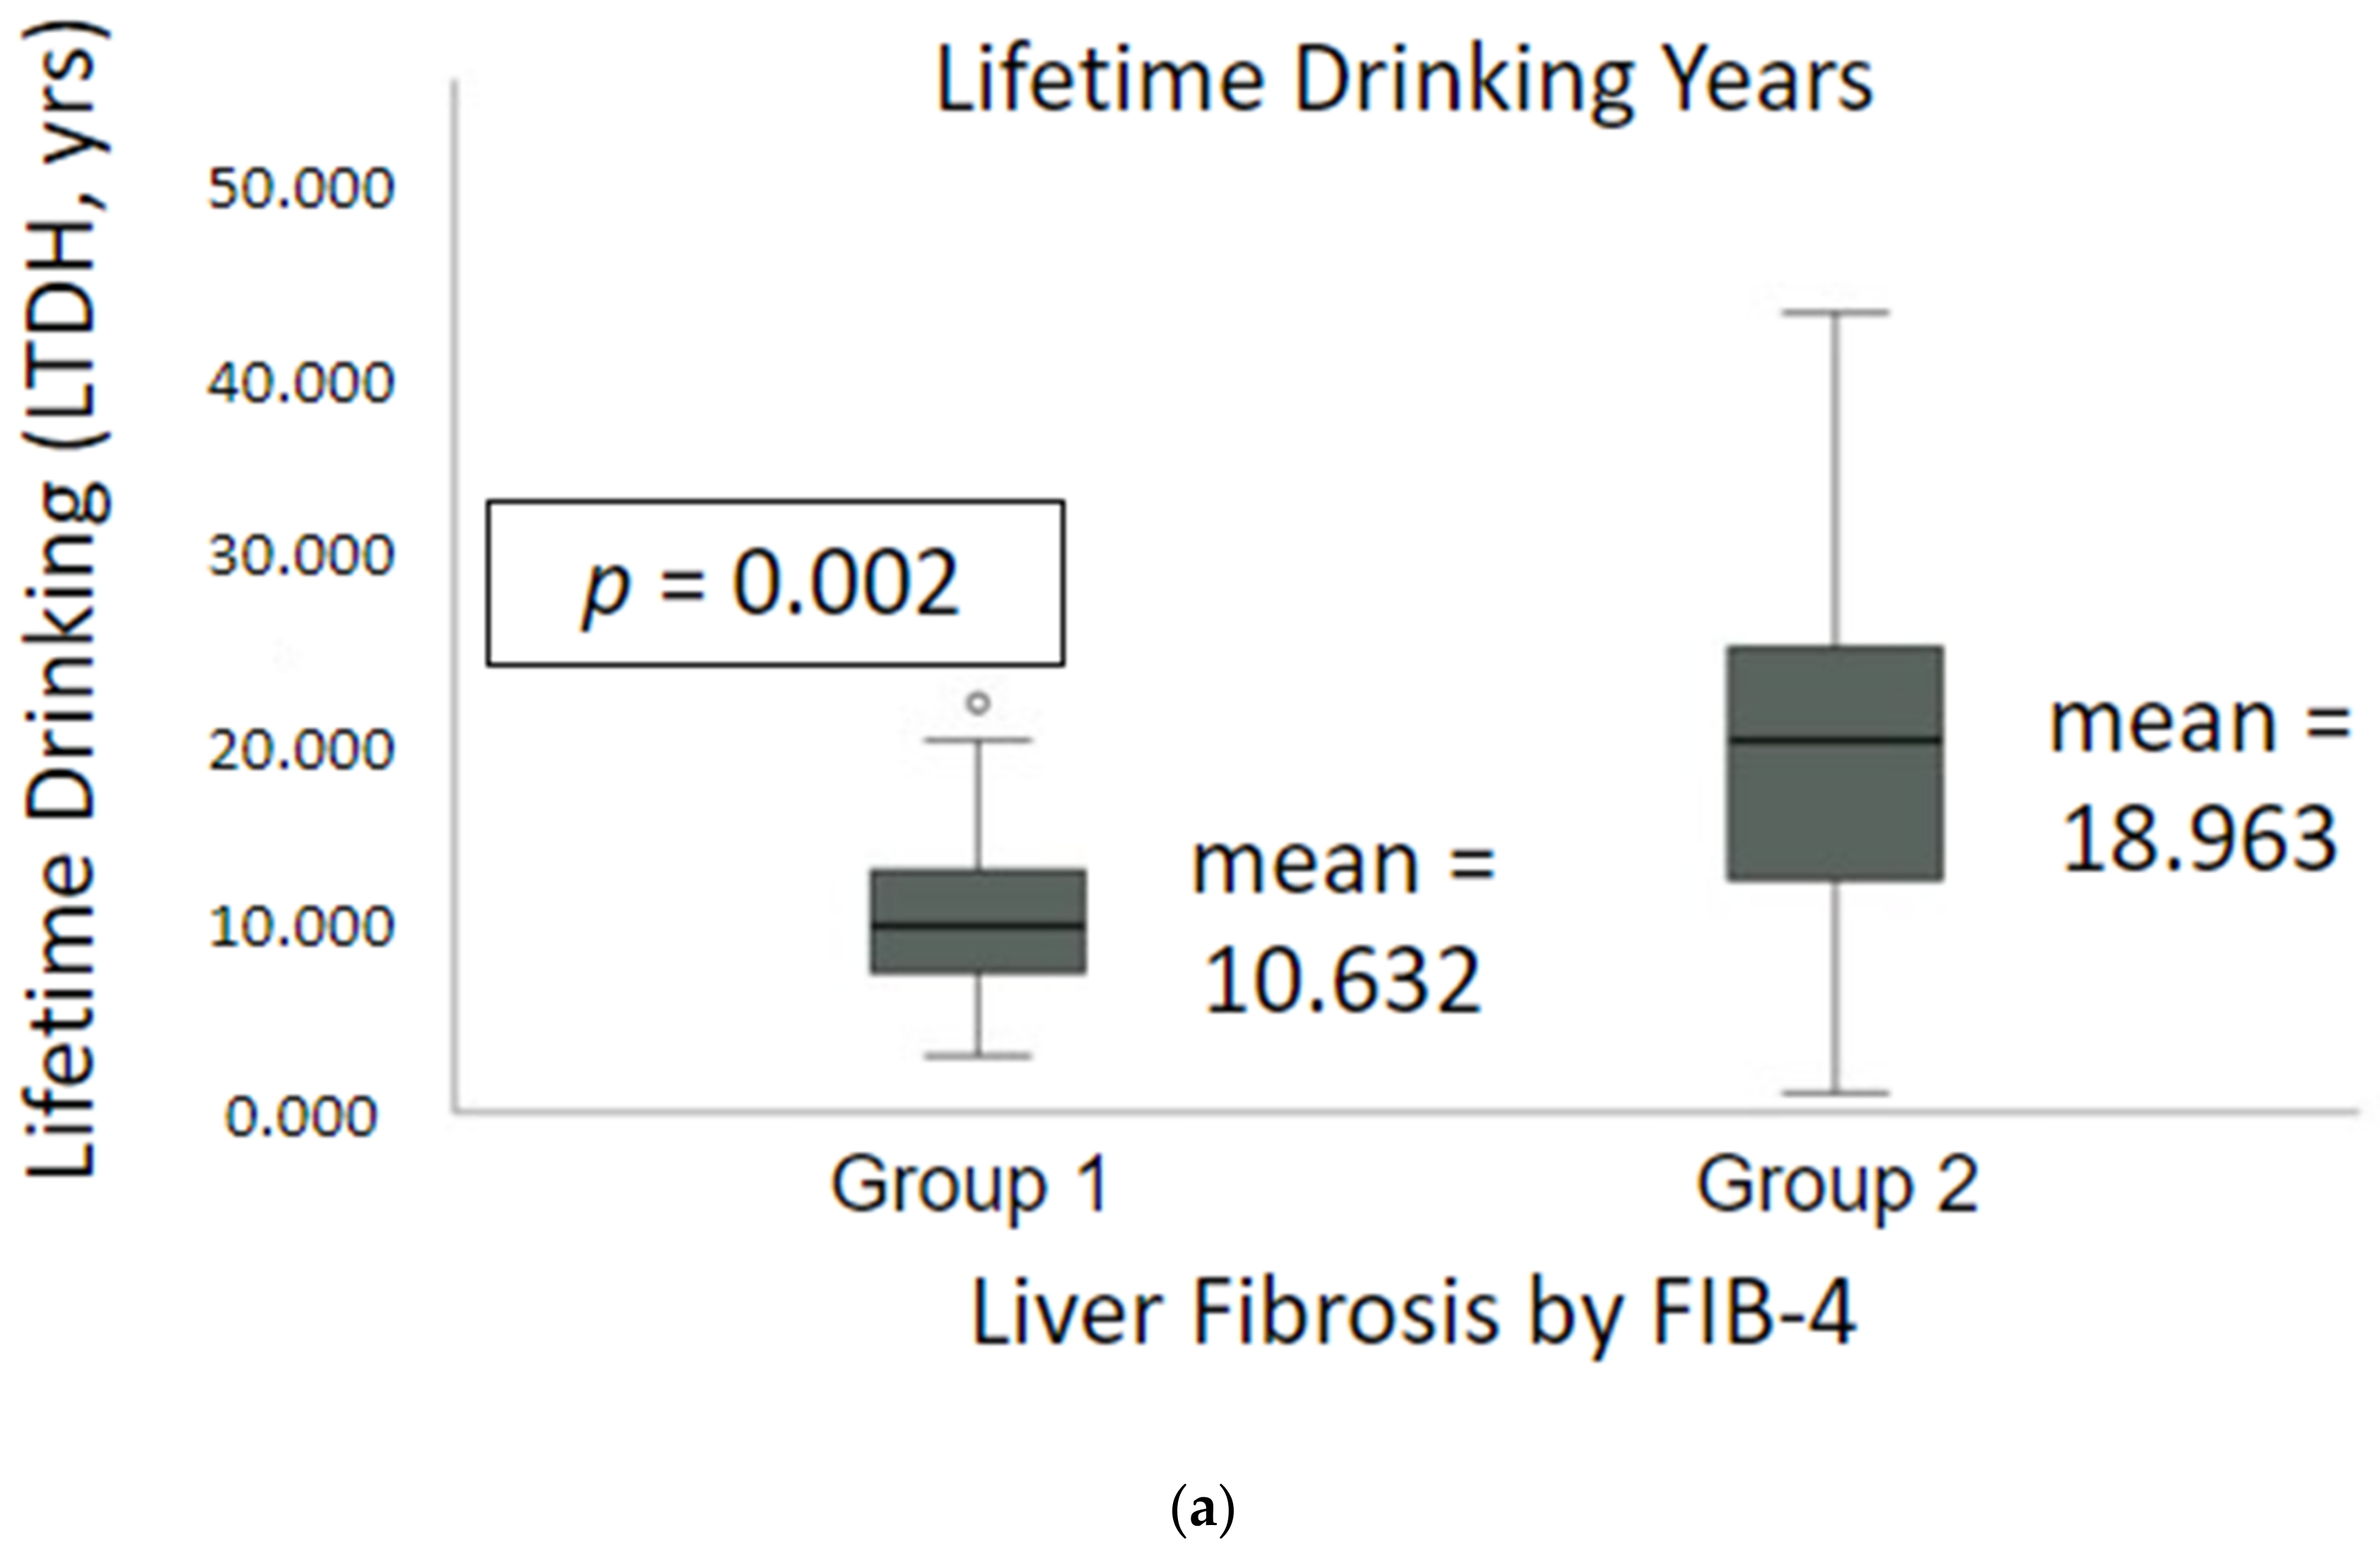
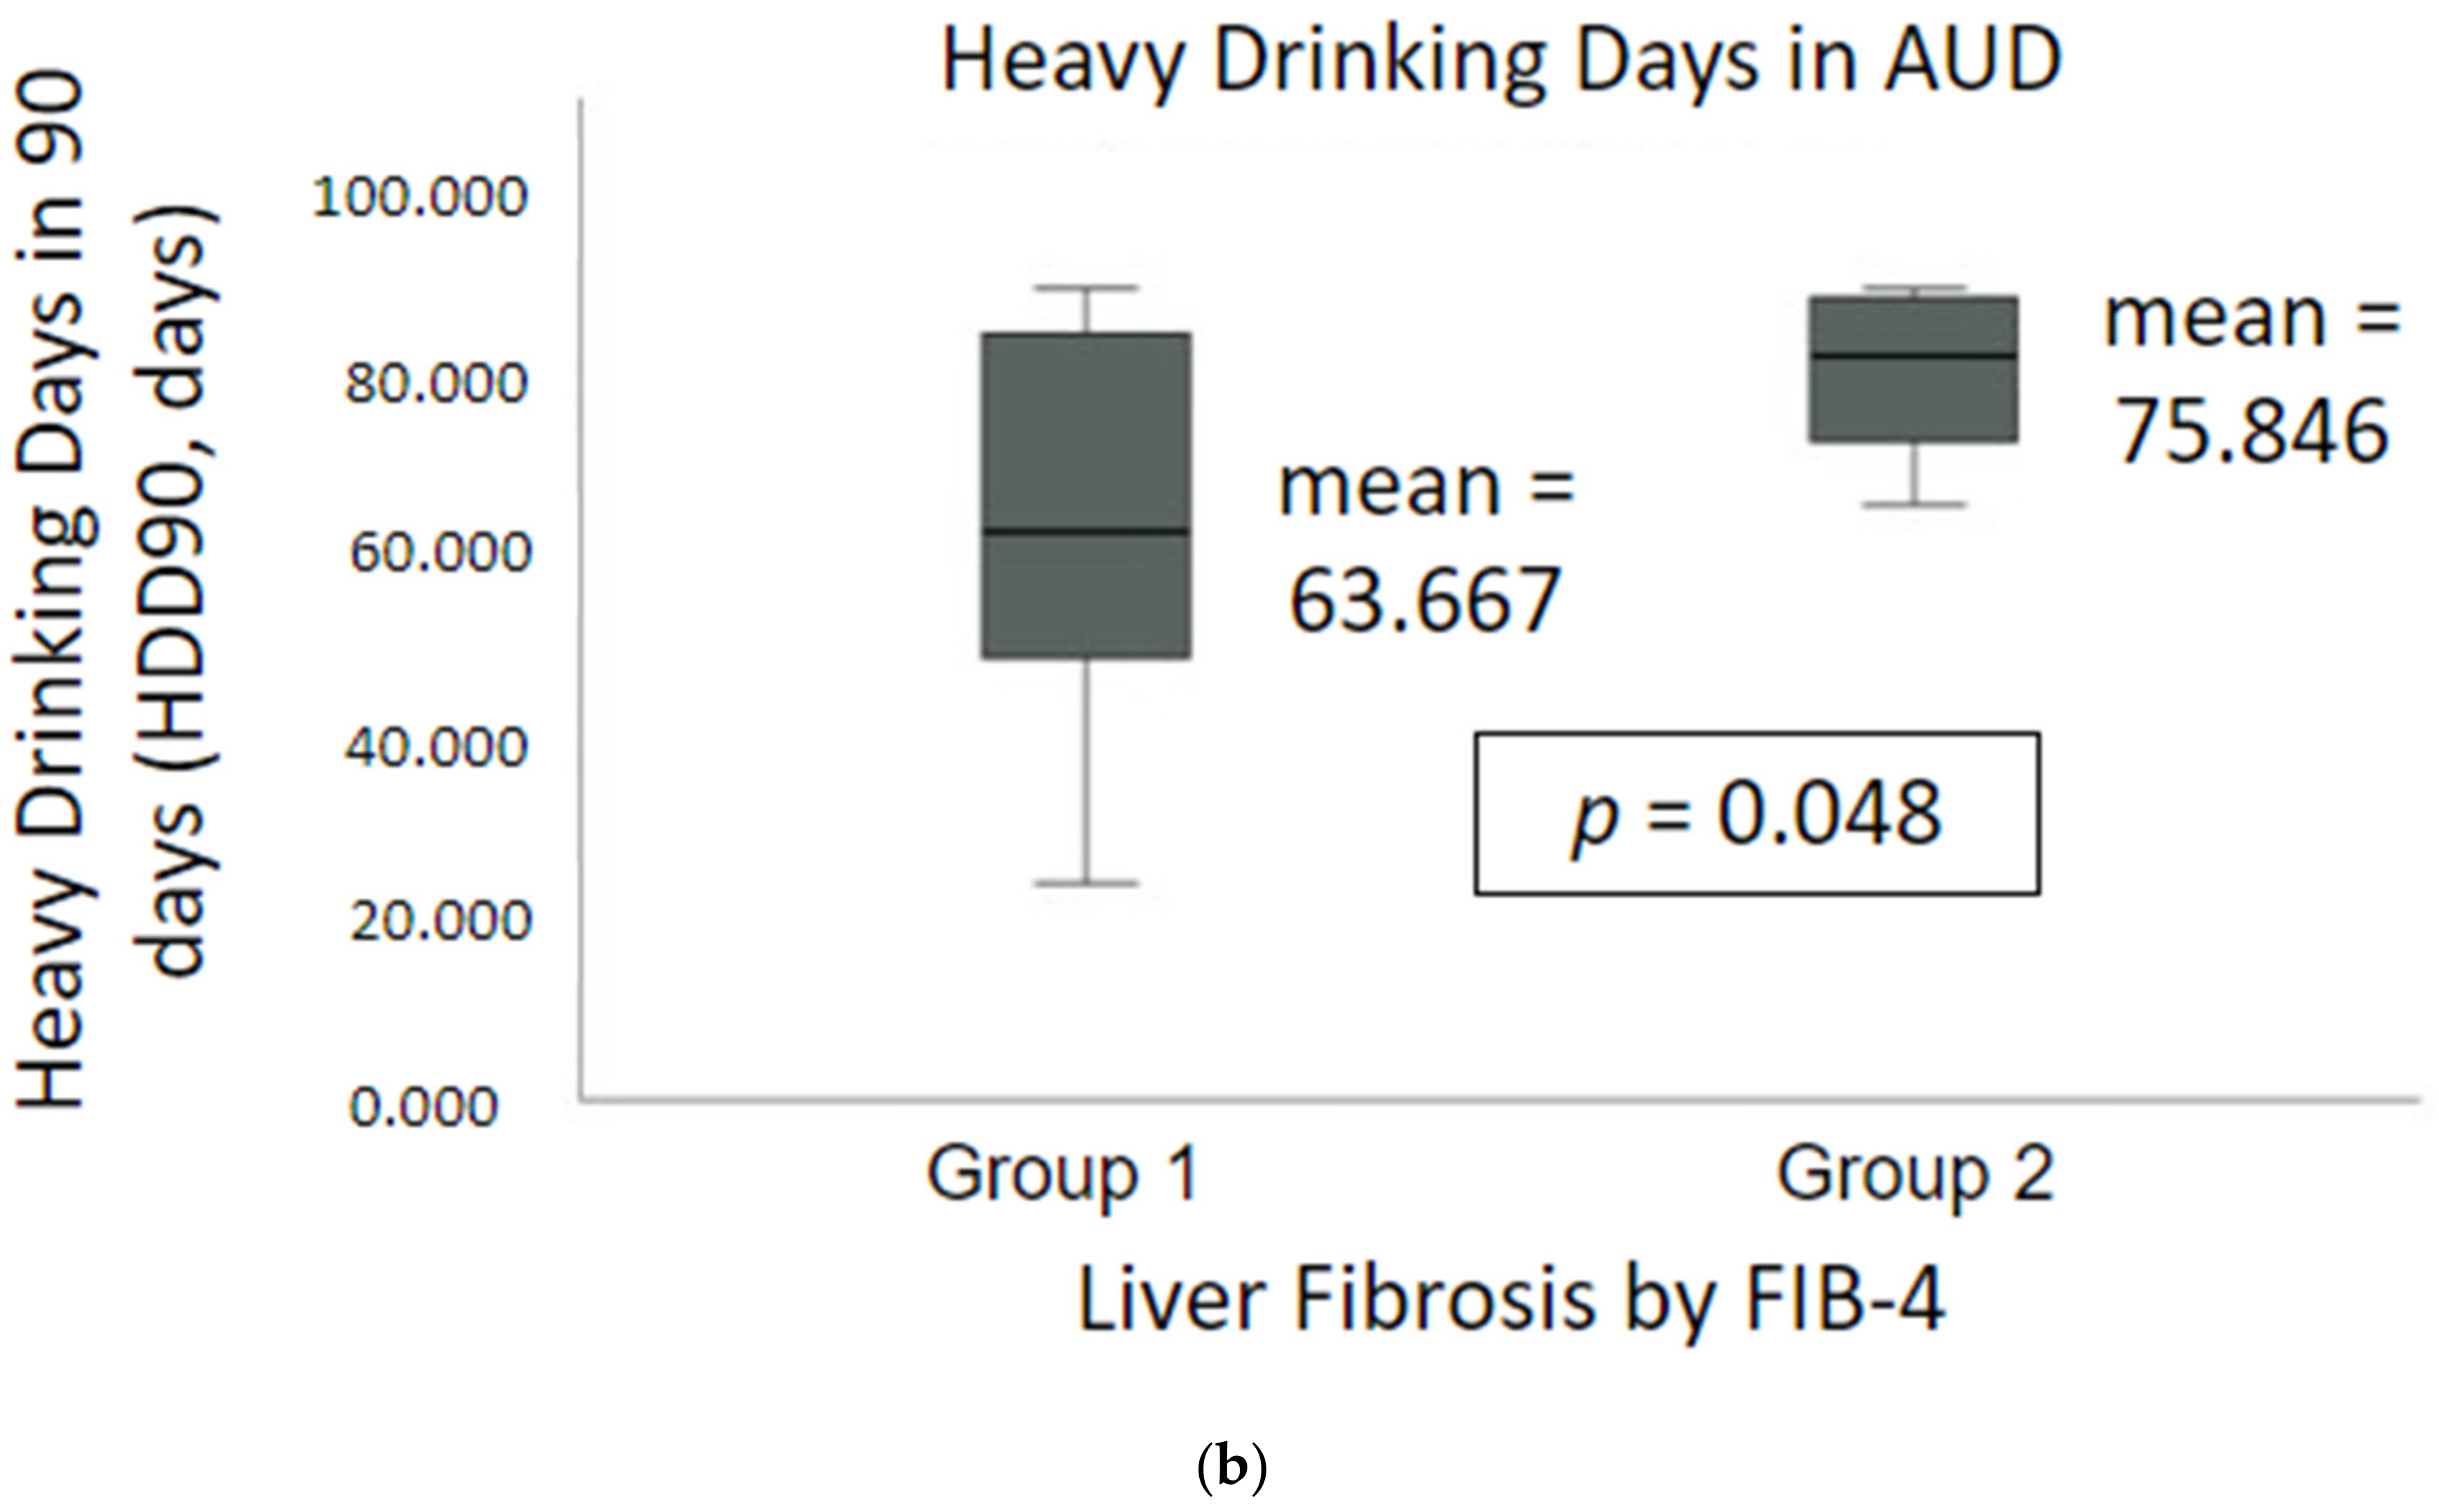
2.1. Demographics, Nutrition and Drinking Profile
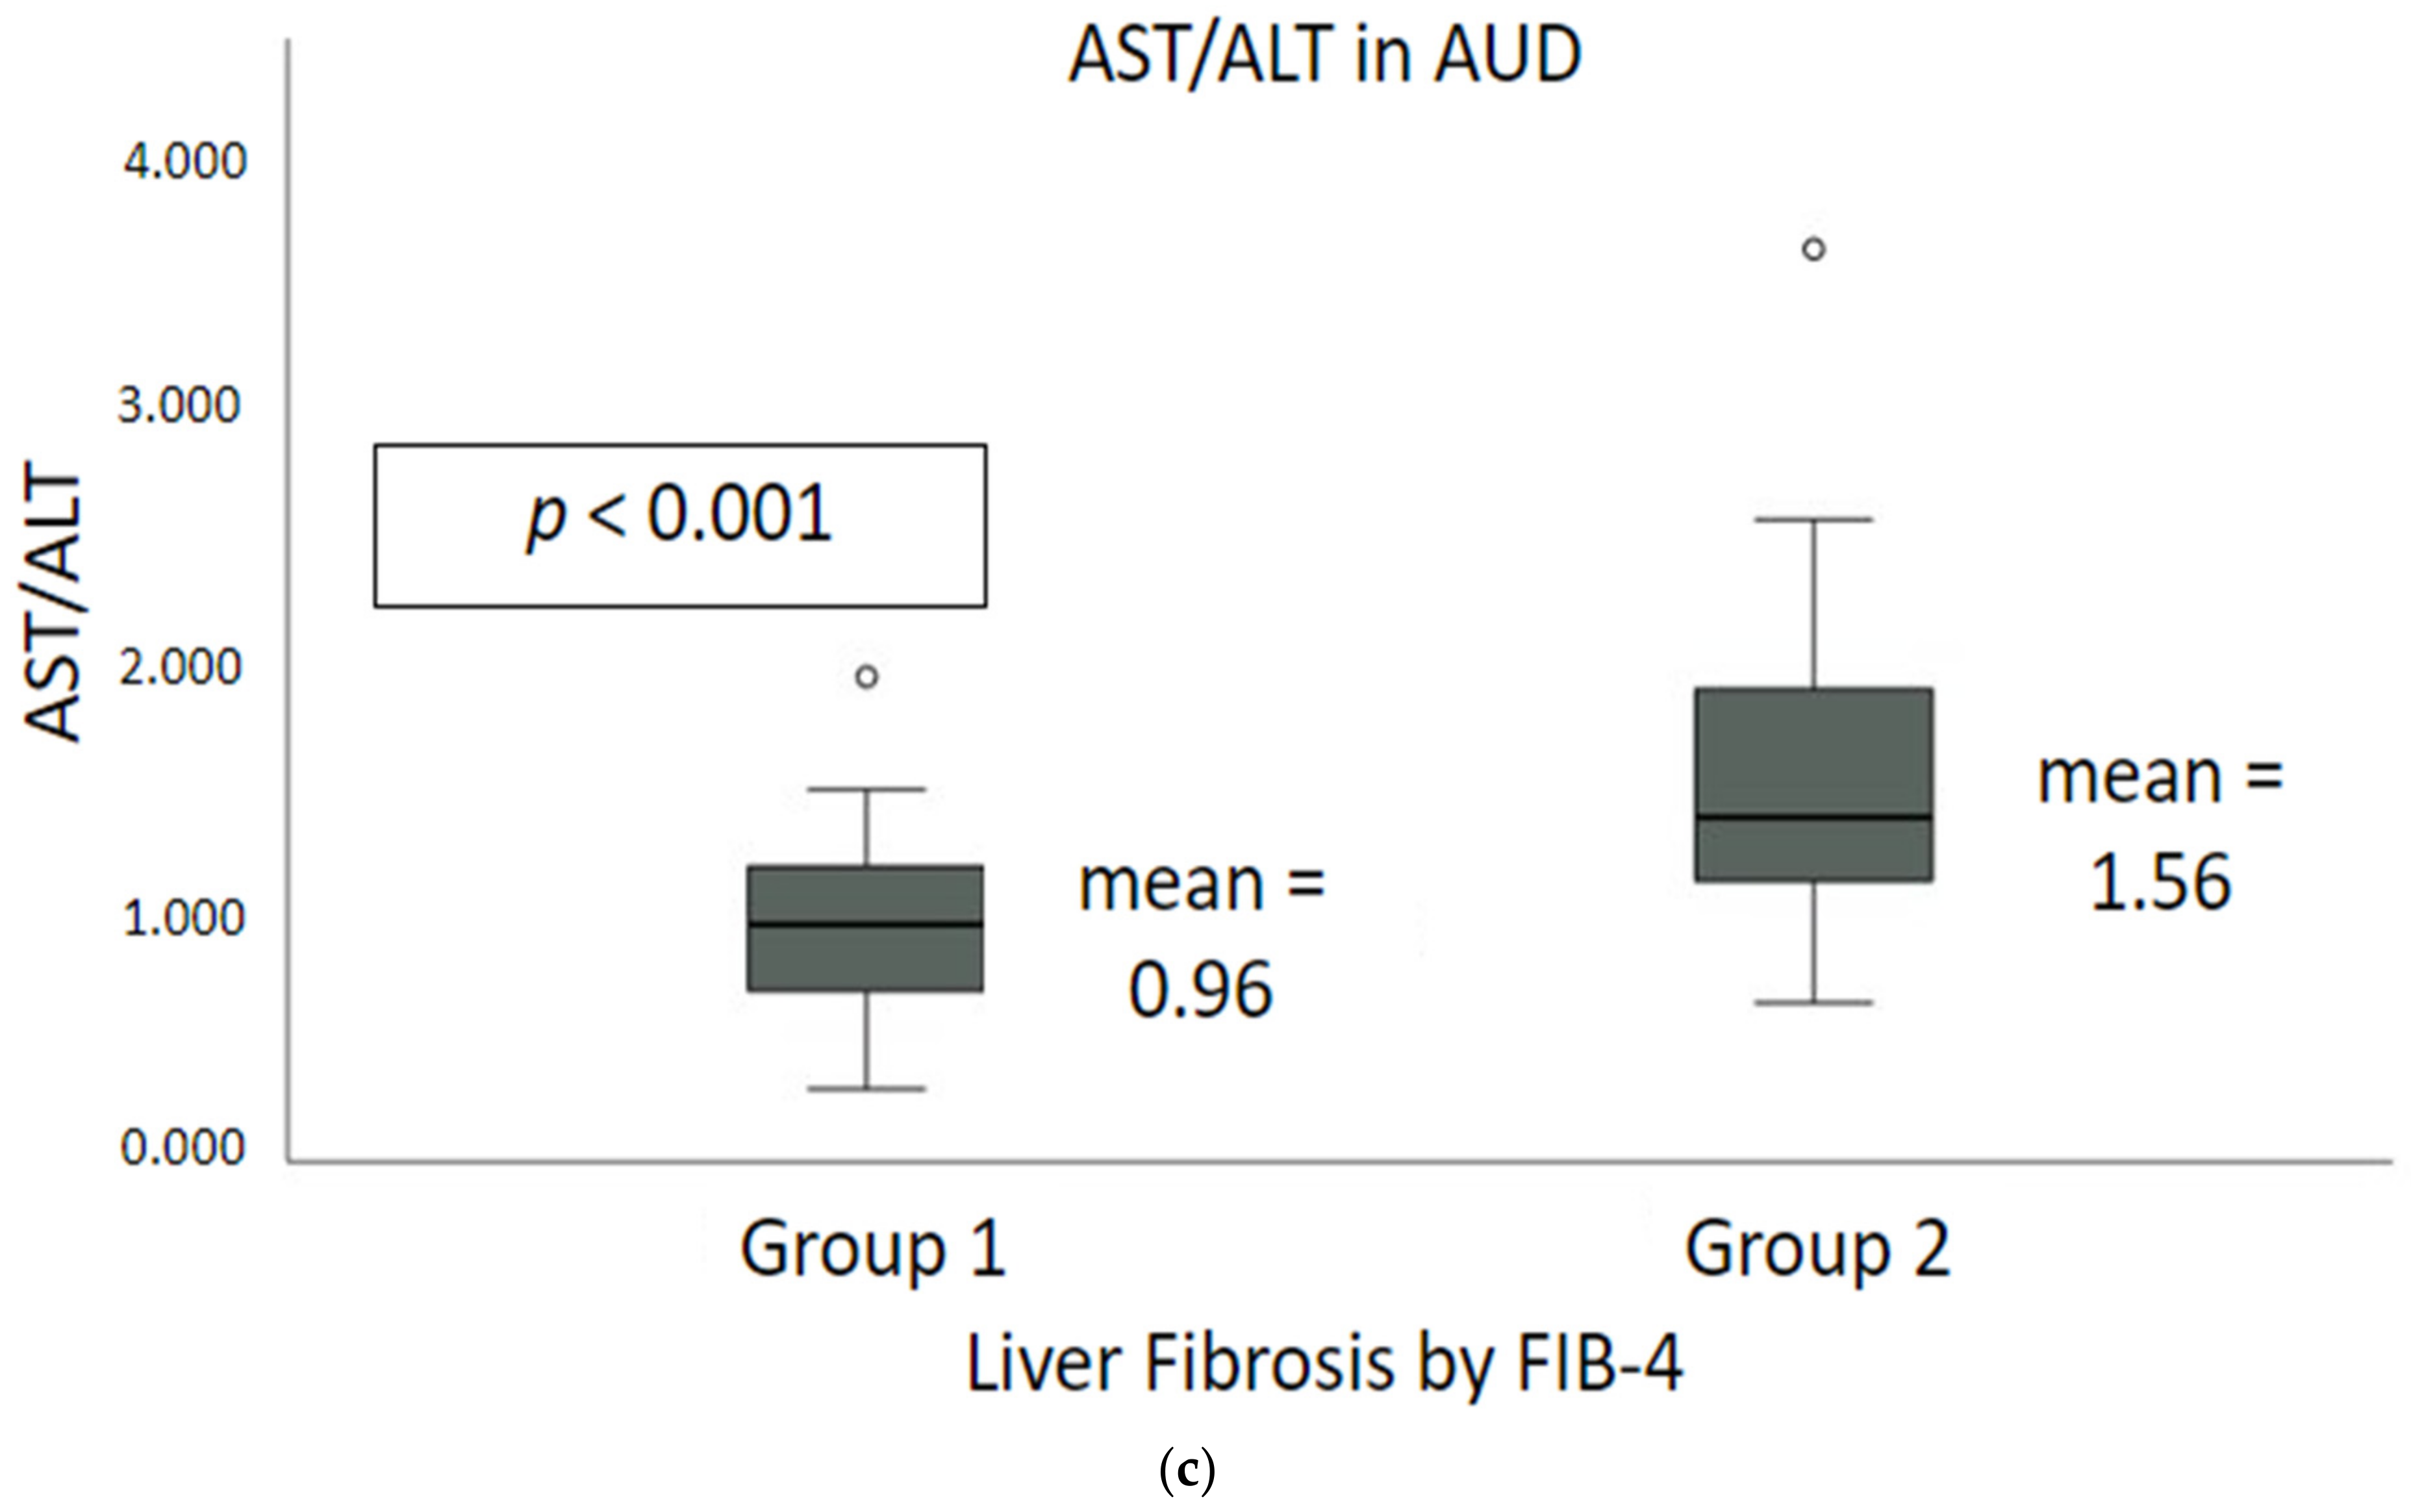
2.2. Liver Injury and Liver Cell Death Markers
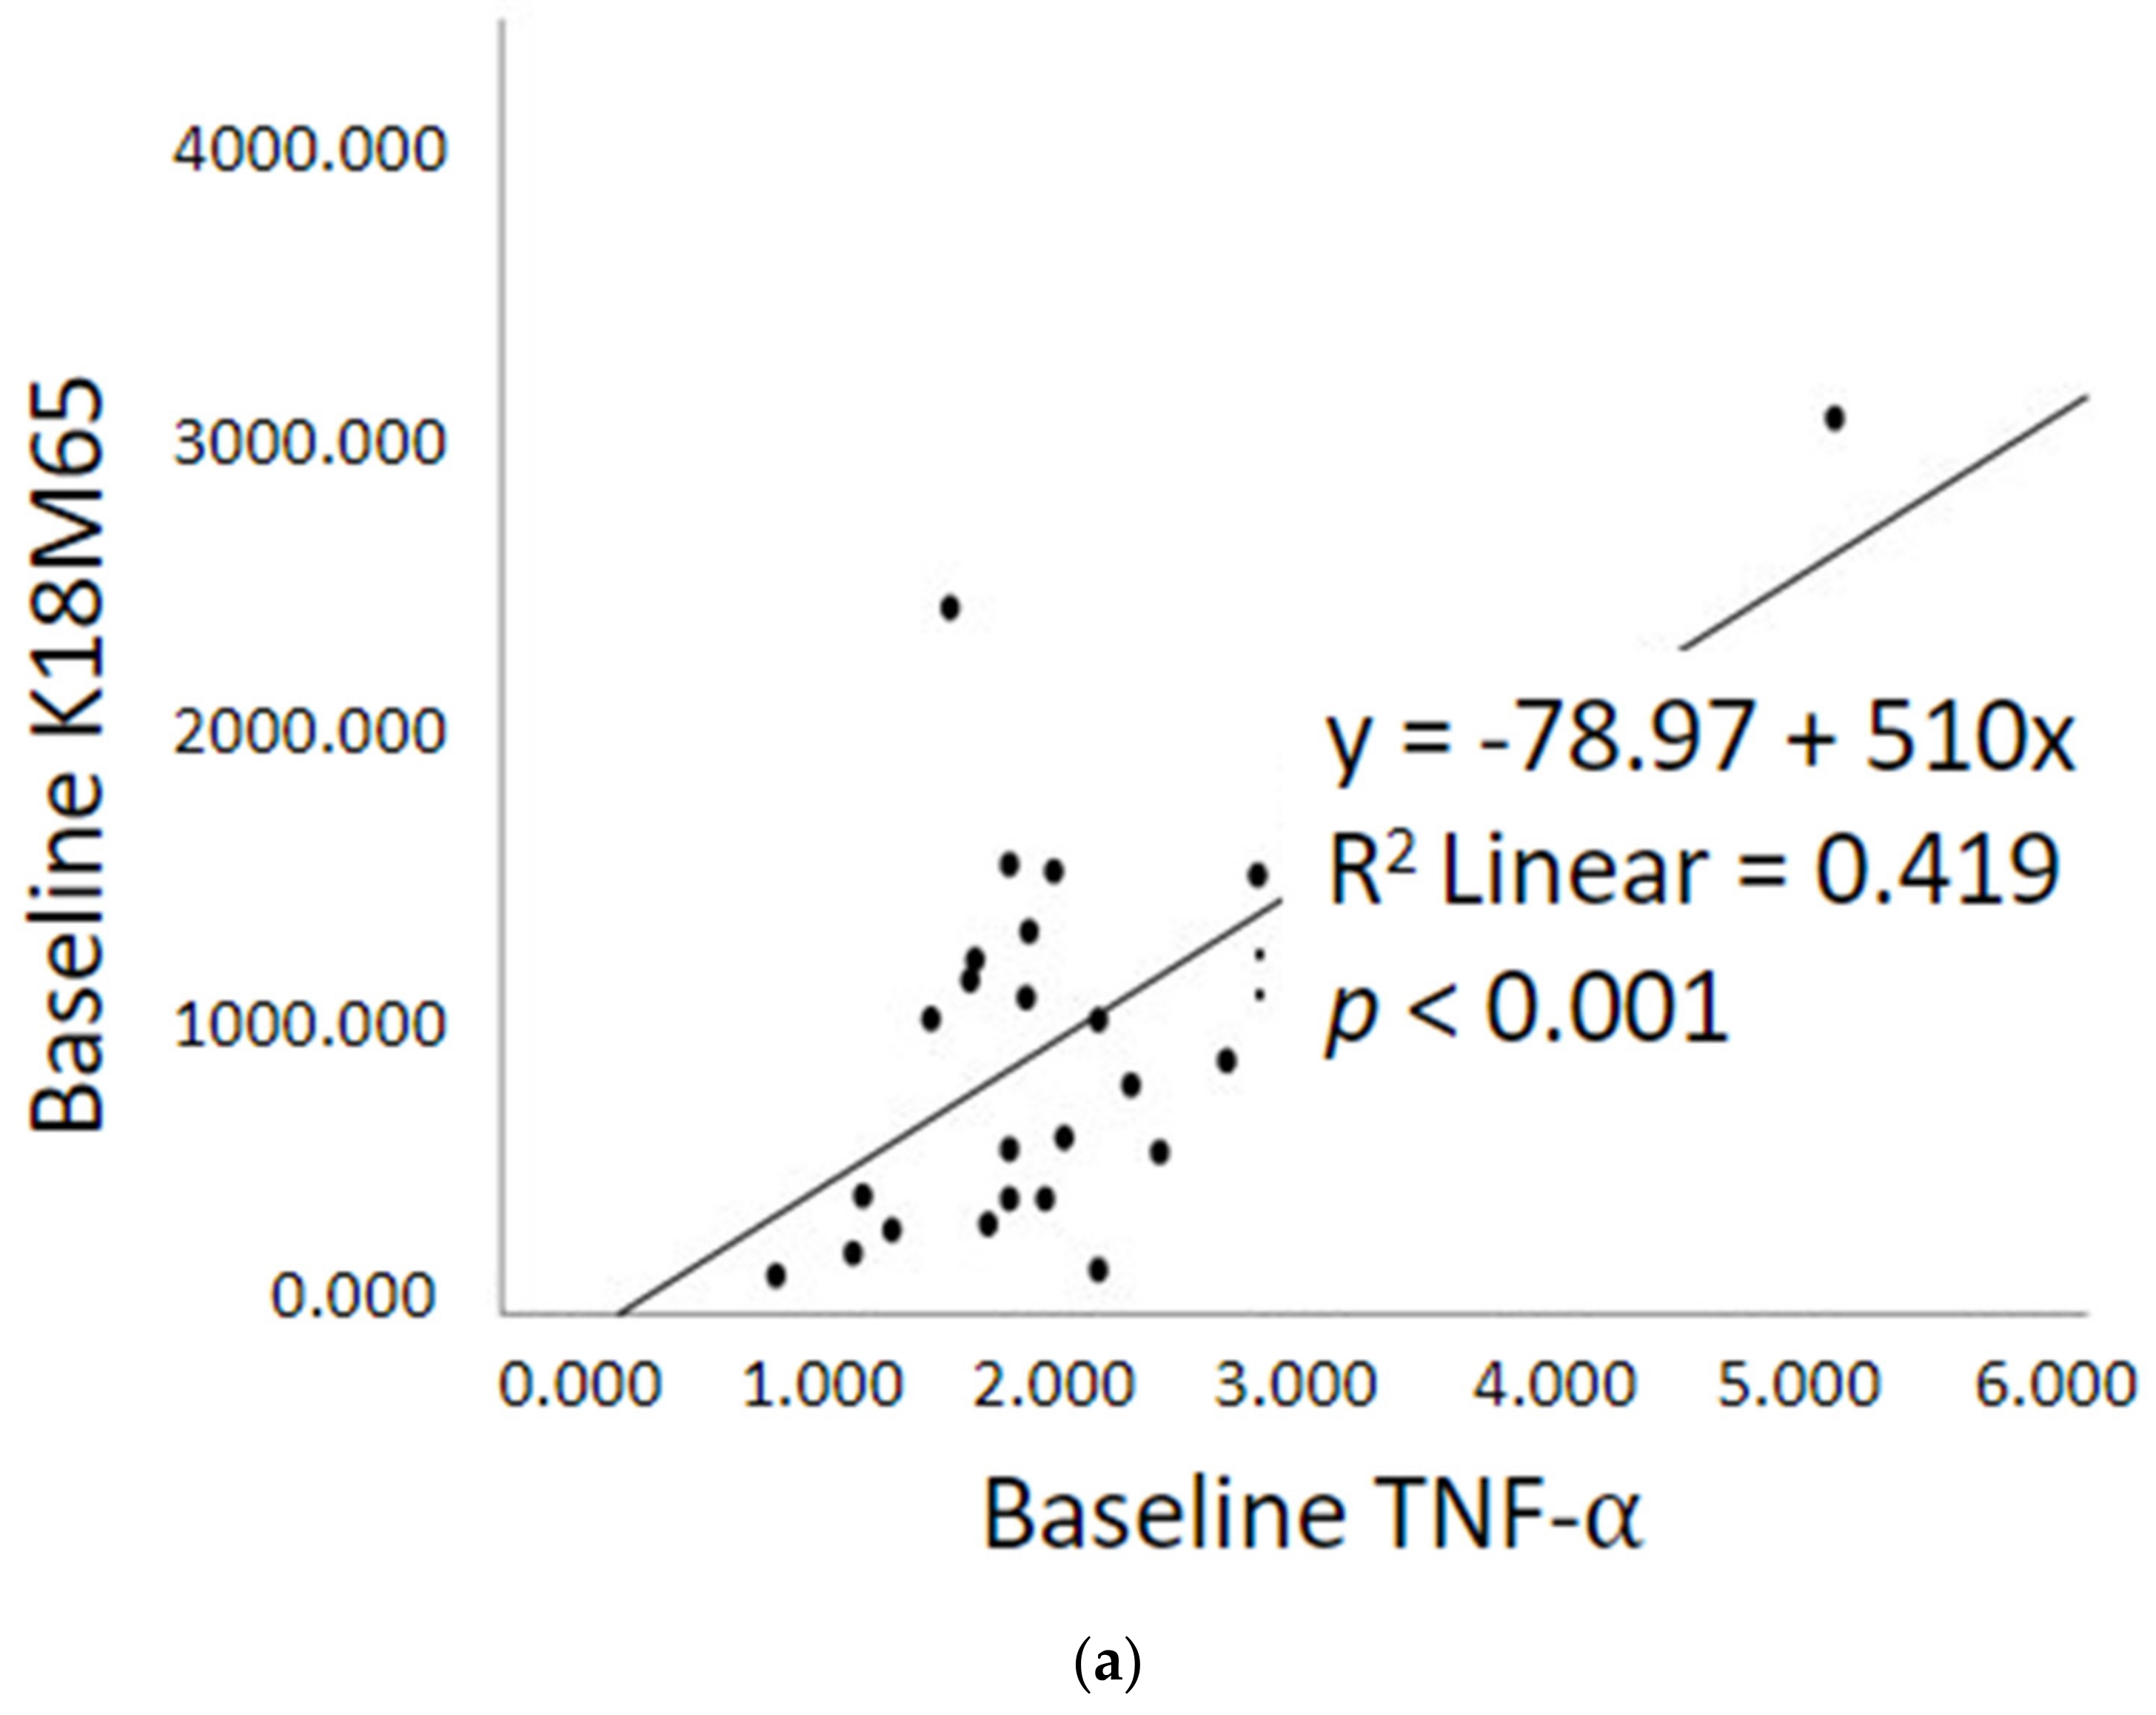
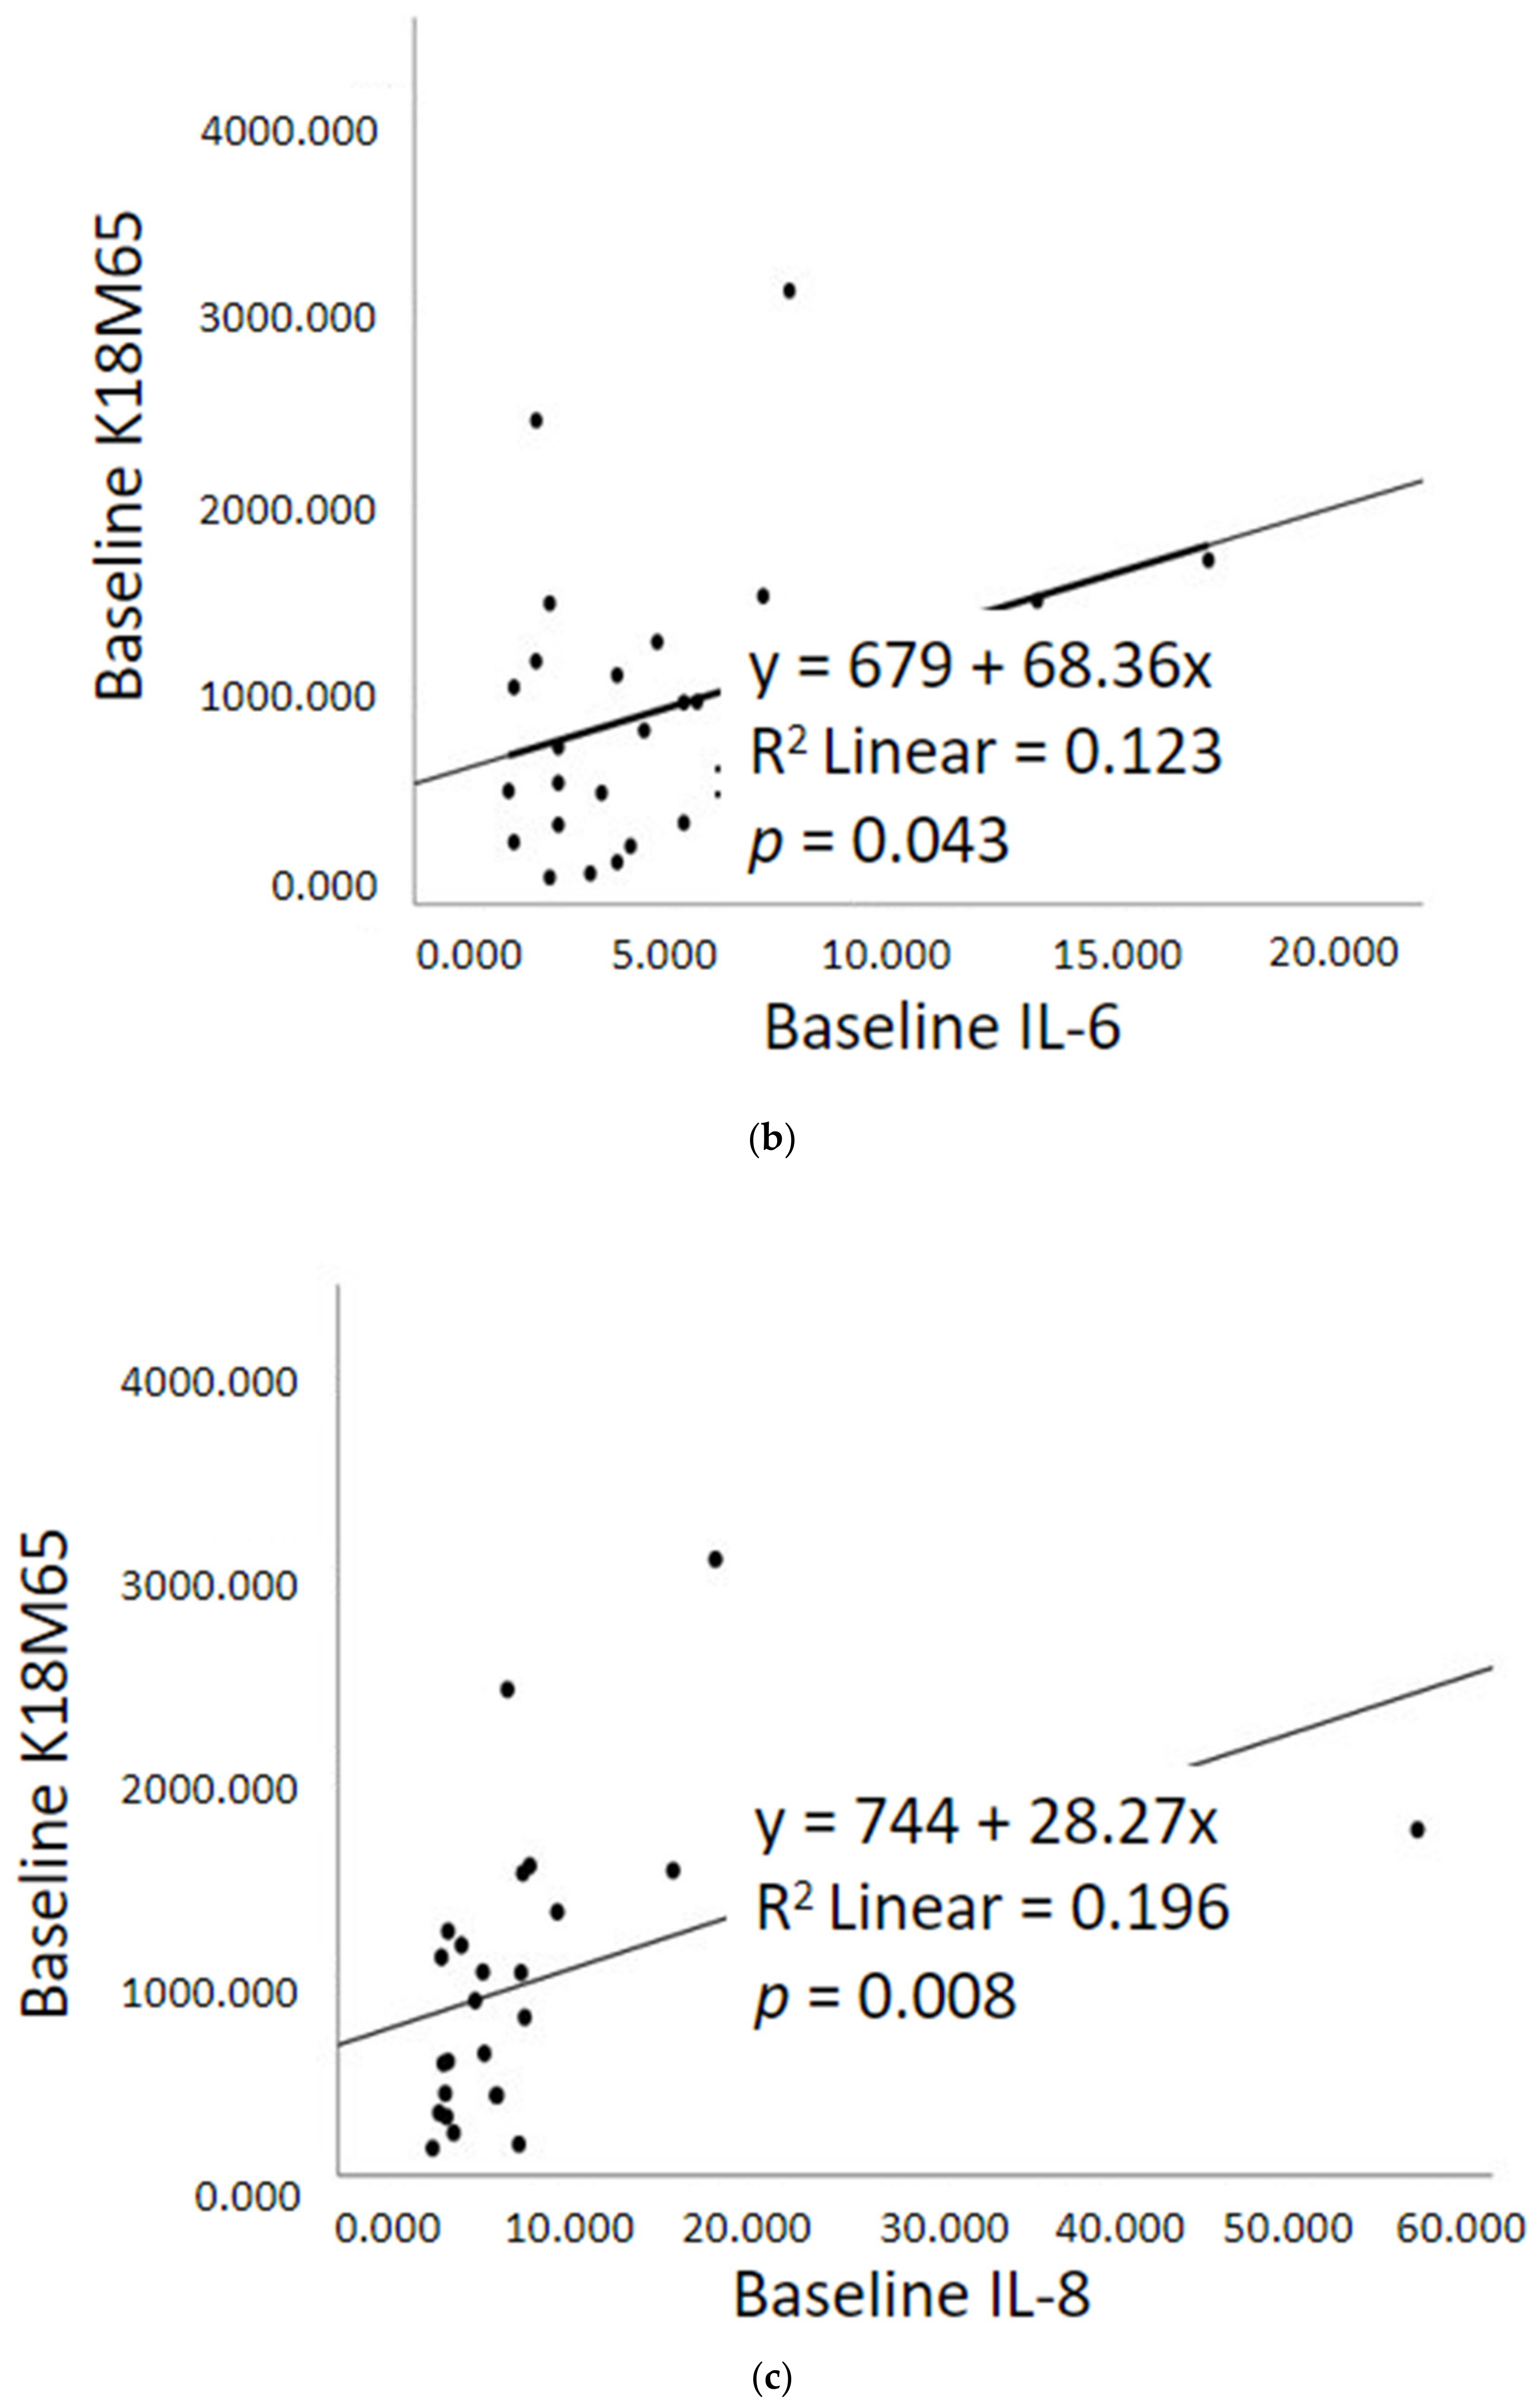
2.3. Gut dysfunction and Proinflammatory Response
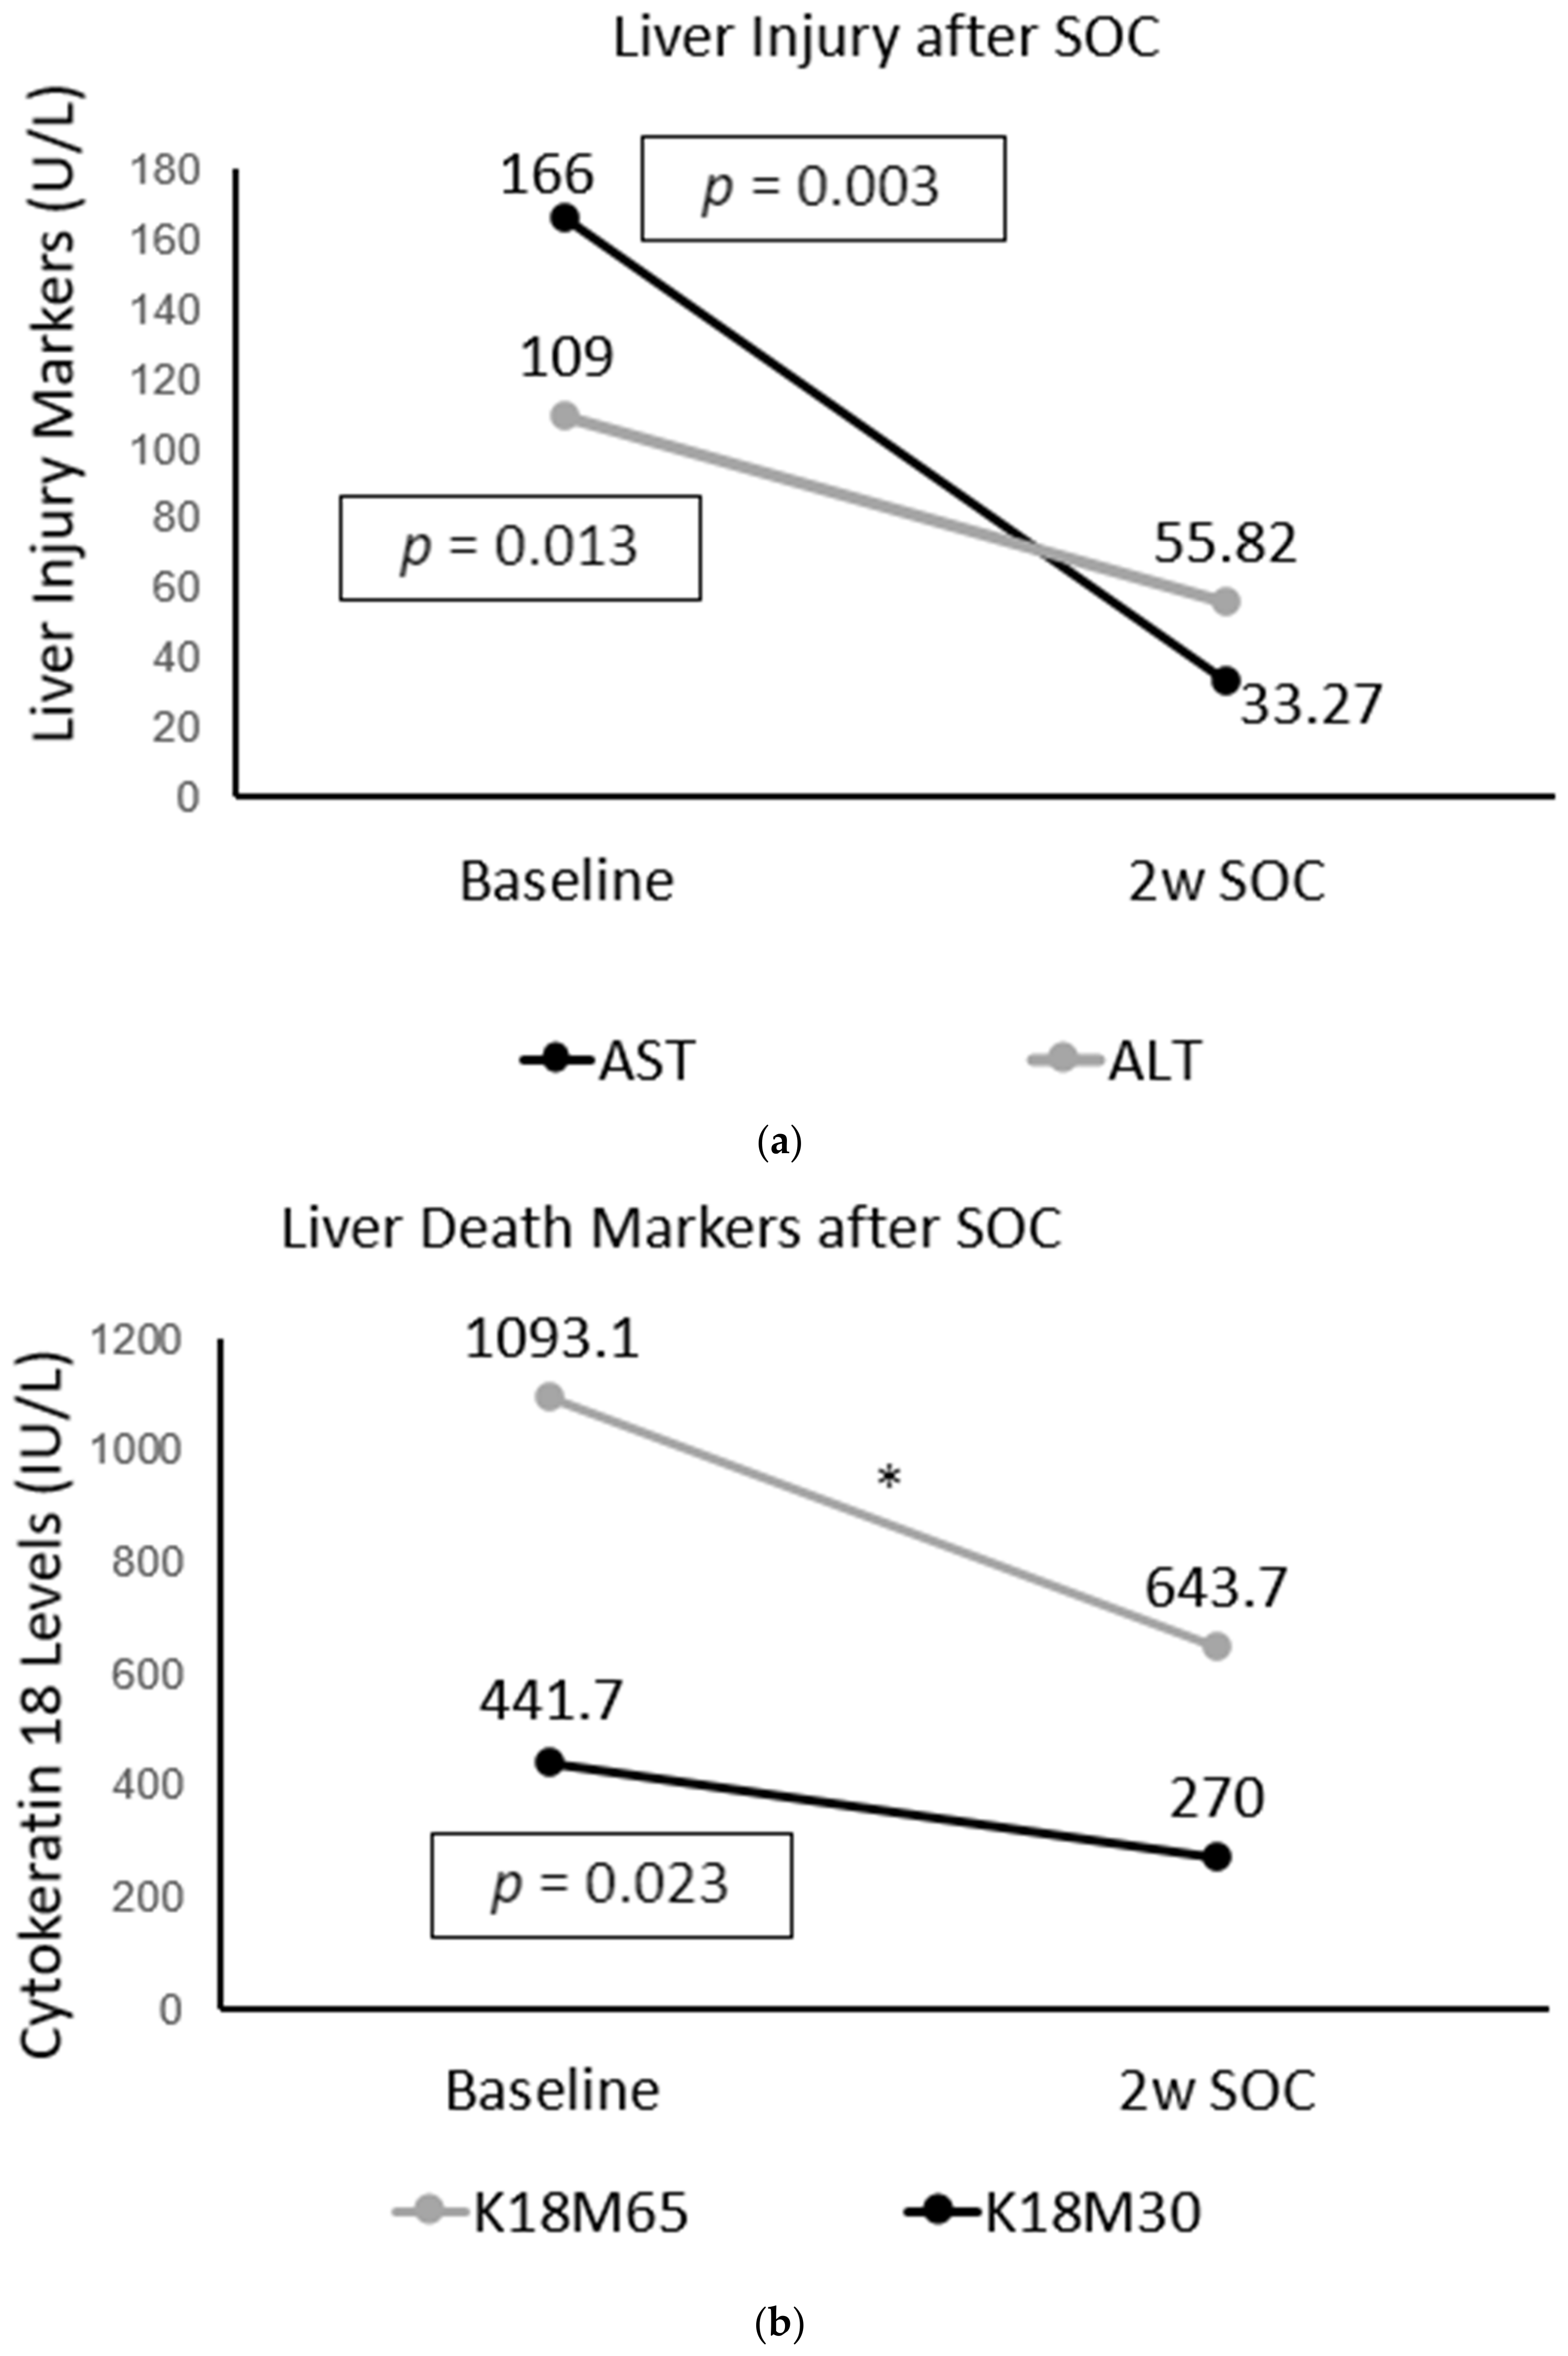
2.4. Improvement in Immune and Liver Cell Death Status after Treatment in AUD Patients with Fibrosis
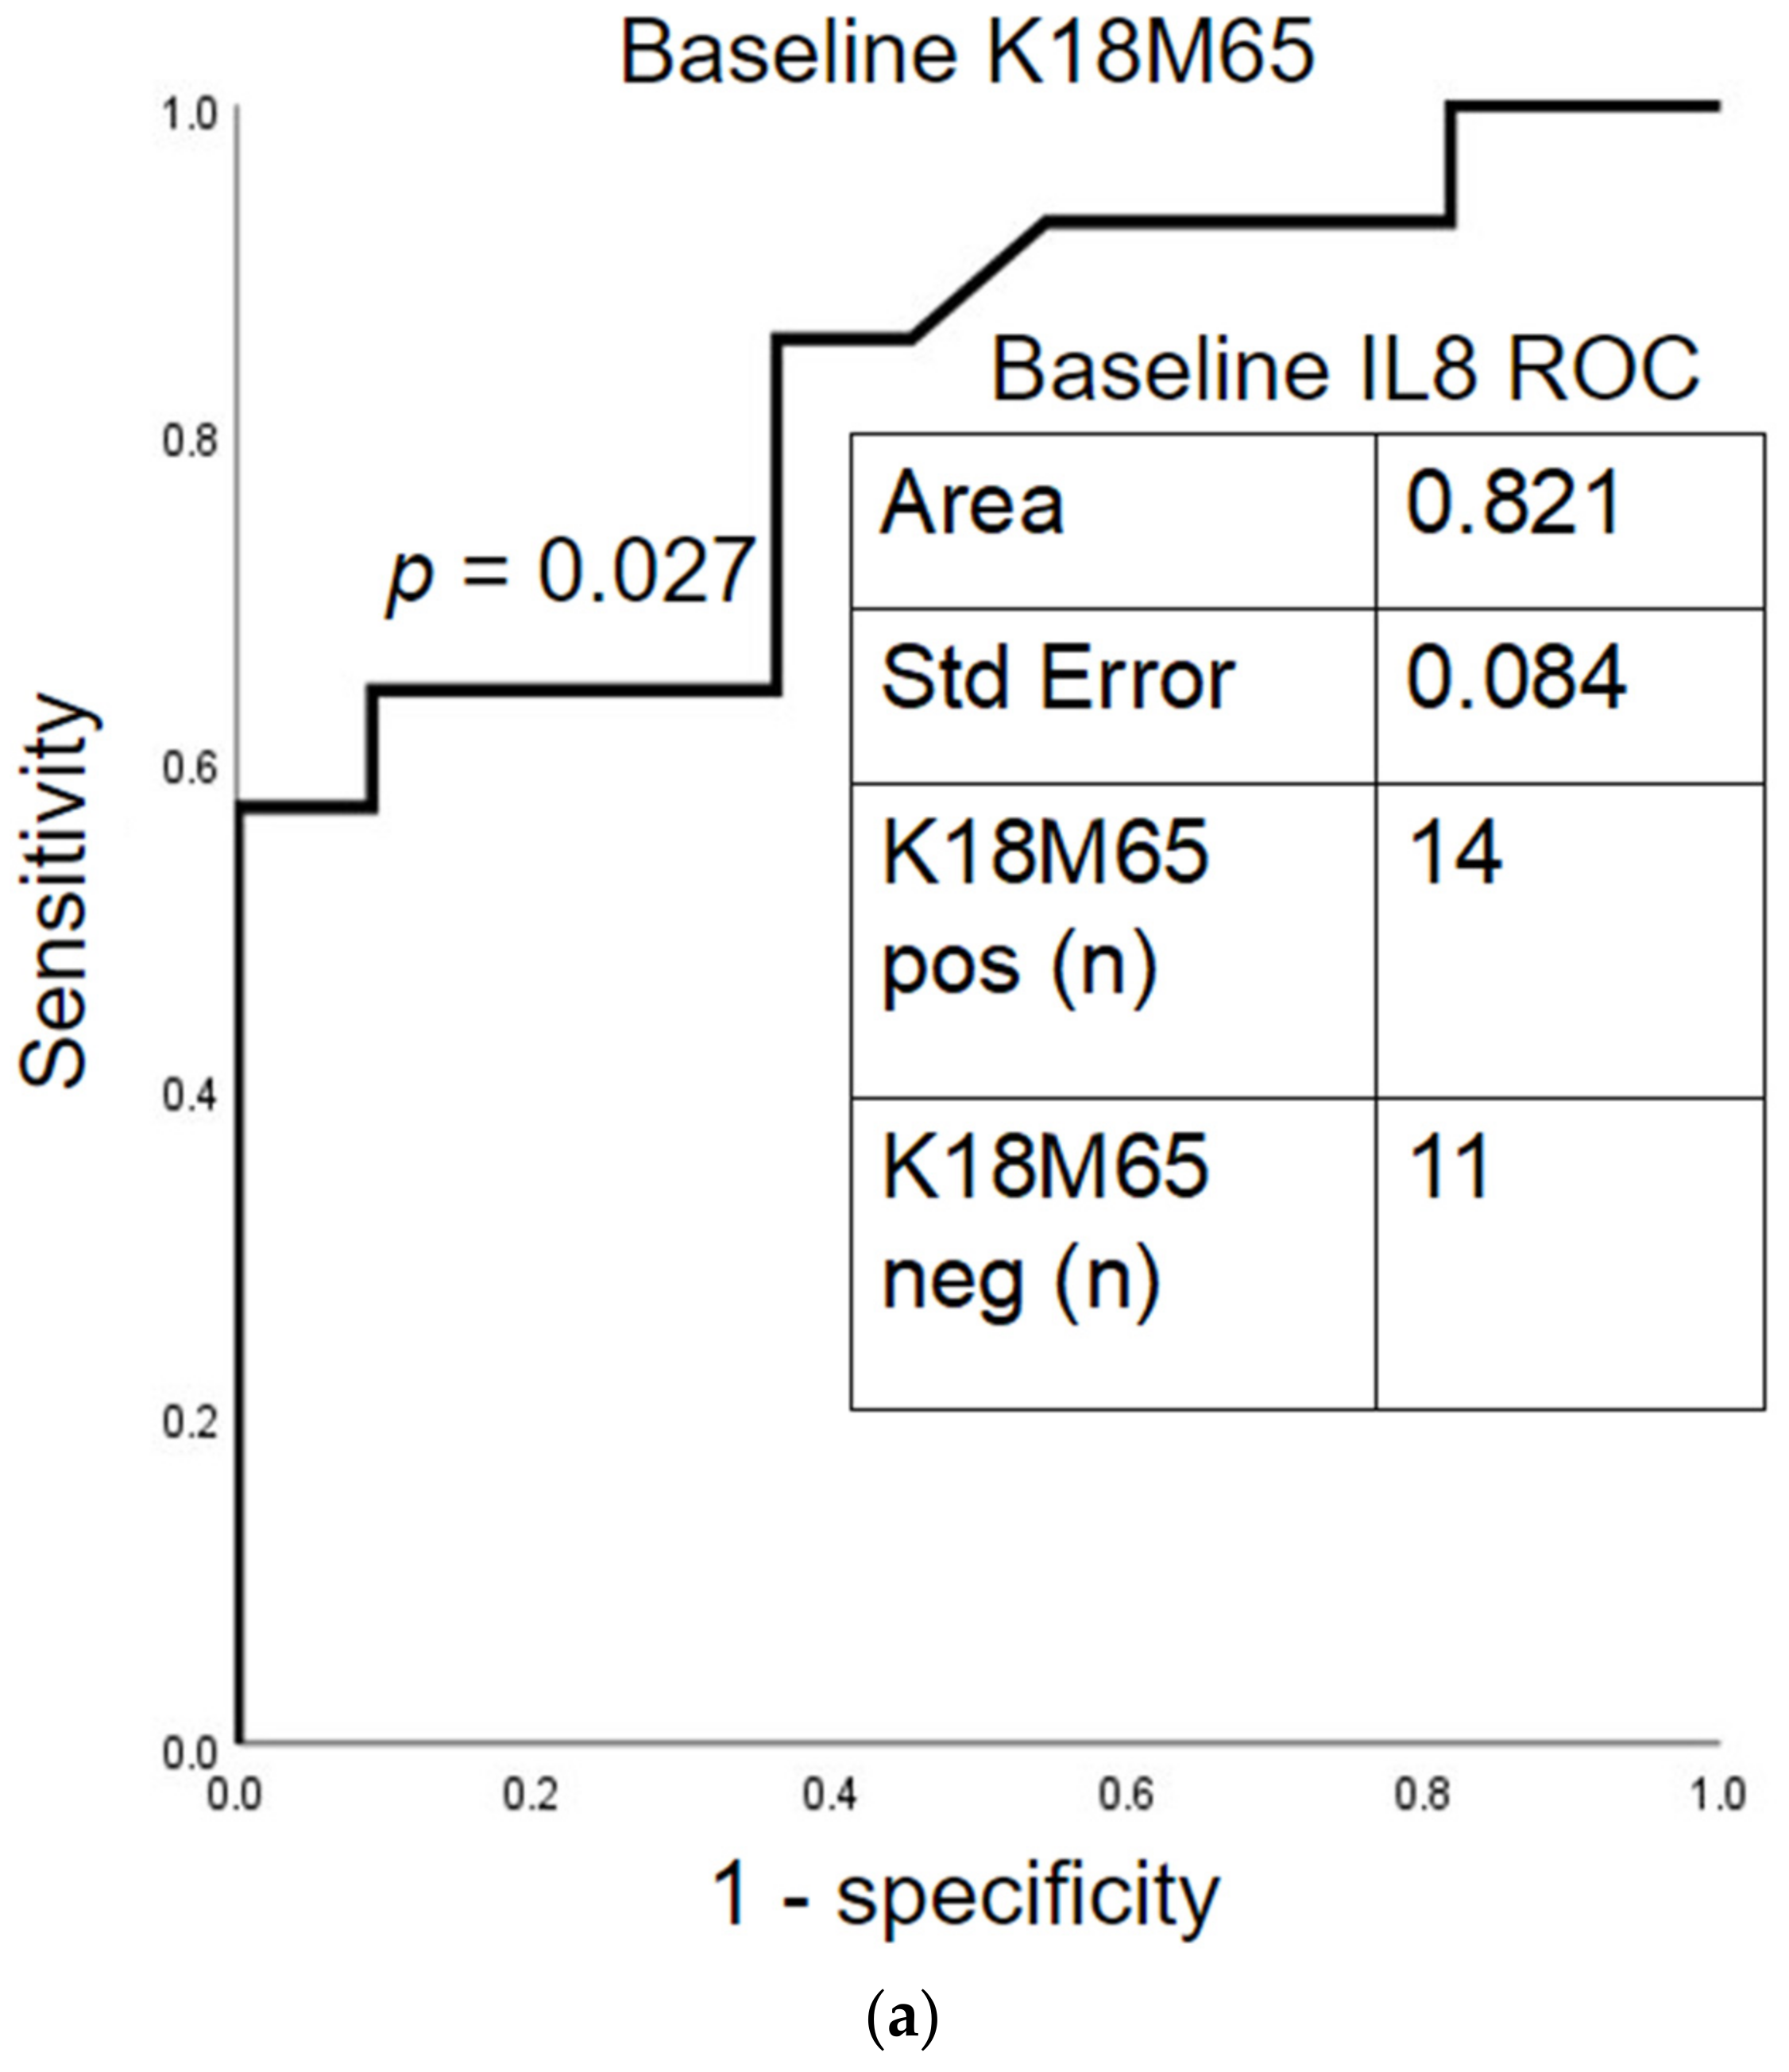
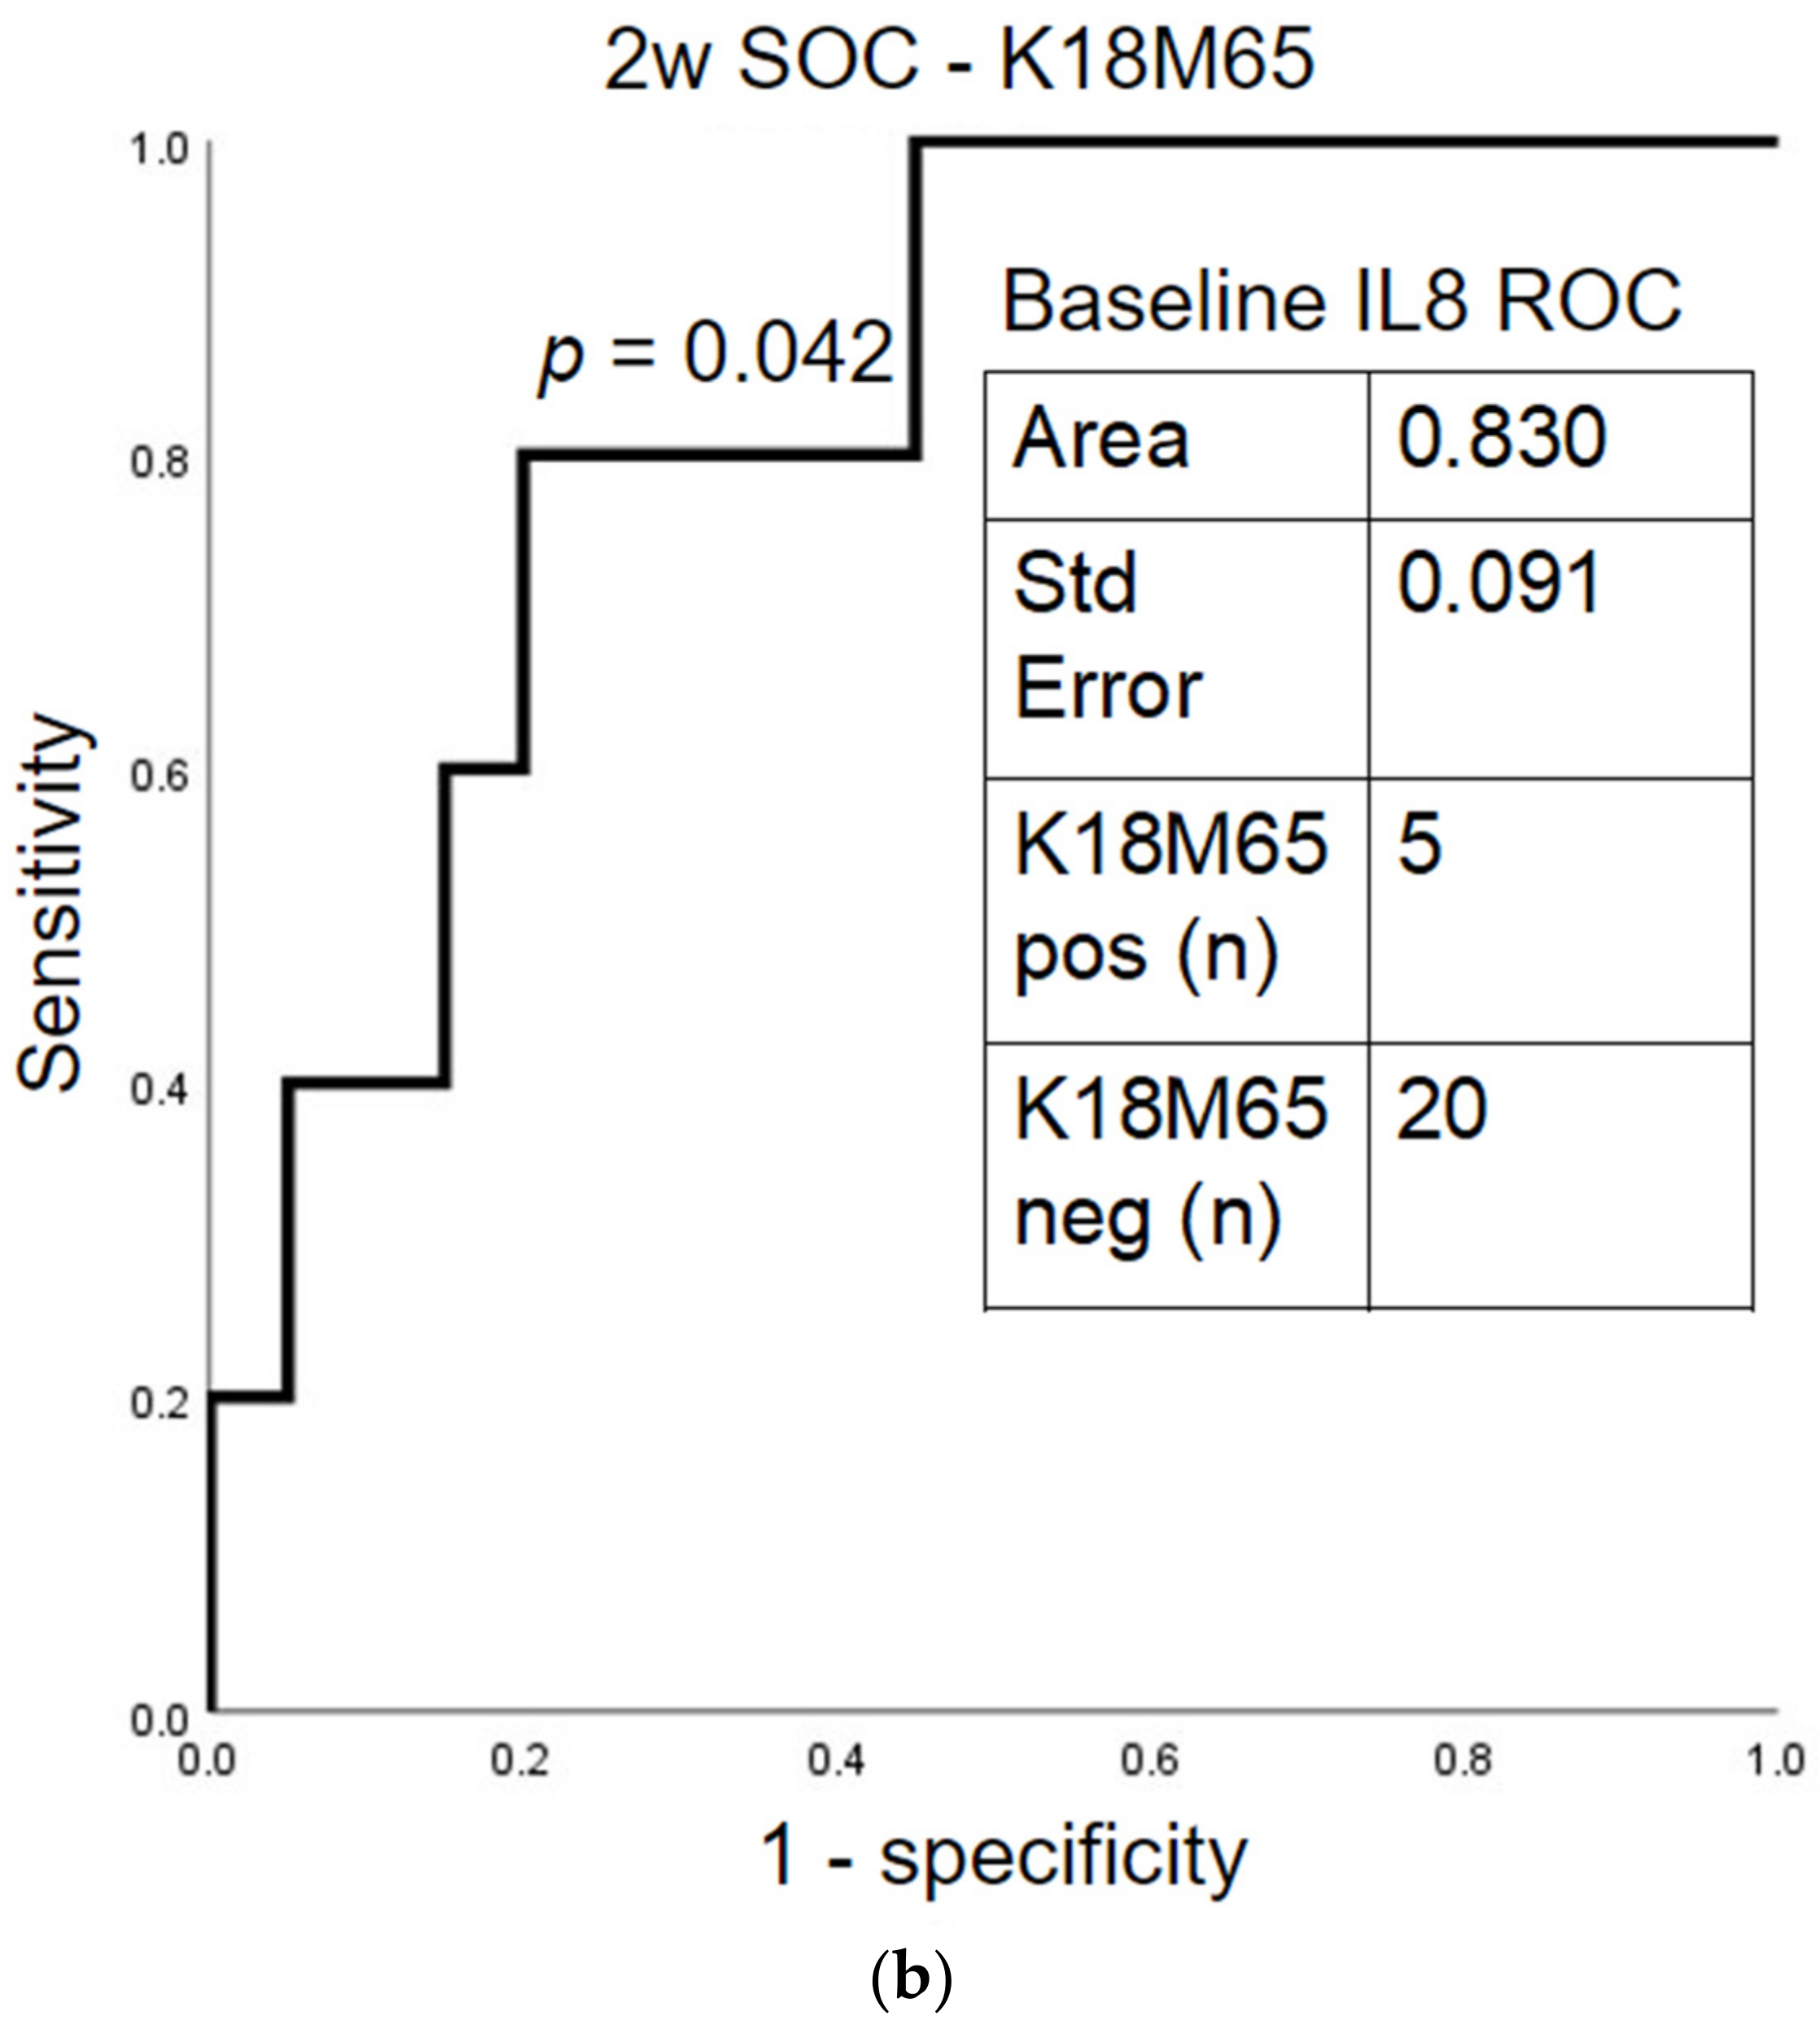
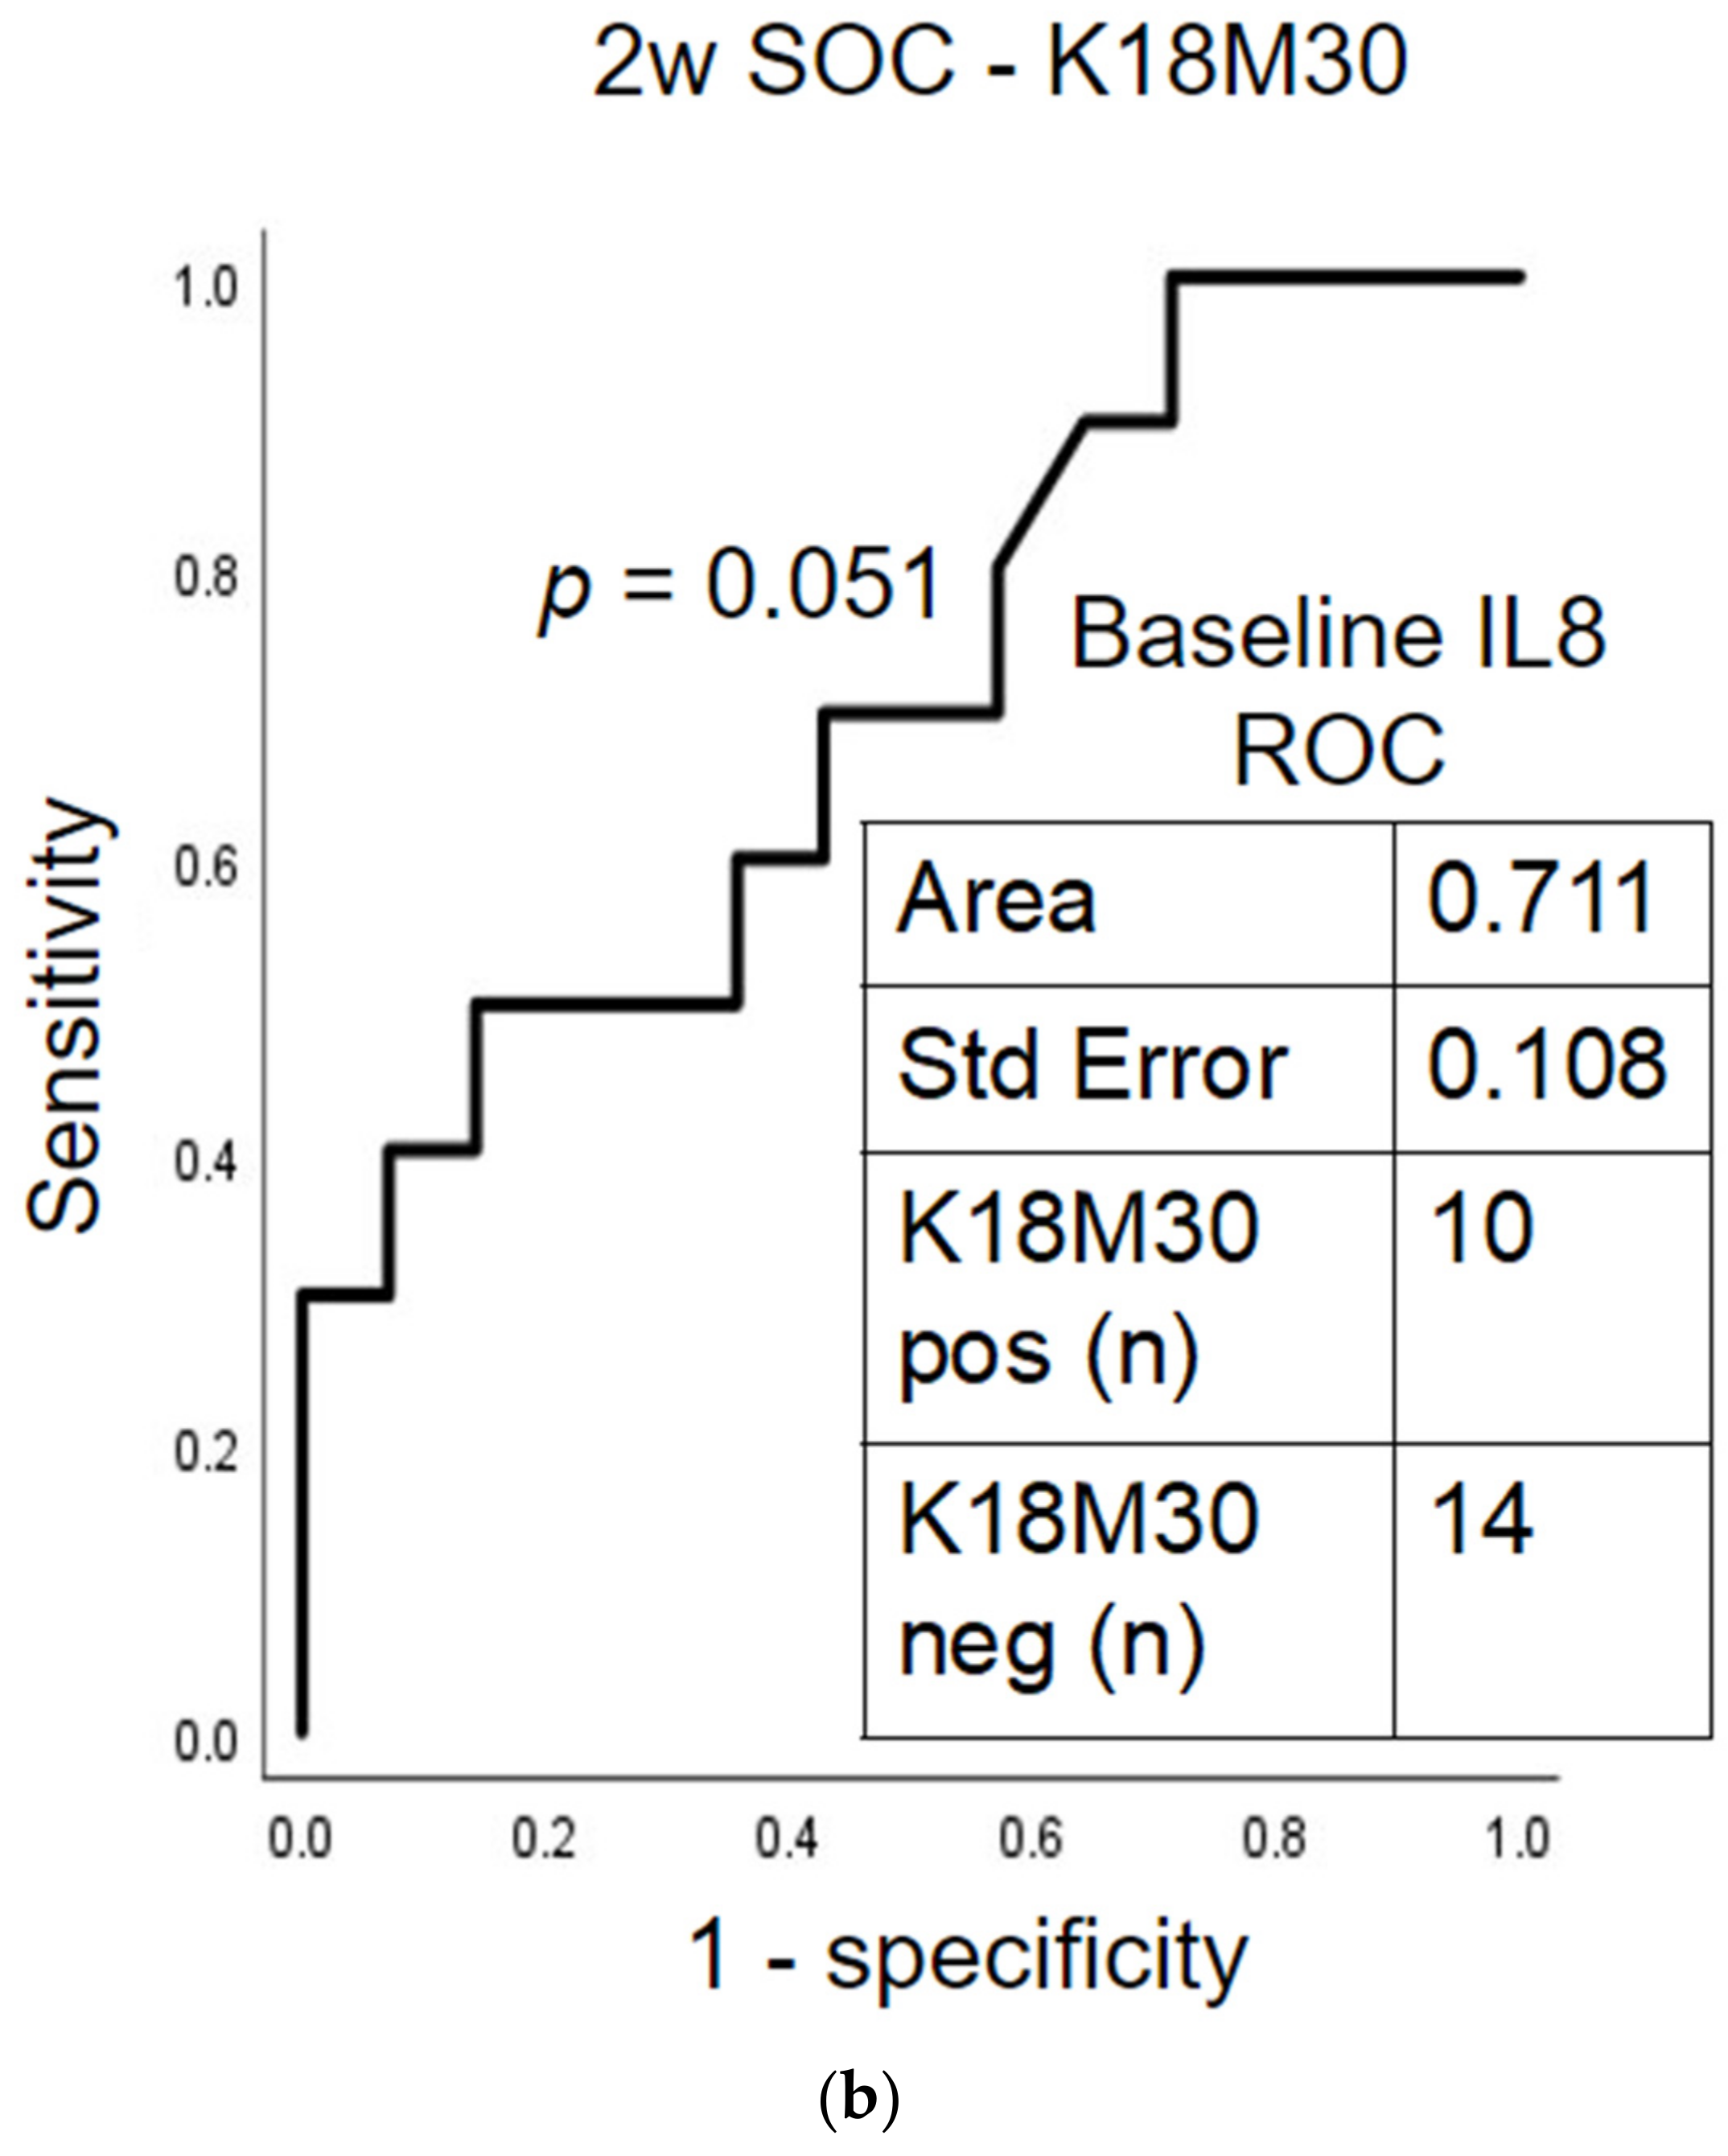
2.5. Prognostic Assessment of Immune Response and Liver Cell Death after Treatment
2.6. Baseline Differences in AUD Patients with Fibrosis by Their Post-SOC Improvement in K18M65 Levels
3. Discussion
4. Materials and Methods
4.1. Human Subjects
4.2. Demographic, Alcohol Intake and Laboratory Evaluations
4.3. Laboratory Analyses
4.4. Statistics
5. Conclusions
Author Contributions
Funding
Institutional Review Board Statement
Informed Consent Statement
Data Availability Statement
Acknowledgments
Conflicts of Interest
References
- Gao, B.; Bataller, R. Alcoholic liver disease: Pathogenesis and new therapeutic targets. Gastroenterology 2011, 141, 1572–1585. [Google Scholar] [CrossRef] [PubMed] [Green Version]
- Szabo, G.; Bala, S. Alcoholic liver disease and the gut-liver axis. World J. Gastroenterol. 2010, 16, 1321–1329. [Google Scholar] [CrossRef] [PubMed]
- McClain, C.J.; Song, Z.; Barve, S.S.; Hill, D.B.; Deaciuc, I. Recent advances in alcoholic liver disease. IV. Dysregulated cytokine metabolism in alcoholic liver disease. Am. J. Physiol. Gastrointest. Liver Physiol. 2004, 287, G497–G502. [Google Scholar] [CrossRef] [PubMed]
- Franke, W.W.; Denk, H.; Kalt, R.; Schmid, E. Biochemical and immunological identification of cytokeratin proteins present in hepatocytes of mammalian liver tissue. Exp. Cell Res. 1981, 131, 299–318. [Google Scholar] [CrossRef]
- Volkmann, X.; Anstaett, M.; Hadem, J.; Stiefel, P.; Bahr, M.J.; Lehner, F.; Manns, M.P.; Schulze-Osthoff, K.; Bantel, H. Caspase activation is associated with spontaneous recovery from acute liver failure. Hepatology 2008, 47, 1624–1633. [Google Scholar] [CrossRef]
- Ku, N.O.; Strnad, P.; Bantel, H.; Omary, M.B. Keratins: Biomarkers and modulators of apoptotic and necrotic cell death in the liver. Hepatology 2016, 64, 966–976. [Google Scholar] [CrossRef] [Green Version]
- Osawa, Y.; Nagaki, M.; Banno, Y.; Brenner, D.A.; Asano, T.; Nozawa, Y.; Moriwaki, H.; Nakashima, S. Tumor necrosis factor alpha-induced interleukin-8 production via NF-kappaB and phosphatidylinositol 3-kinase/Akt pathways inhibits cell apoptosis in human hepatocytes. Infect. Immun. 2002, 70, 6294–6301. [Google Scholar] [CrossRef] [Green Version]
- Osawa, Y.; Banno, Y.; Nagaki, M.; Brenner, D.A.; Naiki, T.; Nozawa, Y.; Nakashima, S.; Moriwaki, H. TNF-alpha-induced sphingosine 1-phosphate inhibits apoptosis through a phosphatidylinositol 3-kinase/Akt pathway in human hepatocytes. J. Immunol. 2001, 167, 173–180. [Google Scholar] [CrossRef] [Green Version]
- Bechmann, L.P.; Jochum, C.; Kocabayoglu, P.; Sowa, J.P.; Kassalik, M.; Gieseler, R.K.; Saner, F.; Paul, A.; Trautwein, C.; Gerken, G.; et al. Cytokeratin 18-based modification of the MELD score improves prediction of spontaneous survival after acute liver injury. J. Hepatol. 2010, 53, 639–647. [Google Scholar] [CrossRef]
- Papatheodoridis, G.V.; Hadziyannis, E.; Tsochatzis, E.; Chrysanthos, N.; Georgiou, A.; Kafiri, G.; Manolakopoulos, S.; Tiniakos, D.G.; Giannousis, I.; Manesis, E.K.; et al. Serum apoptotic caspase activity as a marker of severity in HBeAg-negative chronic hepatitis B virus infection. Gut 2008, 57, 500–506. [Google Scholar] [CrossRef]
- Diab, D.L.; Yerian, L.; Schauer, P.; Kashyap, S.R.; Lopez, R.; Hazen, S.L.; Feldstein, A.E. Cytokeratin 18 fragment levels as a noninvasive biomarker for nonalcoholic steatohepatitis in bariatric surgery patients. Clin. Gastroenterol. Hepatol. 2008, 6, 1249–1254. [Google Scholar] [CrossRef] [Green Version]
- Gala, K.S.; Vatsalya, V. Emerging Noninvasive Biomarkers, and Medical Management Strategies for Alcoholic Hepatitis: Present Understanding and Scope. Cells 2020, 9, 524. [Google Scholar] [CrossRef] [Green Version]
- Hill, D.B.; Barve, S.; Joshi-Barve, S.; McClain, C. Increased monocyte nuclear factor-kappaB activation and tumor necrosis factor production in alcoholic hepatitis. J. Lab. Clin. Med. 2000, 135, 387–395. [Google Scholar] [CrossRef]
- Kisseleva, T.; Brenner, D. Molecular and cellular mechanisms of liver fibrosis and its regression. Nat. Rev. Gastroenterol. Hepatol. 2021, 18, 151–166. [Google Scholar] [CrossRef]
- Vatsalya, V.; Gala, K.S.; Hassan, A.Z.; Frimodig, J.; Kong, M.; Sinha, N.; Schwandt, M.L. Characterization of Early-Stage Alcoholic Liver Disease with Hyperhomocysteinemia and Gut Dysfunction and Associated Immune Response in Alcohol Use Disorder Patients. Biomedicines 2020, 9, 7. [Google Scholar] [CrossRef]
- Seitz, H.K.; Bataller, R.; Cortez-Pinto, H.; Gao, B.; Gual, A.; Lackner, C.; Mathurin, P.; Mueller, S.; Szabo, G.; Tsukamoto, H. Alcoholic liver disease. Nat. Rev. Dis. Primers 2018, 4, 16. [Google Scholar] [CrossRef]
- Grant, B.F.; Chou, S.P.; Saha, T.D.; Pickering, R.P.; Kerridge, B.T.; Ruan, W.J.; Huang, B.; Jung, J.; Zhang, H.; Fan, A.; et al. Prevalence of 12-Month Alcohol Use, High-Risk Drinking, and DSM-IV Alcohol Use Disorder in the United States, 2001–2002 to 2012–2013: Results from the National Epidemiologic Survey on Alcohol and Related Conditions. JAMA Psychiatry 2017, 74, 911–923. [Google Scholar] [CrossRef]
- Bellentani, S.; Saccoccio, G.; Costa, G.; Tiribelli, C.; Manenti, F.; Sodde, M.; Saveria Croce, L.; Sasso, F.; Pozzato, G.; Cristianini, G.; et al. Drinking habits as cofactors of risk for alcohol induced liver damage. Gut 1997, 41, 845–850. [Google Scholar] [CrossRef] [Green Version]
- Vatsalya, V.; Liaquat, H.B.; Ghosh, K.; Mokshagundam, S.P.; McClain, C.J. A Review on the Sex Differences in Organ and System Pathology with Alcohol Drinking. Curr. Drug Abuse Rev. 2016, 9, 87–92. [Google Scholar] [CrossRef] [Green Version]
- Marsano, L.S.; Vatsalya, V.; Hassan, A.; McClain, C. Clinical Features, Disease Modifiers, and Natural History of Alcoholic Liver Disease. In Alcoholic and Non-Alcoholic Fatty Liver Disease Bench to Bedside, 2016 ed.; Chalasani, N.S., Gyongyi, S., Eds.; Springer: Cham, Switzerland, 2016. [Google Scholar]
- Giannini, E.G.; Testa, R.; Savarino, V. Liver enzyme alteration: A guide for clinicians. CMAJ 2005, 172, 367–379. [Google Scholar] [CrossRef] [Green Version]
- Atkinson, S.R.; Grove, J.I.; Liebig, S.; Astbury, S.; Vergis, N.; Goldin, R.; Quaglia, A.; Bantel, H.; Guha, I.N.; Thursz, M.R.; et al. In Severe Alcoholic Hepatitis, Serum Keratin-18 Fragments Are Diagnostic, Prognostic, and Theragnostic Biomarkers. Am. J. Gastroenterol. 2020, 115, 1857–1868. [Google Scholar] [CrossRef] [PubMed]
- Woolbright, B.L.; Bridges, B.W.; Dunn, W.; Olson, J.C.; Weinman, S.A.; Jaeschke, H. Cell Death and Prognosis of Mortality in Alcoholic Hepatitis Patients Using Plasma Keratin-18. Gene Expr. 2017, 17, 301–312. [Google Scholar] [CrossRef] [PubMed]
- Tsutsui, M.; Tanaka, N.; Kawakubo, M.; Sheena, Y.; Horiuchi, A.; Komatsu, M.; Nagaya, T.; Joshita, S.; Umemura, T.; Ichijo, T.; et al. Serum fragmented cytokeratin 18 levels reflect the histologic activity score of nonalcoholic fatty liver disease more accurately than serum alanine aminotransferase levels. J. Clin. Gastroenterol. 2010, 44, 440–447. [Google Scholar] [CrossRef] [PubMed]
- Rao, R.K.; Seth, A.; Sheth, P. Recent Advances in Alcoholic Liver Disease I. Role of intestinal permeability and endotoxemia in alcoholic liver disease. Am. J. Physiol.-Gastrointest. Liver Physiol. 2004, 286, G881–G884. [Google Scholar] [CrossRef]
- McClain, C.J.; Barve, S.; Barve, S.; Deaciuc, I.; Hill, D.B. Tumor necrosis factor and alcoholic liver disease. Alcohol. Clin. Exp. Res. 1998, 22, 248S–252S. [Google Scholar] [CrossRef]
- Brenner, C.; Galluzzi, L.; Kepp, O.; Kroemer, G. Decoding cell death signals in liver inflammation. J. Hepatol. 2013, 59, 583–594. [Google Scholar] [CrossRef] [Green Version]
- Kawaratani, H.; Tsujimoto, T.; Douhara, A.; Takaya, H.; Moriya, K.; Namisaki, T.; Noguchi, R.; Yoshiji, H.; Fujimoto, M.; Fukui, H. The effect of inflammatory cytokines in alcoholic liver disease. Mediat. Inflamm. 2013, 2013, 495156. [Google Scholar] [CrossRef]
- Dominguez, M.; Miquel, R.; Colmenero, J.; Moreno, M.; Garcia-Pagan, J.C.; Bosch, J.; Arroyo, V.; Gines, P.; Caballeria, J.; Bataller, R. Hepatic expression of CXC chemokines predicts portal hypertension and survival in patients with alcoholic hepatitis. Gastroenterology 2009, 136, 1639–1650. [Google Scholar] [CrossRef]
- Hotez, P.J.; Bottazzi, M.E.; Corry, D.B. The potential role of Th17 immune responses in coronavirus immunopathology and vaccine-induced immune enhancement. Microbes Infect. 2020, 22, 165–167. [Google Scholar] [CrossRef]
- Lasiglie, D.; Traggiai, E.; Federici, S.; Alessio, M.; Buoncompagni, A.; Accogli, A.; Chiesa, S.; Penco, F.; Martini, A.; Gattorno, M. Role of IL-1 beta in the development of human T(H)17 cells: Lesson from NLPR3 mutated patients. PLoS ONE 2011, 6, e20014. [Google Scholar] [CrossRef] [Green Version]
- Lafdil, F.; Miller, A.M.; Ki, S.H.; Gao, B. Th17 cells and their associated cytokines in liver diseases. Cell Mol. Immunol. 2010, 7, 250–254. [Google Scholar] [CrossRef] [Green Version]
- Wullaert, A.; van Loo, G.; Heyninck, K.; Beyaert, R. Hepatic tumor necrosis factor signaling and nuclear factor-kappaB: Effects on liver homeostasis and beyond. Endocr. Rev. 2007, 28, 365–386. [Google Scholar] [CrossRef]
- Hu, Y.; Zhang, H.; Xie, N.; Liu, D.; Jiang, Y.; Liu, Z.; Ye, D.; Liu, S.; Chen, X.; Li, C.; et al. Bcl-3 promotes TNF-induced hepatocyte apoptosis by regulating the deubiquitination of RIP1. Cell Death Differ. 2021, 1–11. [Google Scholar] [CrossRef]
- Zheng, S.J.; Liu, S.; Liu, M.; McCrae, M.A.; Li, J.F.; Han, Y.P.; Xu, C.H.; Ren, F.; Chen, Y.; Duan, Z.P. Prognostic value of M30/M65 for outcome of hepatitis B virus-related acute-on-chronic liver failure. World J. Gastroenterol. 2014, 20, 2403–2411. [Google Scholar] [CrossRef]
- Vatsalya, V.; Cave, M.C.; Kong, M.; Gobejishvili, L.; Falkner, K.C.; Craycroft, J.; Mitchell, M.; Szabo, G.; McCullough, A.; Dasarathy, S.; et al. Keratin 18 Is a Diagnostic and Prognostic Factor for Acute Alcoholic Hepatitis. Clin. Gastroenterol. Hepatol. 2020, 18, 2046–2054. [Google Scholar] [CrossRef]
- Vallet-Pichard, A.; Mallet, V.; Nalpas, B.; Verkarre, V.; Nalpas, A.; Dhalluin-Venier, V.; Fontaine, H.; Pol, S. FIB-4: An inexpensive and accurate marker of fibrosis in HCV infection. comparison with liver biopsy and fibrotest. Hepatology 2007, 46, 32–36. [Google Scholar] [CrossRef]
- American Psychiatric Association. Electronic DSM-IV, Windows; American Psychiatric Association: Washington, DC, USA, 1994. [Google Scholar]
- Vatsalya, V.; Li, F.; Frimodig, J.; Shah, N.; Sutrawe, A.; Feng, W. Efficacy of Thiamine and Medical Management in Treating Hyperuricemia in AUD Patients with ALD: Role of Hyperuricemia in Liver Injury, Gut-Barrier Dysfunction, and Inflammation. Clin. Exp. Pharmacol. 2021, 11, 1. [Google Scholar]
- Vatsalya, V.; Kong, M.; Cave, M.C.; Liu, N.; Schwandt, M.L.; George, D.T.; Ramchandani, V.A.; McClain, C.J. Association of serum zinc with markers of liver injury in very heavy drinking alcohol-dependent patients. J. Nutr. Biochem. 2018, 59, 49–55. [Google Scholar] [CrossRef]
- Vatsalya, V.; Gala, K.S.; Mishra, M.; Schwandt, M.L.; Umhau, J.; Cave, M.C.; Parajuli, D.; Ramchandani, V.A.; McClain, C.J. Lower Serum Magnesium Concentrations Are Associated with Specific Heavy Drinking Markers, Pro-Inflammatory Response and Early-Stage Alcohol-Associated Liver Injury Section Sign. Alcohol. Alcohol. 2020, 55, 164–170. [Google Scholar] [CrossRef]
- Vatsalya, V.; Stangl, B.L.; Schmidt, V.Y.; Ramchandani, V.A. Characterization of hangover following intravenous alcohol exposure in social drinkers: Methodological and clinical implications. Addict. Biol. 2018, 23, 493–502. [Google Scholar] [CrossRef] [Green Version]
- Acamprosate. Available online: https://0-www-ncbi-nlm-nih-gov.brum.beds.ac.uk/books/NBK548677/ (accessed on 22 March 2022).
- Diazepam. Available online: https://0-www-ncbi-nlm-nih-gov.brum.beds.ac.uk/books/NBK547871/ (accessed on 22 March 2022).
- Sterling, R.K.; Lissen, E.; Clumeck, N.; Sola, R.; Correa, M.C.; Montaner, J.; Sulkowski, M.S.; Torriani, F.J.; Dieterich, D.T.; Thomas, D.L.; et al. Development of a simple noninvasive index to predict significant fibrosis in patients with HIV/HCV coinfection. Hepatology 2006, 43, 1317–1325. [Google Scholar] [CrossRef] [PubMed]
- Chrostek, L.; Przekop, D.; Gruszewska, E.; Gudowska-Sawczuk, M.; Cylwik, B. Noninvasive Indirect Markers of Liver Fibrosis in Alcoholics. Biomed. Res. Int. 2019, 2019, 3646975. [Google Scholar] [CrossRef] [PubMed]
- Roy, M.; Dum, M.; Sobell, L.C.; Sobell, M.B.; Simco, E.R.; Manor, H.; Palmerio, R. Comparison of the quick drinking screen and the alcohol timeline followback with outpatient alcohol abusers. Subst. Use Misuse 2008, 43, 2116–2123. [Google Scholar] [CrossRef] [PubMed]
- Skinner, H.A.; Sheu, W.-J. Reliability of alcohol use indices. The Lifetime Drinking History and the MAST. J. Stud. Alcohol. 1982, 43, 1157–1170. [Google Scholar] [CrossRef]
- Vatsalya, V.; Kong, M.; Gobejishvili, L.; Chen, W.Y.; Srivastava, S.; Barve, S.; McClain, C.; Joshi-Barve, S. Urinary acrolein metabolite levels in severe acute alcoholic hepatitis patients. Am. J. Physiol.-Gastrointest. Liver Physiol. 2019, 316, G115–G122. [Google Scholar] [CrossRef]
- Vatsalya, V.; Hassan, H.Z.; Kong, M.; Stangl, B.L.; Schwandt, M.L.; Schmidt-Teron, V.Y.; Verster, J.C.; Ramchandani, V.A.; McClain, C.J. Exacerbation of Hangover Symptomology Significantly Corresponds with Heavy and Chronic Alcohol Drinking: A Pilot Study. J. Clin. Med. 2019, 8, 1943. [Google Scholar] [CrossRef] [Green Version]
- Fukushima, K.; Ueno, Y.; Kawagishi, N.; Kondo, Y.; Inoue, J.; Kakazu, E.; Ninomiya, M.; Wakui, Y.; Saito, N.; Satomi, S.; et al. The nutritional index ‘CONUT’ is useful for predicting long-term prognosis of patients with end-stage liver diseases. Tohoku J. Exp. Med. 2011, 224, 215–219. [Google Scholar] [CrossRef] [Green Version]


| Measures | Group 1 (Normal FIB-4, Gr.1) | Group 2 (Elevated FIB-4, Gr. 2) | Between Group p-Value | ||||
|---|---|---|---|---|---|---|---|
| Males (n = 15; 71.4%) | Females (n = 6; 28.6%) | Total (n = 21; 43.8%) | Males (n = 19; 70.4%) | Females (n = 8; 29.6%) | Total (n = 27; 56.3%) | ||
| Age d (years) | 37.6 ± 10.3 | 39.6 ± 11.1 | 38.2 ± 10.3 | 47.8 ± 7.0 | 45.5 ± 12.6 | 47.1 ± 8.8 | 0.002 |
| BMI abc (kg/m2) | 28.5 ± 5.1 | 30.1 ± 11.1 | 29.0 ± 7.1 | 24.9 ± 3.0 | 25.6 ± 3.8 | 25.1 ± 3.2 | 0.024 |
| Drinking History | |||||||
| TD90 | 1249 ± 5 | 855 ± 662 | 1136 ± 648 | 1094 ± 482 | 1027 ± 611 | 1076 ± 508 | ns |
| HDD90 | 68.9 ± 20.7 | 50.7 ± 17.2 | 63.7 ± 21.1 | 74.7 ± 21.2 | 78.9 ± 16.9 | 75.8 ± 19.9 | 0.048 |
| AvgDPD90 | 16.5 ± 6.0 | 15.7 ± 8.5 | 16.2 ± 6.6 | 14.7 ± 5.6 | 12.3 ± 6.4 | 14.0 ± 5.8 | ns |
| NDD90 | 73.2 ± 17.2 | 52.0 ± 17.2 | 67.1 ± 19.4 | 76.5 ± 20.4 | 80.6 ± 14.1 | 77.6 ± 18.7 | ns |
| LTDH b | 12.1 ± 5.6 | 7.5 ± 2.6 | 10.6 ± 5.2 | 21.6 ± 10.1 | 12.8 ± 8.2 | 19.0 ± 10.3 | 0.002 |
| Liver Injury Markers | |||||||
| ALT abcd (IU/L) | 51.3 ± 24.0 | 18.2 ± 5.3 | 41.8 ± 25.4 | 99.3 ± 37.9 | 110 ± 102 | 102 ± 62 | p < 0.001 |
| AST abd (IU/L) | 38.2 ± 18.4 | 25.2 ± 12.2 | 34.5 ± 17.6 | 140 ± 82 | 180 ± 133 | 152 ± 99 | p < 0.001 |
| AST: ALT a | 0.80 ± 0.28 | 1.36 ± 0.35 | 0.96 ± 0.39 | 1.43 ± 0.57 | 1.87 ± 0.87 | 1.56 ± 0.68 | p < 0.001 |
| Nutritional Status | |||||||
| CONUTad | 0.60 ± 0.63 | 0.83 ± 1.17 | 0.67 ± 0.80 | 1.42 ± 1.47 | 0.75 ± 0.71 | 1.22 ± 1.31 | ns |
| Blood Cell Measures | |||||||
| WBC a (K/uL) | 7.57 ± 2.91 | 7.99 ± 2.77 | 7.69 ± 2.81 | 4.95 ± 1.57 | 7.01 ± 1.89 | 5.56 ± 1.89 | 0.004 |
| AMC (K/uL) | 0.65 ± 0.28 | 0.51 ± 0.13 | 0.61 ± 0.25 | 0.45 ± 0.23 | 0.49 ± 0.08 | 0.46 ± 0.19 | 0.026 |
| ANC a (K/uL) | 4.38 ±2.40 | 4.71 ± 1.90 | 4.48 ± 2.22 | 2.95 ± 1.23 | 4.36 ± 1.92 | 3.37 ± 1.57 | 0.049 |
| Candidate Cytokine Response | |||||||
| IL1β (pg/mL) | 0.52 ± 0.29 | 0.52 ± 0.46 | 0.52 ± 0.33 | 0.52 ± 0.30 | 0.50 ± 0.60 | 0.51 ± 0.40 | 0.002 |
| IL6 (pg/mL) | 3.03 ± 2.17 | 1.40 ± 0.72 | 2.60 ± 2.01 | 3.18 ± 2.82 | 6.61 ± 4.46 | 4.28 ± 3.71 | ns |
| TNFα ad (pg/mL) | 1.81 ± 0.87 | 1.35 ± 0.88 | 1.69 ± 0.87 | 1.90 ± 0.51 | 2.39 ± 1.46 | 2.06 ± 0.92 | 0.025 |
| IL8 acd (pg/mL) | 2.92 ± 1.27 | 16.68 ± 31.26 | 6.54 ± 16.03 | 5.55 ± 3.52 | 13.40 ± 19.08 | 8.06 ± 11.33 | ns |
| Candidate Gut-dysfunction Markers | |||||||
| LPS a (EU/mL) | 0.082 ± 0.045 | 0.076 ± 0.054 | 0.080 ± 0.047 | 0.114 ± 0.065 | 0.112 ± 0.062 | 0.114 ± 0.063 | 0.050 |
| LBP c (ng/mL) | 926.5 ± 1347 | 2439 ± 4030 | 1304 ± 2282 | 2263 ± 2792 | 2355 ± 3911 | 2289 ± 3057 | ns |
| CD14 (×106 pg/mL) | 8604 ± 1590 | 9748 ± 1757 | 8931 ± 1680 | 9198 ± 2010 | 10526 ± 1141 | 9592 ± 1879 | ns |
| Liver Cell Death Markers | |||||||
| K18M65 ab (IU/L) | 238.6 ± 119.2 | 151.6 ± 66.5 | 213.7 ± 112.6 | 1115 ± 1018 | 1040 ± 956 | 1093 ± 982 | p < 0.001 |
| K18M30 (IU/L) | 202.2 ± 70.7 | 568.5 ± 923.0 | 306.8 ± 495.2 | 407.7 ± 377.8 | 515.2 ± 335.7 | 439.5 ± 362.8 | ns |
| M65:M30 a | 1.28 ± 0.66 | 0.68 ± 0.52 | 1.11 ± 0.67 | 2.73 ± 1.55 | 1.90 ± 0.79 | 2.48 ± 1.41 | p < 0.001 |
| Measures | Group 2c (1.45 ≤ FIB-4 ≤ 3.25), Gr. 2c) | Group 2d (FIB-4 > 3.25, Gr. 2d) | Between Group p-Value | ||||
|---|---|---|---|---|---|---|---|
| Males (n = 10; 71.4%) | Females (n = 4; 28.6%) | Total (n = 14; 51.9%) | Males (n = 9; 69.2%) | Females (n = 4; 30.7%) | Total (n = 13; 48.1%) | ||
| Age c (years) | 44.84 ± 5.27 | 41.87 ± 15.06 | 43.99 ± 8.57 | 51.05 ± 7.42 | 49.07 ± 10.46 | 50.44 ± 8.06 | ns |
| BMI (kg/m2) | 24.99 ± 3.11 | 24.30 ± 4.72 | 24.79 ± 3.45 | 24.81 ± 2.95 | 26.83 ± 2.66 | 25.48 ± 2.91 | ns |
| Drinking History | |||||||
| TD90 | 1199 ± 601 | 1182 ± 821 | 1195 ± 619 | 978 ± 296 | 911 ± 507 | 958 ± 351 | ns |
| HDD90 b | 70.50 ± 25.04 | 74.00 ± 25.98 | 71.31 ± 24.19 | 79.44 ± 16.14 | 82.50 ± 8.81 | 80.38 ± 13.97 | 0.045 |
| AvgDPD90 | 16.73 ± 6.35 | 14.36 ± 7.81 | 16.18 ± 6.44 | 12.42 ± 3.84 | 10.77 ± 5.82 | 11.91 ± 4.35 | ns |
| NDD90 | 72.10 ± 23.10 | 77.00 ± 20.78 | 73.23 ± 21.84 | 81.33 + 16.83 | 83.25 ±9.43 | 81.92 ± 14.56 | ns |
| LTDH a | 22.40 ± 6.24 | 14.75 ± 7.41 | 20.21 ± 7.24 | 20.67 ± 13.63 | 10.75 ± 9.47 | 17.62 ± 13.00 | 0.011 |
| Liver Injury Markers | |||||||
| ALT bd (IU/L) | 97.80 ± 34.93 | 50.75 ± 23.47 | 84.36 ± 38.19 | 100.89 ± 43.12 | 170.50 ± 119.72 | 122.31 ± 77.08 | ns |
| AST a (IU/L) | 104.8 ± 49.5 | 102.3 ± 73.5 | 104.1 ± 54.3 | 179.9 ± 94.9 | 257.8 ± 141.5 | 203.9 ± 111.4 | 0.003 |
| AST:ALT | 1.064 ± 0.293 | 1.898 ± 0.476 | 1.302 ± 0.514 | 1.830 ± 0.532 | 1.833 ± 1.235 | 1.831 ± 0.755 | ns |
| Nutritional Status | |||||||
| CONUT | 0.800 ± 1.135 | 0.750 ± 0.500 | 0.786 ± 0.975 | 2.111 ± 1.537 | 0.750 ± 0.957 | 1.692 ± 1.494 | ns |
| Blood Cell Measures | |||||||
| WBC (K/uL) | 5.433 ± 1.333 | 8.100 ± 1.692 | 6.195 ± 1.858 | 4.419 ± 1.710 | 5.920 ± 1.504 | 4.881 ± 1.742 | ns |
| AMC a (K/uL) | 0.463 ± 0.130 | 0.528 ± 0.095 | 0.481 ±0.121 | 0.429 ± 0.311 | 0.452 ± 0.046 | 3.687 ± 1.762 | ns |
| ANC (K/uL) | 3.138 ± 1.216 | 5.057 ± 2.346 | 3.687 ± 1.762 | 2.741 ± 1.293 | 3.662 ± 1.328 | 3.025 ± 1.323 | ns |
| Candidate Cytokine Response | |||||||
| IL1β (pg/mL) | 0.618 ± 0.329 | 0.736 ± 0.794 | 0.655 ± 0.482 | 0.409 ± 0.222 | 0.273 ± 0.242 | 0.364 ± 0.228 | ns |
| IL6 a (pg/mL) | 2.398 ± 1.022 | 3.913 ± 1.389 | 2.864 ± 1.307 | 4.052 ± 3.916 | 9.311 ± 5.000 | 5.804 ± 4.825 | 0.003 |
| TNFα bd (pg/mL) | 2.049 ± 0.536 | 1.479 ± 0.0.336 | 1.874 ± 0.543 | 1.742 ± 0.456 | 3.304 ± 1.617 | 2.263 ± 1.199 | ns |
| IL8 d (pg/mL) | 4.878 ± 1.998 | 4.154 ± 1.482 | 4.655 ± 1.825 | 6.306 ± 4.738 | 22.637 ± 24.883 | 11.750 ± 15.742 | 0.023 |
| Candidate Gut-dysfunction Markers | |||||||
| LPS a (EU/mL) | 0.124 ± 0.063 | 0.124 ± 0.081 | 0.124 ± 0.065 | 0.104 ± 0.071 | 0.099 ± 0.046 | 0.102 ± 0.062 | ns |
| LBP (ng/mL) | 2385 ± 3395 | 723 ± 555 | 1969 ± 3000 | 2142 ± 2238 | 3579 ± 5071 | 2584 ± 3201 | ns |
| CD14 (×106 pg/mL) | 9229 ± 1912 | 10679 ± 1215 | 9643 ± 1826 | 9164 ± 2231 | 10373 ± 1224 | 9536 ± 2007 | ns |
| Liver Cell Death Markers | |||||||
| K18M65 (IU/L) | 1124 ± 1281 | 528 ± 329 | 953.4 ± 1113.2 | 1107 ± 696 | 1552 ± 1151 | 1244 ± 837 | ns |
| K18M30 (IU/L) | 474.7 ± 503.4 | 404.4 ± 218.3 | 454.6 ± 433.0 | 333.1 ± 155.5 | 626.1 ± 427.2 | 423.4 ± 285.5 | ns |
| M65:M30 | 2.232 ± 1.196 | 1.443 ±0.645 | 2.007 ± 1.106 | 3.285 ± 1.780 | 2.348 ± 0.711 | 2.997 ± 1.563 | ns |
| Measures | Group 2a (Improved K18M65, Gr. 2a) | Group 2b (Elevated K18M65, Gr. 2b) | Between Group p-Value | ||||
|---|---|---|---|---|---|---|---|
| Males (n = 15; 75%) | Females (n = 5; 25%) | Total (n = 20; 74.1%) | Males (n = 4; 57.1%) | Females (n = 3; 42.9%) | Total (n = 7; 25.9%) | ||
| Liver Injury Markers | |||||||
| ALT(IU/L) | 61.83 ± 25.21 | na | 61.83 ± 25.21 | 51.00 ± 19.00 | 45.00 ± 25.46 | 48.60 ± 18.80 | ns |
| AST (IU/L) | 29.83 ± 6.31 | na | 29.83 ± 6.31 | 39.33 ± 5.03 | 34.50 ± 6.36 | 37.40 ± 5.46 | ns |
| AST: ALT | 0.55 ± 0.27 | na | 0.55 ± 0.27 | 0.85 ± 0.35 | 0.87 ≠ 0.35 | 0.86 ± 0.30 | ns |
| Candidate Cytokine Response | |||||||
| IL1β c (pg/mL) | 0.48 ± 0.23 | 1.90 ± 1.57 | 0.87 ± 1.02 | 0.47 ± 0.23 | 0.28 ± 0.17 | 0.39 ± 0.22 | ns |
| IL6 ab (pg/mL) | 2.58 ± 1.02 | 3.00 ± 0.63 | 2.70 ± 0.93 | 6.03 ± 3.99 | 5.46 ± 1.97 | 5.78 ± 3.06 | p < 0.001 |
| TNFα (pg/mL) | 2.32 ± 0.70 | 2.17 ± 0.95 | 2.27 ± 0.75 | 2.21 ± 1.10 | 3.04 ± 1.57 | 2.56 ± 1.27 | ns |
| IL8 (pg/mL) | 3.06 ± 1.53 | 2.47 ± 1.48 | 2.89 ± 1.50 | 3.94 ± 1.37 | 10.58 ± 7.85 | 6.79 ± 5.84 | 0.013 |
| Candidate Gut-dysfunction Markers | |||||||
| LPS c (EU/mL) | 0.059 ± 0.019 | 0.093 ± 0.042 | 0.068 ± 0.029 | 0.040 ± 0.024 | 0.053 ± 0.011 | 0.046 ± 0.019 | ns |
| LBP b (ng/mL) | 1481 ± 1374 | 764.8 ± 808.9 | 1330 ± 1291 | 4290 ± 5906 | 7766 ± 1162 | 5780 ± 4620 | p < 0.001 |
| CD14 cd (×106 pg/mL) | 6728 ± 1681 | 9778 ±1153 | 7490 ± 2049 | 6350 ± 1111 | 8878 ± 780 | 7433 ± 1627 | ns |
| Liver Cell Death Markers | |||||||
| K18M65 ab (IU/L) | 288.3 ± 92.2 | 205.7 ± 62.3 | 267.7 ± 91.8 | 2358 ±3098 | 864.3 ± 133.7 | 1718 ± 2333 | 0.008 |
| K18M30 a (IU/L) | 202.3 ± 48.4 | 300.9 ± 193.2 | 227.0 ± 107.3 | 386.6 ± 157.2 | 444.0 ± 81.3 | 415.3 ± 116.3 | 0.001 |
| M65:M30abc | 1.45 ± 0.44 | 0.80 ± 0.29 | 1.29 ± 0.50 | 2.04 ± 0.30 | 1.97 ± 0.33 | 2.01 ± 0.29 | 0.003 |
| Measures | Group 2c (1.45 ≤ FIB-4 ≤ 3.25), Gr. 2c) | Group 2d (FIB-4 > 3.25, Gr. 2d) | Between Group p-Value | ||||
|---|---|---|---|---|---|---|---|
| Males (n = 10; 71.4%) | Females (n = 4; 28.6%) | Total (n = 14; 51.9%) | Males (n = 9; 69.2%) | Females (n = 4; 30.7%) | Total (n = 13; 48.1%) | ||
| Liver Injury Markers | |||||||
| ALT(IU/L) | 68.40 ± 21.70 | 27.00 * | 61.50 ± 25.74 | 45.50 ± 19.02 | 63.00 * | 49.00 ± 18.23 | ns |
| AST (IU/L) | 29.60 ± 7.02 | 30.00 * | 29.67 ± 6.28 | 37.25 ± 5.85 | 39.00 * | 37.60 ± 5.13 | ns |
| AST: ALT a | 0.449 ± 0.094 | 1.111 * | 0.560 ± 0.283 | 0.904 ± 0.305 | 0.619 * | 0.847 ± 0.293 | ns |
| Candidate Cytokine Response | |||||||
| IL1β acd (pg/mL) | 0.521 ± 0.282 | 0.971 ± 1.184 | 0.659 ± 0.671 | 0.427 ± 0.140 | 1.612 ± 1.809 | 0.822 ± 1.116 | ns |
| IL6 a (pg/mL) | 2.380 ± 0.989 | 4.260 ± 2.333 | 2.958 ± 1.681 | 4.527 ± 3.144 | 3.591 ± 1.071 | 4.215 ± 2.611 | ns |
| TNFα (pg/mL) | 2.329 ± 0.685 | 1.715 ± 1.045 | 2.140 ± 0.820 | 2.245 ± 0.909 | 3.275 ± 0.779 | 2.589 ± 0.974 | ns |
| IL8 cd (pg/mL) | 3.132 ± 1.613 | 6.042 ± 8.021 | 4.027 ± 4.446 | 3.414 ± 1.463 | 4.975 ± 4.475 | 3.934 ± 2.723 | ns |
| Candidate Gut-dysfunction Markers | |||||||
| LPS d (EU/mL) | 0.063 ± 0.020 | 0.072 ± 0.020 | 0.065 ± 0.020 | 0.047 ± 0.020 | 0.085 ± 0.054 | 0.058 ± 0.036 | ns |
| LBP c (ng/mL) | 1641 ± 1574 | 2692 ± 3691 | 1883 ± 2084 | 2552 ± 4027 | 4570 ± 4297 | 3173 ± 4046 | 0.045 |
| CD14 bcd (×106 pg/mL) | 6455 ± 1666 | 9425 ± 1506 | 7304 ± 2094 | 6862 ± 1498 | 9457 ± 644 | 7661 ± 1776 | ns |
| Liver Cell Death Markers | |||||||
| K18M65 (IU/L) | 984.3 ± 2104.5 | 375.2 ± 357.9 | 810.3 ± 1782.5 | 435.1 ± 381.0 | 530.2 ± 379.7 | 464.3 ± 367.3 | ns |
| K18M30 c (IU/L) | 213.9 ± 58.8 | 353.6 ± 208.0 | 256.9 ± 132.8 | 252.2 ± 128.9 | 355.5 ± 154.0 | 284.0 ± 139.5 | ns |
| M65:M30 | 1.564 ± 0.401 | 1.142 ± 0.866 | 1.434 ± 0.580 | 1.541 ± 0.560 | 1.340 ± 0.507 | 1.479 ± 0.532 | ns |
| Measures | Group 2a (Improved K18M65, Gr. 2a) | Group 2b (Elevated K18M65, Gr. 2b) | Between Group p-Value | ||||
|---|---|---|---|---|---|---|---|
| Males (n = 15; 75%) | Females (n = 5; 25%) | Total (n = 20; 74.1%) | Males (n = 4; 57.1%) | Females (n = 3; 42.9%) | Total (n = 7; 25.9%) | ||
| Age (years) | 47.5 ± 7.2 | 42.9 ± 12.0 | 46.34 ± 8.51 | 48.91 ± 6.93 | 49.76 ± 14.98 | 49.27 ± 9.95 | ns |
| BMI (kg/m2) | 24.8 ± 3.2 | 25.8 ± 2.6 | 25.05 ± 2.99 | 25.35 ± 2.44 | 25.20 ± 6.00 | 25.29 ± 3.87 | ns |
| Drinking History | |||||||
| TD90 | 1059 ± 478 | 911.4 ± 695.7 | 1022 ± 523 | 1226 ± 549 | 1317 ± 271 | 1256 ± 444 | ns |
| HDD90 | 71.87 ± 23.08 | 75.80 ± 19.49 | 72.85 ± 21.80 | 85.50 ± 4.65 | 86.50 ± 4.95 | 85.83 ± 4.26 | ns |
| AvgDPD90 | 14.96 ± 5.66 | 11.10 ± 7.14 | 13.99 ± 6.11 | 13.68 ± 6.19 | 15.33 ± 4.01 | 14.23 ± 5.19 | ns |
| NDD90 | 72.93 ± 21.68 | 78.20 ± 16.39 | 74.25 + 20.21 | 89.75 ± 0.50 | 86.50 ± 4.95 | 88.67 ± 2.80 | ns |
| LTDH c | 23.13 ± 9.57 | 9.40 ± 7.54 | 19.70 + 10.80 | 15.75 ± 11.50 | 18.33 ± 6.66 | 16.86 ± 9.10 | ns |
| Liver Injury Markers | |||||||
| ALT(IU/L) | 103.8 ± 37.9 | 113.4 ± 112.6 | 106.2 + 61.9 | 82.25 ± 38.20 | 106.0 ± 106.1 | 92.43 ± 68.13 | ns |
| AST (IU/L) | 146.6 ± 89.2 | 154.2 ± 123.4 | 148.5 + 95.3 | 117.0 ± 47.2 | 223.0 ± 165.5 | 162.4 ± 116.0 | ns |
| AST: ALT | 1.35 ± 0.45 | 1.53 ± 0.63 | 1.40 + 0.49 | 1.70 ± 0.93 | 2.43 ± 1.03 | 2.01 ± 0.97 | 0.037 |
| Nutritional Status | |||||||
| CONUT | 1.27 ± 1.16 | 1.00 ± 0.71 | 1.20 + 1.06 | 2.00 ± 2.45 | 0.33 ± 0.58 | 1.29 ± 1.98 | ns |
| Blood Cell Measures | |||||||
| WBC c (K/uL) | 4.72 + 1.34 | 6.65 ± 0.95 | 5.20 + 1.50 | 5.81 ± 2.26 | 7.61 ± 3.12 | 6.58 ± 2.59 | ns |
| AMC (K/uL) | 0.398 ± 0.141 | 0.503 + 0.098 | 0.424 + 0.137 | 0.630 ± 0.403 | 0.468 ± 0.043 | 0.560 ± 0.299 | ns |
| ANC (K/uL) | 2.82 + 1.14 | 4.02 + 1.04 | 3.12 ± 1.21 | 3.43 ± 1.65 | 4.36 ± 1.92 | 4.07 ± 2.30 | ns |
| Candidate Cytokine Response | |||||||
| IL1β (pg/mL) | 0.565 ± 0.281 | 0.564 ± 0.759 | 0.565 ± 0.437 | 0.373 ± 0.333 | 0.406 ± 0.269 | 0.387 ± 0.283 | ns |
| IL6 ac (pg/mL) | 2.45 ± 1.07 | 5.31 + 2.73 | 3.24 + 2.07 | 5.55 ± 5.30 | 8.78 ± 6.59 | 6.93 ± 5.61 | 0.022 |
| TNFα (pg/mL) | 1.88 + 0.57 | 2.30 + 1.69 | 2.00 ± 0.97 | 1.98 ± 0.24 | 2.54 ± 1.29 | 2.22 ± 0.82 | ns |
| IL8 a (pg/mL) | 4.63 + 2.28 | 7.18 + 6.47 | 5.34 ± 3.86 | 8.55 ± 5.42 | 23.75 ± 30.54 | 15.07 ± 19.79 | ns |
| Candidate Gut-dysfunction Markers | |||||||
| LPS (EU/mL) | 0.121 ± 0.067 | 0.134 ± 0.070 | 0.124 ± 0.066 | 0.089 ± 0.060 | 0.075 ± 0.022 | 0.083 ± 0.045 | ns |
| LBP (ng/mL) | 2174 ± 2915 | 3140 ± 5347 | 2389 ± 3423 | 2576 ± 2681 | 1308 ± 343 | 2023 ± 2023 | ns |
| CD14 bc (×106 pg/mL) | 9434 ± 1811 | 11218 ± 552 | 9980 ± 1763 | 8312 ± 2759 | 9373 ± 867 | 8767 ± 2092 | ns |
| Liver Cell Death Markers | |||||||
| K18M65 (IU/L) | 1118 ± 1131 | 913.7 ± 1208.8 | 1067 ± 1121 | 1105 ± 502 | 1250 ± 411 | 1167 ± 434 | ns |
| K18M30 (IU/L) | 423.8 ± 420.1 | 535.8 ± 438.9 | 451.8 ± 416.0 | 347.1 ± 162.7 | 480.9 ± 79.4 | 404.4 ± 143.0 | ns |
| M65:M30 | 2.53 ± 1.42 | 1.49 ± 0.67 | 2.27 ± 1.34 | 3.50 ± 2.01 | 2.57 ± 0.47 | 3.10 ± 1.53 | ns |
Publisher’s Note: MDPI stays neutral with regard to jurisdictional claims in published maps and institutional affiliations. |
© 2022 by the authors. Licensee MDPI, Basel, Switzerland. This article is an open access article distributed under the terms and conditions of the Creative Commons Attribution (CC BY) license (https://creativecommons.org/licenses/by/4.0/).
Share and Cite
Sagaram, M.; Parthasarathy, R.; Condon, S.L.; Closson, C.F.; Kong, M.; Schwandt, M.L.; Jophlin, L.L.; Feng, W.; Barve, A.J.; Vatsalya, V. Theragnostic Efficacy of K18 Response in Alcohol Use Disorder with Clinically Significant Fibrosis Using Gut-Liver Axis. Int. J. Mol. Sci. 2022, 23, 5852. https://0-doi-org.brum.beds.ac.uk/10.3390/ijms23105852
Sagaram M, Parthasarathy R, Condon SL, Closson CF, Kong M, Schwandt ML, Jophlin LL, Feng W, Barve AJ, Vatsalya V. Theragnostic Efficacy of K18 Response in Alcohol Use Disorder with Clinically Significant Fibrosis Using Gut-Liver Axis. International Journal of Molecular Sciences. 2022; 23(10):5852. https://0-doi-org.brum.beds.ac.uk/10.3390/ijms23105852
Chicago/Turabian StyleSagaram, Manasa, Ranganathan Parthasarathy, Sally L. Condon, Charles F. Closson, Maiying Kong, Melanie L. Schwandt, Loretta L. Jophlin, Wenke Feng, Ashutosh J. Barve, and Vatsalya Vatsalya. 2022. "Theragnostic Efficacy of K18 Response in Alcohol Use Disorder with Clinically Significant Fibrosis Using Gut-Liver Axis" International Journal of Molecular Sciences 23, no. 10: 5852. https://0-doi-org.brum.beds.ac.uk/10.3390/ijms23105852