
ORAI1-Regulated Gene Expression in Breast Cancer Cells: Roles for STIM1 Binding, Calcium Influx and Transcription Factor Translocation

 , , , , and
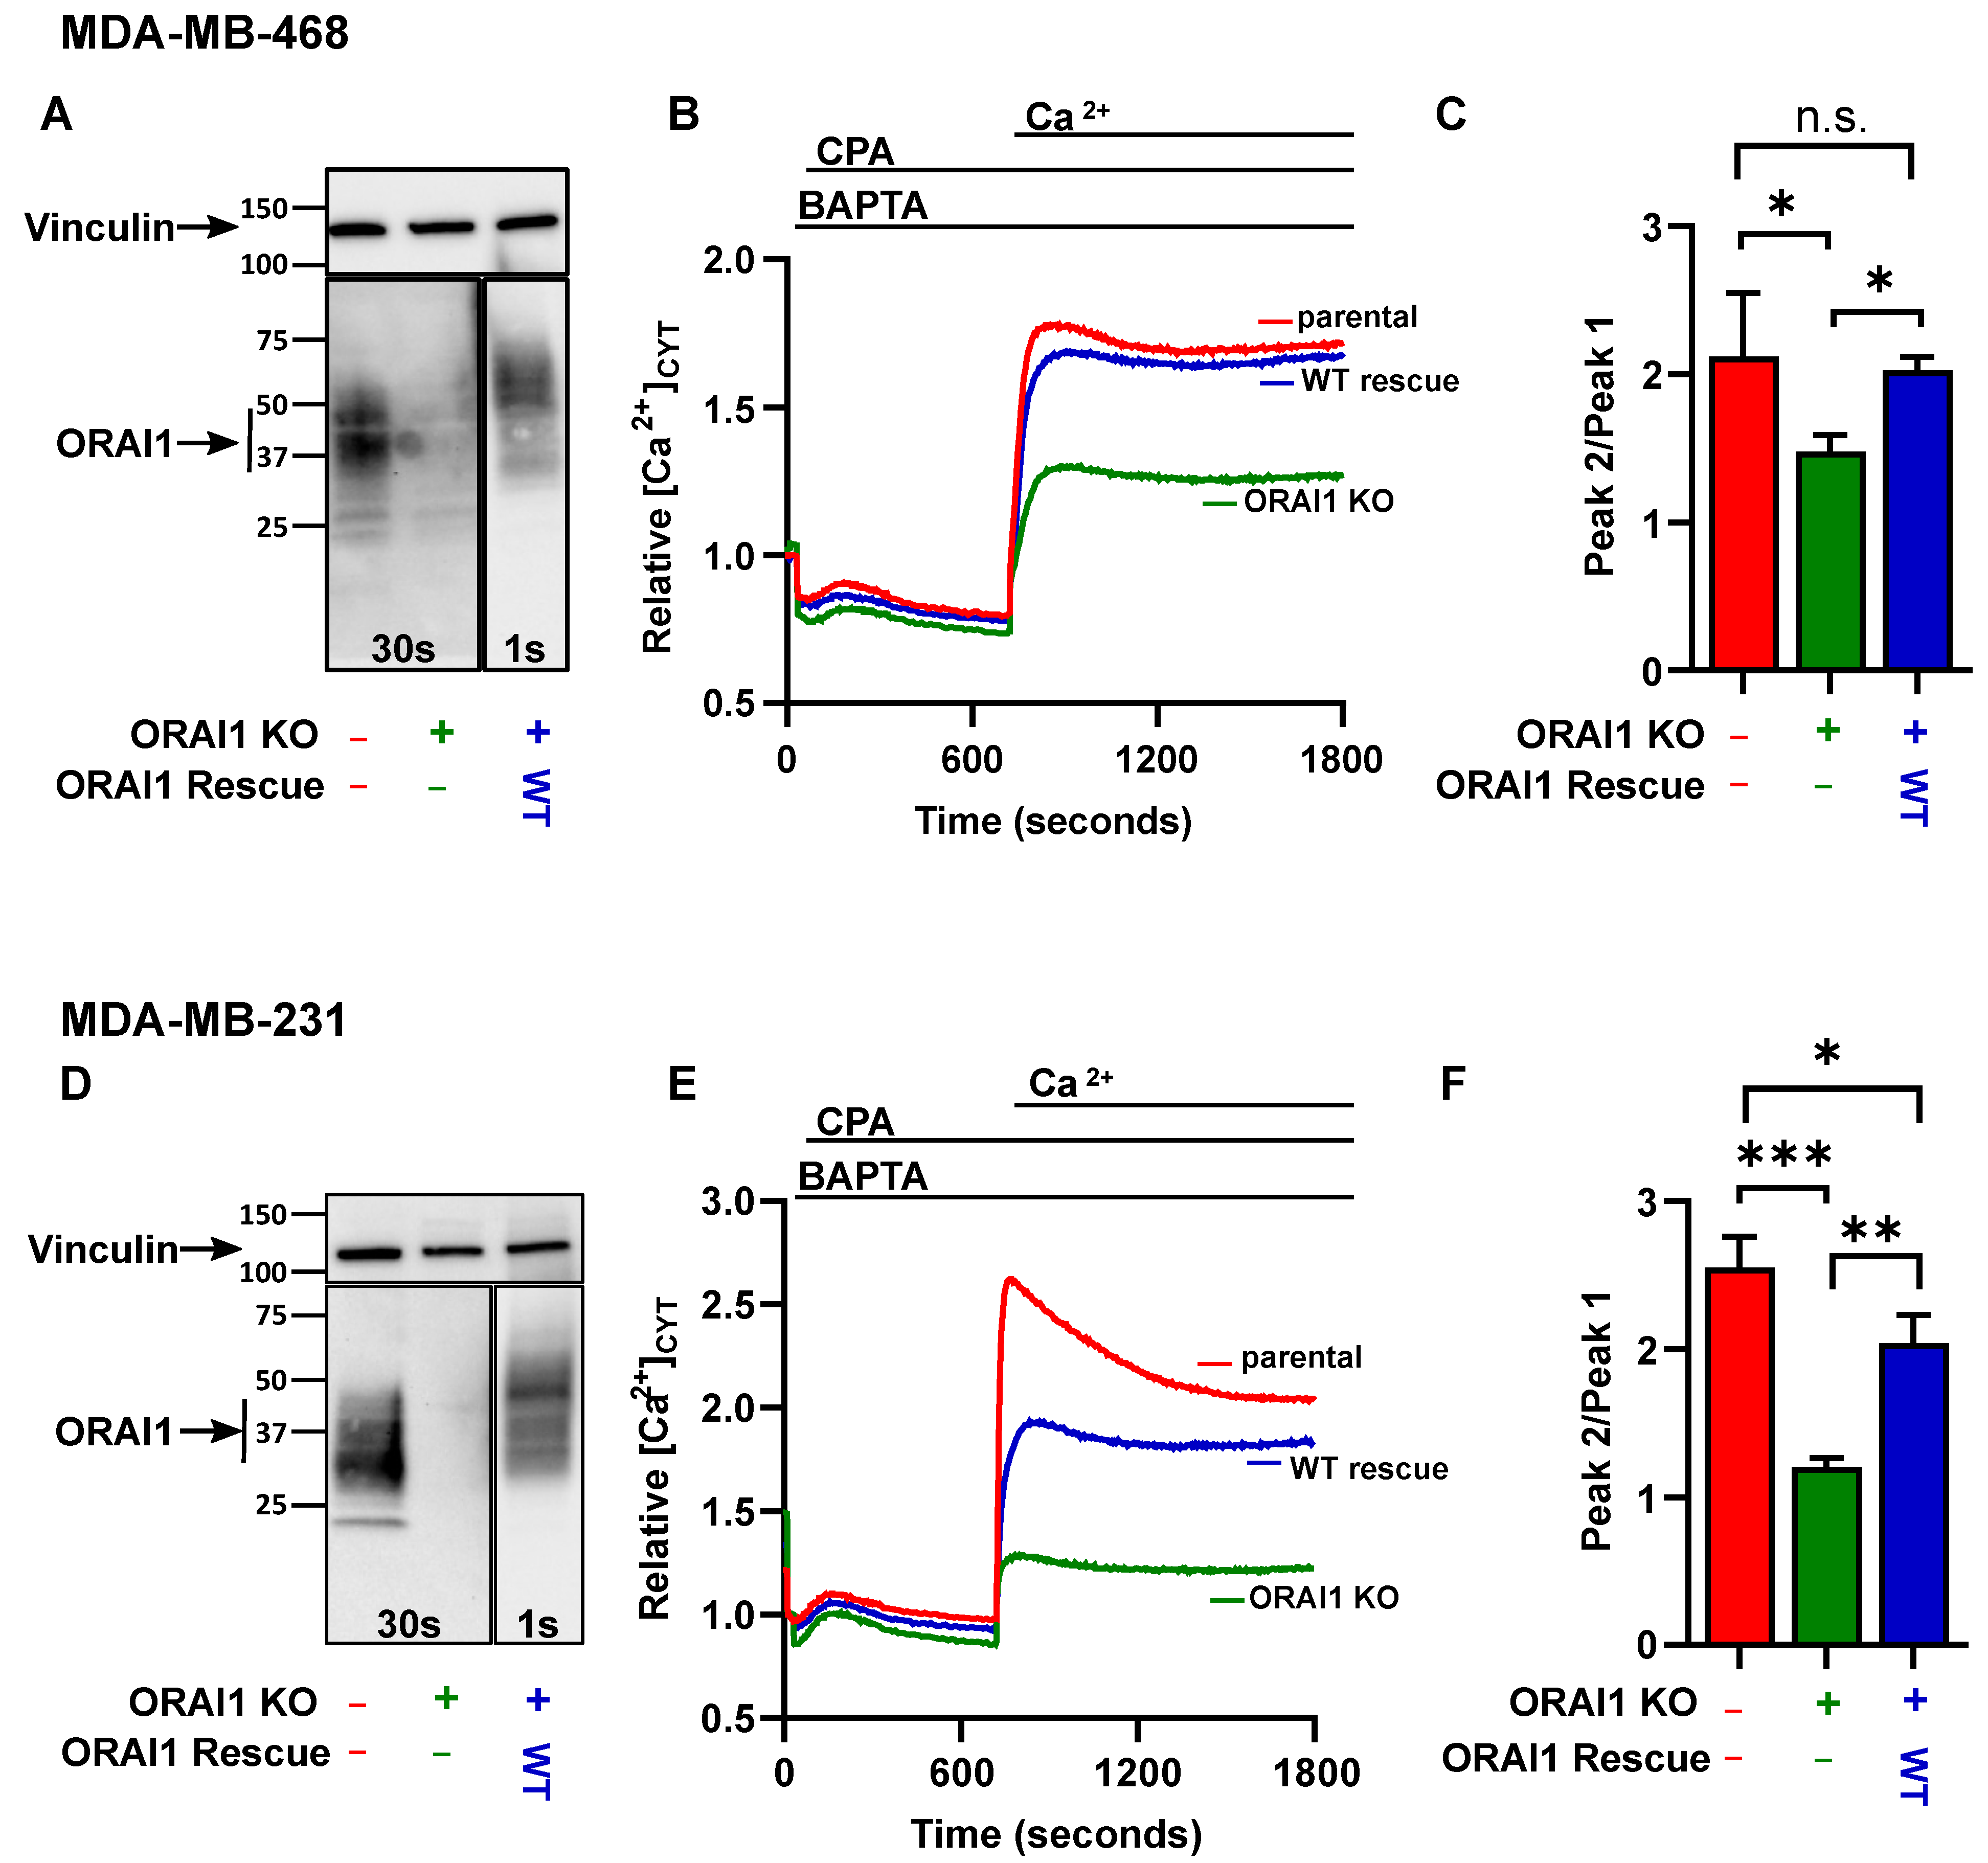
Abstract
:1. Introduction
2. Results
2.1. Validation of ORAI1 Knockout and Rescue Wild-Type in Basal Breast Cancer Cell Lines
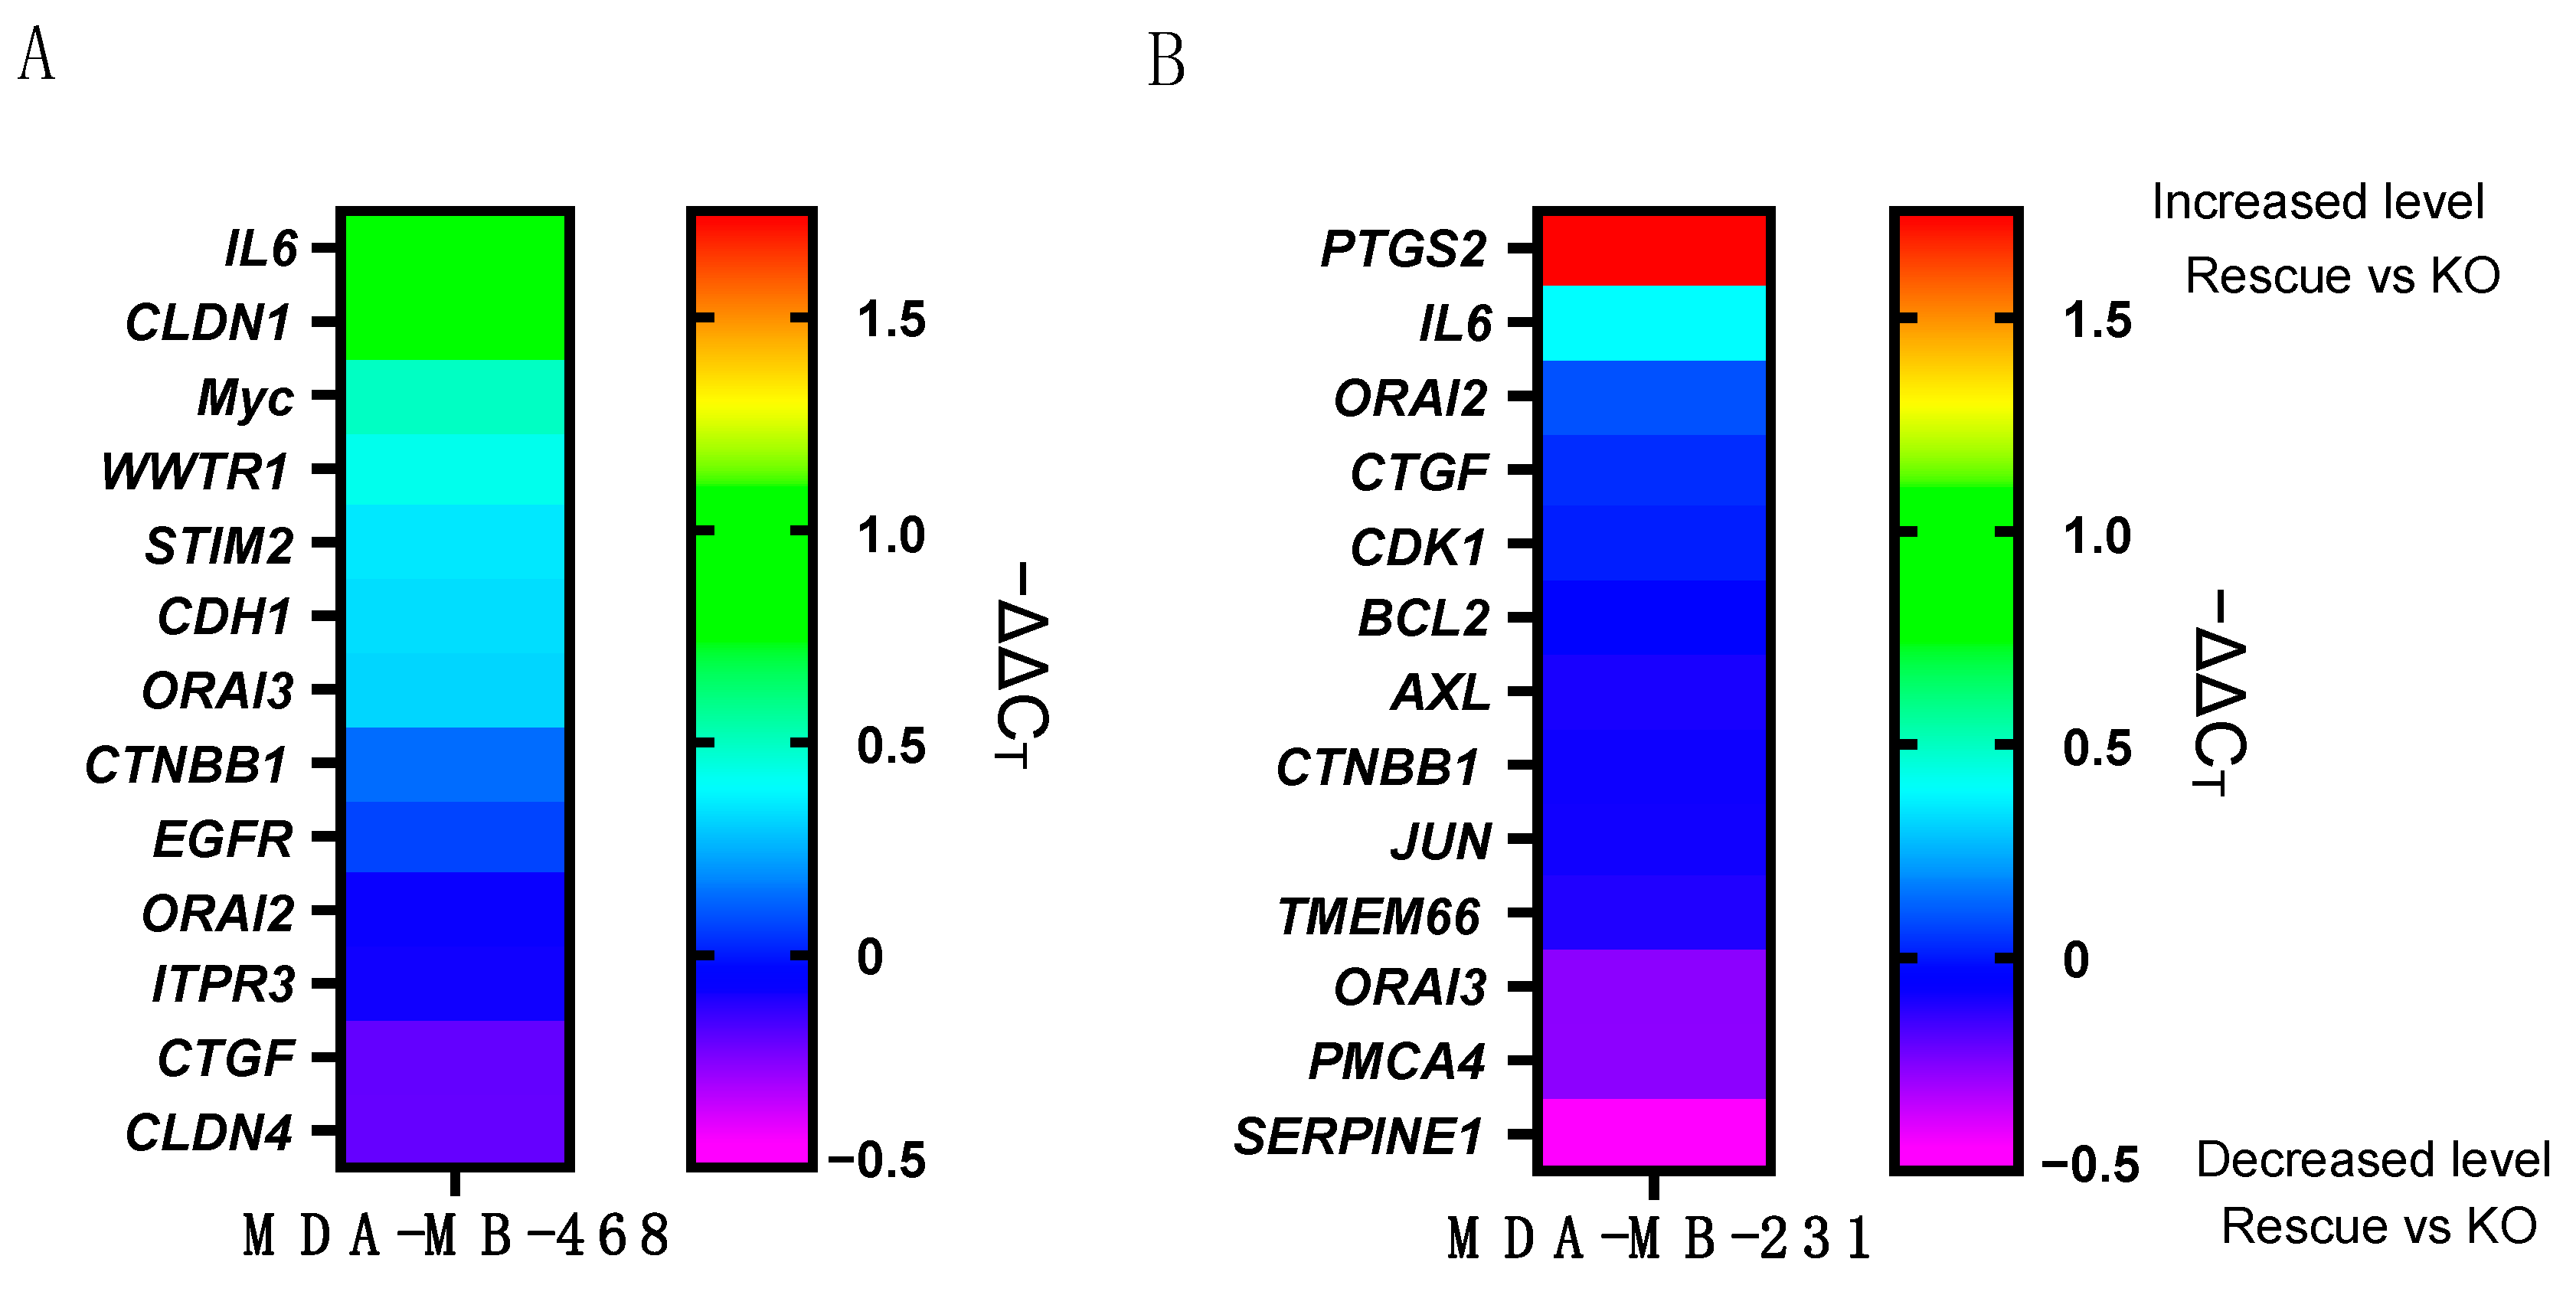
2.2. ORAI1 Differentially Regulates Basal Gene Expression in MDA-MB-468 and MDA-MB-231 Cells
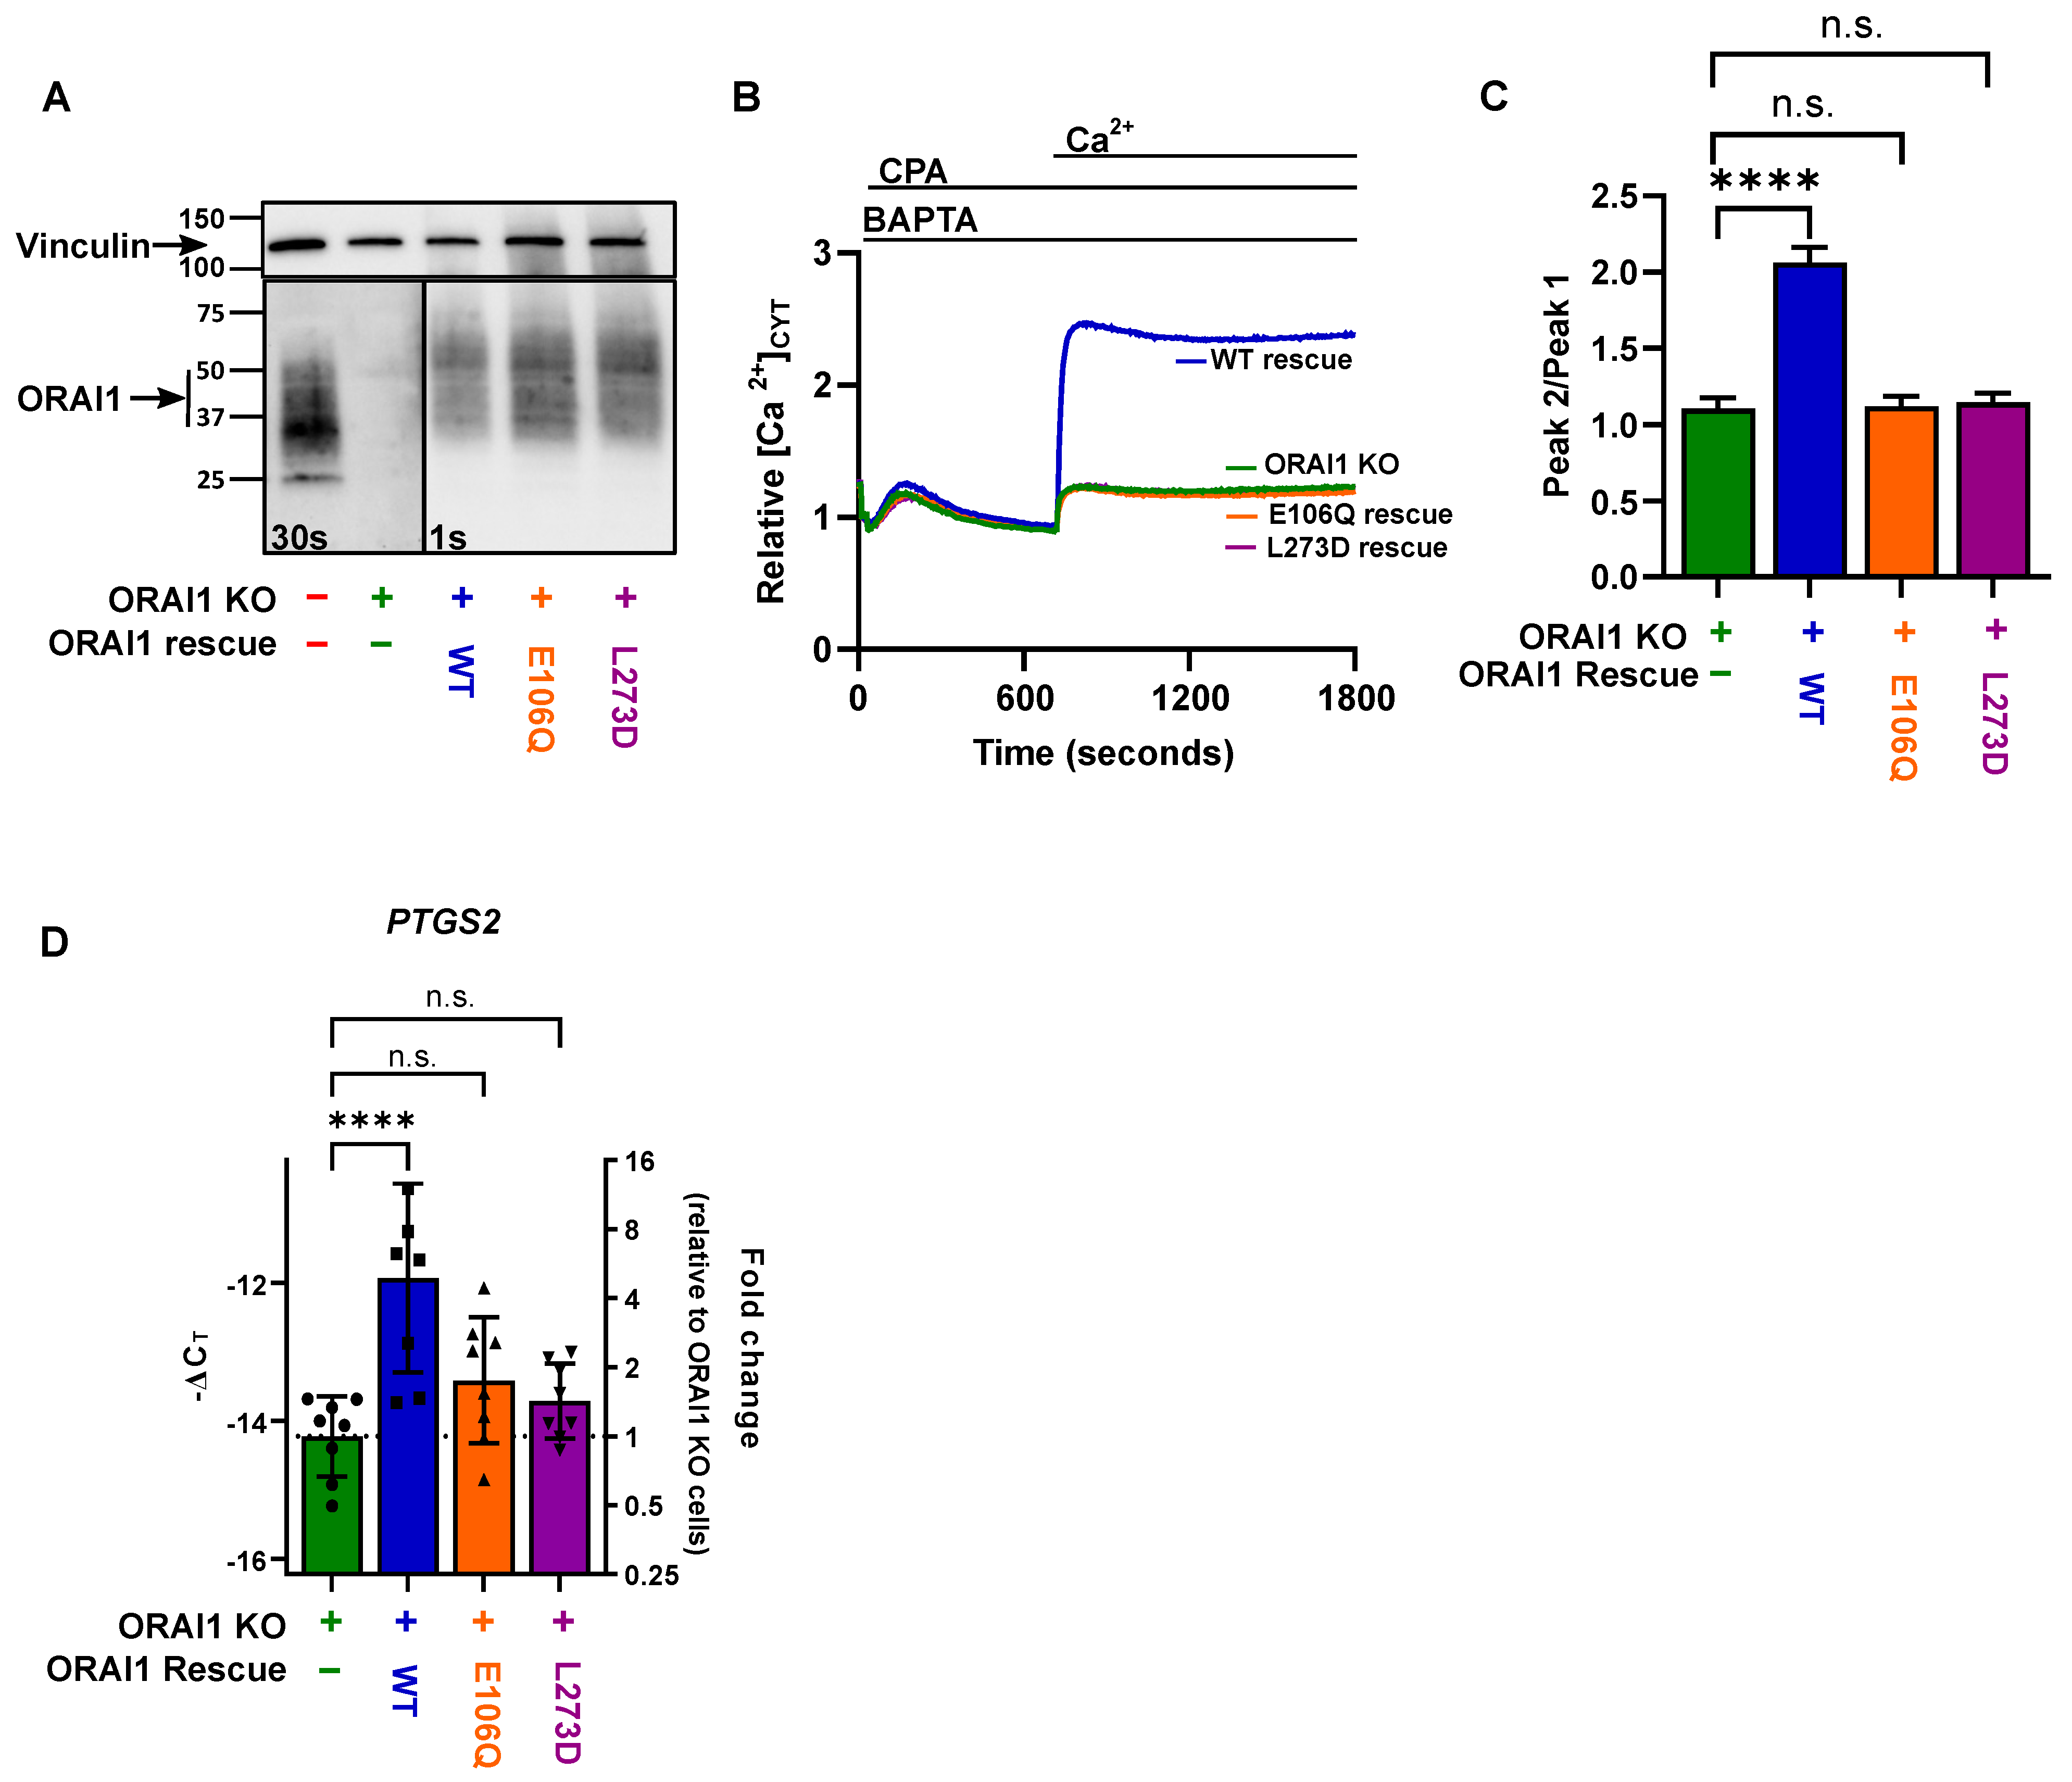
2.3. PTGS2 Gene Expression Regulation by ORAI1 in MDA-MB-231 Is Dependent on STIM1 Activation and Calcium Influx
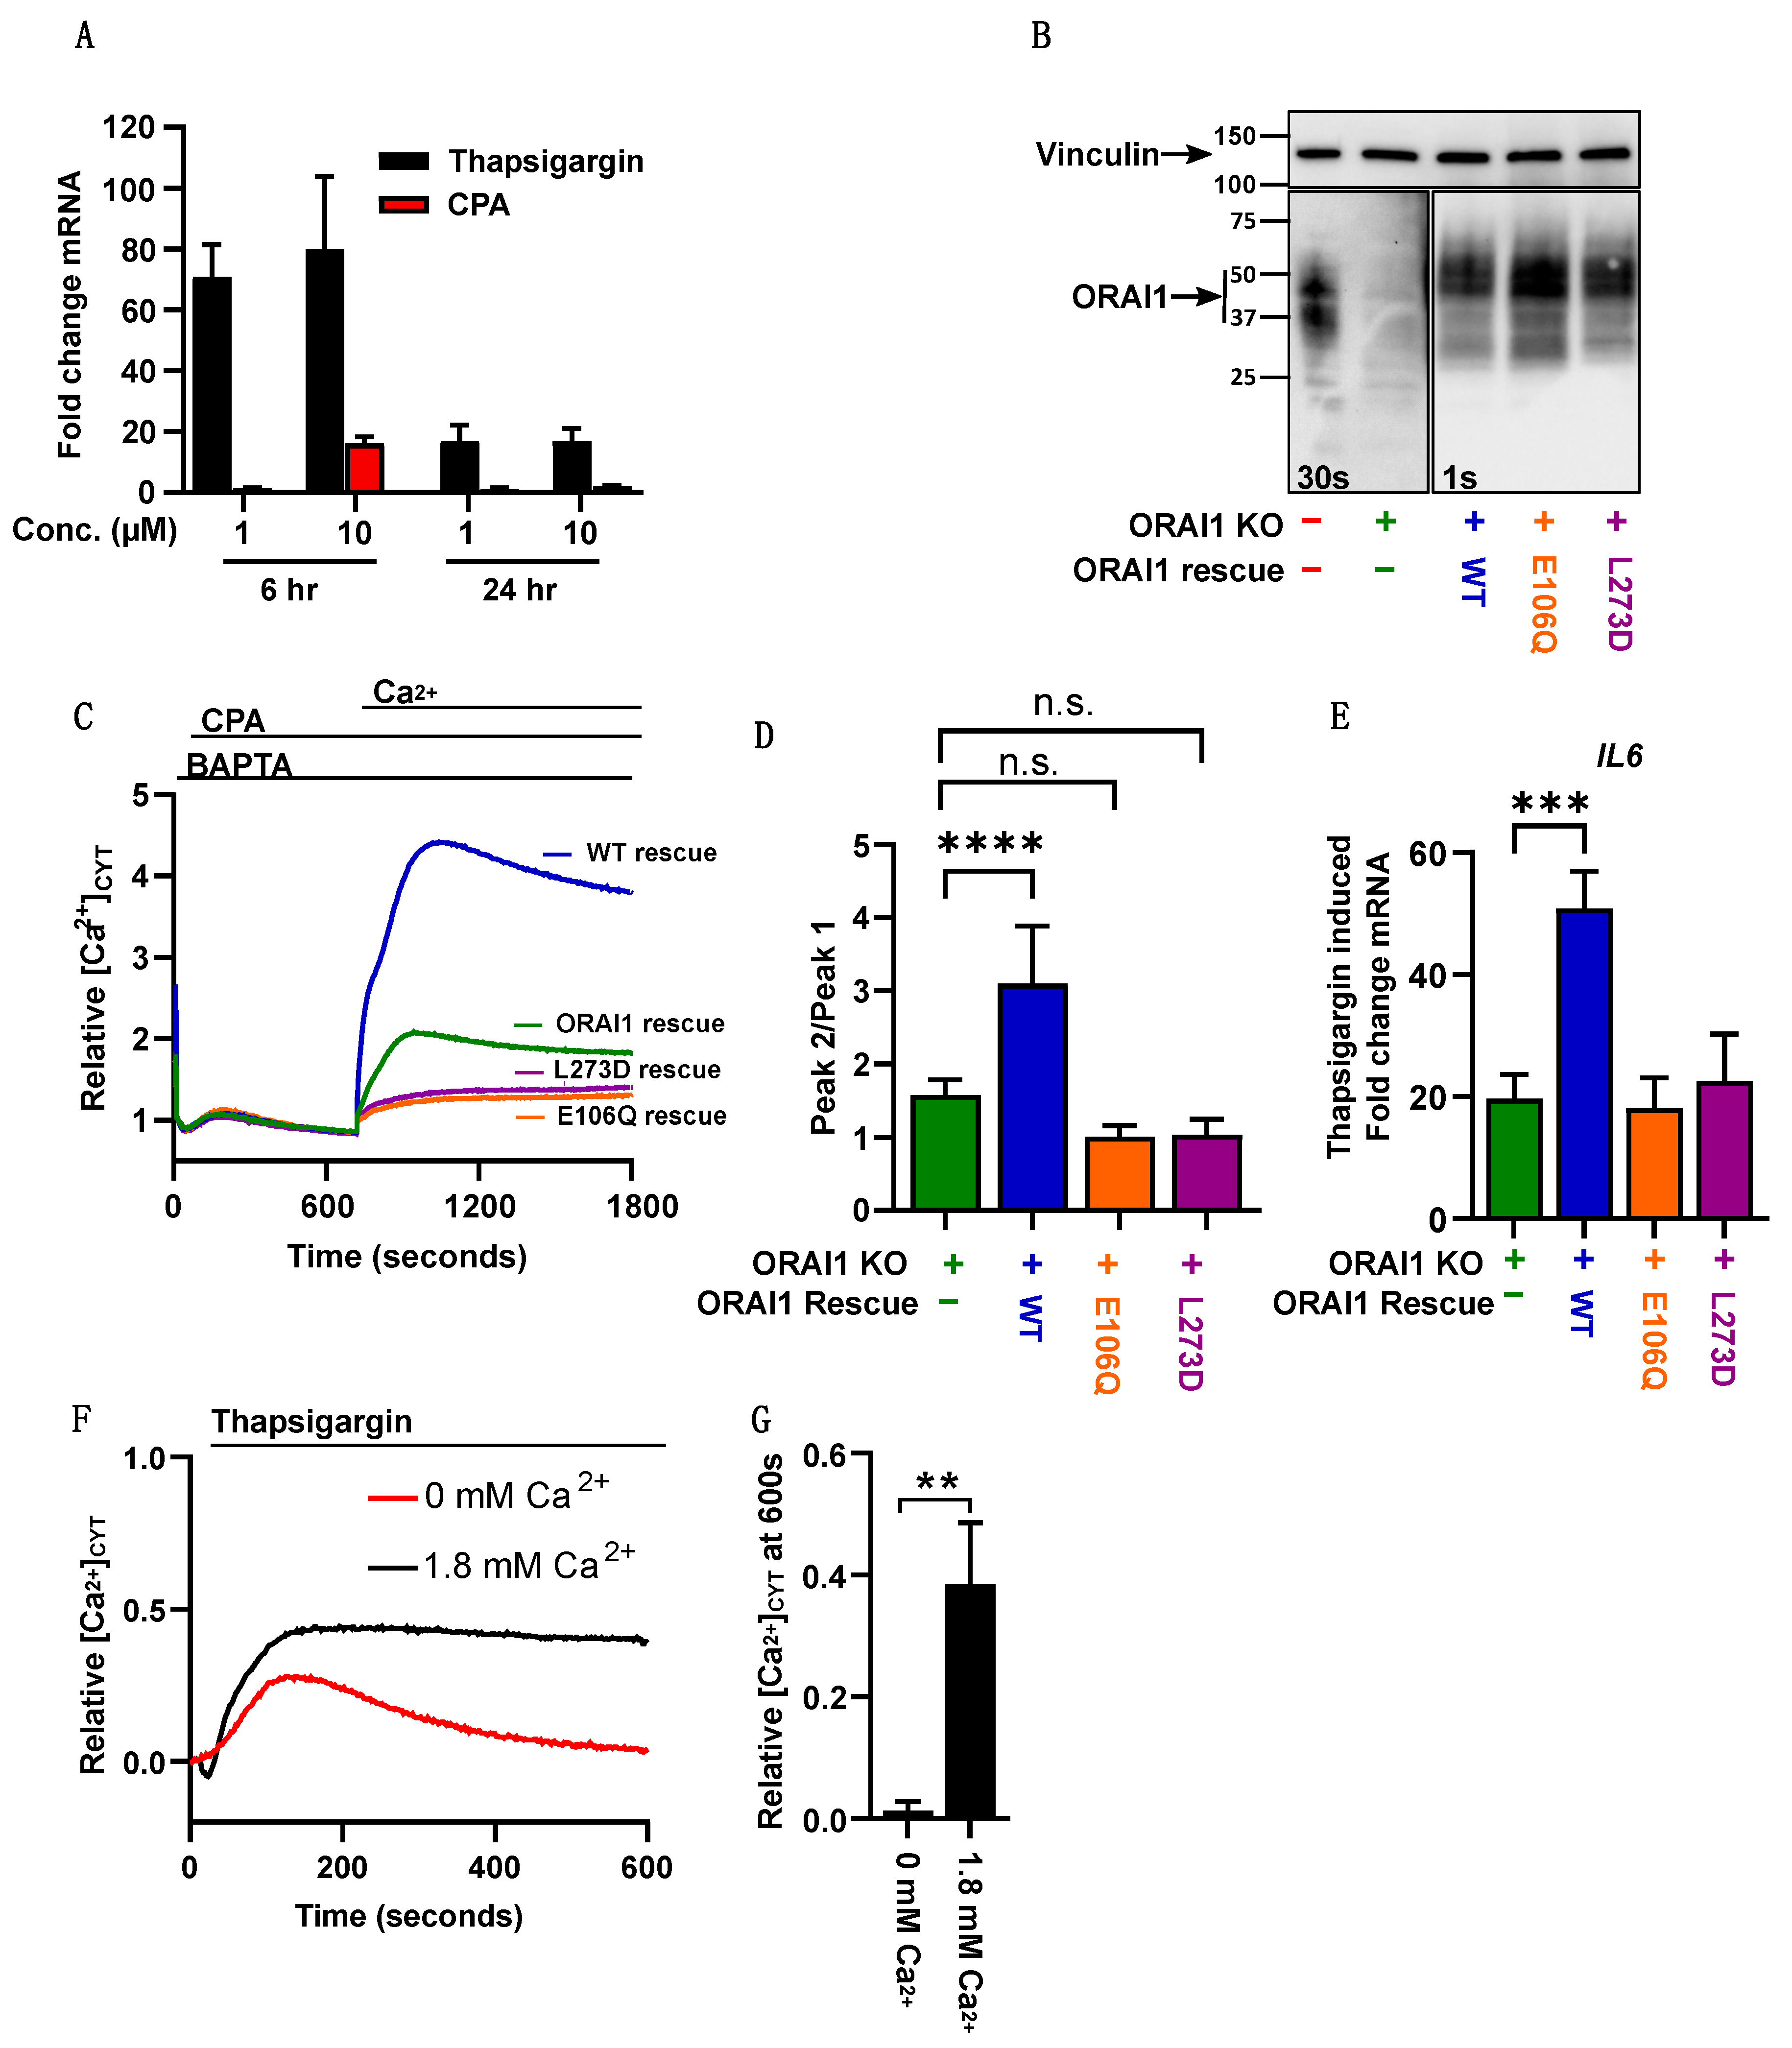
2.4. Thapsigargin-Mediated Calcium Store Depletion Increases IL6 mRNA Levels in MDA-MB-468 Cells and Is Dependent on STIM1-Mediated Ca2+ Influx
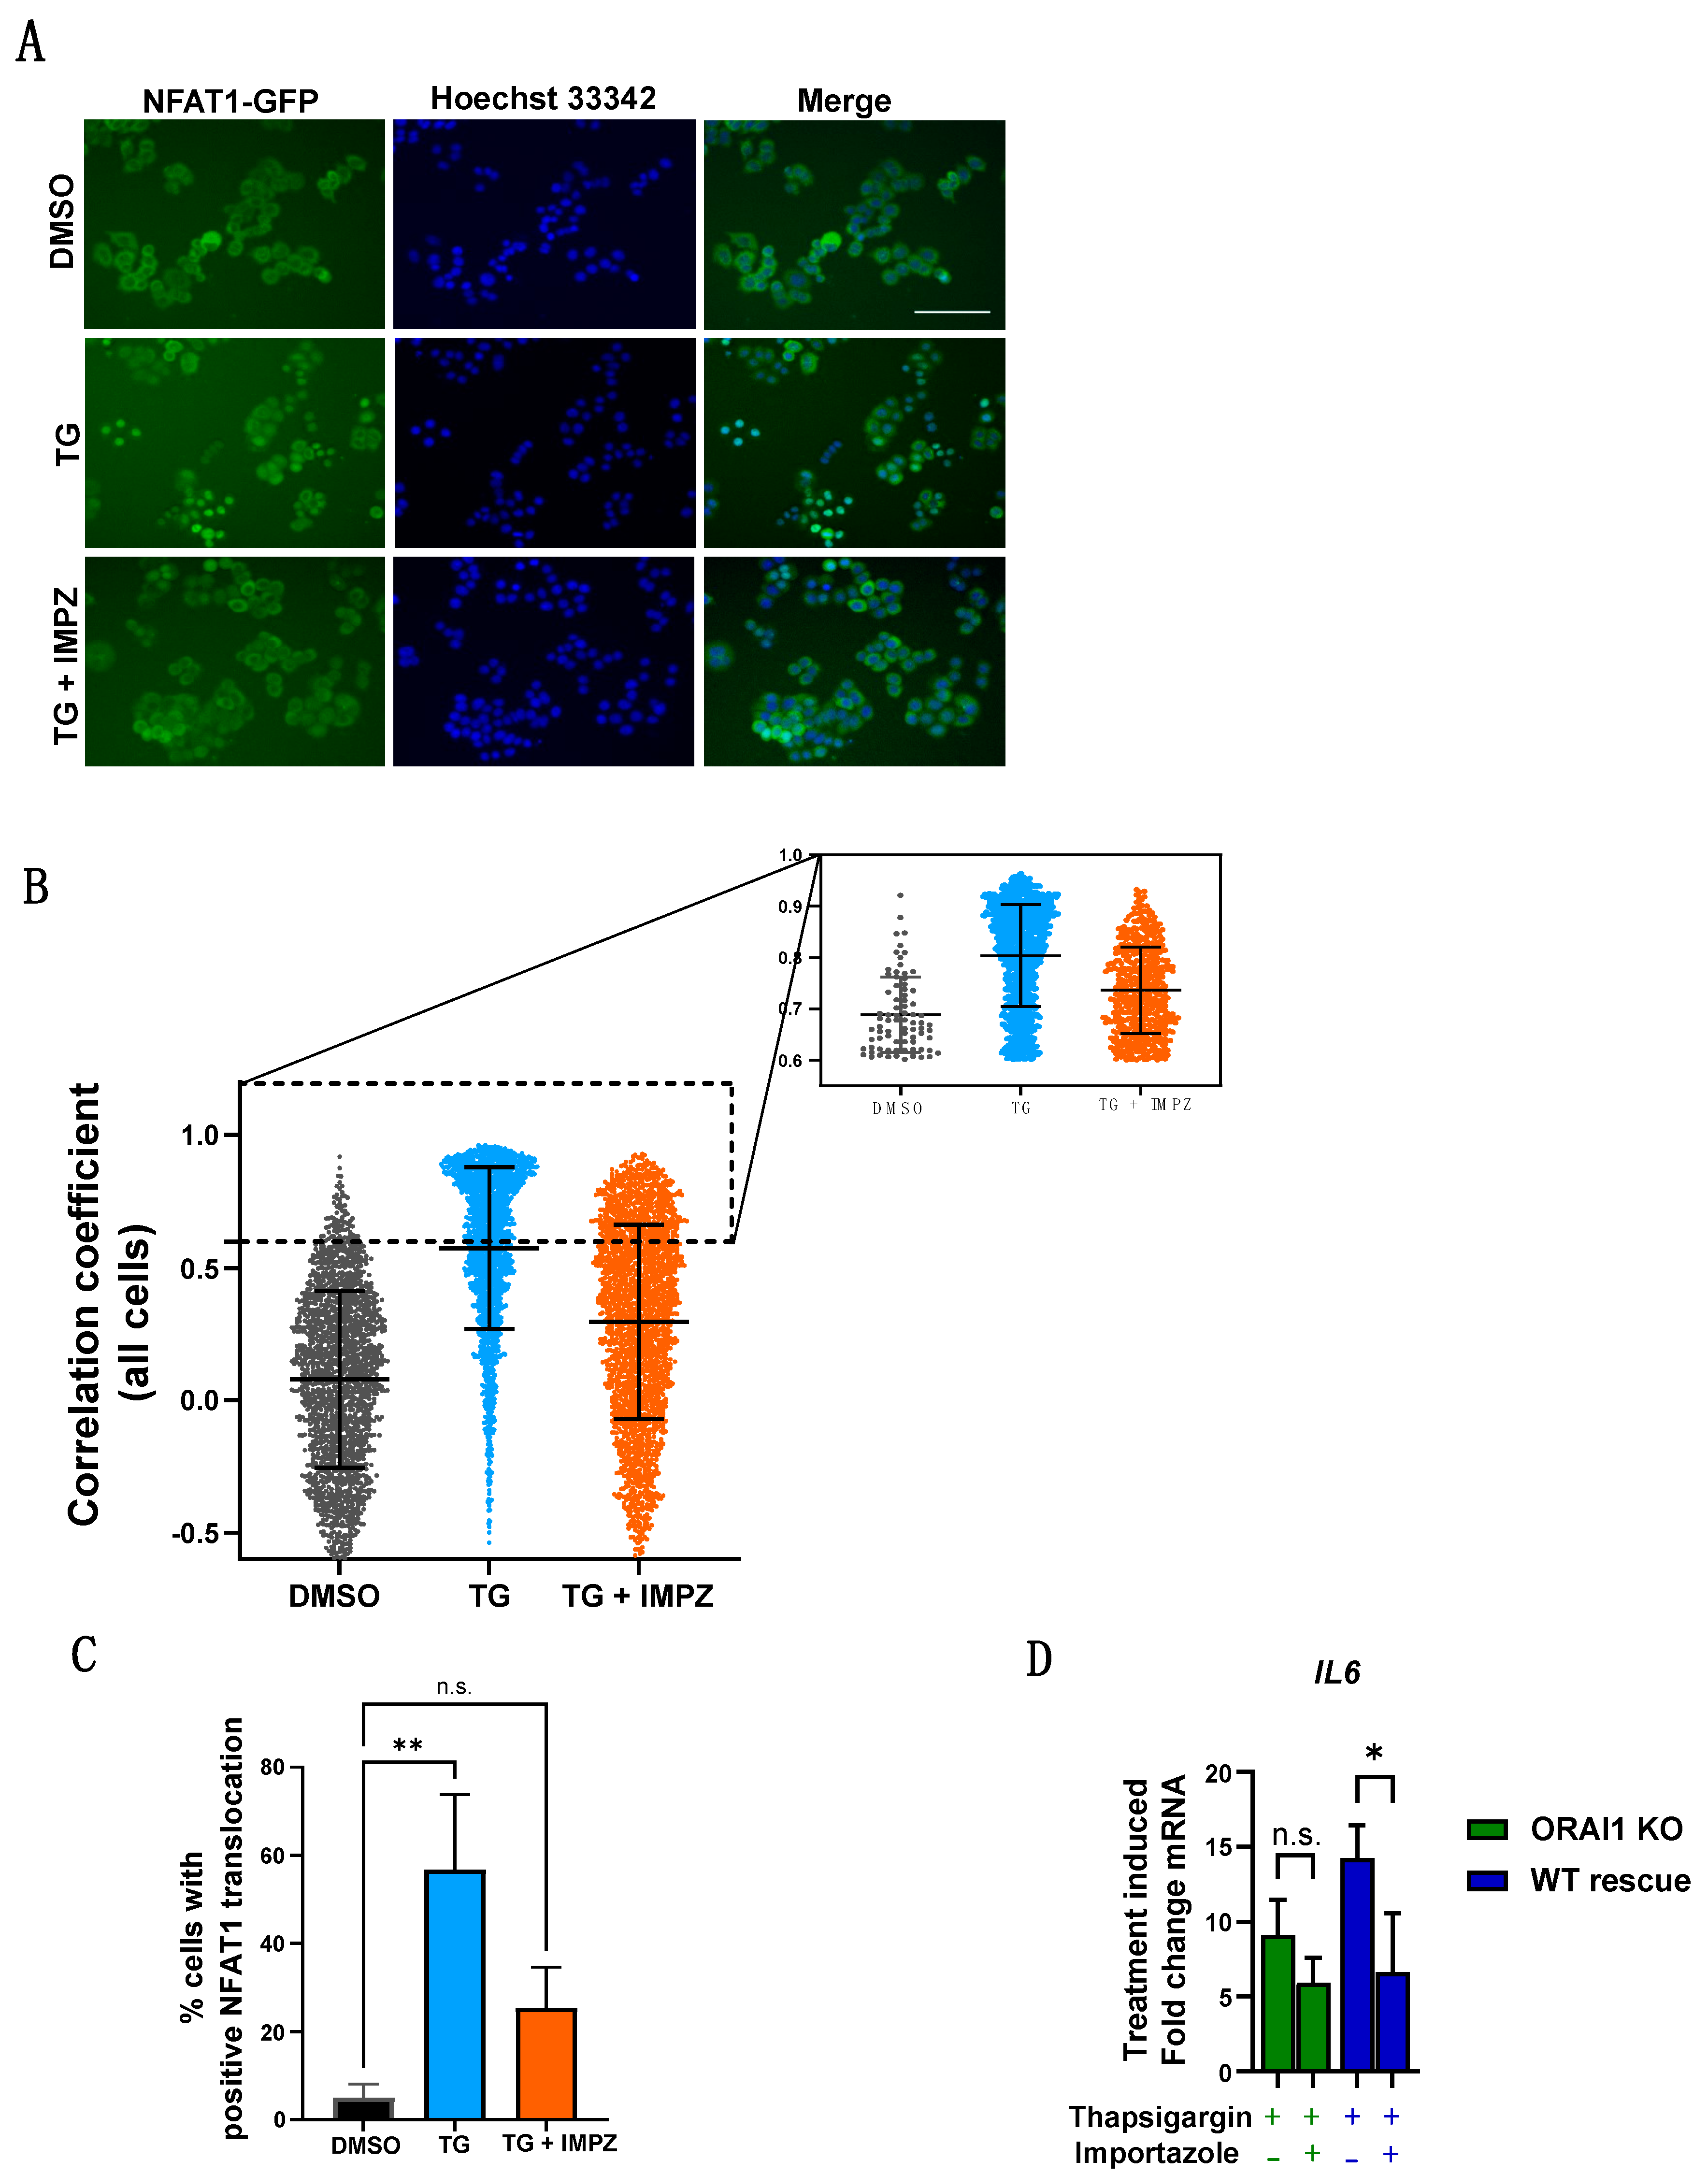
2.5. Blocking Importin-β Function Is Sufficient to Inhibit ORAI1-Dependent Thapsigargin Induction of IL6
3. Discussion
4. Materials and Methods
4.1. Plasmids
4.2. Cell Culture
4.3. Generation of Cell Lines
4.4. Immunoblotting
4.5. Measurement of Intracellular Calcium
4.6. mRNA Isolation and RT-qPCR
4.7. High Content Imaging and NFAT Nuclear Translocation
4.8. Statistical Analysis
5. Conclusions
Supplementary Materials
Author Contributions
Funding
Data Availability Statement
Conflicts of Interest
References
- Monteith, G.R.; Prevarskaya, N.; Roberts-Thomson, S.J. The calcium-cancer signalling nexus. Nat. Rev. Cancer 2017, 17, 367–380. [Google Scholar] [CrossRef] [PubMed] [Green Version]
- Roberts-Thomson, S.J.; Chalmers, S.B.; Monteith, G.R. The Calcium-Signaling Toolkit in Cancer: Remodeling and Targeting. Cold Spring Harb. Perspect. Biol. 2019, 11, a035204. [Google Scholar] [CrossRef] [PubMed] [Green Version]
- Azimi, I.; Milevskiy, M.J.G.; Chalmers, S.B.; Yapa, K.; Robitaille, M.; Henry, C.; Baillie, G.J.; Thompson, E.W.; Roberts-Thomson, S.J.; Monteith, G.R. ORAI1 and ORAI3 in Breast Cancer Molecular Subtypes and the Identification of ORAI3 as a Hypoxia Sensitive Gene and a Regulator of Hypoxia Responses. Cancers 2019, 11, 208. [Google Scholar] [CrossRef] [PubMed] [Green Version]
- Yang, S.; Zhang, J.J.; Huang, X.Y. Orai1 and STIM1 are critical for breast tumor cell migration and metastasis. Cancer Cell 2009, 15, 124–134. [Google Scholar] [CrossRef] [Green Version]
- Luik, R.M.; Wang, B.; Prakriya, M.; Wu, M.M.; Lewis, R.S. Oligomerization of STIM1 couples ER calcium depletion to CRAC channel activation. Nature 2008, 454, 538–542. [Google Scholar] [CrossRef]
- Lin, Y.P.; Bakowski, D.; Mirams, G.R.; Parekh, A.B. Selective recruitment of different Ca(2+)-dependent transcription factors by STIM1-Orai1 channel clusters. Nat. Commun. 2019, 10, 2516. [Google Scholar] [CrossRef]
- Simo-Cheyou, E.R.; Tan, J.J.; Grygorczyk, R.; Srivastava, A.K. STIM-1 and ORAI-1 channel mediate angiotensin-II-induced expression of Egr-1 in vascular smooth muscle cells. J. Cell Physiol. 2017, 232, 3496–3509. [Google Scholar] [CrossRef]
- Liu, X.; Berry, C.T.; Ruthel, G.; Madara, J.J.; MacGillivray, K.; Gray, C.M.; Madge, L.A.; McCorkell, K.A.; Beiting, D.P.; Hershberg, U.; et al. T Cell Receptor-induced Nuclear Factor kappaB (NF-kappaB) Signaling and Transcriptional Activation Are Regulated by STIM1- and Orai1-mediated Calcium Entry. J. Biol. Chem. 2016, 291, 8440–8452. [Google Scholar] [CrossRef] [Green Version]
- Ng, S.W.; Nelson, C.; Parekh, A.B. Coupling of Ca(2+) microdomains to spatially and temporally distinct cellular responses by the tyrosine kinase Syk. J. Biol. Chem. 2009, 284, 24767–24772. [Google Scholar] [CrossRef] [Green Version]
- Chamlali, M.; Rodat-Despoix, L.; Ouadid-Ahidouch, H. Store-Independent Calcium Entry and Related Signaling Pathways in Breast Cancer. Genes 2021, 12, 994. [Google Scholar] [CrossRef]
- Feng, M.; Grice, D.M.; Faddy, H.M.; Nguyen, N.; Leitch, S.; Wang, Y.; Muend, S.; Kenny, P.A.; Sukumar, S.; Roberts-Thomson, S.J.; et al. Store-independent activation of Orai1 by SPCA2 in mammary tumors. Cell 2010, 143, 84–98. [Google Scholar] [CrossRef] [PubMed] [Green Version]
- Mignen, O.; Thompson, J.L.; Shuttleworth, T.J. The molecular architecture of the arachidonate-regulated Ca2+-selective ARC channel is a pentameric assembly of Orai1 and Orai3 subunits. J. Physiol. 2009, 587 Pt 17, 4181–4197. [Google Scholar] [CrossRef] [PubMed]
- Thompson, J.L.; Shuttleworth, T.J. Molecular basis of activation of the arachidonate-regulated Ca2+ (ARC) channel, a store-independent Orai channel, by plasma membrane STIM1. J. Physiol. 2013, 591, 3507–3523. [Google Scholar] [CrossRef] [PubMed]
- Mignen, O.; Thompson, J.L.; Shuttleworth, T.J. Both Orai1 and Orai3 are essential components of the arachidonate-regulated Ca2+-selective (ARC) channels. J. Physiol. 2008, 586, 185–195. [Google Scholar] [CrossRef] [PubMed]
- Dubois, C.; Vanden Abeele, F.; Lehen’kyi, V.; Gkika, D.; Guarmit, B.; Lepage, G.; Slomianny, C.; Borowiec, A.S.; Bidaux, G.; Benahmed, M.; et al. Remodeling of channel-forming ORAI proteins determines an oncogenic switch in prostate cancer. Cancer Cell 2014, 26, 19–32. [Google Scholar] [CrossRef] [Green Version]
- Latour, S.; Mahouche, I.; Cherrier, F.; Azzi-Martin, L.; Velasco, V.; Soubeyran, P.; Merlio, J.P.; Poglio, S.; Bresson-Bepoldin, L. Calcium Independent Effect of Orai1 and STIM1 in Non-Hodgkin B Cell Lymphoma Dissemination. Cancers 2018, 10, 402. [Google Scholar] [CrossRef] [Green Version]
- McAndrew, D.; Grice, D.M.; Peters, A.A.; Davis, F.M.; Stewart, T.; Rice, M.; Smart, C.E.; Brown, M.A.; Kenny, P.A.; Roberts-Thomson, S.J.; et al. ORAI1-mediated calcium influx in lactation and in breast cancer. Mol. Cancer Ther. 2011, 10, 448–460. [Google Scholar] [CrossRef] [Green Version]
- Azimi, I.; Bong, A.H.; Poo, G.X.H.; Armitage, K.; Lok, D.; Roberts-Thomson, S.J.; Monteith, G.R. Pharmacological inhibition of store-operated calcium entry in MDA-MB-468 basal A breast cancer cells: Consequences on calcium signalling, cell migration and proliferation. Cell Mol. Life Sci. 2018, 75, 4525–4537. [Google Scholar] [CrossRef]
- Neve, R.M.; Chin, K.; Fridlyand, J.; Yeh, J.; Baehner, F.L.; Fevr, T.; Clark, L.; Bayani, N.; Coppe, J.P.; Tong, F.; et al. A collection of breast cancer cell lines for the study of functionally distinct cancer subtypes. Cancer Cell 2006, 10, 515–527. [Google Scholar] [CrossRef] [Green Version]
- Lehmann, B.D.; Bauer, J.A.; Chen, X.; Sanders, M.E.; Chakravarthy, A.B.; Shyr, Y.; Pietenpol, J.A. Identification of human triple-negative breast cancer subtypes and preclinical models for selection of targeted therapies. J. Clin. Investig. 2011, 121, 2750–2767. [Google Scholar] [CrossRef] [Green Version]
- Berry, C.T.; May, M.J.; Freedman, B.D. STIM- and Orai-mediated calcium entry controls NF-kappaB activity and function in lymphocytes. Cell Calcium. 2018, 74, 131–143. [Google Scholar] [CrossRef] [PubMed]
- Gwack, Y.; Srikanth, S.; Feske, S.; Cruz-Guilloty, F.; Oh-hora, M.; Neems, D.S.; Hogan, P.G.; Rao, A. Biochemical and functional characterization of Orai proteins. J. Biol. Chem. 2007, 282, 16232–16243. [Google Scholar] [CrossRef] [PubMed] [Green Version]
- Li, Z.; Liu, L.; Deng, Y.; Ji, W.; Du, W.; Xu, P.; Chen, L.; Xu, T. Graded activation of CRAC channel by binding of different numbers of STIM1 to Orai1 subunits. Cell Res. 2011, 21, 305–315. [Google Scholar] [CrossRef] [PubMed] [Green Version]
- Ross, D.G.; Smart, C.E.; Azimi, I.; Roberts-Thomson, S.J.; Monteith, G.R. Assessment of ORAI1-mediated basal calcium influx in mammary epithelial cells. BMC Cell Biol. 2013, 14, 57. [Google Scholar] [CrossRef] [Green Version]
- Parekh, A.B.; Putney, J.W., Jr. Store-operated calcium channels. Physiol. Rev. 2005, 85, 757–810. [Google Scholar] [CrossRef] [Green Version]
- Moncoq, K.; Trieber, C.A.; Young, H.S. The molecular basis for cyclopiazonic acid inhibition of the sarcoplasmic reticulum calcium pump. J. Biol. Chem. 2007, 282, 9748–9757. [Google Scholar] [CrossRef] [Green Version]
- Sagara, Y.; Wade, J.B.; Inesi, G. A conformational mechanism for formation of a dead-end complex by the sarcoplasmic reticulum ATPase with thapsigargin. J. Biol. Chem. 1992, 267, 1286–1292. [Google Scholar] [CrossRef]
- Kar, P.; Parekh, A.B. Distinct spatial Ca2+ signatures selectively activate different NFAT transcription factor isoforms. Mol. Cell 2015, 58, 232–243. [Google Scholar] [CrossRef] [Green Version]
- Bassett, J.J.; Robitaille, M.; Peters, A.A.; Bong, A.H.L.; Taing, M.W.; Wood, I.A.; Sadras, F.; Roberts-Thomson, S.J.; Monteith, G.R. ORAI1 regulates sustained cytosolic free calcium fluctuations during breast cancer cell apoptosis and apoptotic resistance via a STIM1 independent pathway. FASEB J. 2022, 36, e22108. [Google Scholar] [CrossRef]
- Fiorio Pla, A.; Kondratska, K.; Prevarskaya, N. STIM and ORAI proteins: Crucial roles in hallmarks of cancer. Am. J. Physiol. Cell Physiol. 2016, 310, C509–C519. [Google Scholar] [CrossRef]
- Stegner, D.; Hofmann, S.; Schuhmann, M.K.; Kraft, P.; Herrmann, A.M.; Popp, S.; Hohn, M.; Popp, M.; Klaus, V.; Post, A.; et al. Loss of Orai2-Mediated Capacitative Ca(2+) Entry Is Neuroprotective in Acute Ischemic Stroke. Stroke 2019, 50, 3238–3245. [Google Scholar] [CrossRef] [PubMed]
- Kwon, J.; An, H.; Sa, M.; Won, J.; Shin, J.I.; Lee, C.J. Orai1 and Orai3 in Combination with Stim1 Mediate the Majority of Store-operated Calcium Entry in Astrocytes. Exp. Neurobiol. 2017, 26, 42–54. [Google Scholar] [CrossRef] [PubMed]
- Wei, D.; Mei, Y.; Xia, J.; Hu, H. Orai1 and Orai3 Mediate Store-Operated Calcium Entry Contributing to Neuronal Excitability in Dorsal Root Ganglion Neurons. Front. Cell Neurosci. 2017, 11, 400. [Google Scholar] [CrossRef] [PubMed] [Green Version]
- Azimi, I.; Stevenson, R.J.; Zhang, X.; Meizoso-Huesca, A.; Xin, P.; Johnson, M.; Flanagan, J.U.; Chalmers, S.B.; Yoast, R.E.; Kapure, J.S.; et al. A new selective pharmacological enhancer of the Orai1 Ca(2+) channel reveals roles for Orai1 in smooth and skeletal muscle functions. ACS Pharmacol. Transl. Sci. 2020, 3, 135–147. [Google Scholar] [CrossRef] [PubMed] [Green Version]
- Liu, X.; Singh, B.B.; Ambudkar, I.S. TRPC1 is required for functional store-operated Ca2+ channels. Role of acidic amino acid residues in the S5-S6 region. J. Biol. Chem. 2003, 278, 11337–11343. [Google Scholar] [CrossRef] [Green Version]
- Schindl, R.; Frischauf, I.; Bergsmann, J.; Muik, M.; Derler, I.; Lackner, B.; Groschner, K.; Romanin, C. Plasticity in Ca2+ selectivity of Orai1/Orai3 heteromeric channel. Proc. Natl. Acad. Sci. USA 2009, 106, 19623–19628. [Google Scholar] [CrossRef] [Green Version]
- Liao, Y.; Erxleben, C.; Abramowitz, J.; Flockerzi, V.; Zhu, M.X.; Armstrong, D.L.; Birnbaumer, L. Functional interactions among Orai1, TRPCs, and STIM1 suggest a STIM-regulated heteromeric Orai/TRPC model for SOCE/Icrac channels. Proc. Natl. Acad. Sci. USA 2008, 105, 2895–2900. [Google Scholar] [CrossRef] [Green Version]
- Yen, M.; Lewis, R.S. Numbers count: How STIM and Orai stoichiometry affect store-operated calcium entry. Cell Calcium. 2019, 79, 35–43. [Google Scholar] [CrossRef]
- Singh, B.; Lucci, A. Role of cyclooxygenase-2 in breast cancer. J. Surg. Res. 2002, 108, 173–179. [Google Scholar] [CrossRef]
- Kurebayashi, J. Regulation of interleukin-6 secretion from breast cancer cells and its clinical implications. Breast Cancer 2000, 7, 124–129. [Google Scholar] [CrossRef]
- Wang, J.Y.; Chen, B.K.; Wang, Y.S.; Tsai, Y.T.; Chen, W.C.; Chang, W.C.; Hou, M.F.; Wu, Y.C.; Chang, W.C. Involvement of store-operated calcium signaling in EGF-mediated COX-2 gene activation in cancer cells. Cell Signal. 2012, 24, 162–169. [Google Scholar] [CrossRef] [PubMed]
- Wong, J.H.; Ho, K.H.; Nam, S.; Hsu, W.L.; Lin, C.H.; Chang, C.M.; Wang, J.Y.; Chang, W.C. Store-operated Ca(2+) Entry Facilitates the Lipopolysaccharide-induced Cyclooxygenase-2 Expression in Gastric Cancer Cells. Sci. Rep. 2017, 7, 12813. [Google Scholar] [CrossRef] [PubMed]
- Hirano, T.; Taga, T.; Nakano, N.; Yasukawa, K.; Kashiwamura, S.; Shimizu, K.; Nakajima, K.; Pyun, K.H.; Kishimoto, T. Purification to homogeneity and characterization of human B-cell differentiation factor (BCDF or BSFp-2). Proc. Natl. Acad. Sci. USA 1985, 82, 5490–5494. [Google Scholar] [CrossRef] [PubMed] [Green Version]
- Schett, G. Physiological effects of modulating the interleukin-6 axis. Rheumatology 2018, 57 (Suppl. 2), ii43–ii50. [Google Scholar] [CrossRef] [PubMed] [Green Version]
- Hanahan, D.; Weinberg, R.A. Hallmarks of cancer: The next generation. Cell 2011, 144, 646–674. [Google Scholar] [CrossRef] [Green Version]
- Kumari, N.; Dwarakanath, B.S.; Das, A.; Bhatt, A.N. Role of interleukin-6 in cancer progression and therapeutic resistance. Tumour. Biol. 2016, 37, 11553–11572. [Google Scholar] [CrossRef]
- Chen, M.F.; Chen, P.T.; Lu, M.S.; Lin, P.Y.; Chen, W.C.; Lee, K.D. IL-6 expression predicts treatment response and outcome in squamous cell carcinoma of the esophagus. Mol. Cancer 2013, 12, 26. [Google Scholar] [CrossRef] [Green Version]
- Shimura, T.; Shibata, M.; Gonda, K.; Murakami, Y.; Noda, M.; Tachibana, K.; Abe, N.; Ohtake, T. Prognostic impact of interleukin-6 and C-reactive protein on patients with breast cancer. Oncol. Lett. 2019, 17, 5139–5146. [Google Scholar] [CrossRef] [Green Version]
- Fertig, E.J.; Lee, E.; Pandey, N.B.; Popel, A.S. Analysis of gene expression of secreted factors associated with breast cancer metastases in breast cancer subtypes. Sci. Rep. 2015, 5, 12133. [Google Scholar] [CrossRef] [Green Version]
- Hartman, Z.C.; Poage, G.M.; den Hollander, P.; Tsimelzon, A.; Hill, J.; Panupinthu, N.; Zhang, Y.; Mazumdar, A.; Hilsenbeck, S.G.; Mills, G.B.; et al. Growth of triple-negative breast cancer cells relies upon coordinate autocrine expression of the proinflammatory cytokines IL-6 and IL-8. Cancer Res. 2013, 73, 3470–3480. [Google Scholar] [CrossRef] [Green Version]
- Xing, J.; Petranka, J.G.; Davis, F.M.; Desai, P.N.; Putney, J.W.; Bird, G.S. Role of Orai1 and store-operated calcium entry in mouse lacrimal gland signalling and function. J. Physiol. 2014, 592, 927–939. [Google Scholar] [CrossRef] [PubMed]
- Davis, F.M.; Goulding, E.H.; D’Agostin, D.M.; Janardhan, K.S.; Cummings, C.A.; Bird, G.S.; Eddy, E.M.; Putney, J.W. Male infertility in mice lacking the store-operated Ca(2+) channel Orai1. Cell Calcium. 2016, 59, 189–197. [Google Scholar] [CrossRef] [PubMed] [Green Version]
- Bird, G.S.; DeHaven, W.I.; Smyth, J.T.; Putney, J.W., Jr. Methods for studying store-operated calcium entry. Methods 2008, 46, 204–212. [Google Scholar] [CrossRef] [PubMed] [Green Version]
- Smaardijk, S.; Chen, J.; Kerselaers, S.; Voets, T.; Eggermont, J.; Vangheluwe, P. Store-independent coupling between the Secretory Pathway Ca(2+) transport ATPase SPCA1 and Orai1 in Golgi stress and Hailey-Hailey disease. Biochim. Biophys. Acta Mol. Cell Res. 2018, 1865, 855–862. [Google Scholar] [CrossRef]
- Sadras, F.; Stewart, T.A.; Robitaille, M.; Peters, A.A.; Croft, P.K.; Soon, P.S.; Saunus, J.M.; Lakhani, S.R.; Roberts-Thomson, S.J.; Monteith, G.R. Altered Calcium Influx Pathways in Cancer-Associated Fibroblasts. Biomedicines 2021, 9, 680. [Google Scholar] [CrossRef] [PubMed]
- Wu, Q.; Merchant, F.A.; Castleman, K.R. (Eds.) Microscope Image Processing; Academic Press: Burlington, ON, Canada, 2007; pp. 113–172. [Google Scholar]


Publisher’s Note: MDPI stays neutral with regard to jurisdictional claims in published maps and institutional affiliations. |
© 2022 by the authors. Licensee MDPI, Basel, Switzerland. This article is an open access article distributed under the terms and conditions of the Creative Commons Attribution (CC BY) license (https://creativecommons.org/licenses/by/4.0/).
Share and Cite
Robitaille, M.; Chan, S.M.; Peters, A.A.; Dai, L.; So, C.L.; Bong, A.H.L.; Sadras, F.; Roberts-Thomson, S.J.; Monteith, G.R. ORAI1-Regulated Gene Expression in Breast Cancer Cells: Roles for STIM1 Binding, Calcium Influx and Transcription Factor Translocation. Int. J. Mol. Sci. 2022, 23, 5867. https://0-doi-org.brum.beds.ac.uk/10.3390/ijms23115867
Robitaille M, Chan SM, Peters AA, Dai L, So CL, Bong AHL, Sadras F, Roberts-Thomson SJ, Monteith GR. ORAI1-Regulated Gene Expression in Breast Cancer Cells: Roles for STIM1 Binding, Calcium Influx and Transcription Factor Translocation. International Journal of Molecular Sciences. 2022; 23(11):5867. https://0-doi-org.brum.beds.ac.uk/10.3390/ijms23115867
Chicago/Turabian StyleRobitaille, Mélanie, Shao Ming Chan, Amelia A. Peters, Limin Dai, Choon Leng So, Alice H. L. Bong, Francisco Sadras, Sarah J. Roberts-Thomson, and Gregory R. Monteith. 2022. "ORAI1-Regulated Gene Expression in Breast Cancer Cells: Roles for STIM1 Binding, Calcium Influx and Transcription Factor Translocation" International Journal of Molecular Sciences 23, no. 11: 5867. https://0-doi-org.brum.beds.ac.uk/10.3390/ijms23115867