
Mechanistic Insight into Permeation of Plasma-Generated Species from Vacuum into Water Bulk

 , ,
, ,
Abstract
:1. Introduction
2. Simulation Setup
3. Results and Discussion
4. Conclusions
Author Contributions
Funding
Institutional Review Board Statement
Informed Consent Statement
Data Availability Statement
Conflicts of Interest
References
- Uchida, G.; Takenaka, K.; Takeda, K.; Ishikawa, K.; Hori, M.; Setsuhara, Y. Selective production of reactive oxygen and nitrogen species in the plasma-treated water by using a nonthermal high-frequency plasma jet. Jpn. J. Appl. Phys. 2018, 57, 0102B4. [Google Scholar] [CrossRef] [Green Version]
- Zhou, R.; Zhou, R.; Wang, P.; Xian, Y.; Mai-Prochnow, A.; Lu, X.; Cullen, P.J.; Ostrikov, K.; Bazaka, K. Plasma-activated water: Generation, origin of reactive species and biological applications. J. Phys. D Appl. Phys. 2020, 53, 303001. [Google Scholar] [CrossRef]
- Chen, Z.; Wirz, R.E. Cold Atmospheric Plasma (CAP) Technology and Applications. Synth. Lect. Mech. Eng. 2021, 6, 191. [Google Scholar] [CrossRef]
- Brisset, J.-L.; Moussa, D.; Doubla, A.; Hnatiuc, E.; Hnatiuc, B.; Kamgang Youbi, G.; Herry, J.-M.; Naïtali, M.; Bellon-Fontaine, M.-N. Chemical Reactivity of Discharges and Temporal Post-Discharges in Plasma Treatment of Aqueous Media: Examples of Gliding Discharge Treated Solutions. Ind. Eng. Chem. Res. 2008, 47, 5761–5781. [Google Scholar] [CrossRef]
- Guo, D.; Liu, H.; Zhou, L.; Xie, J.; He, C. Plasma-activated water production and its application in agriculture. J. Sci. Food Agric. 2021, 101, 4891–4899. [Google Scholar] [CrossRef]
- Zambon, Y.; Contaldo, N.; Laurita, R.; Varallyay, E.; Canel, A.; Gherardi, M.; Colombo, V.; Bertaccini, A. Plasma activated water triggers plant defence responses. Sci. Rep. 2020, 10, 19211. [Google Scholar] [CrossRef]
- Zhao, Y.M.; Patange, A.; Sun, D.W.; Tiwari, B. Plasma-activated water: Physicochemical properties, microbial inactivation mechanisms, factors influencing antimicrobial effectiveness, and applications in the food industry. Compr. Rev. Food Sci. Food Saf. 2020, 19, 3951–3979. [Google Scholar] [CrossRef]
- Rezaei, F.; Vanraes, P.; Nikiforov, A.; Morent, R.; De Geyter, N. Applications of Plasma-Liquid Systems: A Review. Materials 2019, 12, 2751. [Google Scholar] [CrossRef] [Green Version]
- Adhikari, B.; Adhikari, M.; Ghimire, B.; Park, G.; Choi, E.H. Cold Atmospheric Plasma-Activated Water Irrigation Induces Defense Hormone and Gene expression in Tomato seedlings. Sci. Rep. 2019, 9, 16080. [Google Scholar] [CrossRef] [Green Version]
- Thirumdas, R.; Kothakota, A.; Annapure, U.; Siliveru, K.; Blundell, R.; Gatt, R.; Valdramidis, V.P. Plasma activated water (PAW): Chemistry, physico-chemical properties, applications in food and agriculture. Trends Food Sci. Technol. 2018, 77, 21–31. [Google Scholar] [CrossRef]
- Tanaka, H.; Bekeschus, S.; Yan, D.; Hori, M.; Keidar, M.; Laroussi, M. Plasma-Treated Solutions (PTS) in Cancer Therapy. Cancers 2021, 13, 1737. [Google Scholar] [CrossRef] [PubMed]
- Cao, Y.; Qu, G.; Li, T.; Jiang, N.; Wang, T. Review on reactive species in water treatment using electrical discharge plasma: Formation, measurement, mechanisms and mass transfer. Plasma Sci. Technol. 2018, 20, 103001. [Google Scholar] [CrossRef] [Green Version]
- Razzokov, J.; Fazliev, S.; Yusupov, M.; Sharipov, A.; Ruziev, Z.; Mamatkulov, S. Effect of Mutation and Disulfide Bond Formation on the Catalytic Site of Monomeric Cytoglobin: A Molecular Level Insight. Plasma Med. 2021, 11, 41–51. [Google Scholar] [CrossRef]
- Chen, G.; Chen, Z.; Wang, Z.; Obenchain, R.; Wen, D.; Li, H.; Wirz, R.E.; Gu, Z. Portable air-fed cold atmospheric plasma device for postsurgical cancer treatment. Sci. Adv. 2021, 7, eabg5686. [Google Scholar] [CrossRef]
- Chen, G.; Chen, Z.; Wen, D.; Wang, Z.; Li, H.; Zeng, Y.; Dotti, G.; Wirz, R.E.; Gu, Z. Transdermal cold atmospheric plasma-mediated immune checkpoint blockade therapy. Proc. Natl. Acad. Sci. USA 2020, 117, 3687–3692. [Google Scholar] [CrossRef]
- Schnabel, U.; Handorf, O.; Yarova, K.; Zessin, B.; Zechlin, S.; Sydow, D.; Zellmer, E.; Stachowiak, J.; Andrasch, M.; Below, H.; et al. Plasma-Treated Air and Water-Assessment of Synergistic Antimicrobial Effects for Sanitation of Food Processing Surfaces and Environment. Foods 2019, 8, 55. [Google Scholar] [CrossRef] [Green Version]
- Gierczik, K.; Vukušić, T.; Kovács, L.; Székely, A.; Szalai, G.; Milošević, S.; Kocsy, G.; Kutasi, K.; Galiba, G. Plasma-activated water to improve the stress tolerance of barley. Plasma Process. Polym. 2020, 17, 1900123. [Google Scholar] [CrossRef]
- Zhang, S.; Rousseau, A.; Dufour, T. Promoting lentil germination and stem growth by plasma activated tap water, demineralized water and liquid fertilizer. RSC Adv. 2017, 7, 31244–31251. [Google Scholar] [CrossRef] [Green Version]
- Molina, R.; Lalueza, A.; López-Santos, C.; Ghobeira, R.; Cools, P.; Morent, R.; Geyter, N.; González-Elipe, A.R. Physicochemical surface analysis and germination at different irrigation conditions of DBD plasma-treated wheat seeds. Plasma Process. Polym. 2020, 18, 2000086. [Google Scholar] [CrossRef]
- Sivachandiran, L.; Khacef, A. Enhanced seed germination and plant growth by atmospheric pressure cold air plasma: Combined effect of seed and water treatment. RSC Adv. 2017, 7, 1822–1832. [Google Scholar] [CrossRef] [Green Version]
- Judée, F.; Simon, S.; Bailly, C.; Dufour, T. Plasma-activation of tap water using DBD for agronomy applications: Identification and quantification of long lifetime chemical species and production/consumption mechanisms. Water Res. 2018, 133, 47–59. [Google Scholar] [CrossRef] [PubMed] [Green Version]
- Brisset, J.-L.; Pawlat, J. Chemical Effects of Air Plasma Species on Aqueous Solutes in Direct and Delayed Exposure Modes: Discharge, Post-discharge and Plasma Activated Water. Plasma Chem. Plasma Process. 2015, 36, 355–381. [Google Scholar] [CrossRef]
- Utsumi, F.; Kajiyama, H.; Nakamura, K.; Tanaka, H.; Mizuno, M.; Ishikawa, K.; Kondo, H.; Kano, H.; Hori, M.; Kikkawa, F. Effect of Indirect Nonequilibrium Atmospheric Pressure Plasma on Anti-Proliferative Activity against Chronic Chemo-Resistant Ovarian Cancer Cells In Vitro and In Vivo. PLoS ONE 2013, 8, e81576. [Google Scholar] [CrossRef] [Green Version]
- Freund, E.; Liedtke, K.R.; van der Linde, J.; Metelmann, H.-R.; Heidecke, C.-D.; Partecke, L.-I.; Bekeschus, S. Physical plasma-treated saline promotes an immunogenic phenotype in CT26 colon cancer cells in vitro and in vivo. Sci. Rep. 2019, 9, 634. [Google Scholar] [CrossRef] [PubMed]
- Liedtke, K.-R.; Freund, E.; Hermes, M.; Oswald, S.; Heidecke, C.-D.; Partecke, L.-I.; Bekeschus, S. Gas Plasma-Conditioned Ringer’s Lactate Enhances the Cytotoxic Activity of Cisplatin and Gemcitabine in Pancreatic Cancer In Vitro and In Ovo. Cancers 2020, 12, 123. [Google Scholar] [CrossRef] [Green Version]
- Torii, K.; Yamada, S.; Nakamura, K.; Tanaka, H.; Kajiyama, H.; Tanahashi, K.; Iwata, N.; Kanda, M.; Kobayashi, D.; Tanaka, C.; et al. Effectiveness of plasma treatment on gastric cancer cells. Gastric Cancer 2015, 18, 635–643. [Google Scholar] [CrossRef]
- Kumar, N.; Attri, P.; Dewilde, S.; Bogaerts, A. Inactivation of human pancreatic ductal adenocarcinoma with atmospheric plasma treated media and water: A comparative study. J. Phys. D Appl. Phys. 2018, 51, 255401. [Google Scholar] [CrossRef]
- Liu, C.; Chen, C.; Jiang, A.; Sun, X.; Guan, Q.; Hu, W. Effects of plasma-activated water on microbial growth and storage quality of fresh-cut apple. Innov. Food Sci. Emerg. Technol. 2020, 59, 102256. [Google Scholar] [CrossRef]
- Inguglia, E.S.; Oliveira, M.; Burgess, C.M.; Kerry, J.P.; Tiwari, B.K. Plasma-activated water as an alternative nitrite source for the curing of beef jerky: Influence on quality and inactivation of Listeria innocua. Innov. Food Sci. Emerg. Technol. 2020, 59, 102276. [Google Scholar] [CrossRef]
- Shaw, P.; Kumar, N.; Kwak, H.S.; Park, J.H.; Uhm, H.S.; Bogaerts, A.; Choi, E.H.; Attri, P. Bacterial inactivation by plasma treated water enhanced by reactive nitrogen species. Sci. Rep. 2018, 8, 11268. [Google Scholar] [CrossRef] [Green Version]
- Ikawa, S.; Tani, A.; Nakashima, Y.; Kitano, K. Physicochemical properties of bactericidal plasma-treated water. J. Phys. D Appl. Phys. 2016, 49, 425401. [Google Scholar] [CrossRef]
- Sarangapani, C.; Ziuzina, D.; Behan, P.; Boehm, D.; Gilmore, B.F.; Cullen, P.J.; Bourke, P. Degradation kinetics of cold plasma-treated antibiotics and their antimicrobial activity. Sci. Rep. 2019, 9, 3955. [Google Scholar] [CrossRef] [Green Version]
- Zhou, R.; Zhou, R.; Prasad, K.; Fang, Z.; Speight, R.; Bazaka, K.; Ostrikov, K. Cold atmospheric plasma activated water as a prospective disinfectant: The crucial role of peroxynitrite. Green Chem. 2018, 20, 5276–5284. [Google Scholar] [CrossRef]
- Ma, M.; Zhang, Y.; Lv, Y.; Sun, F. The key reactive species in the bactericidal process of plasma activated water. J. Phys. D Appl. Phys. 2020, 53, 185207. [Google Scholar] [CrossRef]
- Naidis, G.V. Production of active species in cold helium–air plasma jets. Plasma Sources Sci. Technol. 2014, 23, 065014. [Google Scholar] [CrossRef]
- Park, J.Y.; Park, S.; Choe, W.; Yong, H.I.; Jo, C.; Kim, K. Plasma-Functionalized Solution: A Potent Antimicrobial Agent for Biomedical Applications from Antibacterial Therapeutics to Biomaterial Surface Engineering. ACS Appl. Mater. Interfaces 2017, 9, 43470–43477. [Google Scholar] [CrossRef]
- Machala, Z.; Tarabová, B.; Sersenová, D.; Janda, M.; Hensel, K. Chemical and antibacterial effects of plasma activated water: Correlation with gaseous and aqueous reactive oxygen and nitrogen species, plasma sources and air flow conditions. J. Phys. D Appl. Phys. 2019, 52, 034002. [Google Scholar] [CrossRef]
- Verlackt, C.C.W.; Van Boxem, W.; Bogaerts, A. Transport and accumulation of plasma generated species in aqueous solution. Phys. Chem. Chem. Phys. 2018, 20, 6845–6859. [Google Scholar] [CrossRef]
- Oh, J.-S.; Szili, E.J.; Ogawa, K.; Short, R.D.; Ito, M.; Furuta, H.; Hatta, A. UV–vis spectroscopy study of plasma-activated water: Dependence of the chemical composition on plasma exposure time and treatment distance. Jpn. J. Appl. Phys. 2018, 57, 0102B9. [Google Scholar] [CrossRef]
- Oldham, T.; Thimsen, E. Electrochemical Structure of the Plasma–Liquid Interface. J. Phys. Chem. C 2022, 126, 1222–1229. [Google Scholar] [CrossRef]
- Kutzner, C.; Páll, S.; Fechner, M.; Esztermann, A.; de Groot, B.L.; Grubmüller, H. More bang for your buck: Improved use of GPU nodes for GROMACS 2018. J. Comput. Chem. 2019, 40, 2418–2431. [Google Scholar] [CrossRef] [PubMed] [Green Version]
- Cordeiro, R.M. Reactive oxygen species at phospholipid bilayers: Distribution, mobility and permeation. Biochim. Biophys. Acta (BBA)-Biomembr. 2014, 1838, 438–444. [Google Scholar] [CrossRef] [Green Version]
- Cordeiro, R.M.; Yusupov, M.; Razzokov, J.; Bogaerts, A. Parametrization and molecular dynamics simulations of nitrogen oxyanions and oxyacids for applications in atmospheric and biomolecular sciences. J. Phys. Chem. B 2020, 124, 1082–1089. [Google Scholar] [CrossRef] [PubMed]
- Cordeiro, M.R. Reactive oxygen and nitrogen species at phospholipid bilayers: Peroxynitrous acid and its homolysis products. J. Phys. Chem. B 2018, 122, 8211–8219. [Google Scholar] [CrossRef] [PubMed]
- Razzokov, J.; Yusupov, M.; Cordeiro, R.M.; Bogaerts, A. Atomic scale understanding of the permeation of plasma species across native and oxidized membranes. J. Phys. D Appl. Phys. 2018, 51, 365203. [Google Scholar] [CrossRef] [Green Version]
- Berendsen, H.J.; Postma, J.P.; van Gunsteren, W.F.; Hermans, J. Interaction models for water in relation to protein hydration. In Intermolecular Forces; Springer: Berlin/Heidelberg, Germany, 1981; pp. 331–342. [Google Scholar]
- Martínez, L.; Andrade, R.; Birgin, E.G.; Martínez, J.M. PACKMOL: A package for building initial configurations for molecular dynamics simulations. J. Comput. Chem. 2009, 30, 2157–2164. [Google Scholar] [CrossRef]
- Bussi, G.; Donadio, D.; Parrinello, M. Canonical sampling through velocity rescaling. J. Chem. Phys. 2007, 126, 014101. [Google Scholar] [CrossRef] [Green Version]
- Parrinello, M.; Rahman, A. Polymorphic transitions in single crystals: A new molecular dynamics method. J. Appl. Phys. 1981, 52, 7182–7190. [Google Scholar] [CrossRef]
- Mamatkulov, S.I.; Allolio, C.; Netz, R.R.; Bonthuis, D.J. Orientation-induced adsorption of hydrated protons at the air–water interface. Angew. Chem. Int. Ed. 2017, 56, 15846–15851. [Google Scholar] [CrossRef] [Green Version]
- Vácha, R.; Slavíček, P.; Mucha, M.; Finlayson-Pitts, B.J.; Jungwirth, P. Adsorption of atmospherically relevant gases at the air/water interface: Free energy profiles of aqueous solvation of N2, O2, O3, OH, H2O, HO2, and H2O2. J. Phys. Chem. A 2004, 108, 11573–11579. [Google Scholar] [CrossRef]
- Kästner, J. Umbrella sampling. Wiley Interdiscip. Rev. Comput. Mol. Sci. 2011, 1, 932–942. [Google Scholar] [CrossRef]
- Humphrey, W.; Dalke, A.; Schulten, K. VMD: Visual molecular dynamics. J. Mol. Graph. 1996, 14, 33–38. [Google Scholar] [CrossRef]
- Sander, R. Compilation of Henry’s law constants (version 4.0) for water as solvent. Atmos. Chem. Phys. 2015, 15, 4399–4981. [Google Scholar] [CrossRef] [Green Version]
- Schwartz, S.E.; White, W.H. Solubility Equilibria of the Nitrogen Oxides and Oxyacids in Dilute Aqueous Solution; Gordon and Breach Science Publishers: New York, NY, USA, 1981. [Google Scholar]
- Cox, A.P.; Brittain, A.H.; Finnigan, D.J. Microwave spectrum, structure, dipole moment and quadrupole coupling constants of cis and trans nitrous acids. Trans. Faraday Soc. 1971, 67, 2179–2194. [Google Scholar] [CrossRef]
- Cox, A.P.; Kuczkowski, R.L. The Microwave Spectrum, Structure, Dipole Moment, and Quadrupole Coupling Constants of trans-Nitrous Acid. J. Am. Chem. Soc. 1966, 88, 5071–5074. [Google Scholar] [CrossRef]
- McGrath, M.P.; Rowland, F.S. Internal rotation in peroxynitrous acid (ONOOH). J. Chem. Phys. 2005, 122, 134312. [Google Scholar] [CrossRef]
- Zeghioud, H.; Nguyen-Tri, P.; Khezami, L.; Amrane, A.; Assadi, A.A. Review on discharge Plasma for water treatment: Mechanism, reactor geometries, active species and combined processes. J. Water Process Eng. 2020, 38, 101664. [Google Scholar] [CrossRef]
- Bruggeman, P.J.; Kushner, M.J.; Locke, B.R.; Gardeniers, J.G.E.; Graham, W.G.; Graves, D.B.; Hofman-Caris, R.C.H.M.; Maric, D.; Reid, J.P.; Ceriani, E.; et al. Plasma–liquid interactions: A review and roadmap. Plasma Sources Sci. Technol. 2016, 25, 053002. [Google Scholar] [CrossRef]
- Oinuma, G.; Nayak, G.; Du, Y.; Bruggeman, P.J. Controlled plasma–droplet interactions: A quantitative study of OH transfer in plasma–liquid interaction. Plasma Sources Sci. Technol. 2020, 29, 095002. [Google Scholar] [CrossRef]
- Lamichhane, P.; Acharya, T.R.; Kaushik, N.; Nguyen, L.N.; Lim, J.S.; Hessel, V.; Kaushik, N.K.; Choi, E.H. Non-Thermal Argon Plasma Jets of Various Lengths for Selective Reactive Oxygen and Nitrogen Species Production. J. Environ. Chem. Eng. 2022, 10, 107782. [Google Scholar] [CrossRef]
- Lin, A.; Gorbanev, Y.; De Backer, J.; Van Loenhout, J.; Van Boxem, W.; Lemière, F.; Cos, P.; Dewilde, S.; Smits, E.; Bogaerts, A. Non-thermal plasma as a unique delivery system of short-lived reactive oxygen and nitrogen species for immunogenic cell death in melanoma cells. Adv. Sci. 2019, 6, 1802062. [Google Scholar] [CrossRef] [PubMed] [Green Version]
- Ranieri, P.; Sponsel, N.; Kizer, J.; Rojas-Pierce, M.; Hernández, R.; Gatiboni, L.; Grunden, A.; Stapelmann, K. Plasma agriculture: Review from the perspective of the plant and its ecosystem. Plasma Process. Polym. 2021, 18, 2000162. [Google Scholar] [CrossRef]
- Nguyen, P.T.T.; Nguyen, H.T.; Tran, U.N.P.; Manh Bui, H. Removal of antibiotics from real hospital wastewater by cold plasma technique. J. Chem. 2021, 2021, 9981738. [Google Scholar] [CrossRef]
- Song, Y.; Fan, X. Cold plasma enhances the efficacy of aerosolized hydrogen peroxide in reducing populations of Salmonella Typhimurium and Listeria innocua on grape tomatoes, apples, cantaloupe and romaine lettuce. Food Microbiol. 2020, 87, 103391. [Google Scholar] [CrossRef]
- Bekeschus, S.; Schmidt, A.; Weltmann, K.-D.; von Woedtke, T. The plasma jet kINPen–A powerful tool for wound healing. Clin. Plasma Med. 2016, 4, 19–28. [Google Scholar] [CrossRef]
- Vichiansan, N.; Leksakul, K.; Chaopaisarn, P.; Boonyawan, D. Simulation of simple 2D plasma jet model for NO, OH, and H2O2 production via Multiphysics in laminar flow and transport of diluted species through design of experiment method. AIP Adv. 2021, 11, 035040. [Google Scholar] [CrossRef]
- Qian, M.-Y.; Yang, C.-Y.; Wang, Z.-D.; Chen, X.-C.; Liu, S.-Q.; Wang, D.-Z. Numerical study of the effect of water content on OH production in a pulsed-dc atmospheric pressure helium–air plasma jet. Chin. Phys. B 2016, 25, 015202. [Google Scholar] [CrossRef]
- Jiang, J.; Aranda Gonzalvo, Y.; Bruggeman, P.J. Analysis of the Ion Conversion Mechanisms in the Effluent of Atmospheric Pressure Plasma Jets in Ar with Admixtures of O2, H2O and Air. Plasma Chem. Plasma Process. 2021, 41, 1569–1594. [Google Scholar] [CrossRef]
- Kelly, S.; Turner, M.M. Generation of reactive species by an atmospheric pressure plasma jet. Plasma Sources Sci. Technol. 2014, 23, 065013. [Google Scholar] [CrossRef]
- Yan, W.; Economou, D.J. Gas flow rate dependence of the discharge characteristics of a helium atmospheric pressure plasma jet interacting with a substrate. J. Phys. D Appl. Phys. 2017, 50, 415205. [Google Scholar] [CrossRef]


| Species | ∆Ggs, kJ/ mol | ∆Gsl, kJ/ mol | ∆Ghydr, kJ/ mol | ∆Ghydr(expt) *, kJ/ mol | Concentration Enhancement ** | |
|---|---|---|---|---|---|---|
| Surface | Bulk | |||||
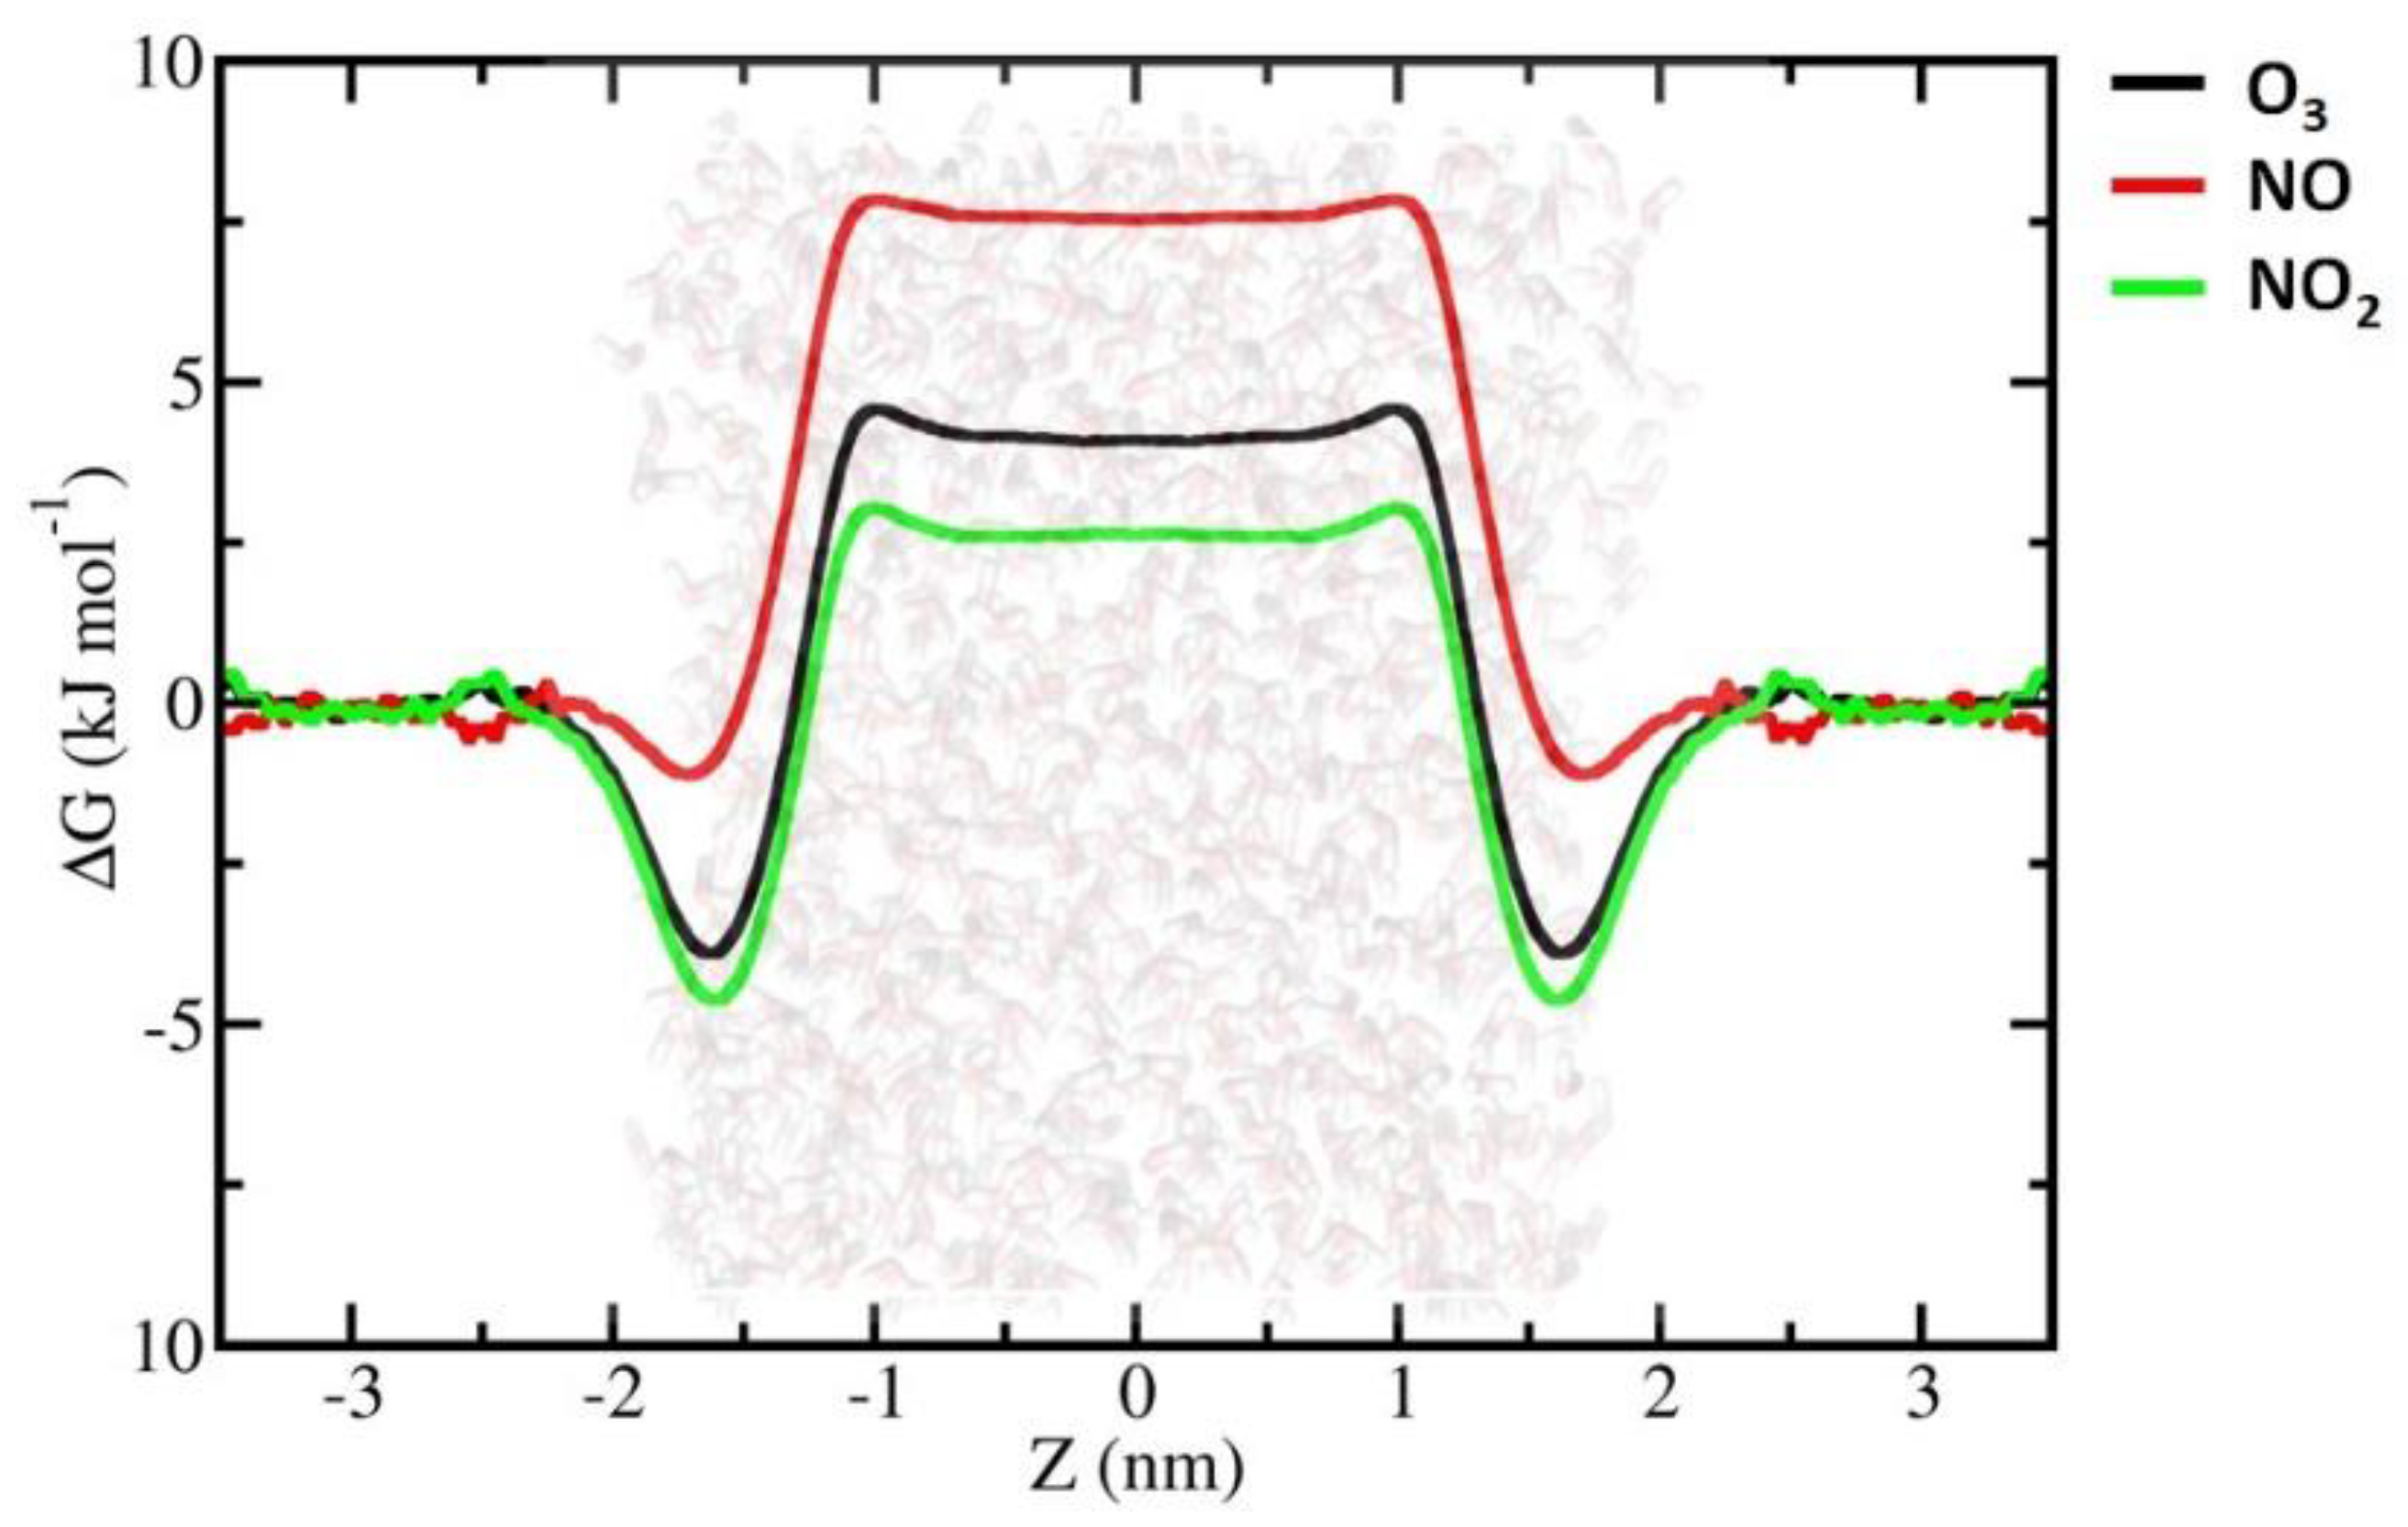
| O3 | −3.94 | 7.92 | 3.98 | 3.46 | 4.8 | 0.20 |
| NO | −1.21 | 8.68 | 7.47 | 7.61 | 1.6 | 0.05 |
| NO2 | −4.66 | 7.27 | 2.61 | 3.01 | 6.4 | 0.35 |
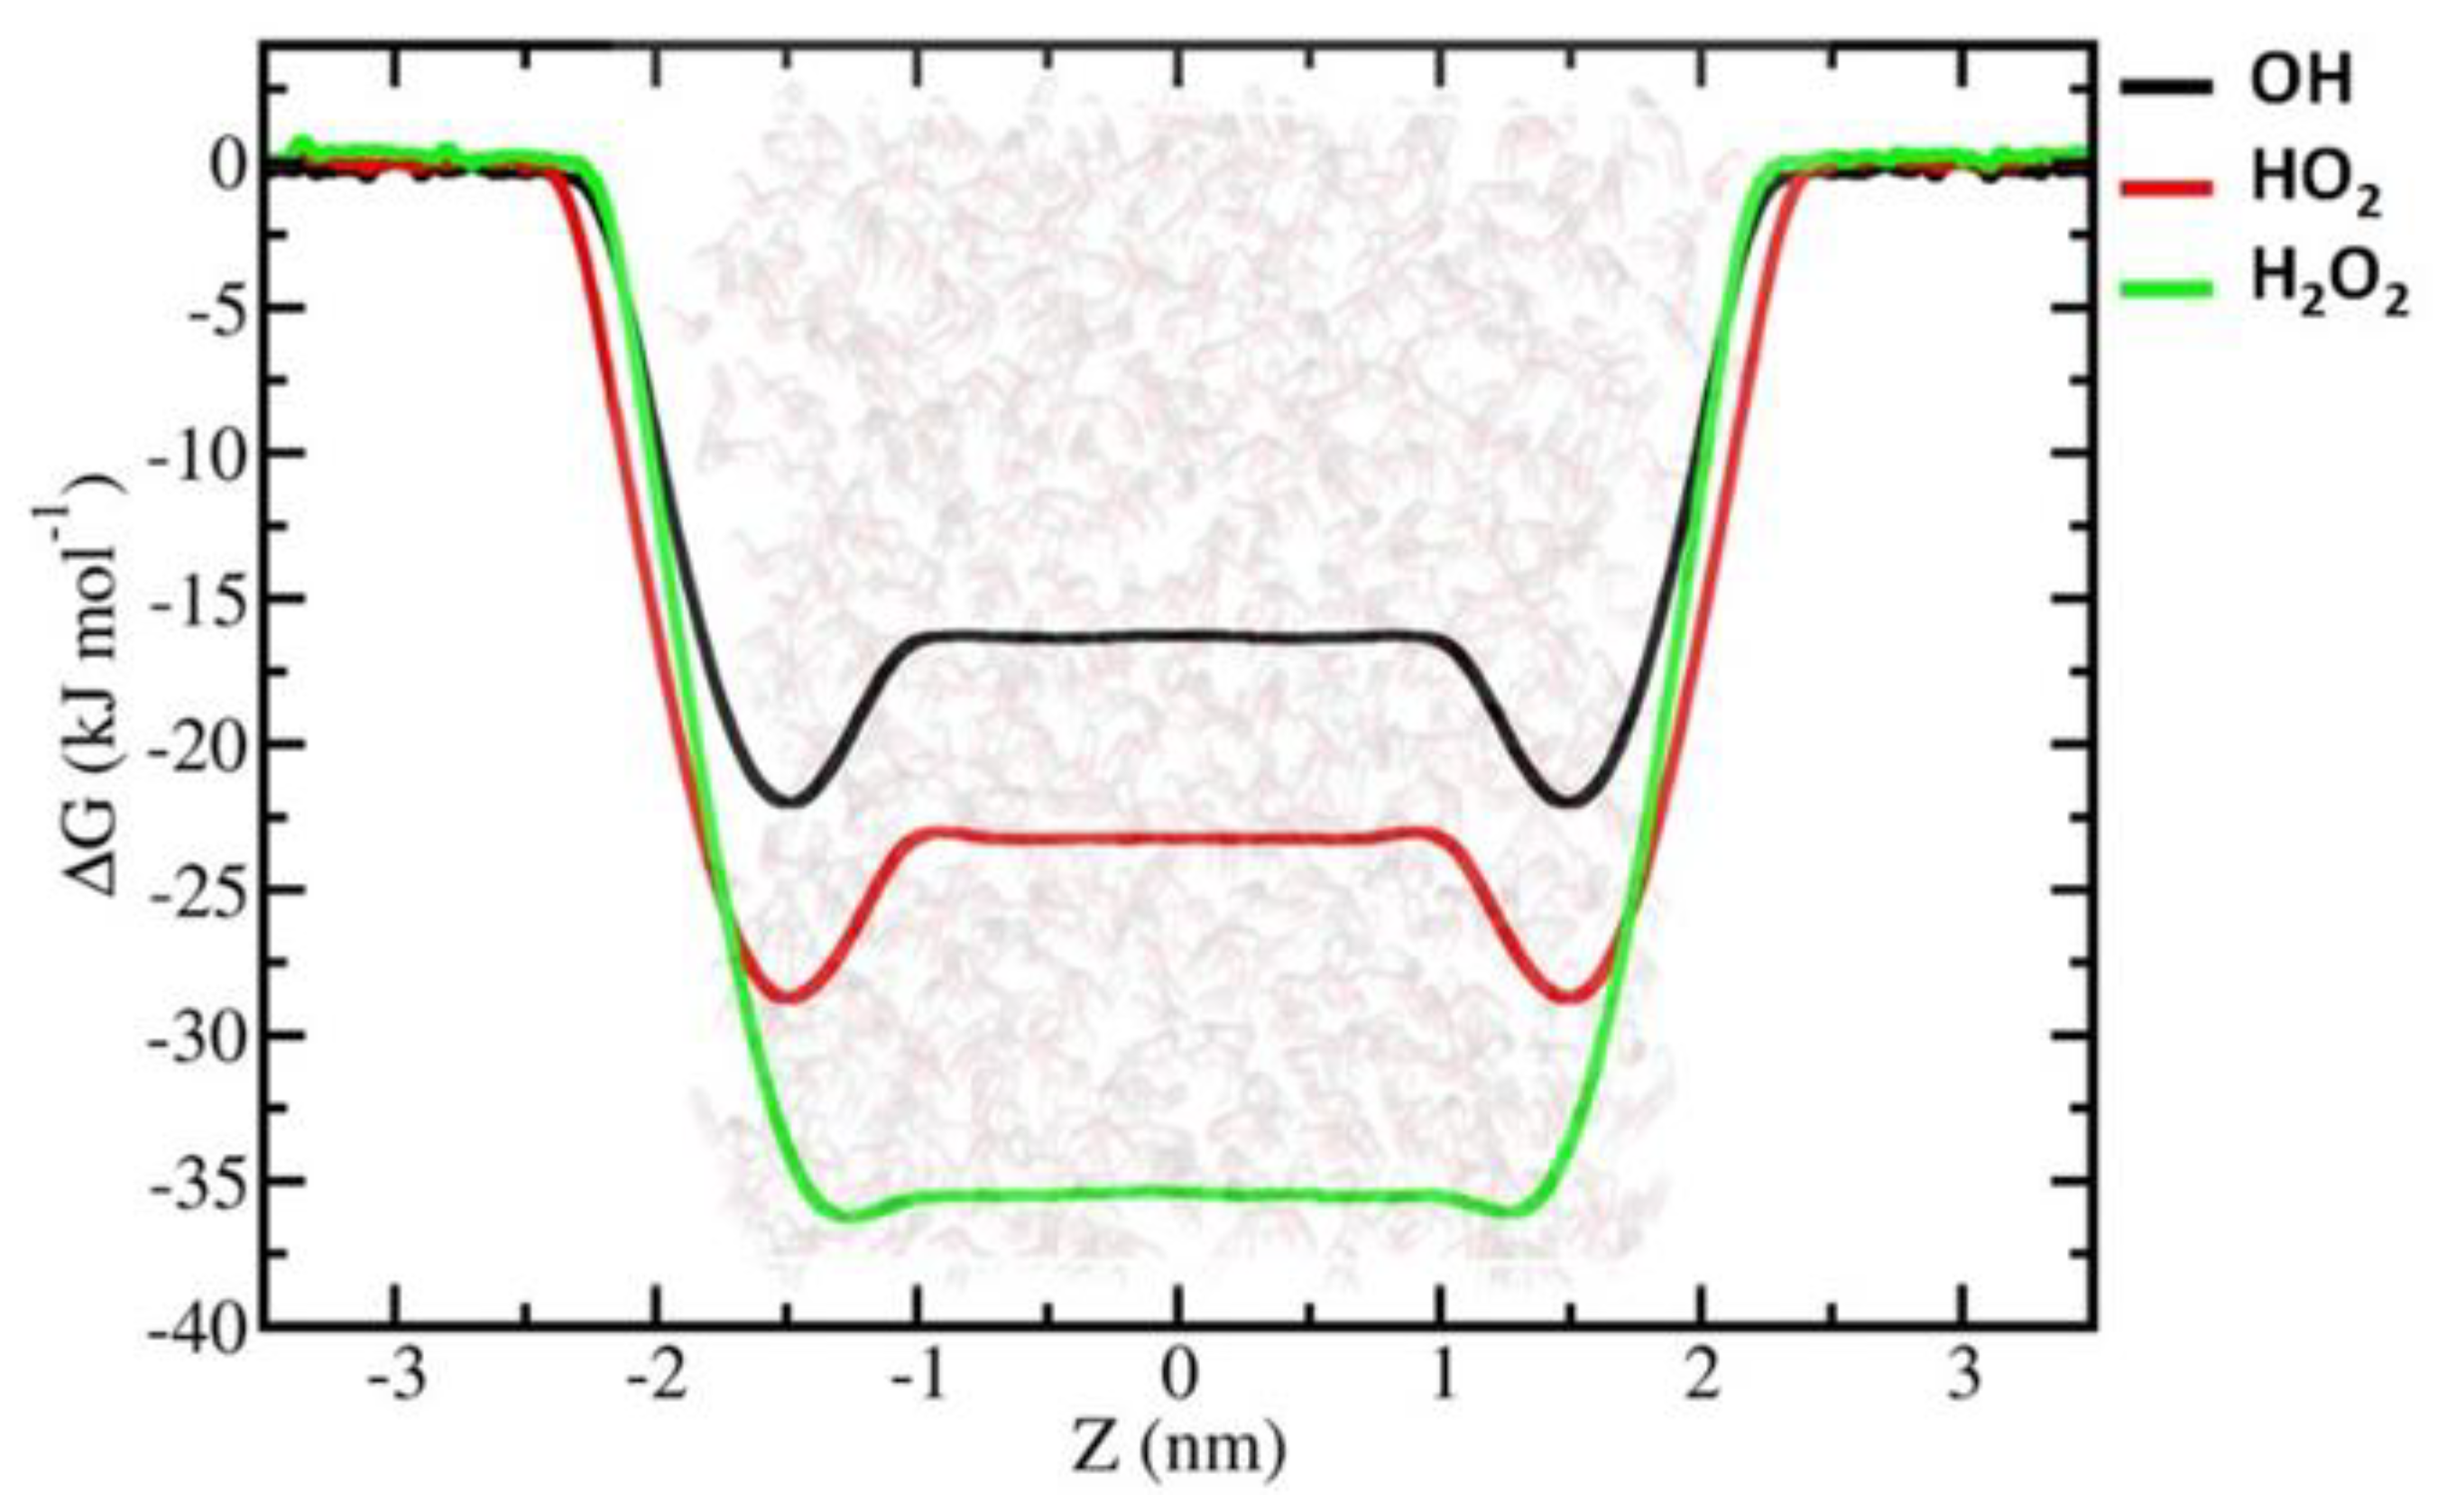
| OH ˙ | −22.04 | 5.53 | −16.51 | −17.09 | 6880.9 | 749.5 |
| HO2˙ | −28.97 | 5.76 | −23.21 | −24.29 | 110,740.7 | 10,999.3 |
| H2O2 | −36.21 | 0.45 | −35.76 | −36.50 | 2,018,128.0 | 1,684,976.9 |
| N2O4 | −12.70 | 6.70 | −6.00 | −8.86 | 162.7 | 11.1 |
| trans-HNO2 | −23.06 | 7.09 | −15.97 | −18.0 *** | 10,357.3 | 603.6 |
| cis-HNO2 | −18.93 | 7.24 | −11.69 | −11.2 *** | 1977.5 | 108.5 |
| HNO3 | −32.16 | 5.29 | −26.87 | −36.42 | 397,883.2 | 47,714.6 |
| tp-ONOOH | −26.55 | 8.05 | −18.50 | Not found | 41,969.4 | 1664.4 |
| cp-ONOOH | −25.47 | 7.45 | −18.02 | Not found | 27,219.6 | 1373 |
Publisher’s Note: MDPI stays neutral with regard to jurisdictional claims in published maps and institutional affiliations. |
© 2022 by the authors. Licensee MDPI, Basel, Switzerland. This article is an open access article distributed under the terms and conditions of the Creative Commons Attribution (CC BY) license (https://creativecommons.org/licenses/by/4.0/).
Share and Cite
Razzokov, J.; Fazliev, S.; Kodirov, A.; AttrI, P.; Chen, Z.; Shiratani, M. Mechanistic Insight into Permeation of Plasma-Generated Species from Vacuum into Water Bulk. Int. J. Mol. Sci. 2022, 23, 6330. https://0-doi-org.brum.beds.ac.uk/10.3390/ijms23116330
Razzokov J, Fazliev S, Kodirov A, AttrI P, Chen Z, Shiratani M. Mechanistic Insight into Permeation of Plasma-Generated Species from Vacuum into Water Bulk. International Journal of Molecular Sciences. 2022; 23(11):6330. https://0-doi-org.brum.beds.ac.uk/10.3390/ijms23116330
Chicago/Turabian StyleRazzokov, Jamoliddin, Sunnatullo Fazliev, Akbar Kodirov, Pankaj AttrI, Zhitong Chen, and Masaharu Shiratani. 2022. "Mechanistic Insight into Permeation of Plasma-Generated Species from Vacuum into Water Bulk" International Journal of Molecular Sciences 23, no. 11: 6330. https://0-doi-org.brum.beds.ac.uk/10.3390/ijms23116330