
High, in Contrast to Low Levels of Acute Stress Induce Depressive-like Behavior by Involving Astrocytic, in Addition to Microglial P2X7 Receptors in the Rodent Hippocampus


 , , and
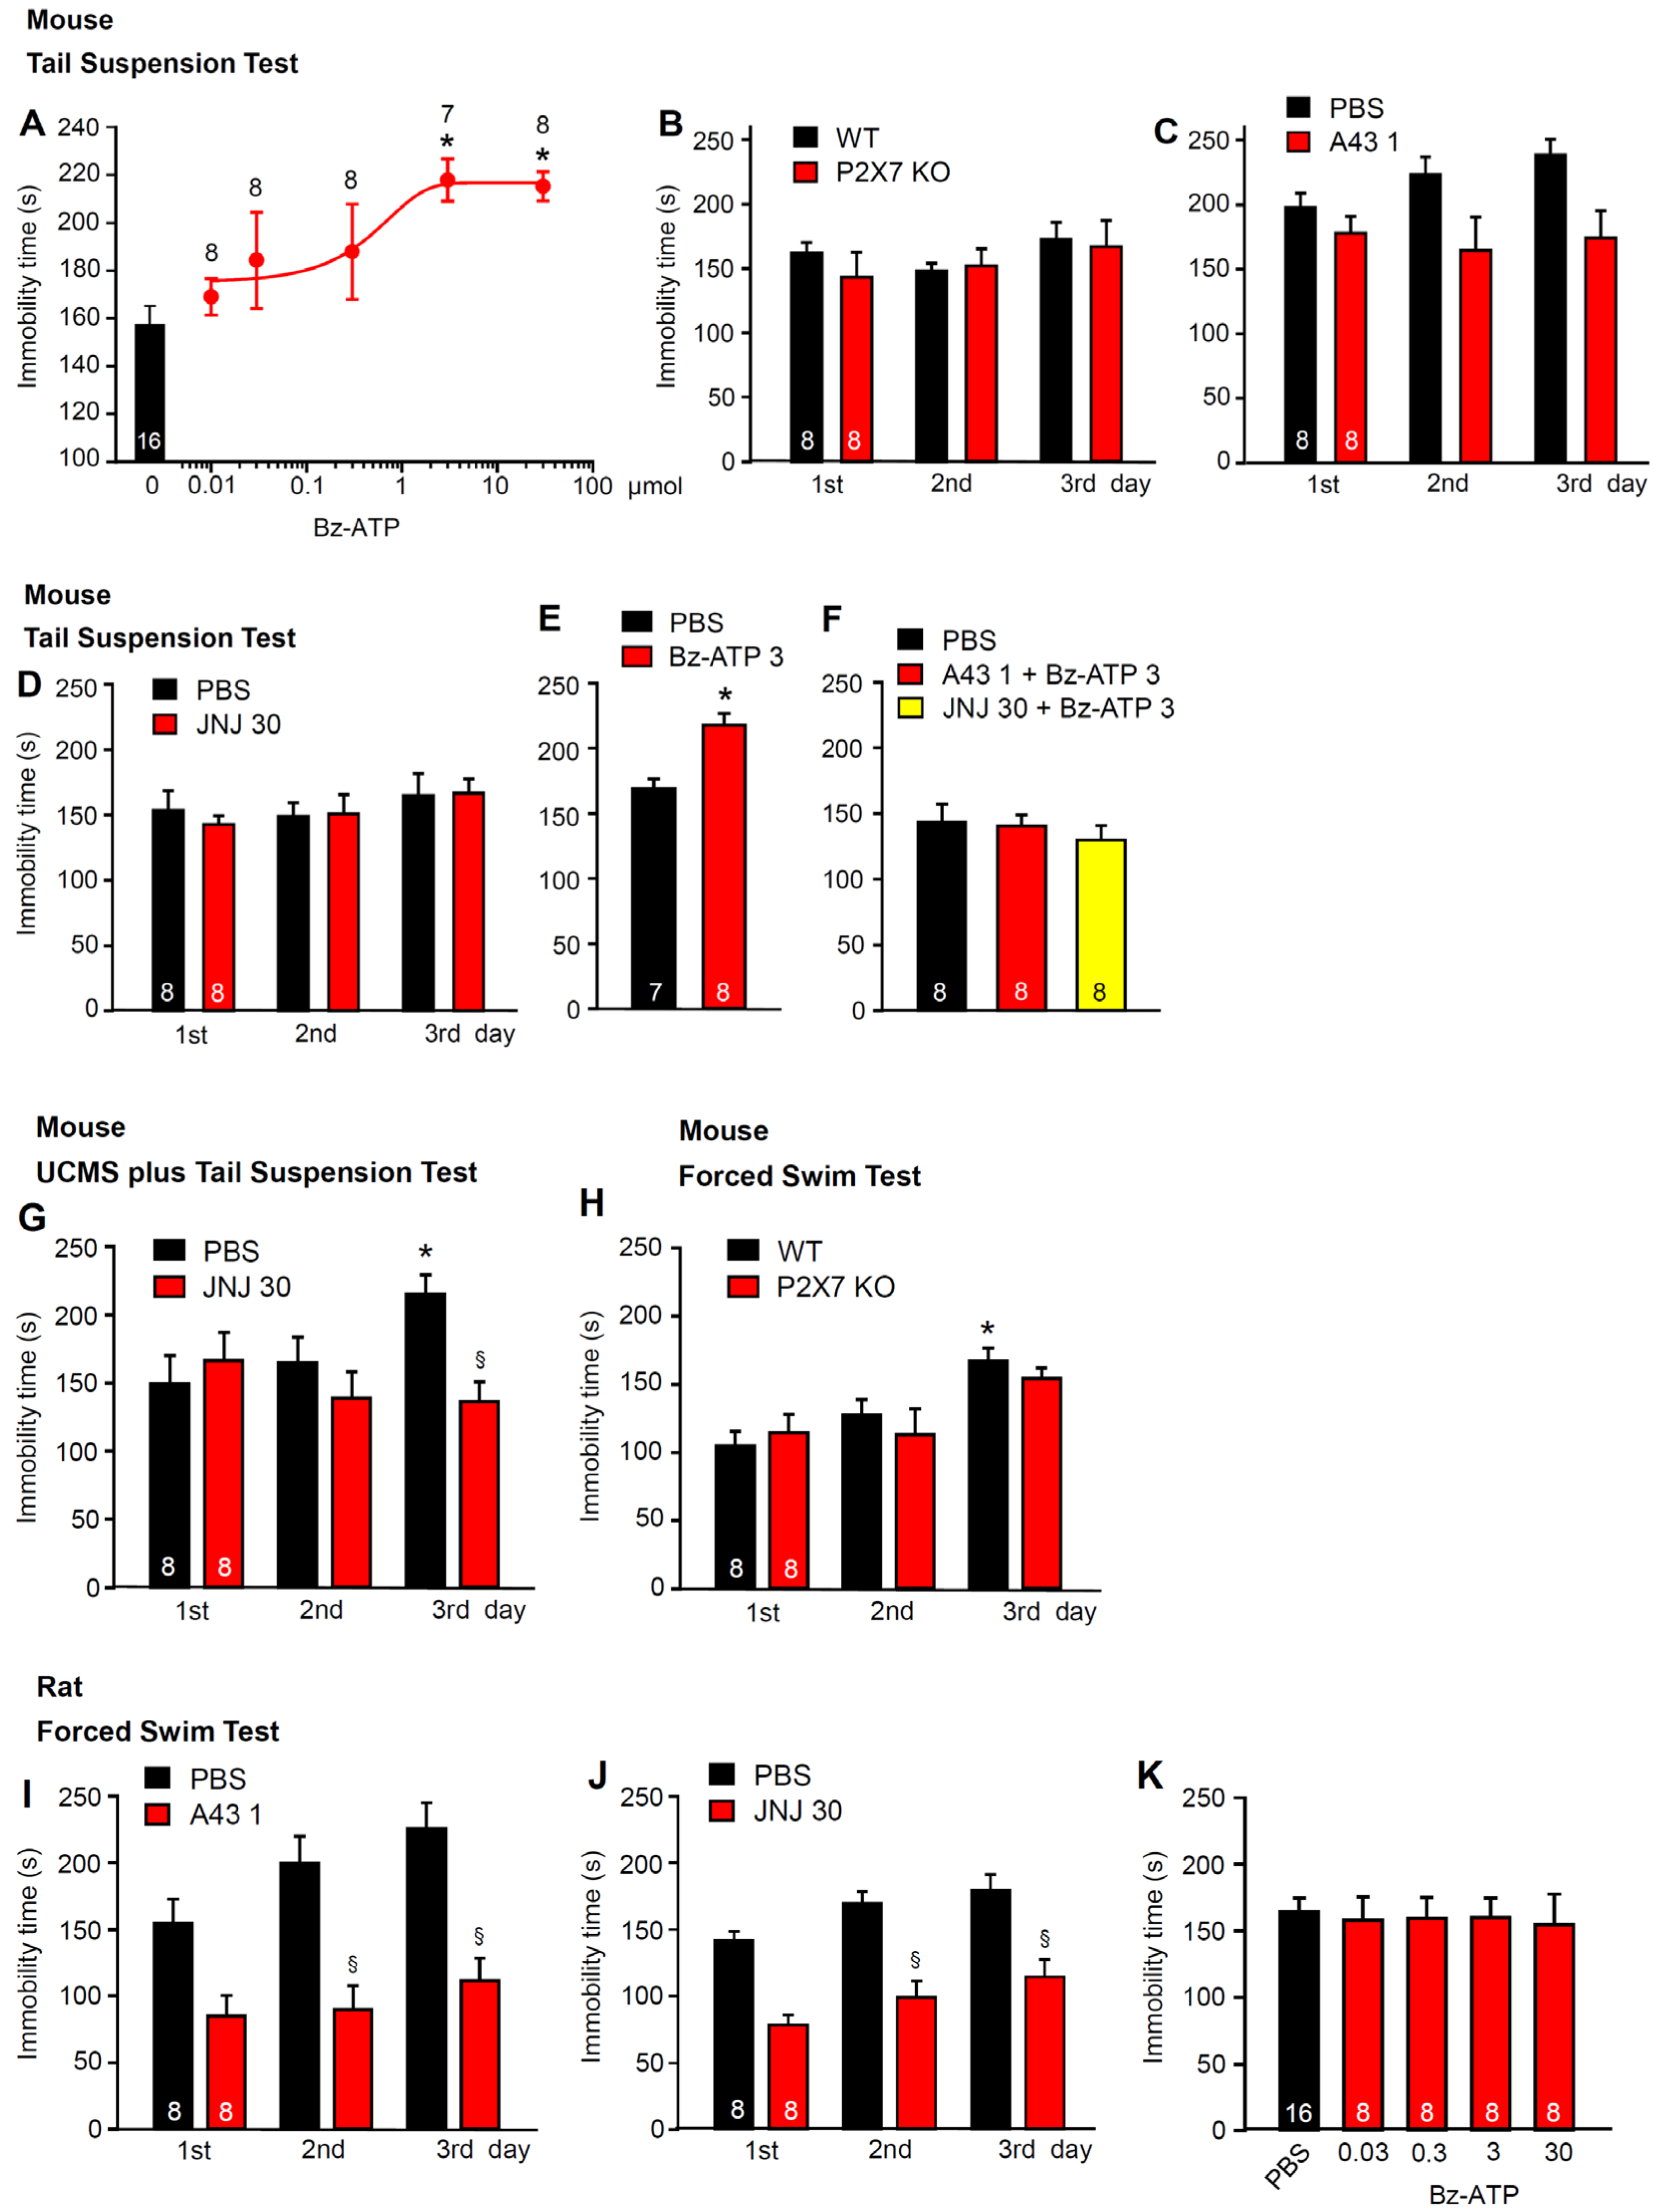
Abstract
:1. Introduction
2. Results
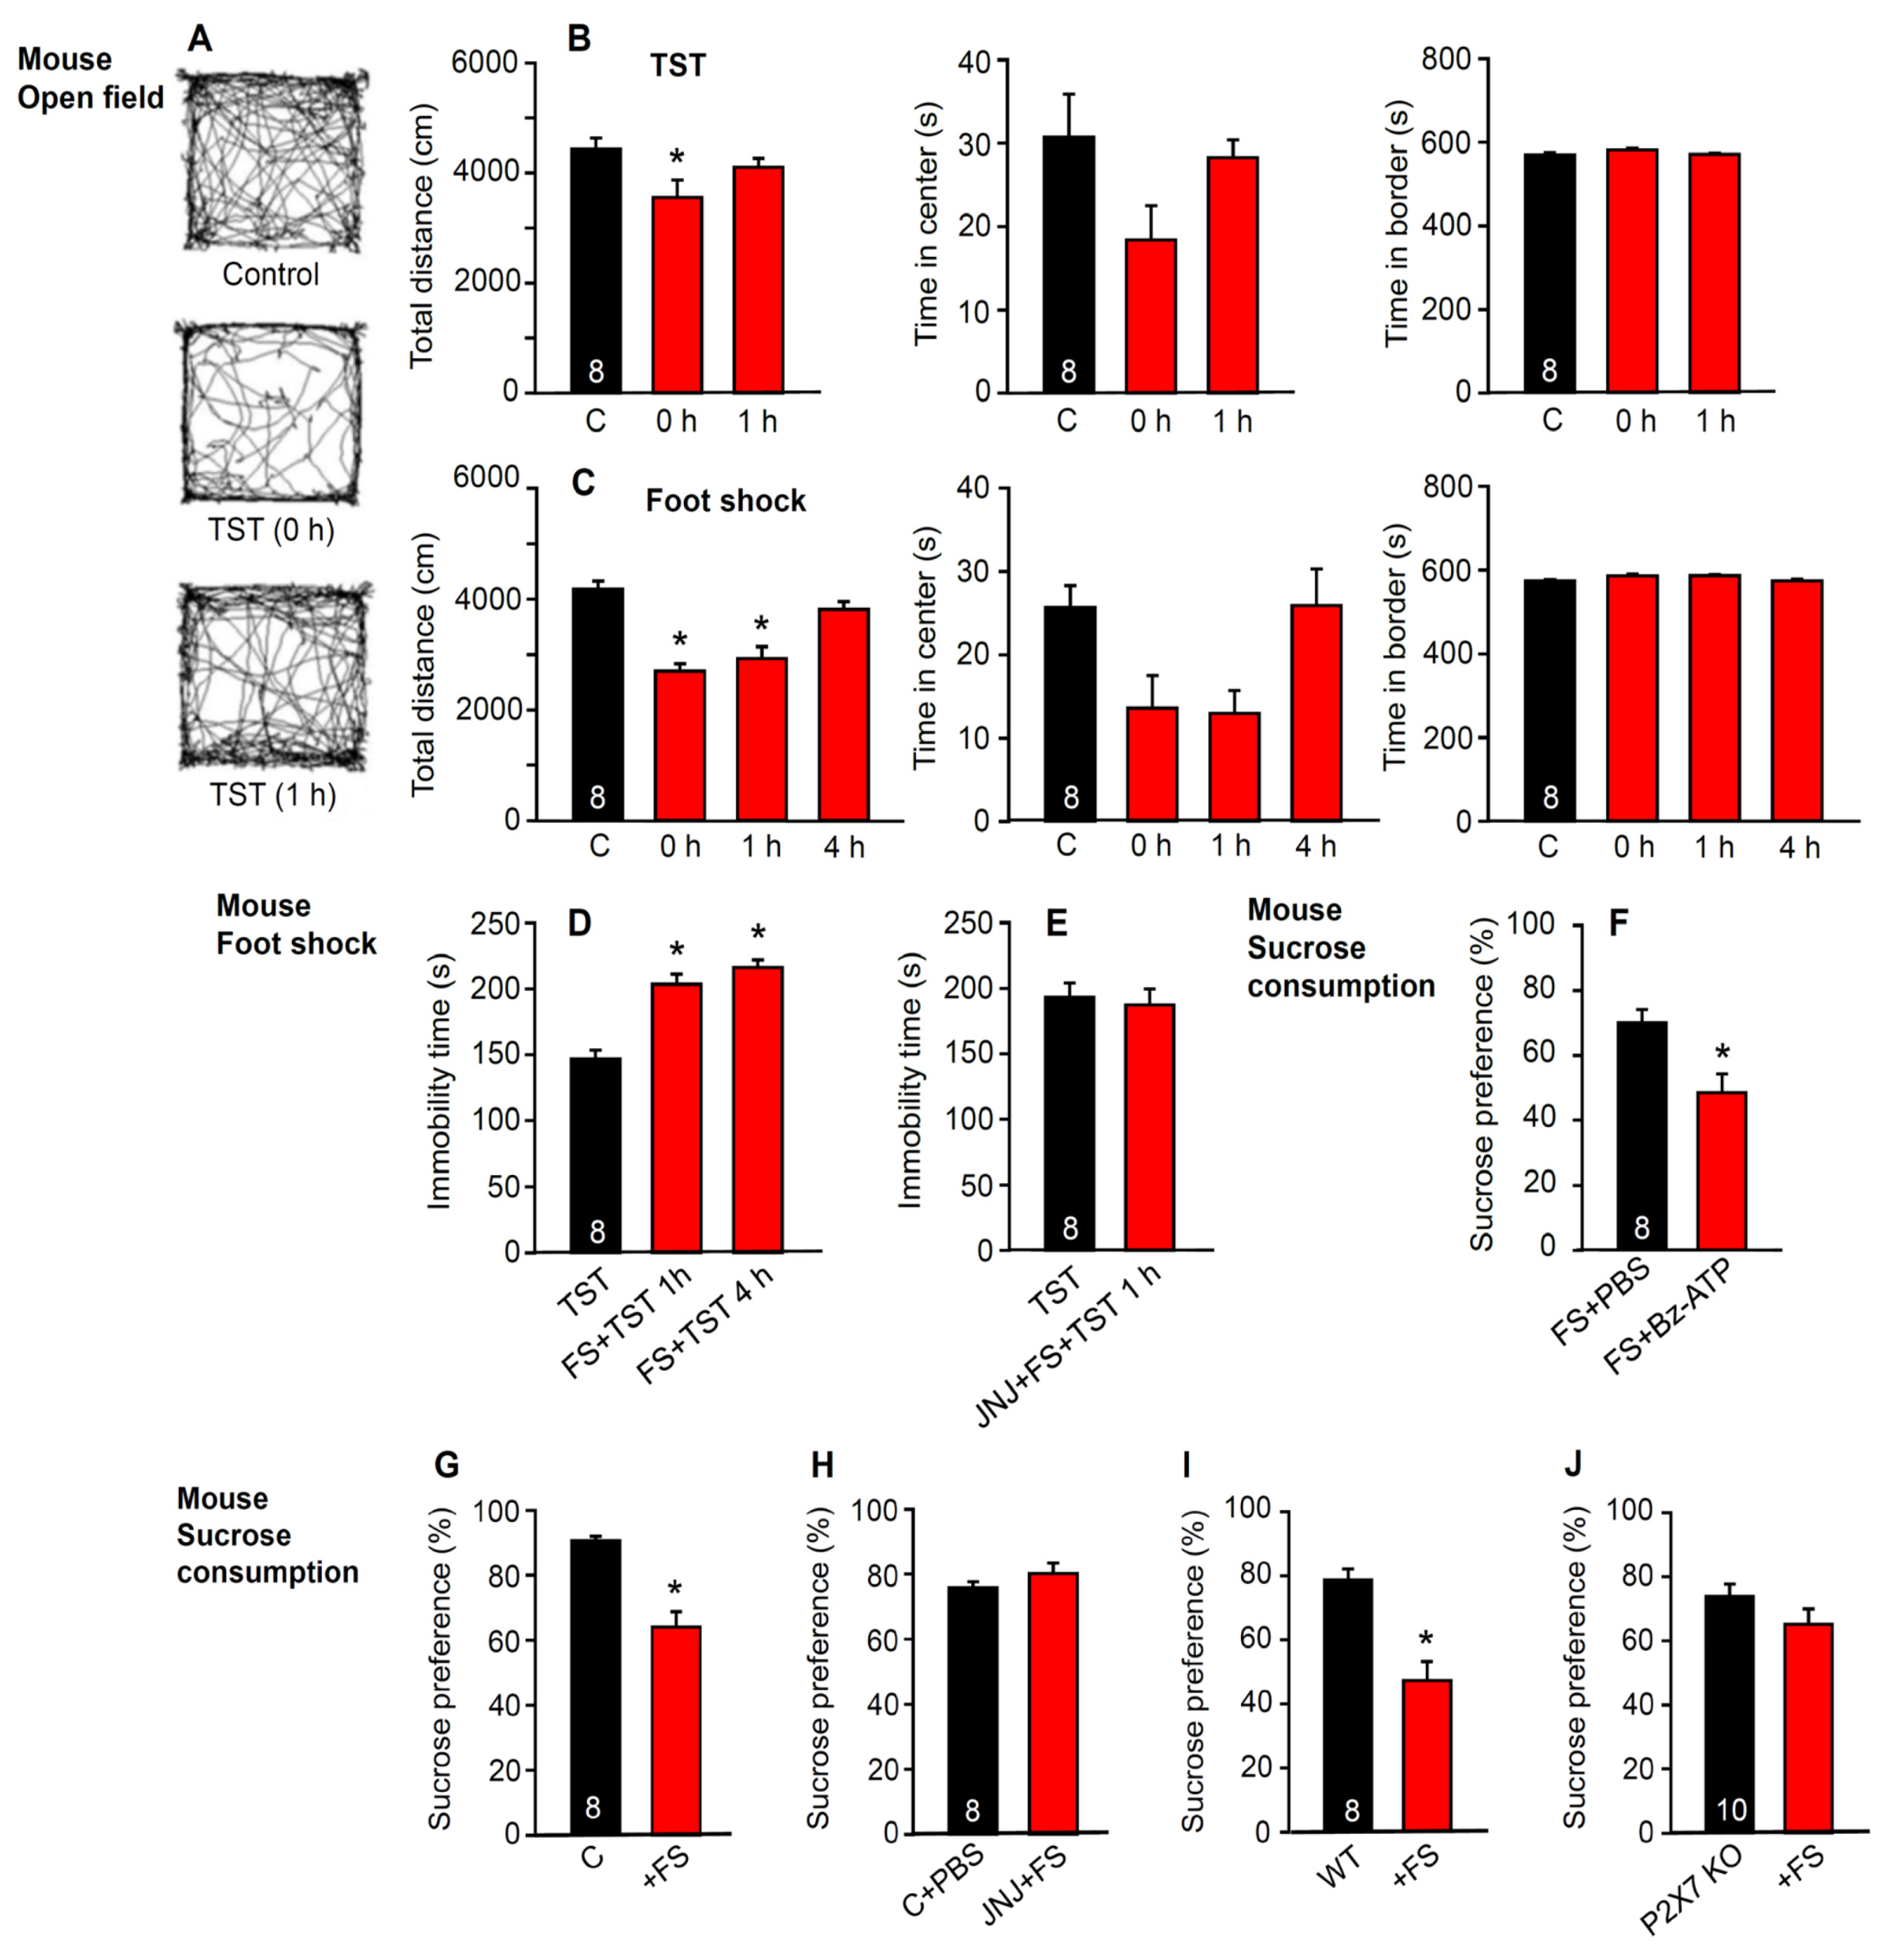
2.1. Involvement of P2X7Rs in Learned Helplessness
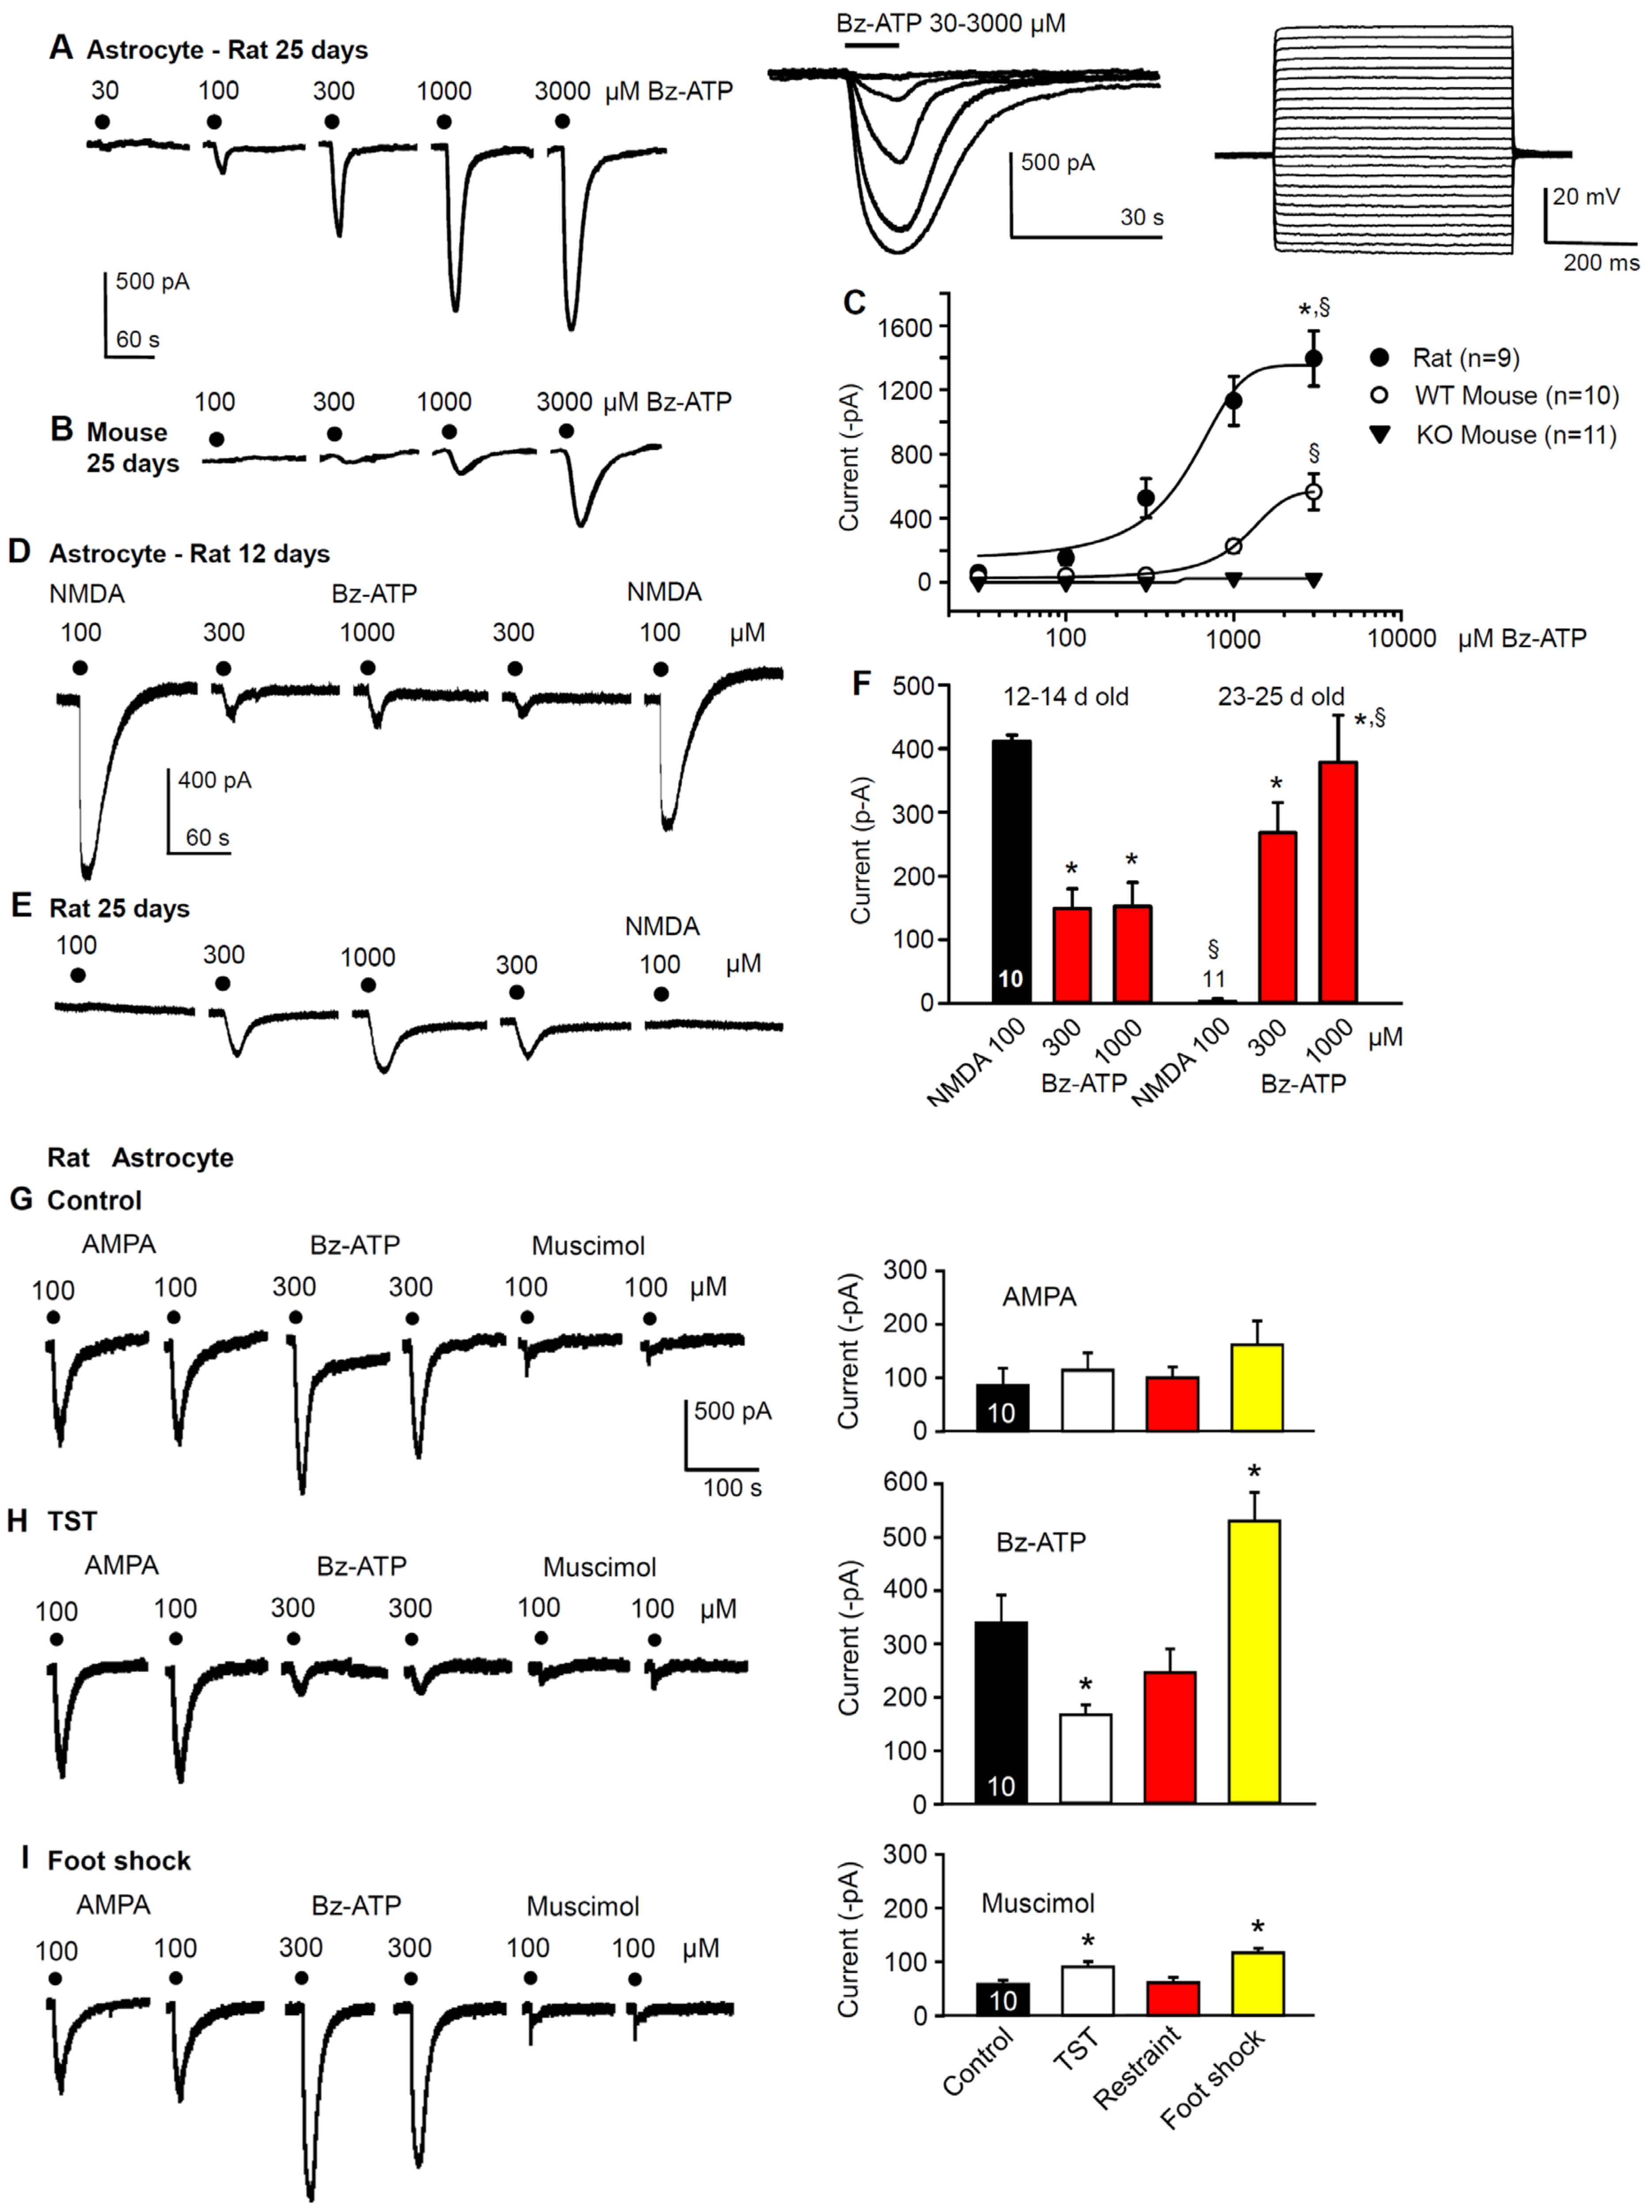
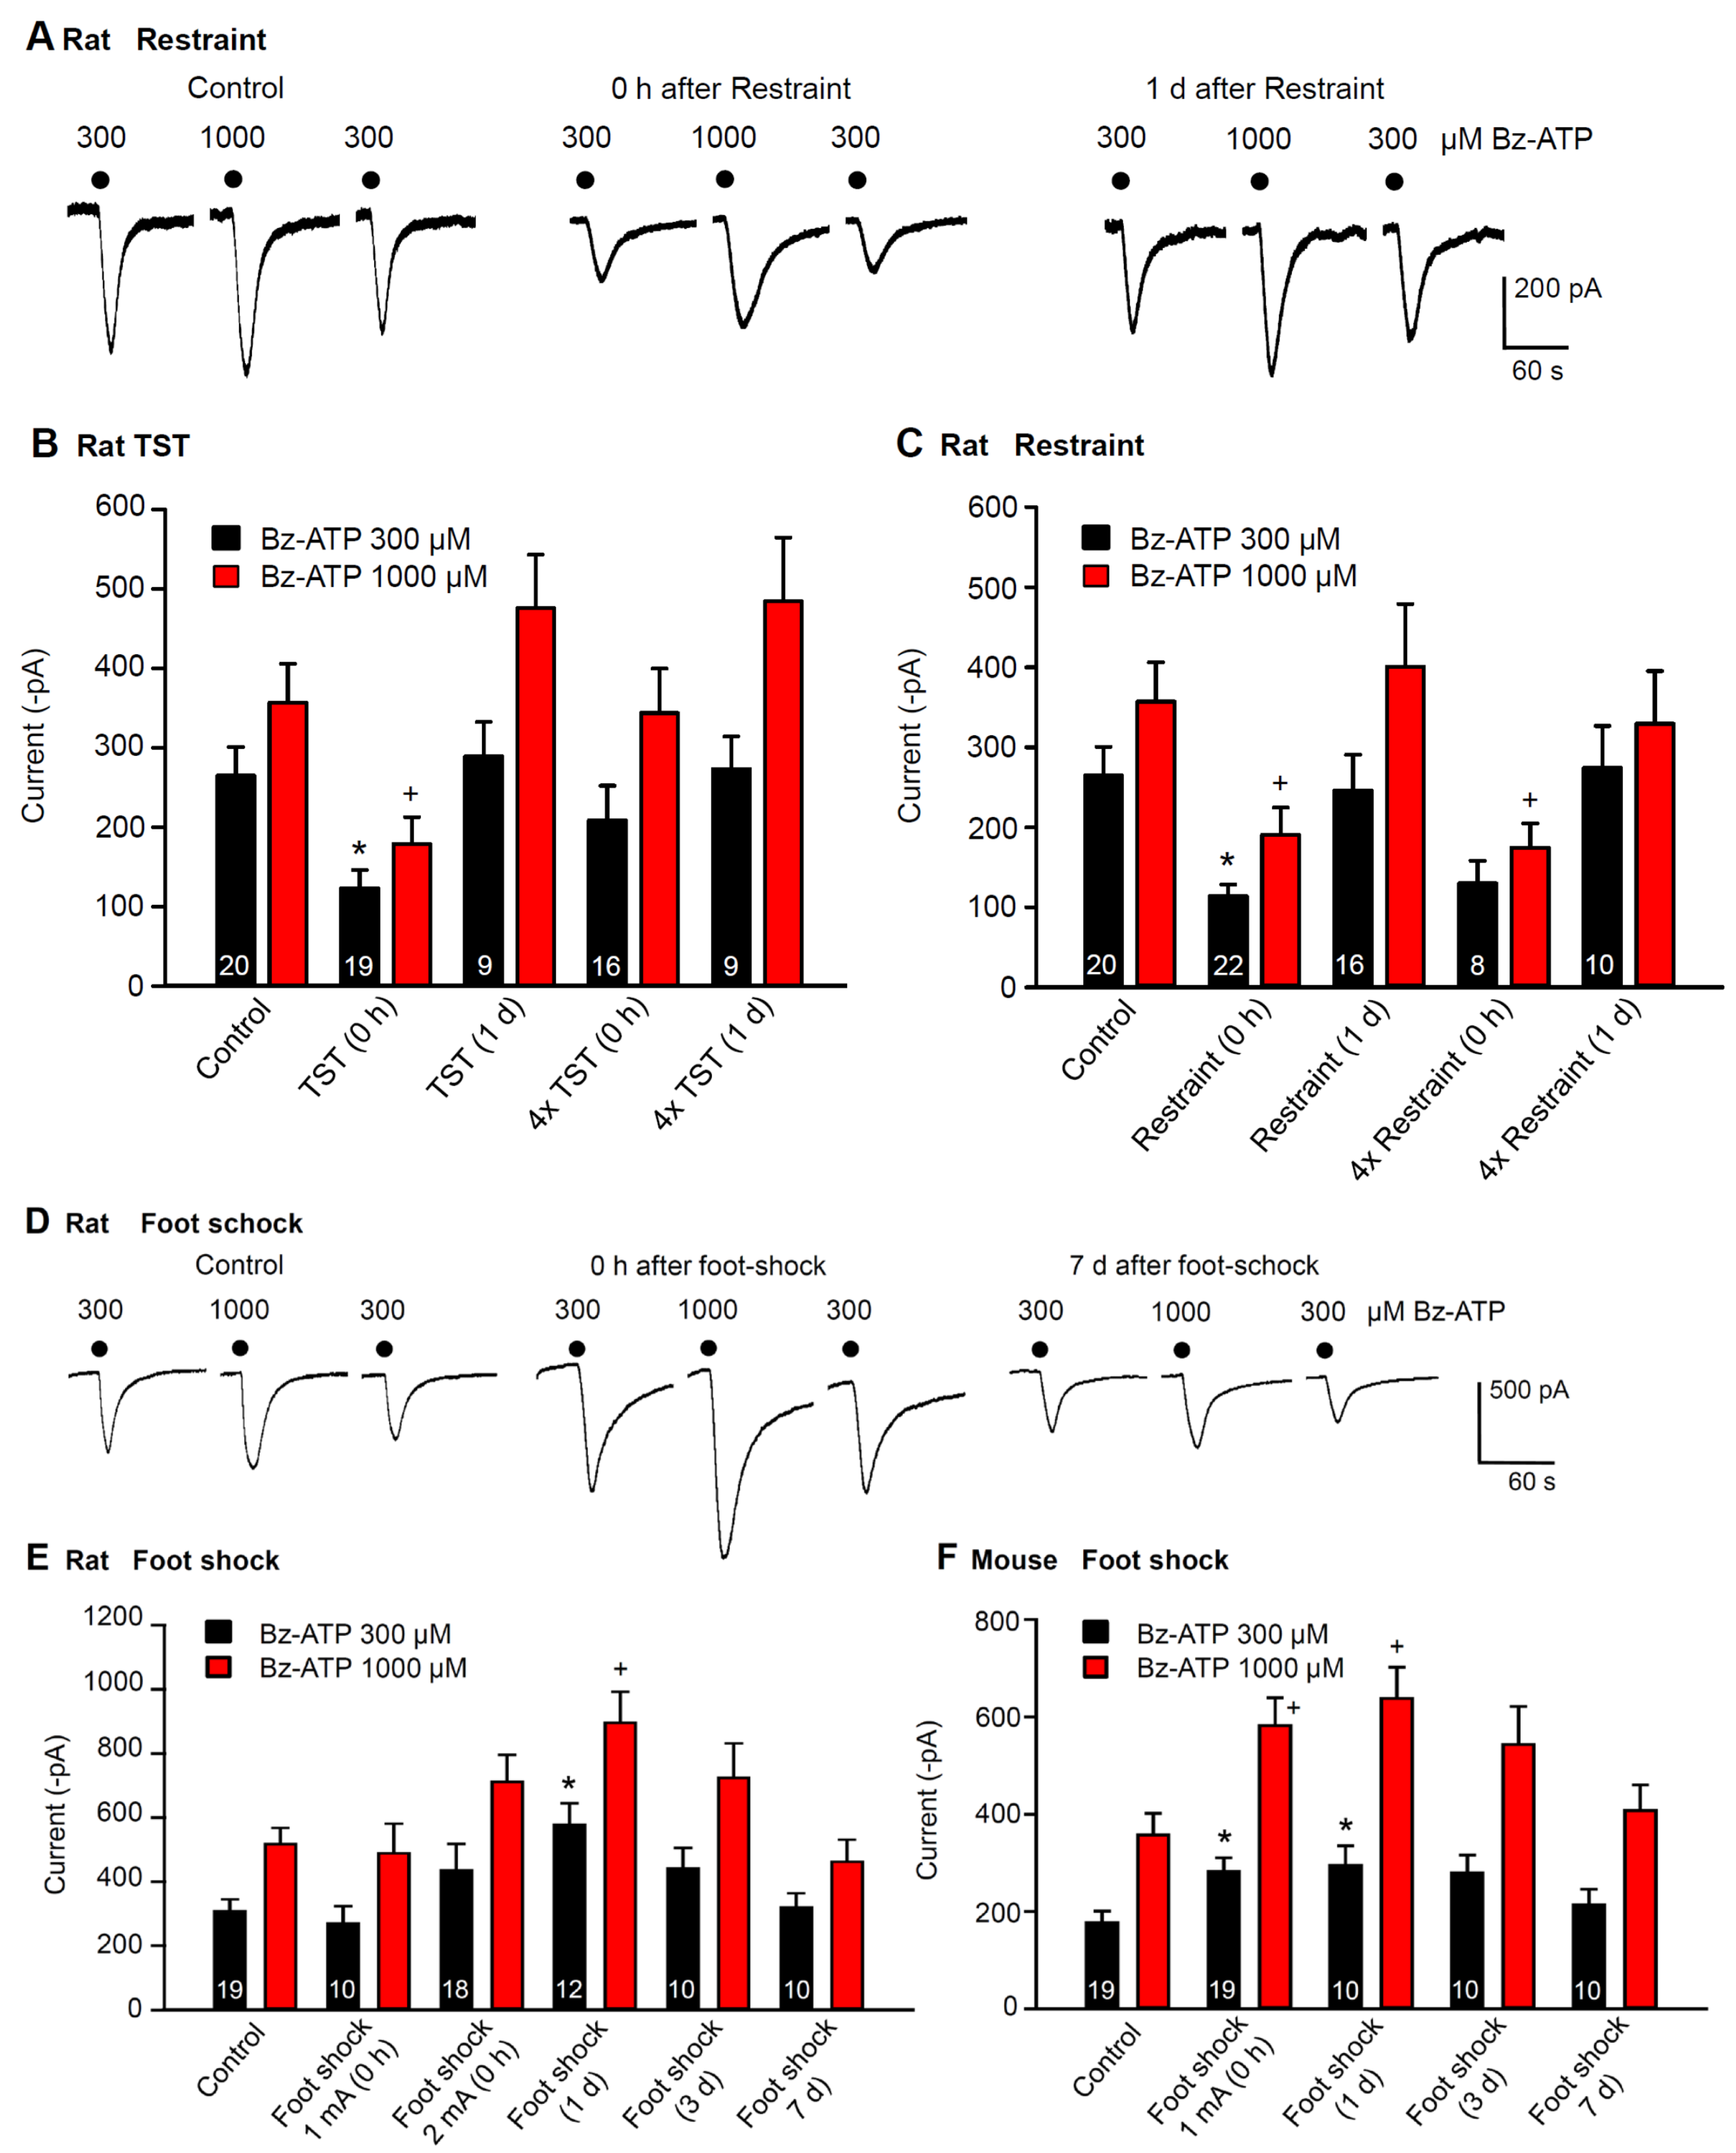
2.2. Immediate Modulation of Astrocytic Functions in the Hippocampus after Stimulation by Stressors
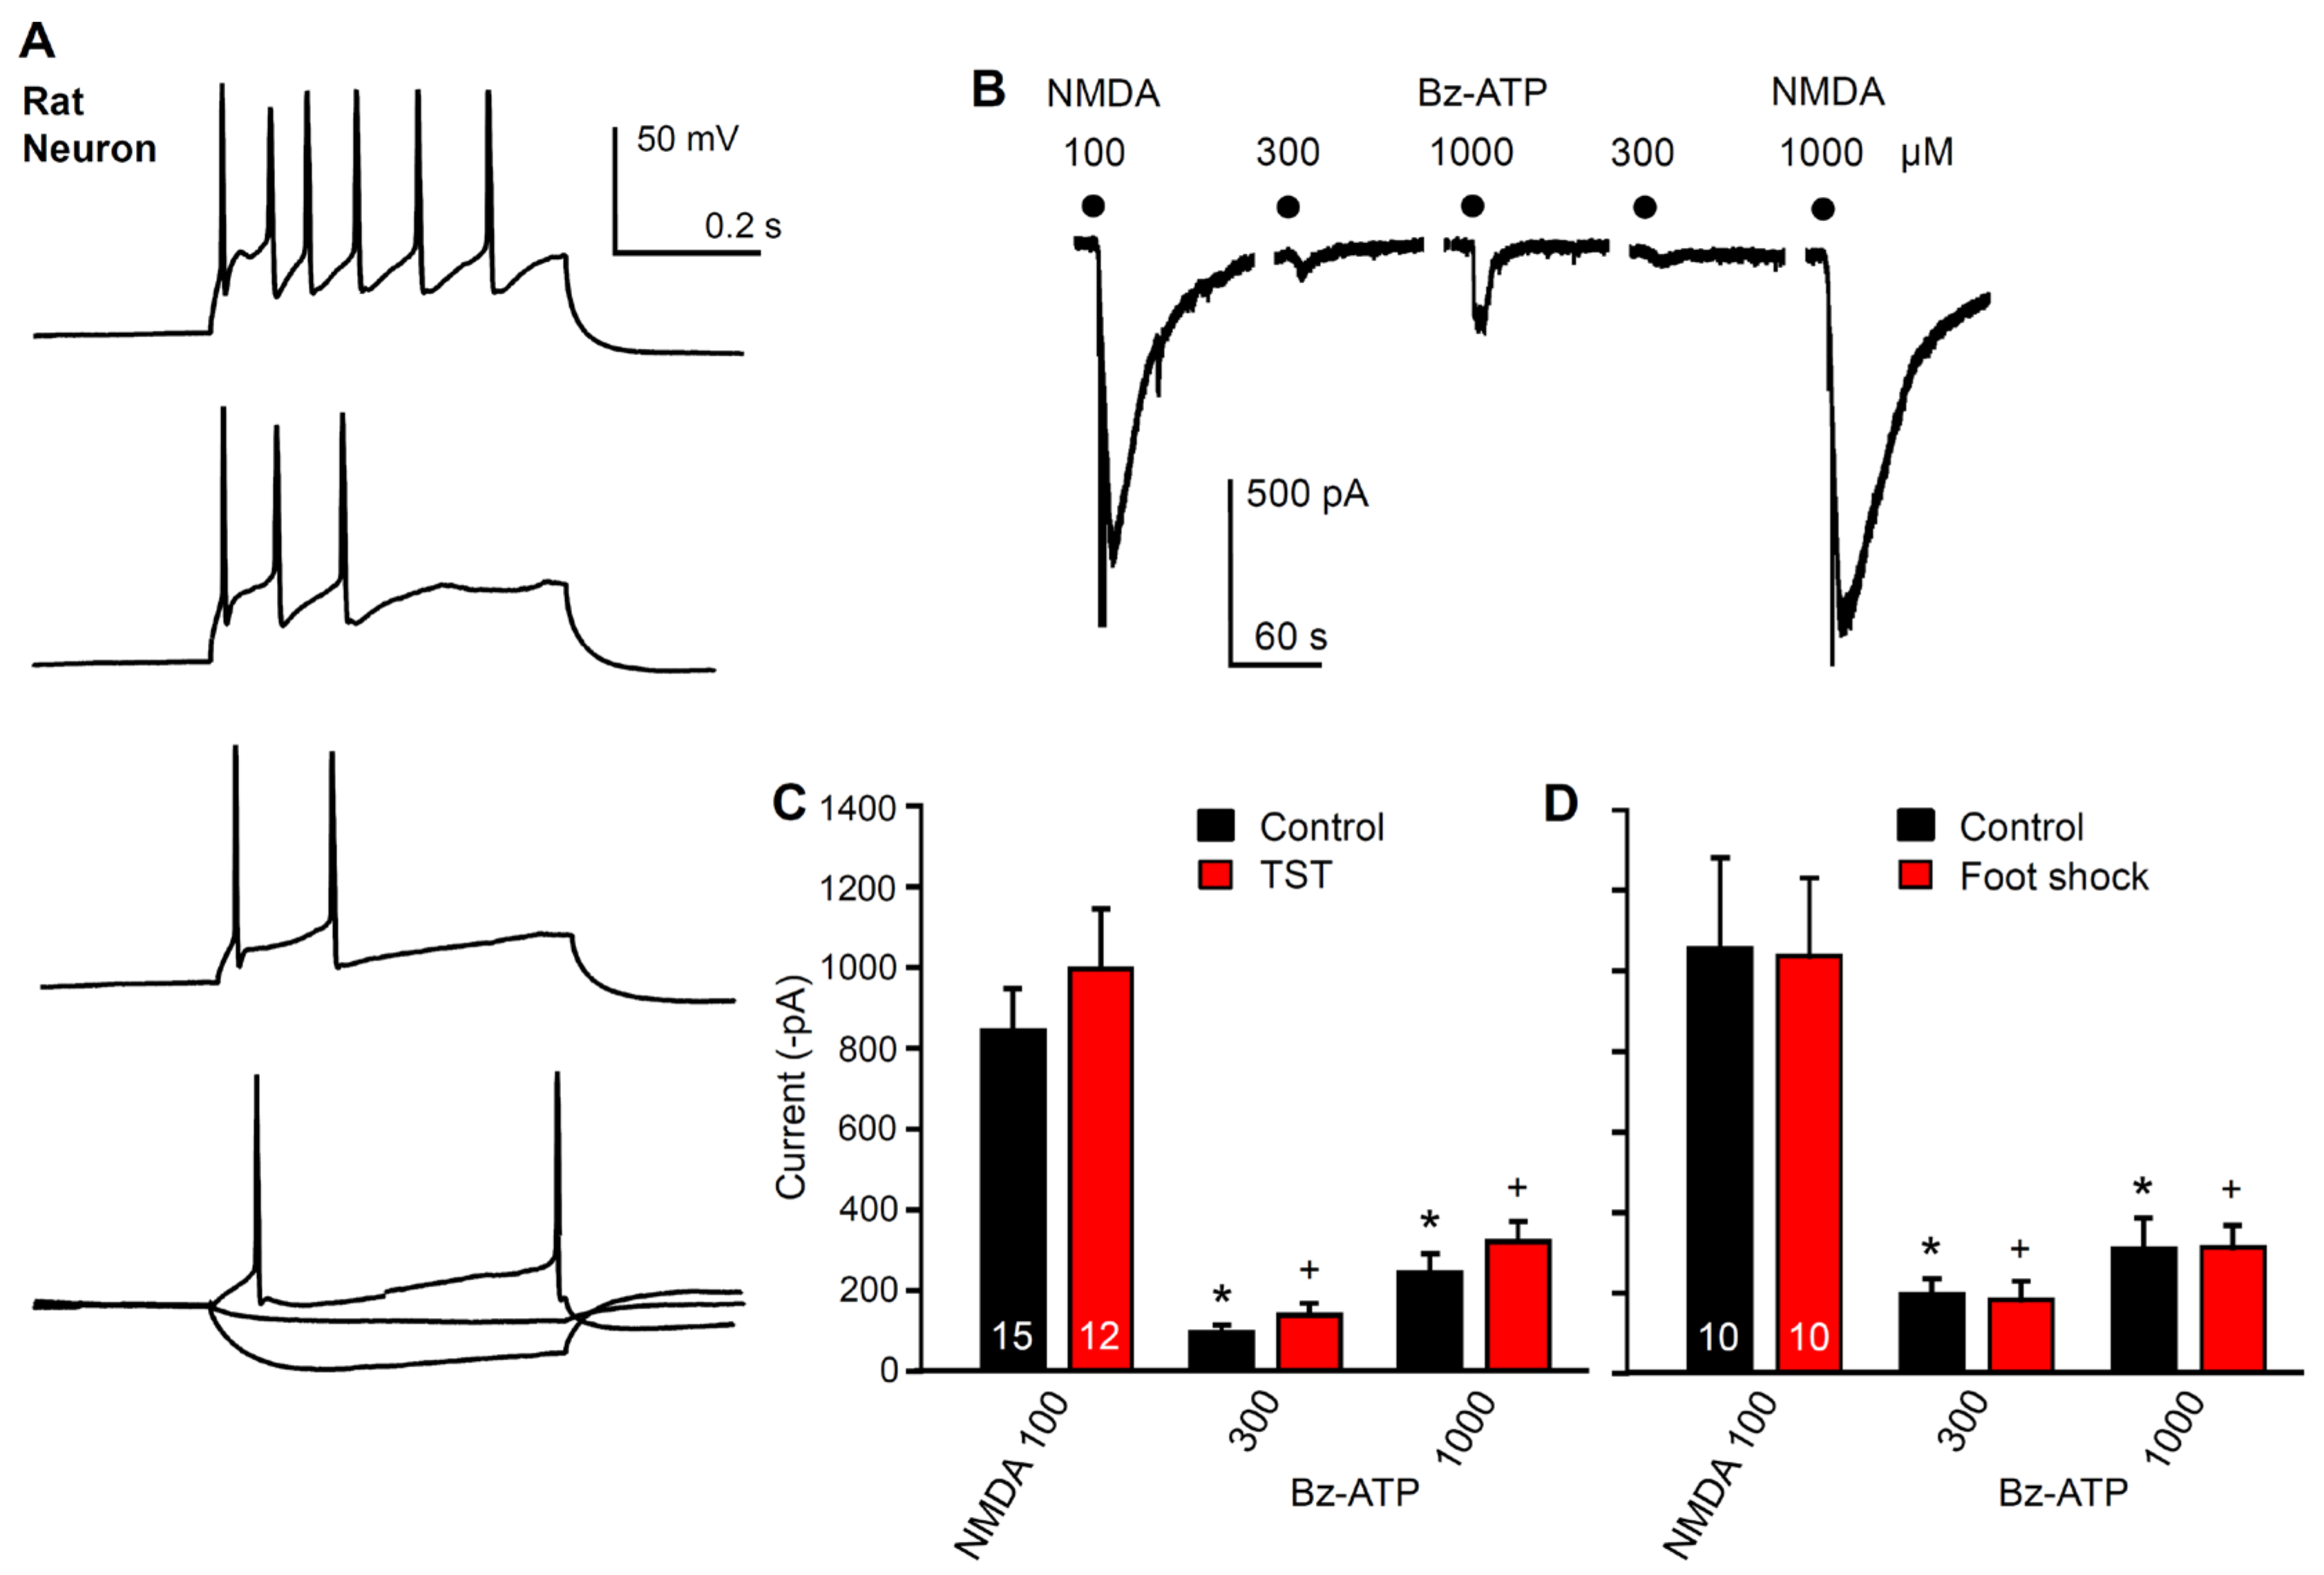
2.3. No Immediate Change in Hippocampal Neuronal Functions after Stimulation by Stressors
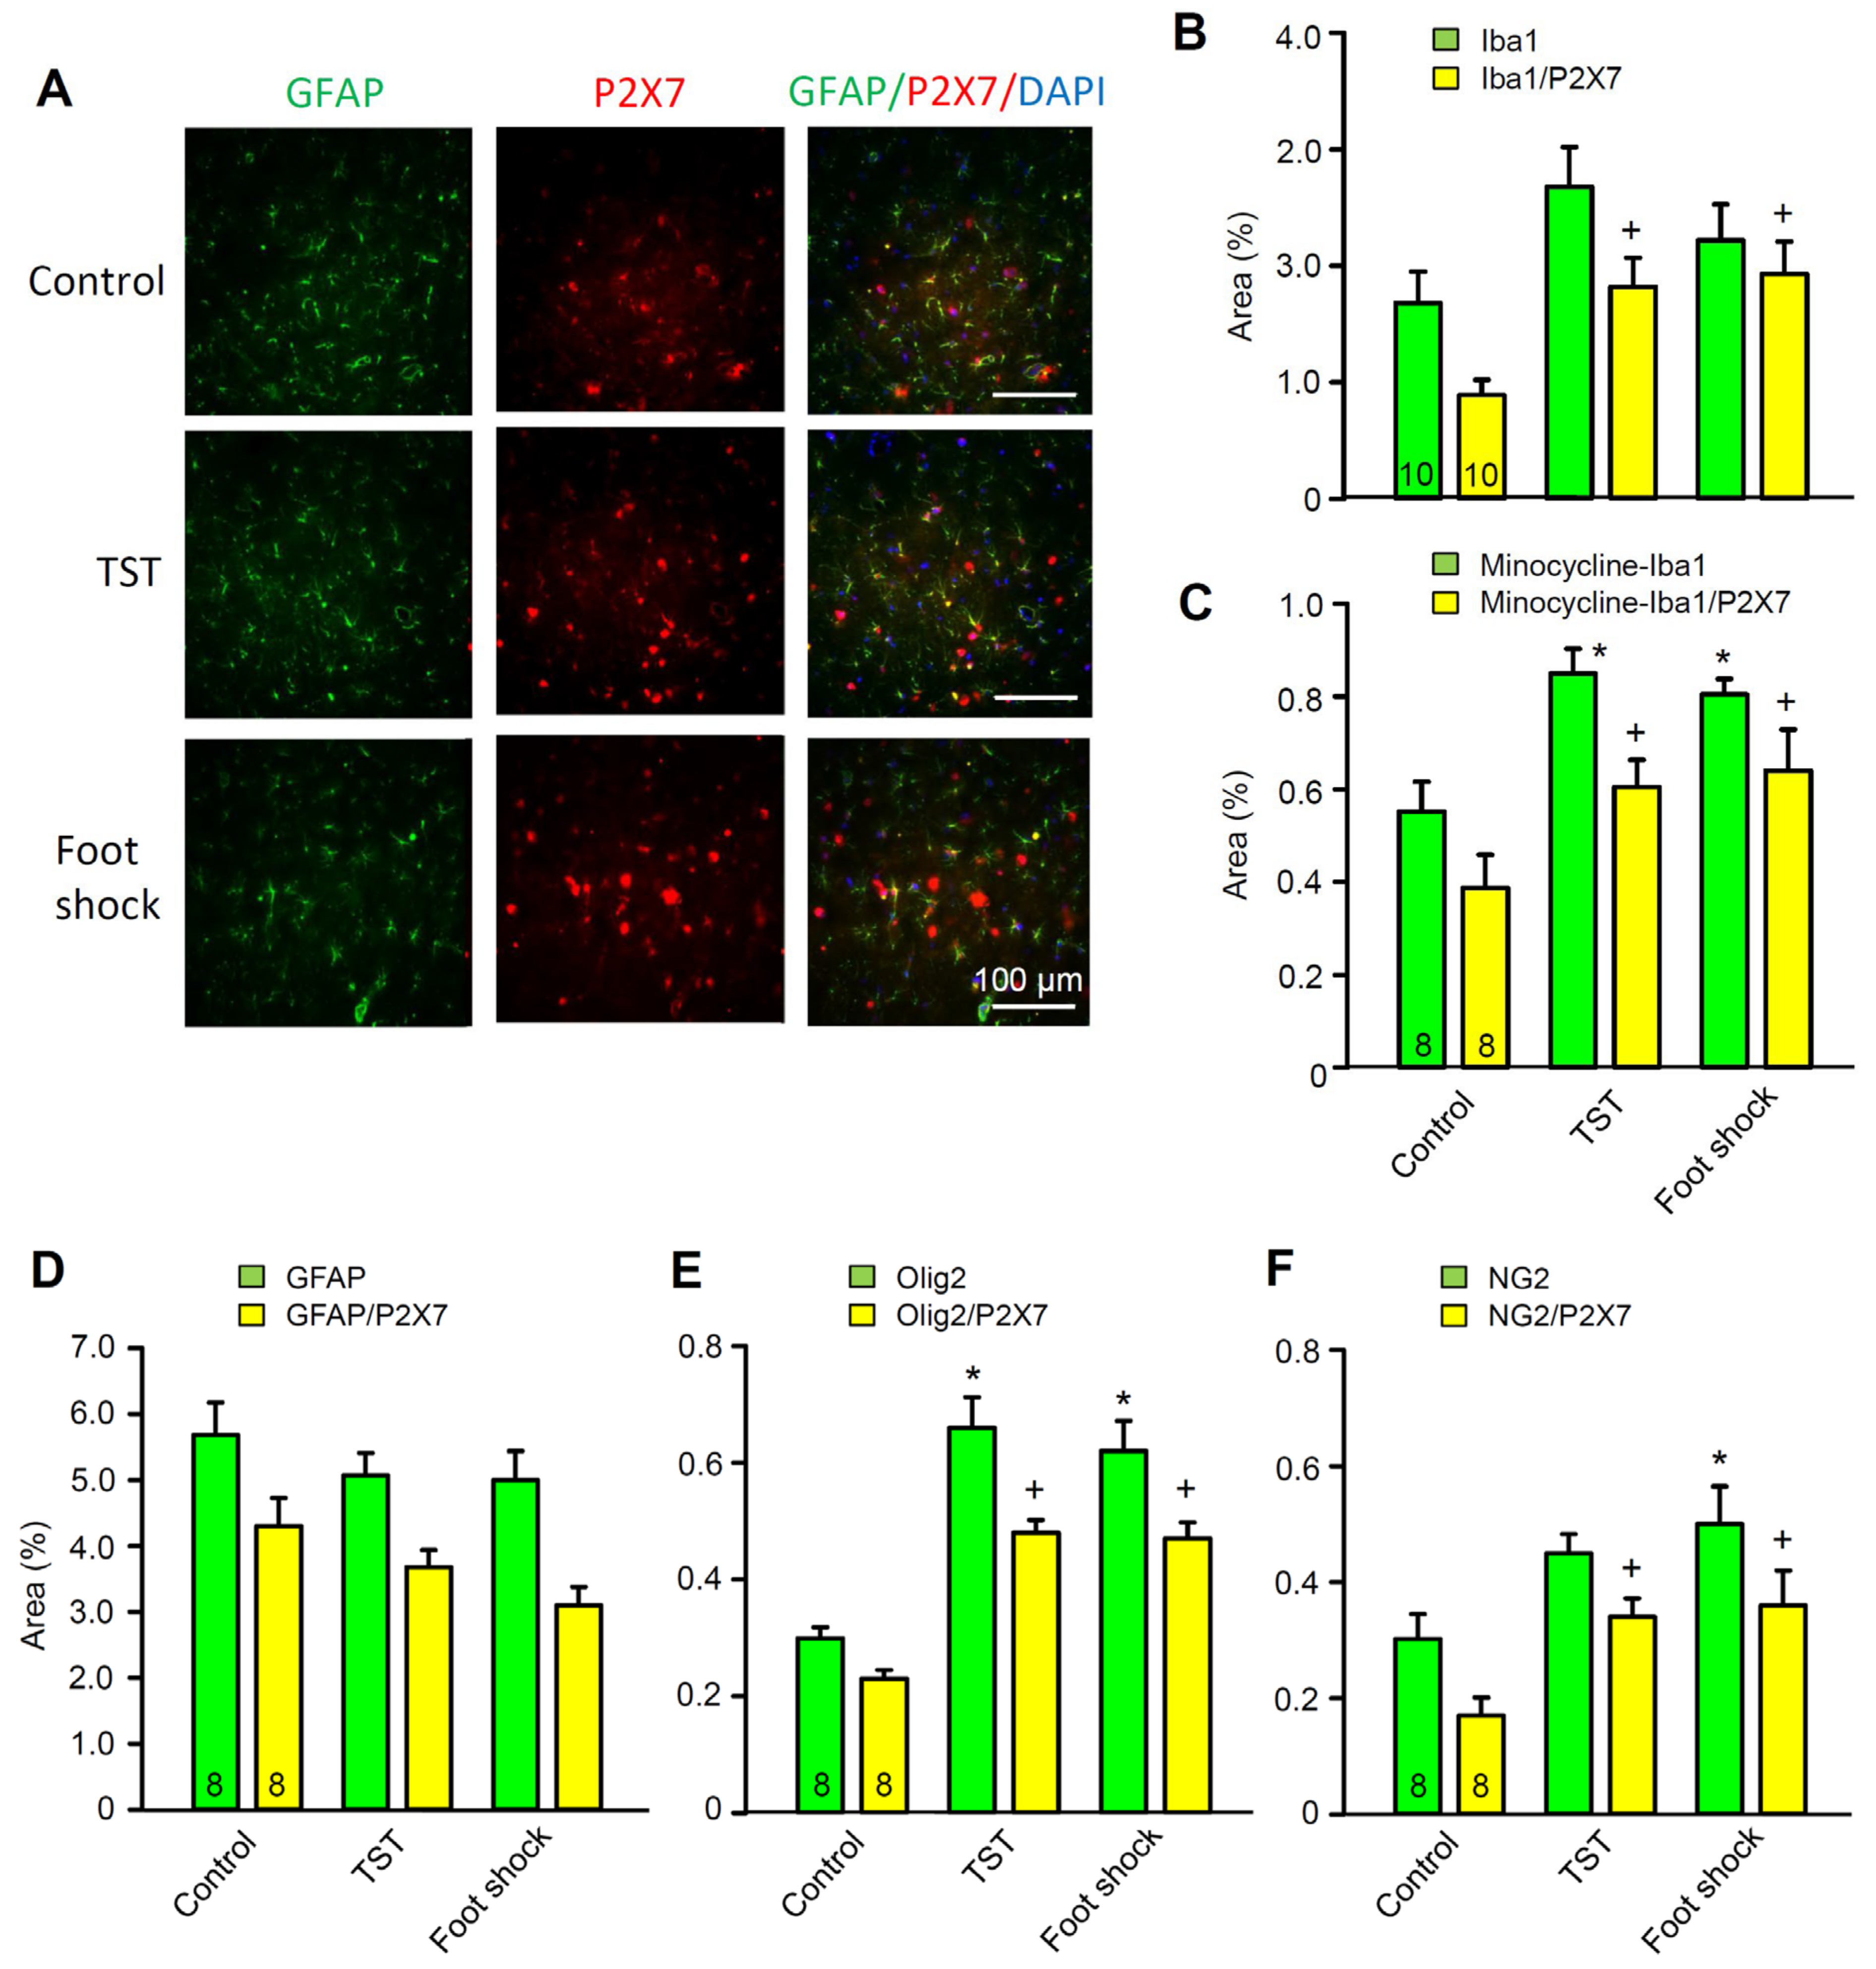
2.4. No Change in the Density of P2X7 Receptor-Immunoreactivity in Hippocampal Astrocytes after Stimulation by Stressors
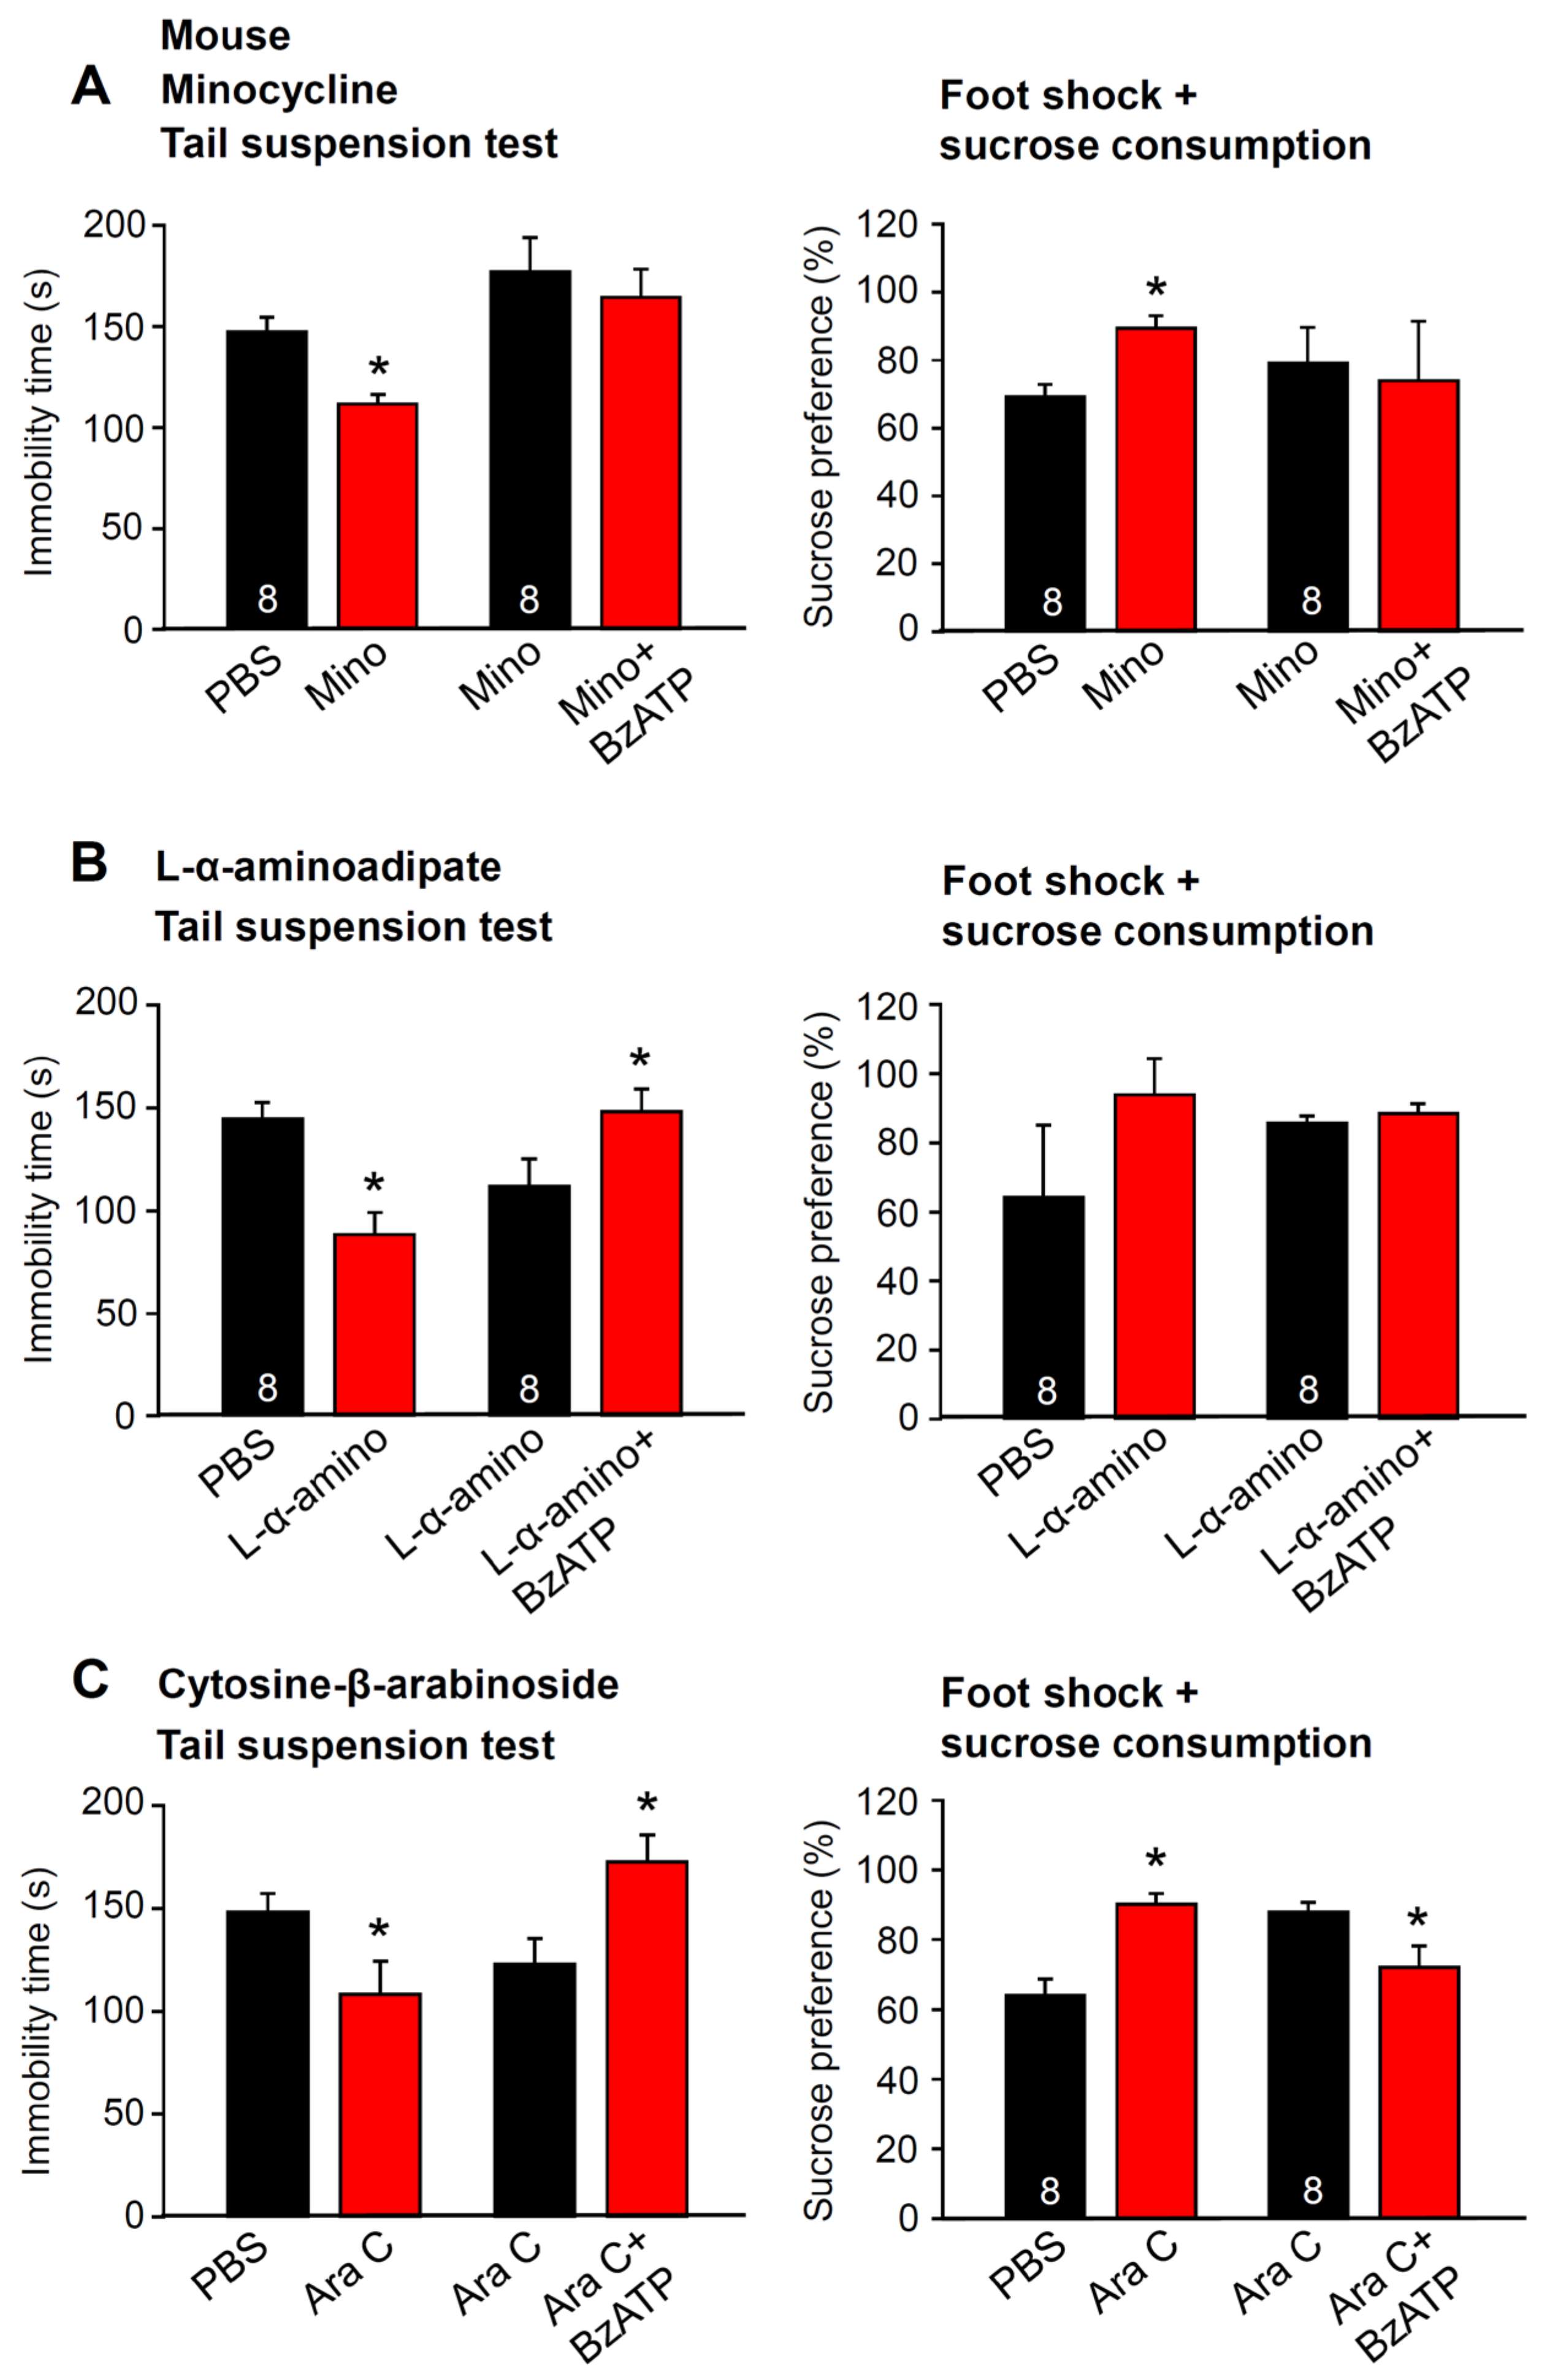
2.5. Metabolic Intoxication of Astrocytes in the Hippocampus Does Not Change the TST-Induced Depressive-Like Behavior
3. Discussion
4. Materials and Methods
4.1. Animals
4.2. Patch Clamp Recordings in Hippocampal Brain Slices
4.3. Behavioral Tests
4.3.1. Tail Suspension Test (TST)
4.3.2. Forced Swim Test (FST)
4.3.3. Inescapable Foot Shock
4.3.4. Open Field Test
4.3.5. Sucrose Preference Test
4.3.6. Unpredictable Chronic Mild Stress (UCMS)
4.4. Stereotaxic Surgery
4.5. Drugs and Microinjections
4.6. Fluorescence Immunohistochemistry
4.7. Data Analysis
Supplementary Materials
Author Contributions
Funding
Institutional Review Board Statement
Informed Consent Statement
Data Availability Statement
Conflicts of Interest
References
- Koenig, J.I.; Walker, C.D.; Romeo, R.D.; Lupien, S.J. Effects of stress across the lifespan. Stress 2011, 14, 475–480. [Google Scholar] [CrossRef] [PubMed]
- Deussing, J.M.; Arzt, E. P2X7 Receptor: A Potential Therapeutic Target for Depression? Trends Mol. Med. 2018, 24, 736–747. [Google Scholar] [CrossRef] [PubMed]
- Burnstock, G. Purinergic signalling and disorders of the central nervous system. Nat. Rev. Drug Discov. 2008, 7, 575–590. [Google Scholar] [CrossRef]
- Khan, M.T.; Deussing, J.; Tang, Y.; Illes, P. Astrocytic rather than neuronal P2X7 receptors modulate the function of the tri-synaptic network in the rodent hippocampus. Brain Res. Bull. 2019, 151, 164–173. [Google Scholar] [CrossRef] [PubMed]
- Illes, P.; Verkhratsky, A.; Tang, Y. Pathological ATPergic Signaling in Major Depression and Bipolar Disorder. Front. Mol. Neurosci. 2019, 12, 331. [Google Scholar] [CrossRef] [PubMed] [Green Version]
- Calzaferri, F.; Ruiz-Ruiz, C.; de Diego, A.M.G.; de Pascual, R.; Mendez-Lopez, I.; Cano-Abad, M.F.; Maneu, V.; de los Ríos, C.; Gandía, A.; García, A.G. The purinergic P2X7 receptor as a potential drug target to combat neuroinflammation in neurodegenerative diseases. Med. Res. Rev. 2020, 40, 2427–2465. [Google Scholar] [CrossRef] [PubMed]
- Bhattacharya, A.; Jones, D.N.C. Emerging role of the P2X7-NLRP3-IL1ß pathway in mood disorders. Psychoneuroendocrinology 2018, 98, 95–100. [Google Scholar] [CrossRef]
- Bhattacharya, A.; Derecki, N.C.; Lovenberg, T.W.; Drevets, W.C. Role of neuro-immunological factors in the pathophysiology of mood disorders. Psychopharmacology 2016, 233, 1623–1636. [Google Scholar] [CrossRef]
- Ribeiro, D.E.; Roncalho, A.L.; Glaser, T.; Ulrich, H.; Wegener, G.; Joca, S. P2X7 Receptor Signaling in Stress and Depression. Int. J. Mol. Sci. 2019, 20, 2778. [Google Scholar] [CrossRef] [Green Version]
- Yin, X.; Guven, N.; Dietis, N. Stress-based animal models of depression: Do we actually know what we are doing? Brain Res. 2016, 1652, 30–42. [Google Scholar] [CrossRef]
- Illes, P.; Rubini, P.; Yin, H.; Tang, Y. Impaired ATP Release from Brain Astrocytes May be a Cause of Major Depression. Neurosci. Bull. 2020, 36, 1281–1284. [Google Scholar] [CrossRef] [PubMed]
- Shin, S.; Kwon, O.; Kang, J.I.; Kwon, S.; Oh, S.; Choi, J.; Kim, C.H.; Kim, D.G. mGluR5 in the nucleus accumbens is critical for promoting resilience to chronic stress. Nat. Neurosci. 2015, 18, 1017–1024. [Google Scholar] [CrossRef] [PubMed]
- Czamara, D.; Müller-Myhsok, B.; Lucae, S. The P2RX7 polymorphism rs2230912 is associated with depression: A meta-analysis. Prog. Neuropsychopharm. Biol. Psychiatry 2018, 82, 272–277. [Google Scholar] [CrossRef] [PubMed]
- Feng, W.P.; Zhang, B.; Li, W.; Liu, J. Lack of association of P2RX7 gene rs2230912 polymorphism with mood disorders: A meta-analysis. PLoS ONE 2014, 9, e88575. [Google Scholar] [CrossRef] [PubMed] [Green Version]
- Metzger, M.W.; Walser, S.M.; Dedic, N.; Aprile-Garcia, F.; Jakubcakova, V.; Adamczyk, M.; Webb, K.J.; Uhr, M.; Refojo, D.; Schmidt, M.V.; et al. Heterozygosity for the Mood Disorder-Associated Variant Gln460Arg Alters P2X7 Receptor Function and Sleep Quality. J. Neurosci. 2017, 37, 11688–11700. [Google Scholar] [CrossRef] [PubMed]
- Kristof, Z.; Eszlari, N.; Sutori, S.; Gal, Z.; Torok, D.; Baksa, D.; Petschner, P.; Sperlagh, B.; Anderson, I.M.; Deakin, J.F.W.; et al. P2RX7 gene variation mediates the effect of childhood adversity and recent stress on the severity of depressive symptoms. PLoS ONE 2021, 16, e0252766. [Google Scholar] [CrossRef]
- Basso, A.M.; Bratcher, N.A.; Harris, R.R.; Jarvis, M.F.; Decker, M.W.; Rueter, L.E. Behavioral profile of P2X7 receptor knockout mice in animal models of depression and anxiety: Relevance for neuropsychiatric disorders. Behav. Brain Res. 2009, 198, 83–90. [Google Scholar] [CrossRef]
- Csölle, C.; Baranyi, M.; Zsilla, G.; Kittel, A.; Gölöncser, F.; Illes, P.; Papp, E.; Vizi, E.S.; Sperlágh, B. Neurochemical Changes in the Mouse Hippocampus Underlying the Antidepressant Effect of Genetic Deletion of P2X7 Receptors. PLoS ONE 2013, 8, e66547. [Google Scholar] [CrossRef] [Green Version]
- Iwata, M.; Ota, K.T.; Li, X.Y.; Sakaue, F.; Li, N.; Dutheil, S.; Banasr, M.; Duric, V.; Yamanashi, T.; Kaneko, K.; et al. Psychological Stress Activates the Inflammasome via Release of Adenosine Triphosphate and Stimulation of the Purinergic Type 2X7 Receptor. Biol. Psychiatry 2016, 80, 12–22. [Google Scholar] [CrossRef]
- Yue, N.; Huang, H.; Zhu, X.; Han, Q.; Wang, Y.; Li, B.; Banasr, M.; Duric, V.; Yamanashi, T.; Kaneko, K.; et al. Activation of P2X7 receptor and NLRP3 inflammasome assembly in hippocampal glial cells mediates chronic stress-induced depressive-like behaviors. J. Neuroinflamm. 2017, 14, 102. [Google Scholar] [CrossRef] [Green Version]
- Farooq, R.K.; Tanti, A.; Ainouche, S.; Roger, S.; Belzung, C.; Camus, V. A P2X7 receptor antagonist reverses behavioural alterations, microglial activation and neuroendocrine dysregulation in an unpredictable chronic mild stress (UCMS) model of depression in mice. Psychoneuroendocrinology 2018, 97, 120–130. [Google Scholar] [CrossRef] [PubMed]
- Aricioglu, F.; Ozkartal, C.S.; Bastaskin, T.; Tüzün, E.; Kandemir, C.; Sirvanci, S.; Kucukali, C.I.; Utkan, T. Antidepressant-like Effects Induced by Chronic Blockade of the Purinergic 2X7 Receptor through Inhibition of Non-like Receptor Protein 1 Inflammasome in Chronic Unpredictable Mild Stress Model of Depression in Rats. Clin. Psychopharmacol. Neurosci. 2019, 17, 261–272. [Google Scholar] [CrossRef] [PubMed]
- Von Muecke-Heim, I.A.; Ries, C.; Urbina, L.; Deussing, J.M. P2X7R antagonists in chronic stress-based depression models: A review. Eur. Arch. Psychiatry Clin. Neurosci. 2021, 271, 1343–1358. [Google Scholar] [CrossRef] [PubMed]
- Ma, M.; Ren, Q.; Zhang, J.C.; Hashimoto, K. Effects of Brilliant Blue G on Serum Tumor Necrosis Factor-alpha Levels and Depression-like Behavior in Mice after Lipopolysaccharide Administration. Clin. Psychopharmacol. Neurosci. 2014, 12, 31–36. [Google Scholar] [CrossRef] [PubMed] [Green Version]
- D’Amico, R.; Fusco, R.; Siracusa, R.; Impellizzeri, D.; Peritore, A.F.; Gugliandolo, E.; Interdonato, L.; Sforza, A.; Crupi, R.; Cuzzocrea, S.; et al. Inhibition of P2X7 Purinergic Receptor Ameliorates Fibromyalgia Syndrome by Suppressing NLRP3 Pathway. Int. J. Mol. Sci. 2021, 22, 6471. [Google Scholar] [CrossRef]
- Bhattacharya, A.; Wang, Q.; Ao, H.; Shoblock, J.R.; Lord, B.; Aluisio, L.; Fraser, I.; Nepomuceno, D.A.; Neff, R.; Welty, N.; et al. Pharmacological characterization of a novel centrally permeable P2X7 receptor antagonist: JNJ-47965567. Br. J. Pharmacol. 2013, 170, 624–640. [Google Scholar] [CrossRef] [PubMed] [Green Version]
- Lord, B.; Aluisio, L.; Shoblock, J.R.; Neff, R.A.; Varlinskaya, E.I.; Ceusters, M.; Lovenberg, T.W.; Carruthers, N.; Bonaventure, P.; Letavic, M.A.; et al. Pharmacology of a novel central nervous system-penetrant P2X7 antagonist JNJ-42253432. J. Pharmacol. Exp. Ther. 2014, 351, 628–641. [Google Scholar] [CrossRef] [Green Version]
- Banasr, M.; Duman, R.S. Glial loss in the prefrontal cortex is sufficient to induce depressive-like behaviors. Biol. Psychiatry 2008, 64, 863–870. [Google Scholar] [CrossRef] [Green Version]
- Rial, D.; Lemos, C.; Pinheiro, H.; Duarte, J.M.; Goncalves, F.Q.; Real, J.I.; Prediger, R.D.; Gonçalves, N.; Gomes, C.A.; Canas, P.M.; et al. Depression as a Glial-Based Synaptic Dysfunction. Front. Cell Neurosci. 2015, 9, 521. [Google Scholar] [CrossRef] [Green Version]
- Stokes, L.; Spencer, S.J.; Jenkins, T.A. Understanding the role of P2X7 in affective disorders-are glial cells the major players? Front. Cell. Neurosci. 2015, 9, 258. [Google Scholar] [CrossRef] [Green Version]
- Illes, P.; Khan, T.M.; Rubini, P. Neuronal P2X7 Receptors Revisited: Do They Really Exist? J. Neurosci. 2017, 37, 7049–7062. [Google Scholar] [CrossRef] [PubMed]
- Kaczmarek-Hajek, K.; Zhang, J.; Kopp, R.; Grosche, A.; Rissiek, B.; Saul, A.; Bruzzone, S.; Engel, T.; Jooss, T.; Krautloher, A.; et al. Re-evaluation of neuronal P2X7 expression using novel mouse models and a P2X7-specific nanobody. Elife 2018, 7, 7. [Google Scholar] [CrossRef] [PubMed]
- Rajkowska, G.; Stockmeier, C.A. Astrocyte pathology in major depressive disorder: Insights from human postmortem brain tissue. Curr. Drug Targets 2013, 14, 1225–1236. [Google Scholar] [CrossRef] [PubMed] [Green Version]
- Cao, X.; Li, L.P.; Wang, Q.; Wu, Q.; Hu, H.H.; Zhang, M.; Fang, Y.-Y.; Zhang, J.; Li, S.-J.; Xiong, W.-C.; et al. Astrocyte-derived ATP modulates depressive-like behaviors. Nat. Med. 2013, 19, 773–777. [Google Scholar] [CrossRef] [PubMed]
- Ma, J.; Qi, X.; Yang, C.; Pan, R.; Wang, S.; Wu, J.; Li, H.; Hong, C.; Oong, W.; Yajin, L.; et al. Calhm2 governs astrocytic ATP releasing in the development of depression-like behaviors. Mol. Psychiatry 2018, 23, 883–891. [Google Scholar]
- Godsil, B.P.; Kiss, J.P.; Spedding, M.; Jay, T.M. The hippocampal-prefrontal pathway: The weak link in psychiatric disorders? Eur. Neuropsychopharm. 2013, 23, 1165–1181. [Google Scholar] [CrossRef]
- Mantella, R.C.; Butters, M.A.; Dew, M.A.; Mulsant, B.H.; Begley, A.E.; Tracey, B.; Shear, M.K.; Reynolds, C.F.; Lenze, E.J. Cognitive impairment in late-life generalized anxiety disorder. Am. J. Geriatr. Psychiatry 2007, 15, 673–679. [Google Scholar] [CrossRef]
- Porter, R.J.; Gallagher, P.; Thompson, J.M.; Young, A.H. Neurocognitive impairment in drug-free patients with major depressive disorder. Br. J. Psychiatry 2003, 182, 214–220. [Google Scholar] [CrossRef]
- Joels, M.; Verkuyl, J.M.; Van, R.E. Hippocampal and hypothalamic function after chronic stress. Ann. N. Y. Acad. Sci. 2003, 1007, 367–378. [Google Scholar] [CrossRef]
- Wang, Y.L.; Han, Q.Q.; Gong, W.Q.; Pan, D.H.; Wang, L.Z.; Hu, W.; Yang, M.; Li, B.; Yu, J.; Liu, Q. Microglial activation mediates chronic mild stress-induced depressive- and anxiety-like behavior in adult rats. J. Neuroinflamm. 2018, 15, 21. [Google Scholar] [CrossRef] [Green Version]
- Seifert, G.; Steinhäuser, C. Heterogeneity and function of hippocampal macroglia. Cell Tissue Res. 2018, 373, 653–670. [Google Scholar] [CrossRef] [PubMed]
- Bedner, P.; Jabs, R.; Steinhäuser, C. Properties of human astrocytes and NG2 glia. Glia 2020, 68, 756–767. [Google Scholar] [CrossRef] [PubMed]
- Boucher, A.A.; Arnold, J.C.; Hunt, G.E.; Spiro, A.; Spencer, J.; Brown, C.; Mcgregor, I.; Bennett, M.; Kassiou, M. Resilience and reduced c-Fos expression in P2X7 receptor knockout mice exposed to repeated forced swim test. Neuroscience 2011, 189, 170–177. [Google Scholar] [CrossRef]
- Metzger, M.W.; Walser, S.M.; Aprile-Garcia, F.; Dedic, N.; Chen, A.; Holsboer, F.; Arzt, E.; Wurst, W.; Deussing, J.M. Genetically dissecting P2rx7 expression within the central nervous system using conditional humanized mice. Purinergic Signal. 2017, 13, 153–170. [Google Scholar] [CrossRef] [Green Version]
- Sperlagh, B.; Illes, P. P2X7 receptor: An emerging target in central nervous system diseases. Trends Pharmacol. Sci. 2014, 35, 537–547. [Google Scholar] [CrossRef] [PubMed]
- Jimenez-Mateos, E.M.; Smith, J.; Nicke, A.; Engel, T. Regulation of P2X7 receptor expression and function in the brain. Brain Res. Bull. 2019, 151, 153–163. [Google Scholar] [CrossRef] [PubMed]
- Adriouch, S.; Dox, C.; Welge, V.; Seman, M.; Koch-Nolte, F.; Haag, F. Cutting edge: A natural P451L mutation in the cytoplasmic domain impairs the function of the mouse P2X7 receptor. J. Immunol. 2002, 169, 4108–4112. [Google Scholar] [CrossRef] [Green Version]
- Zhang, Y.; Liu, L.; Liu, Y.Z.; Shen, X.L.; Wu, T.Y.; Zhang, T.; Wang, W.; Wang, Y.-X.; Jiang, C.-L. NLRP3 Inflammasome Mediates Chronic Mild Stress-Induced Depression in Mice via Neuroinflammation. Int. J. Neuropsychopharmacol. 2015, 18, pyv006. [Google Scholar] [CrossRef]
- Stockmeier, C.A.; Mahajan, G.J.; Konick, L.C.; Overholser, J.C.; Jurjus, G.J.; Meltzer, H.Y.; Uylings, H.B.; Friedman, L.; Rajkowska, G. Cellular changes in the postmortem hippocampus in major depression. Biol. Psychiatry 2004, 56, 640–650. [Google Scholar] [CrossRef] [Green Version]
- Peng, L.; Verkhratsky, A.; Gu, L.; Li, B. Targeting astrocytes in major depression. Expert. Rev. Neurother. 2015, 15, 1299–1306. [Google Scholar] [CrossRef]
- Halassa, M.M.; Haydon, P.G. Integrated brain circuits: Astrocytic networks modulate neuronal activity and behavior. Annu. Rev. Physiol. 2010, 72, 335–355. [Google Scholar] [CrossRef] [PubMed] [Green Version]
- Papouin, T.; Dunphy, J.; Tolman, M.; Foley, J.C.; Haydon, P.G. Astrocytic control of synaptic function. Philos. Trans. R. Soc. Lond. B Biol. Sci. 2017, 372, 20160154. [Google Scholar] [CrossRef] [PubMed] [Green Version]
- Kinoshita, M.; Hirayama, Y.; Fujishita, K.; Shibata, K.; Shinozaki, Y.; Shigetomi, E.; Takeda, A.; Le, H.P.N.; Hayashi, H.; Hiasa, M.; et al. Anti-Depressant Fluoxetine Reveals its Therapeutic Effect Via Astrocytes. EBioMedicine 2018, 32, 72–83. [Google Scholar] [CrossRef] [PubMed]
- Ren, Q.; Wang, Z.Z.; Chu, S.F.; Xia, C.Y.; Chen, N.H. Gap junction channels as potential targets for the treatment of major depressive disorder. Psychopharmacology 2018, 235, 1–12. [Google Scholar] [CrossRef]
- Verkhratsky, A.; Zorec, R.; Parpura, V. Stratification of astrocytes in healthy and diseased brain. Brain Pathol. 2017, 27, 629–644. [Google Scholar] [CrossRef] [PubMed]
- Mederos, S.; Gonzalez-Arias, C.; Perea, G. Astrocyte-Neuron Networks: A Multilane Highway of Signaling for Homeostatic Brain Function. Front. Synaptic Neurosci. 2018, 10, 45. [Google Scholar] [CrossRef] [PubMed] [Green Version]
- Illes, P.; Burnstock, G.; Tang, Y. Astroglia-Derived ATP Modulates CNS Neuronal Circuits. Trends Neurosci. 2019, 42, 885–898. [Google Scholar] [CrossRef] [PubMed]
- Araque, A.; Parpura, V.; Sanzgiri, R.P.; Haydon, P.G. Tripartite synapses: Glia, the unacknowledged partner. Trends Neurosci. 1999, 22, 208–215. [Google Scholar] [CrossRef]
- Cheung, G.; Chever, O.; Rouach, N. Connexons and pannexons: Newcomers in neurophysiology. Front. Cell Neurosci. 2014, 8, 348. [Google Scholar] [CrossRef] [PubMed] [Green Version]
- Dahl, G. ATP release through pannexon channels. Philos. Trans. R. Soc. Lond. B Biol. Sci. 2015, 370, 20140191. [Google Scholar] [CrossRef]
- Ficker, C.; Rozmer, K.; Kato, E.; Ando, R.D.; Schumann, L.; Krügel, U.; Franke, H.; Sperlágh, B.; Riedel, T.; Illes, P. Astrocyte-neuron interaction in the substantia gelatinosa of the spinal cord dorsal horn via P2X7 receptor-mediated release of glutamate and reactive oxygen species. Glia 2014, 62, 1671–1686. [Google Scholar] [CrossRef] [PubMed] [Green Version]
- Zhao, Y.F.; Tang, Y.; Illes, P. Astrocytic and Oligodendrocytic P2X7 Receptors Determine Neuronal Functions in the CNS. Front. Mol. Neurosci. 2021, 14, 641570. [Google Scholar] [CrossRef] [PubMed]
- Miras-Portugal, M.T.; Sebastian-Serrano, A.; de Diego, G.L.; Daz-Hernandez, M. Neuronal P2X7 Receptor: Involvement in Neuronal Physiology and Pathology. J. Neurosci. 2017, 37, 7063–7072. [Google Scholar] [CrossRef] [PubMed] [Green Version]
- Hajszan, T.; Dow, A.; Warner-Schmidt, J.L.; Szigeti-Buck, K.; Sallam, N.L.; Parducz, A.; Leranth, C.; Duman, R.S. Remodeling of hippocampal spine synapses in the rat learned helplessness model of depression. Biol. Psychiatry 2009, 65, 392–400. [Google Scholar] [CrossRef] [Green Version]
- Kang, H.J.; Voleti, B.; Hajszan, T.; Rajkowska, G.; Stockmeier, C.A.; Licznerski, P.; Lepack, A.; Majik, M.; Jeong, L.S.; Banasr, M.; et al. Decreased expression of synapse-related genes and loss of synapses in major depressive disorder. Nat. Med. 2012, 18, 1413–1417. [Google Scholar] [CrossRef]
- Otrokocsi, L.; Kittel, A.; Sperlagh, B. P2X7 Receptors Drive Spine Synapse Plasticity in the Learned Helplessness Model of Depression. Int. J. Neuropsychopharmacol. 2017, 20, 813–822. [Google Scholar] [CrossRef]
- Avishai-Eliner, S.; Brunson, K.L.; Sandman, C.A.; Baram, T.Z. Stressed-out, or in (utero)? Trends Neurosci. 2002, 25, 518–524. [Google Scholar] [CrossRef]
- Izett, E.; Rooney, R.; Prescott, S.L.; De, P.M.; McDevitt, M. Prevention of Mental Health Difficulties for Children Aged 0–3 Years: A Review. Front. Psychol. 2020, 11, 500361. [Google Scholar] [CrossRef]
- Lima, A.; Sardinha, V.M.; Oliveira, A.F.; Reis, M.; Mota, C.; Silva, M.A.; Marques, F.; Cerqueira, J.; Pinto, L.; Sousa, N. Astrocyte pathology in the prefrontal cortex impairs the cognitive function of rats. Mol. Psychiatry 2014, 19, 834–841. [Google Scholar] [CrossRef] [Green Version]
- Davis, N.; Mota, B.C.; Stead, L.; Palmer, E.O.C.; Lombardero, L.; Rodriguez-Puertas, R.; de Paola, V.; Barnes, S.J.; Sastre, M. Pharmacological ablation of astrocytes reduces Aβ degradation and synaptic connectivity in an ex vivo model of Alzheimer’s disease. J. Neuroinflamm. 2021, 18, 73. [Google Scholar] [CrossRef]
- Bassett, B.; Subramaniyam, S.; Fan, Y.; Varney, S.; Pan, H.; Carneiro, A.M.D.; Chung, C.Y. Minocycline alleviates depression-like symptoms by rescuing decrease in neurogenesis in dorsal hippocampus via blocking microglia activation/phagocytosis. Brain Behav. Immun. 2021, 91, 519–530. [Google Scholar] [CrossRef]
- Oliveira, J.F.; Riedel, T.; Leichsenring, A.; Heine, C.; Franke, H.; Krügel, U.; Nörenberg, W.; Illes, P. Rodent cortical astroglia express in situ functional P2X7 receptors sensing pathologically high ATP concentrations. Cereb. Cortex 2011, 21, 806–820. [Google Scholar] [CrossRef] [PubMed] [Green Version]
- Boucsein, C.; Kettenmann, H.; Nolte, C. Electrophysiological properties of microglial cells in normal and pathologic rat brain slices. Eur. J. Neurosci. 2000, 12, 2049–2058. [Google Scholar] [CrossRef] [PubMed]
- Perez-Samartin, A.; Garay, E.; Moctezuma, J.P.H.; Cisneros-Mejorado, A.; Sanchez-Gomez, M.V.; Martel-Gallegos, G.; Robles-Martínez, L.; Canedo-Antelo, M.; Matute, C.; Arellano, R.O. Inwardly Rectifying K+ Currents in Cultured Oligodendrocytes from Rat Optic Nerve are Insensitive to pH. Neurochem. Res. 2017, 42, 2443–2455. [Google Scholar] [CrossRef] [PubMed]
- Zhang, Y.; Huang, L.; Kozlov, S.A.; Rubini, P.; Tang, Y.; Illes, P. Acupuncture alleviates acid- and purine-induced pain in rodents. Br. J. Pharmacol. 2020, 177, 77–92. [Google Scholar] [CrossRef] [PubMed]
- Robins, S.C.; Villemain, A.; Liu, X.; Djogo, T.; Kryzskaya, D.; Storch, K.F.; Kokoeva, M.V. Extensive regenerative plasticity among adult NG2-glia populations is exclusively based on self-renewal. Glia 2013, 61, 1735–1747. [Google Scholar] [CrossRef]


Publisher’s Note: MDPI stays neutral with regard to jurisdictional claims in published maps and institutional affiliations. |
© 2022 by the authors. Licensee MDPI, Basel, Switzerland. This article is an open access article distributed under the terms and conditions of the Creative Commons Attribution (CC BY) license (https://creativecommons.org/licenses/by/4.0/).
Share and Cite
Zhao, Y.-F.; Ren, W.-J.; Zhang, Y.; He, J.-R.; Yin, H.-Y.; Liao, Y.; Rubini, P.; Deussing, J.M.; Verkhratsky, A.; Yuan, Z.-Q.; et al. High, in Contrast to Low Levels of Acute Stress Induce Depressive-like Behavior by Involving Astrocytic, in Addition to Microglial P2X7 Receptors in the Rodent Hippocampus. Int. J. Mol. Sci. 2022, 23, 1904. https://0-doi-org.brum.beds.ac.uk/10.3390/ijms23031904
Zhao Y-F, Ren W-J, Zhang Y, He J-R, Yin H-Y, Liao Y, Rubini P, Deussing JM, Verkhratsky A, Yuan Z-Q, et al. High, in Contrast to Low Levels of Acute Stress Induce Depressive-like Behavior by Involving Astrocytic, in Addition to Microglial P2X7 Receptors in the Rodent Hippocampus. International Journal of Molecular Sciences. 2022; 23(3):1904. https://0-doi-org.brum.beds.ac.uk/10.3390/ijms23031904
Chicago/Turabian StyleZhao, Ya-Fei, Wen-Jing Ren, Ying Zhang, Jin-Rong He, Hai-Yan Yin, Yang Liao, Patrizia Rubini, Jan M. Deussing, Alexei Verkhratsky, Zeng-Qiang Yuan, and et al. 2022. "High, in Contrast to Low Levels of Acute Stress Induce Depressive-like Behavior by Involving Astrocytic, in Addition to Microglial P2X7 Receptors in the Rodent Hippocampus" International Journal of Molecular Sciences 23, no. 3: 1904. https://0-doi-org.brum.beds.ac.uk/10.3390/ijms23031904