
Molecular Hydrogen Enhances Proliferation of Cancer Cells That Exhibit Potent Mitochondrial Unfolded Protein Response

 , , and
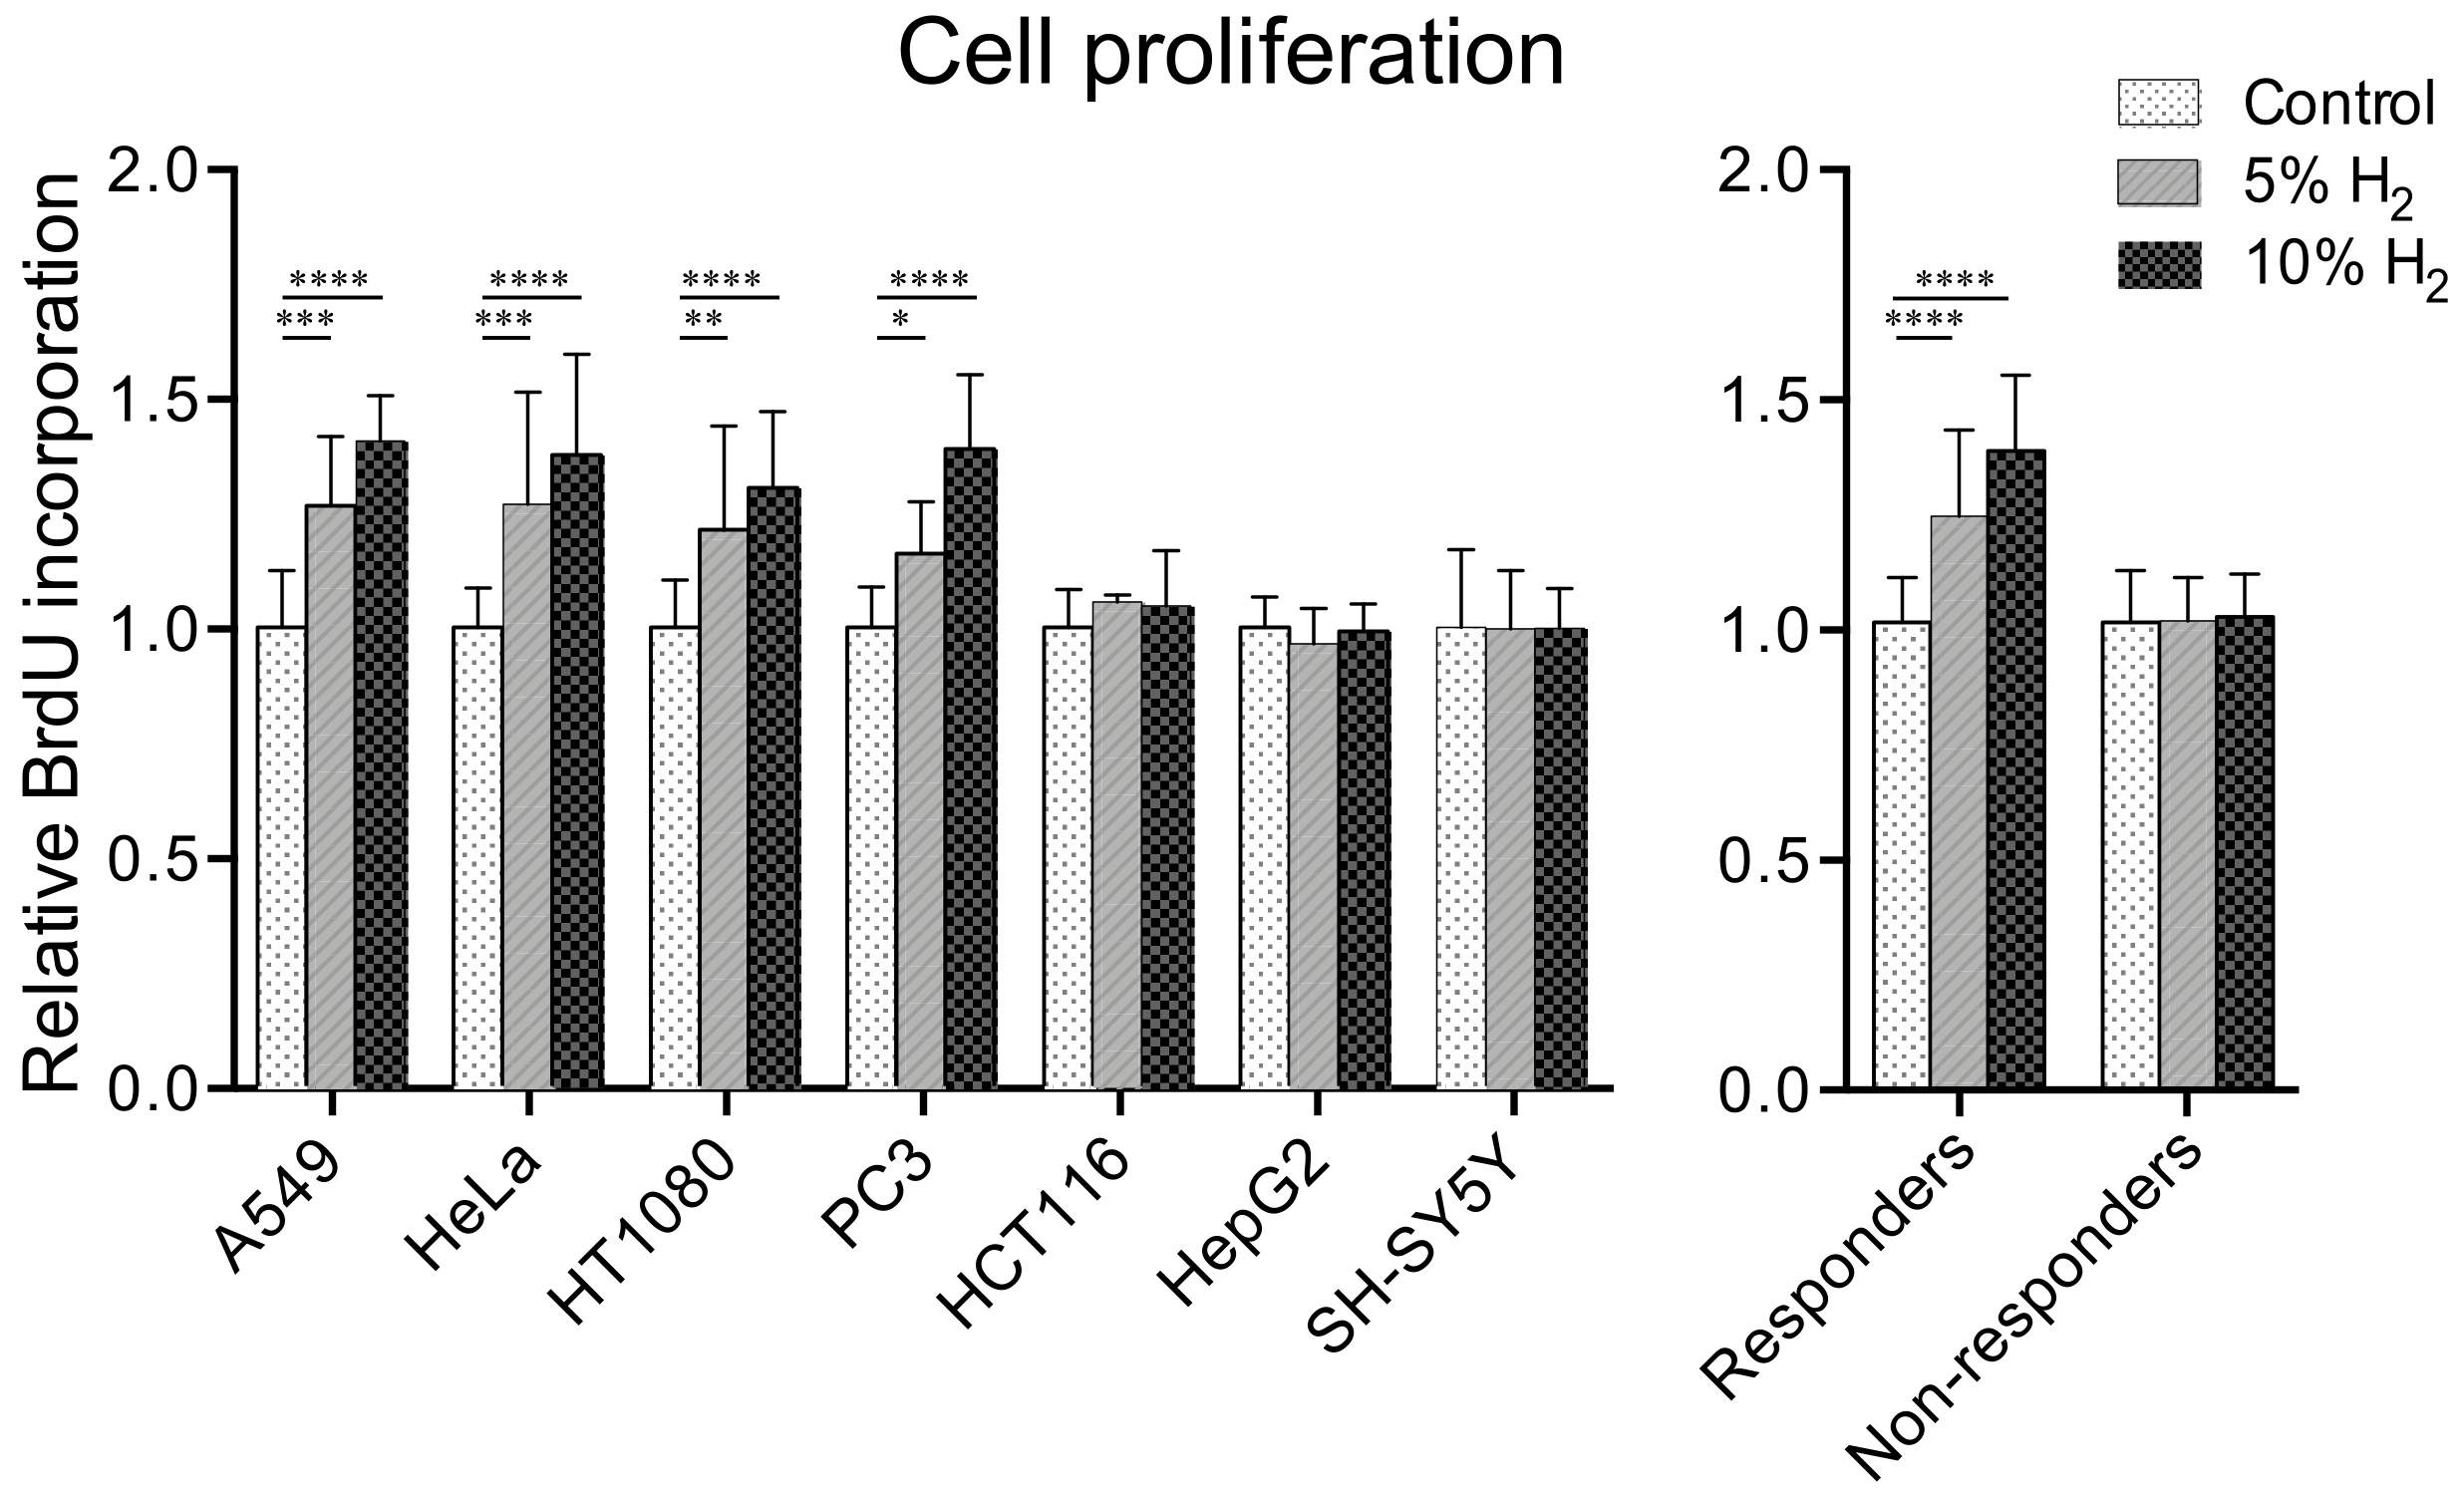
Abstract
:1. Introduction
2. Results
2.1. Hydrogen Promotes Cell Proliferation in Four of Seven Cancer Cell Lines
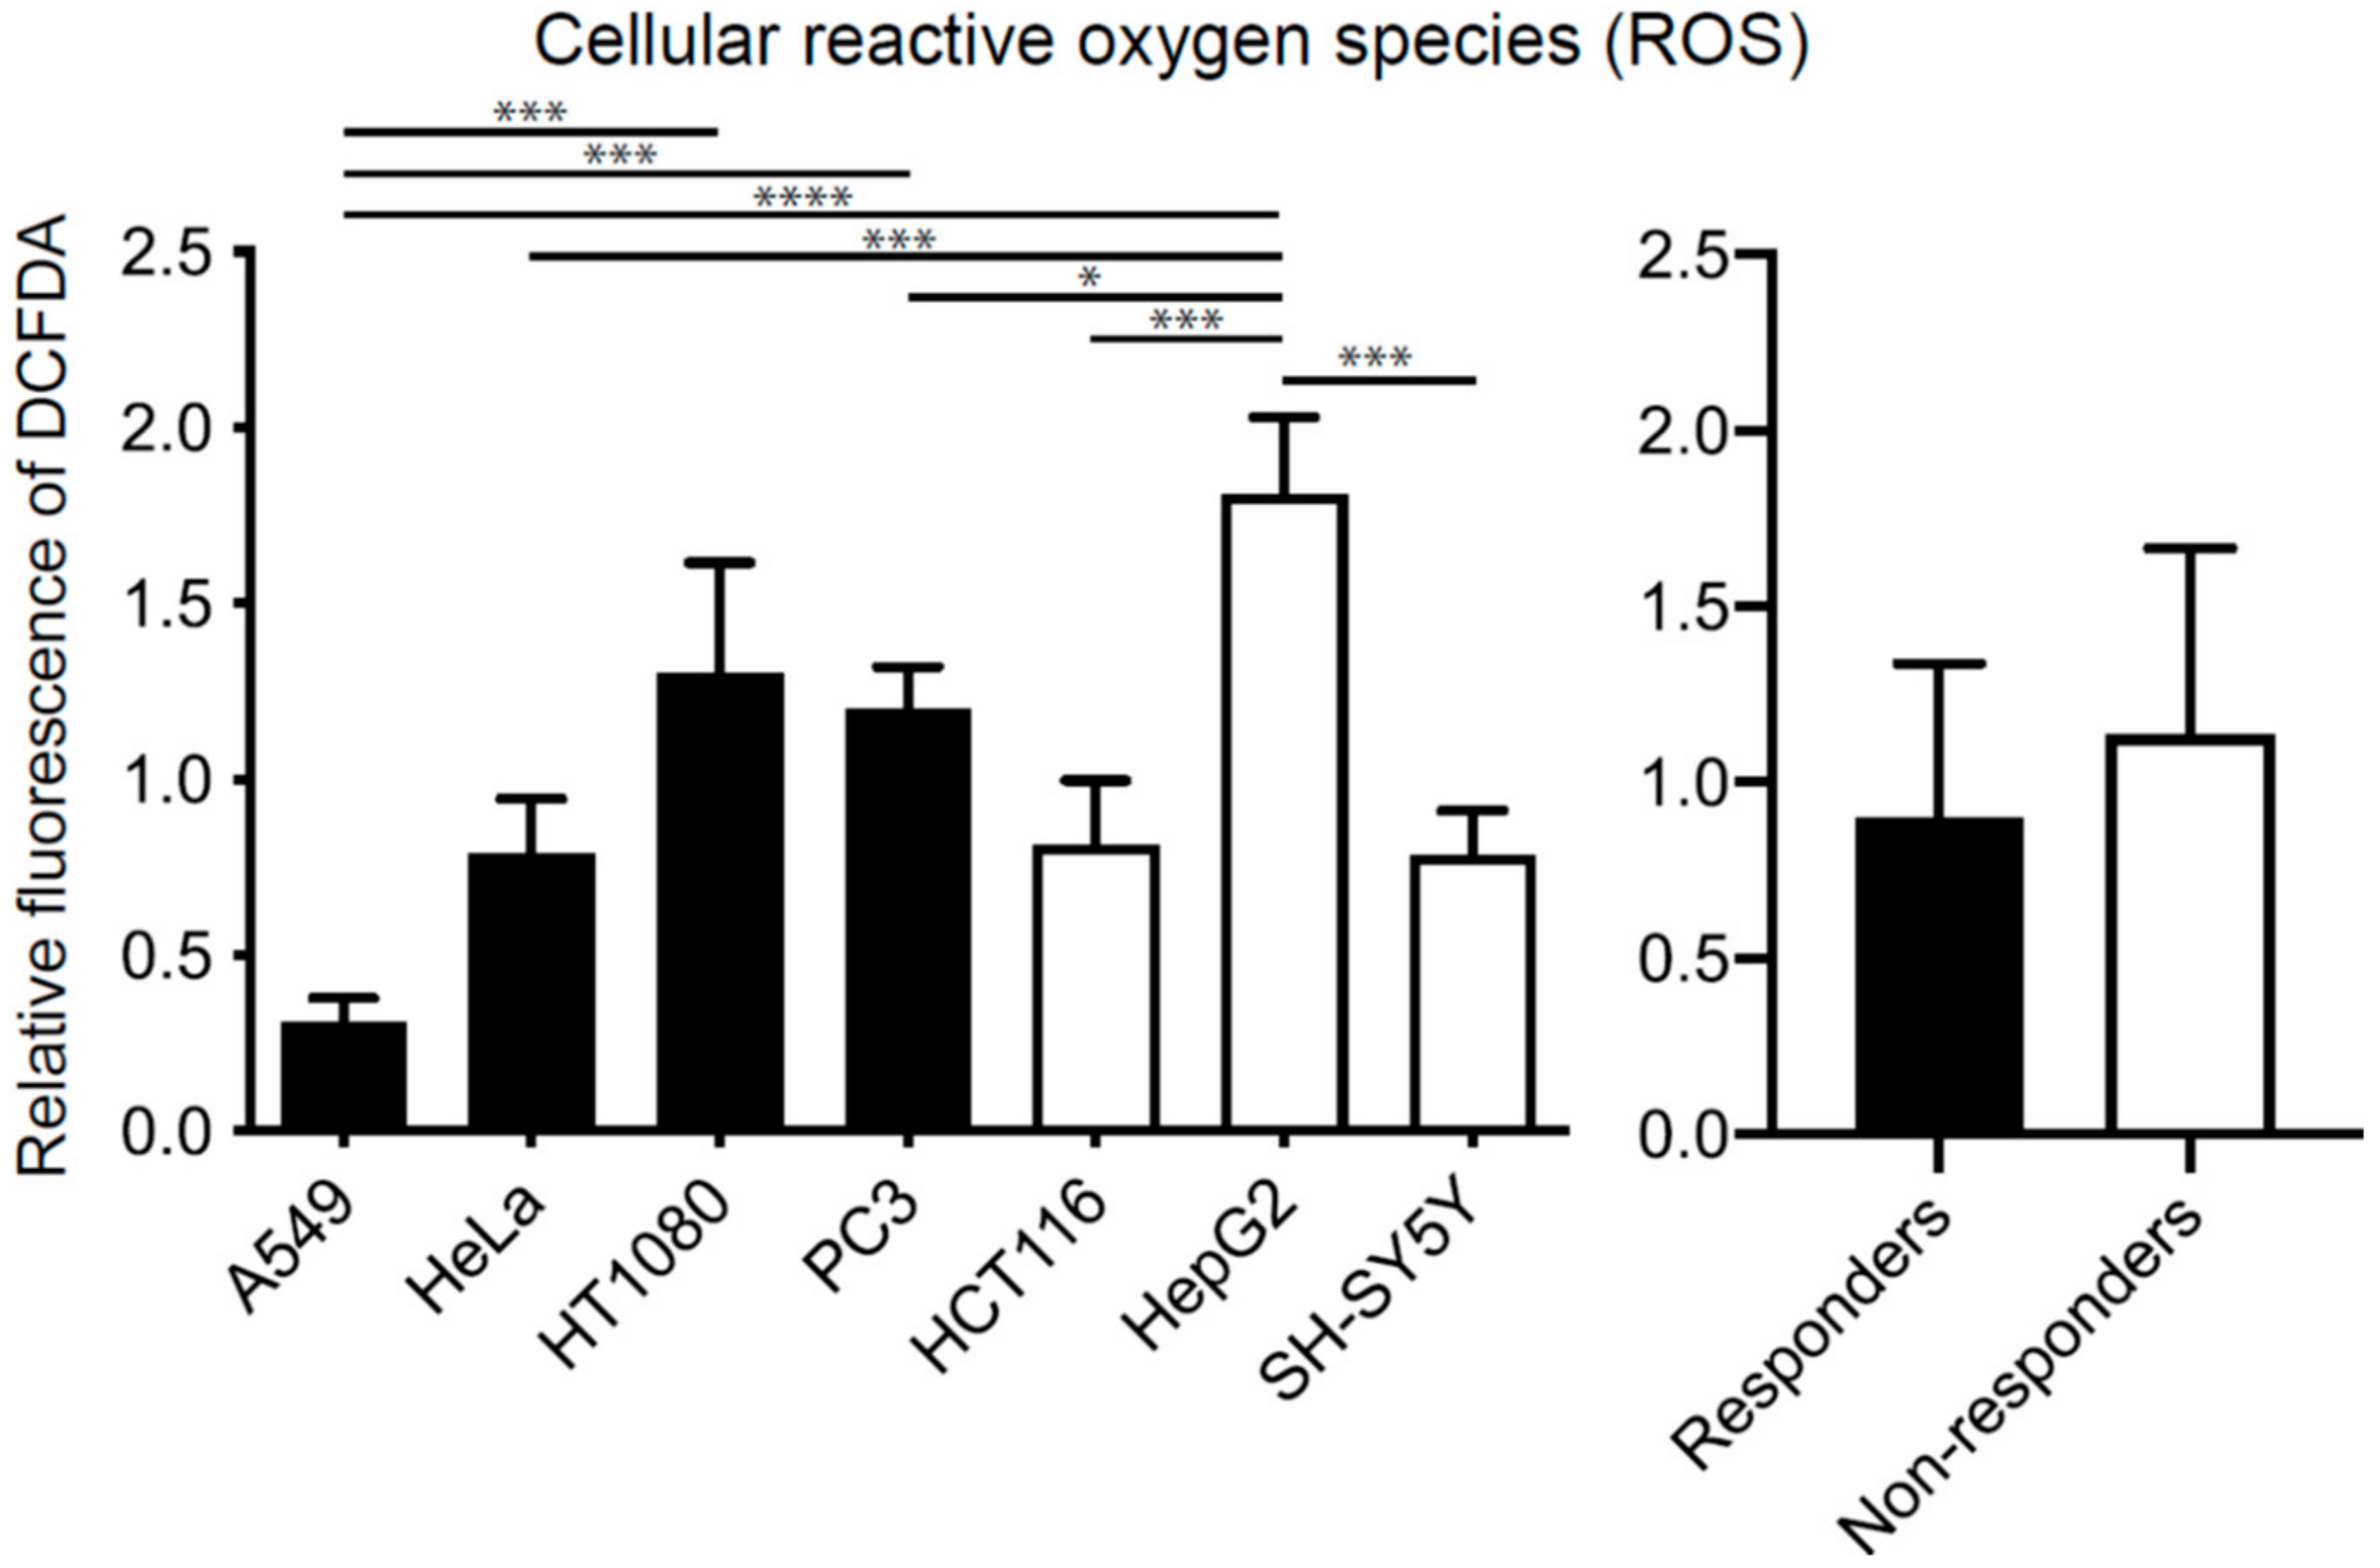
2.2. Effects of Hydrogen on Cell Proliferation Are Independent of Concentrations of Cellular Reactive Oxygen Species (ROS)
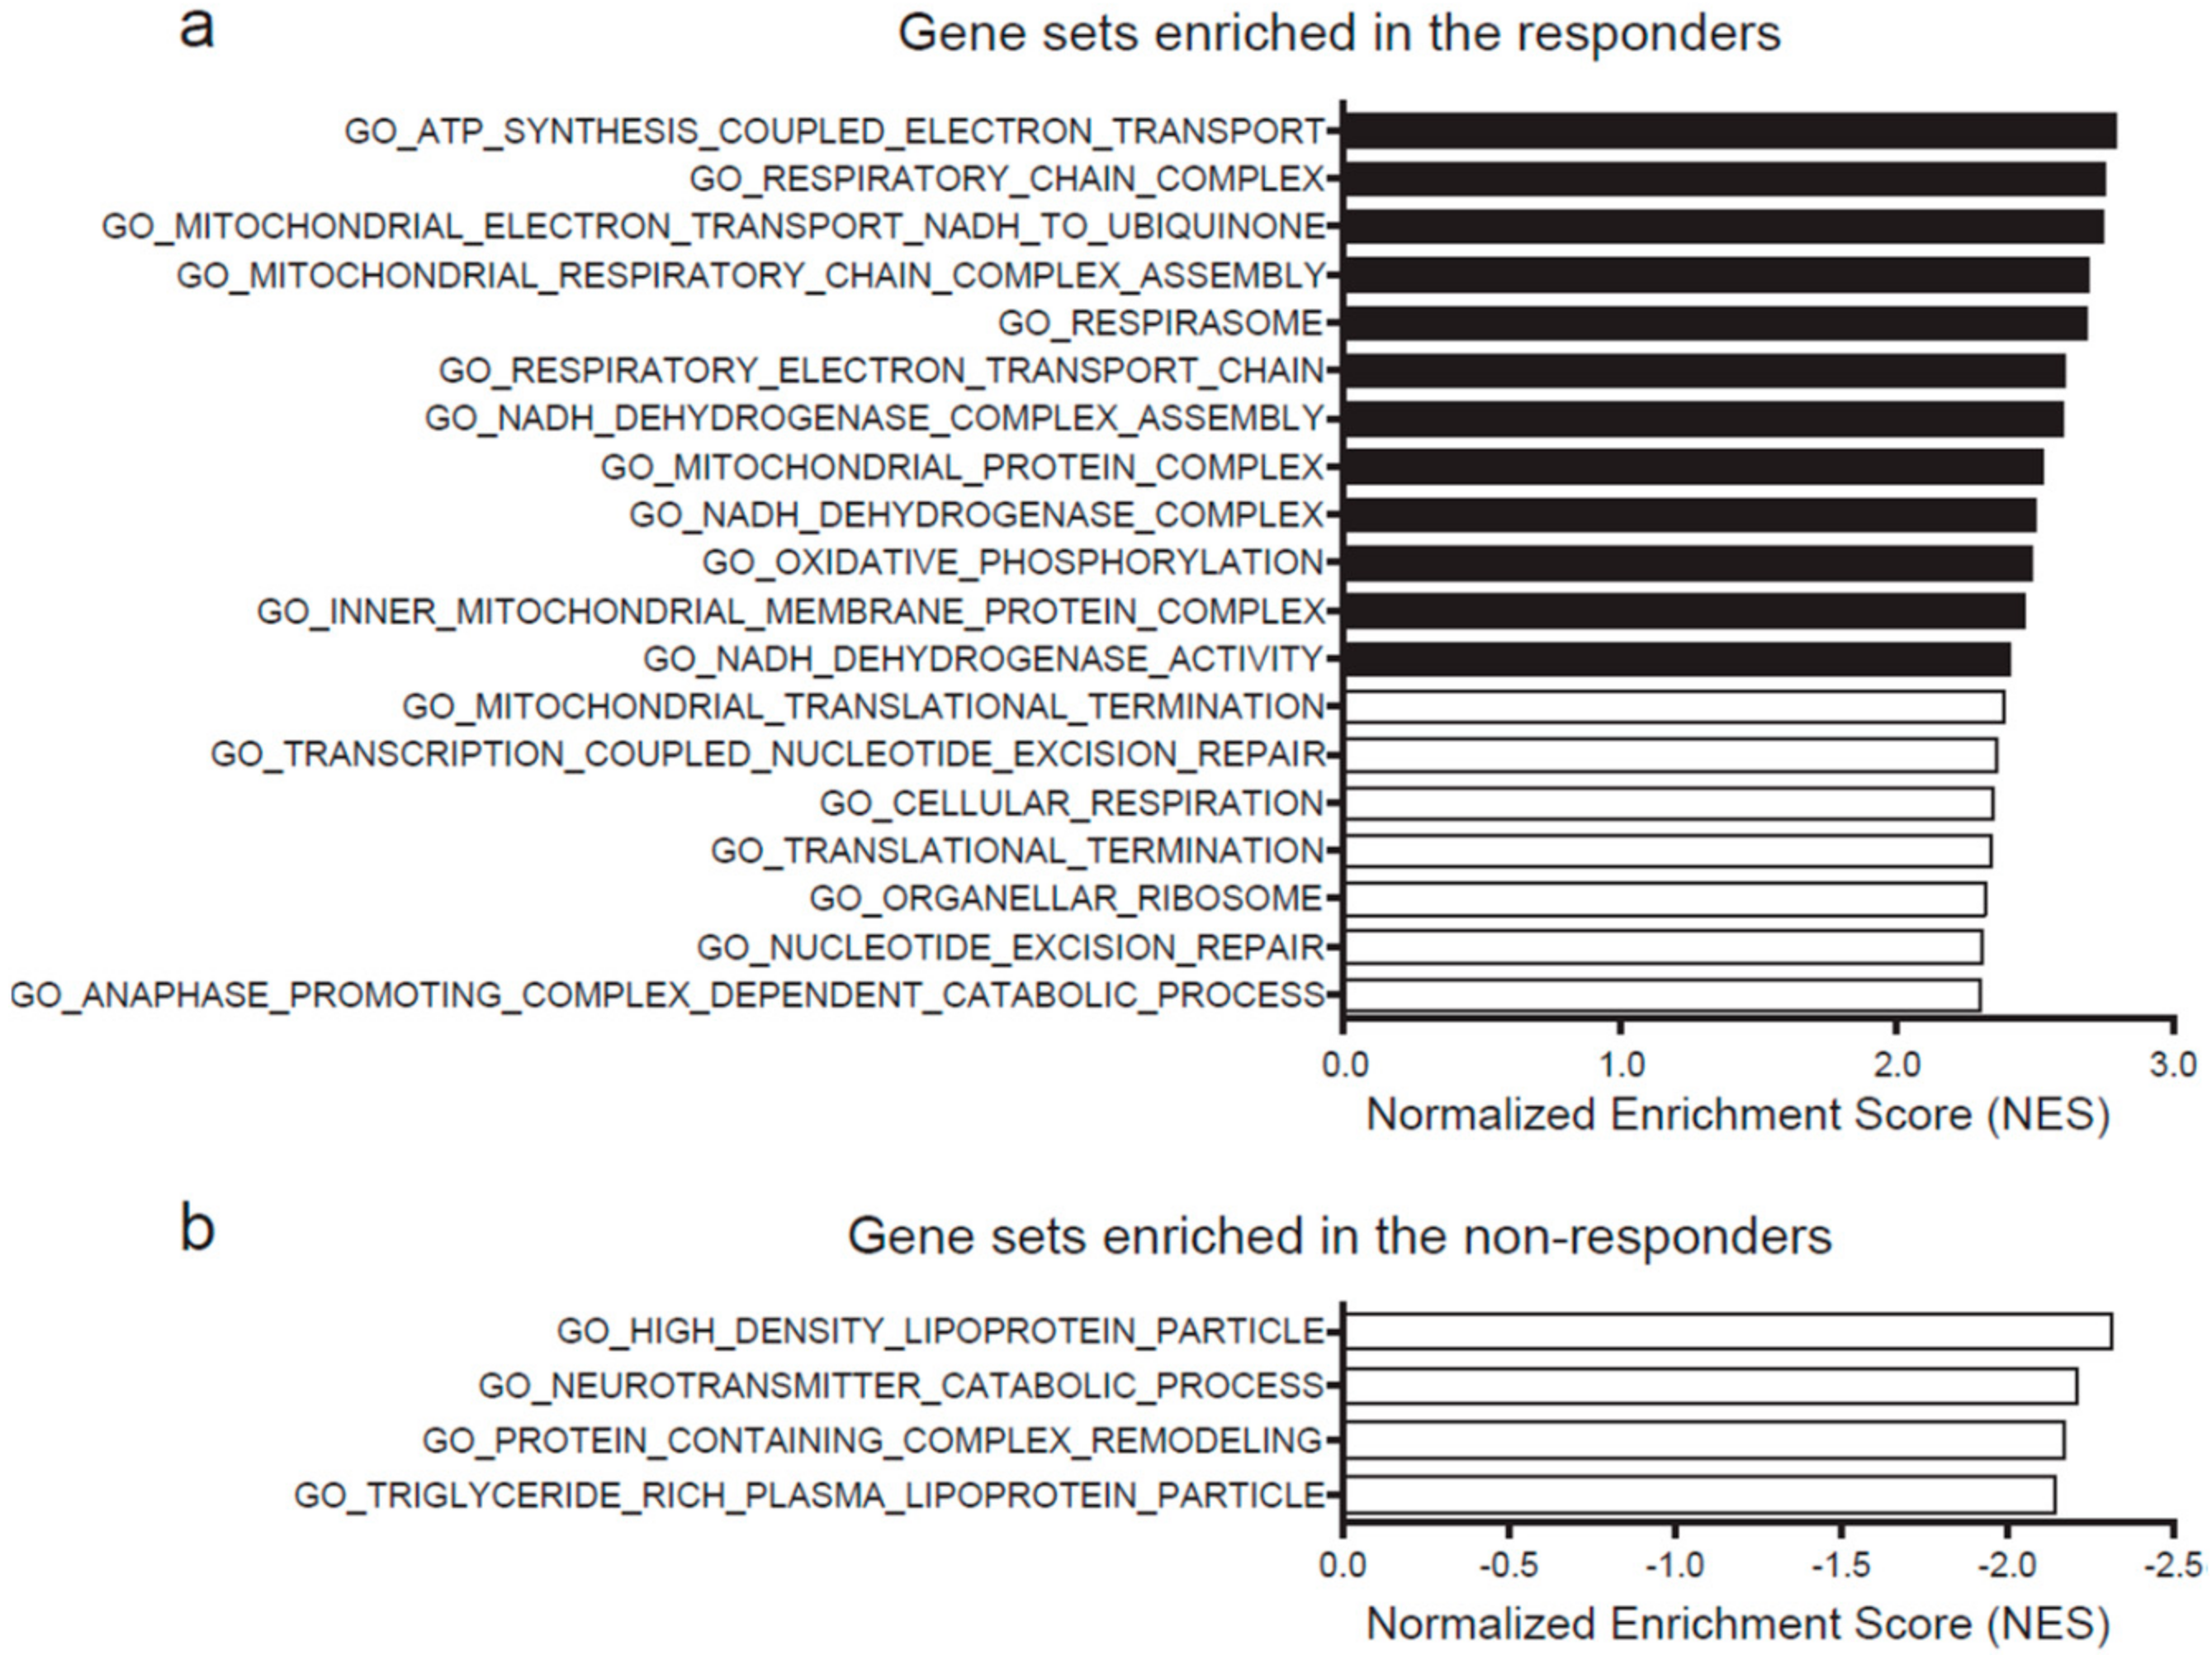
2.3. High Expression of Mitochondrial Genes Predicts Hydrogen-Mediated Cell Proliferation
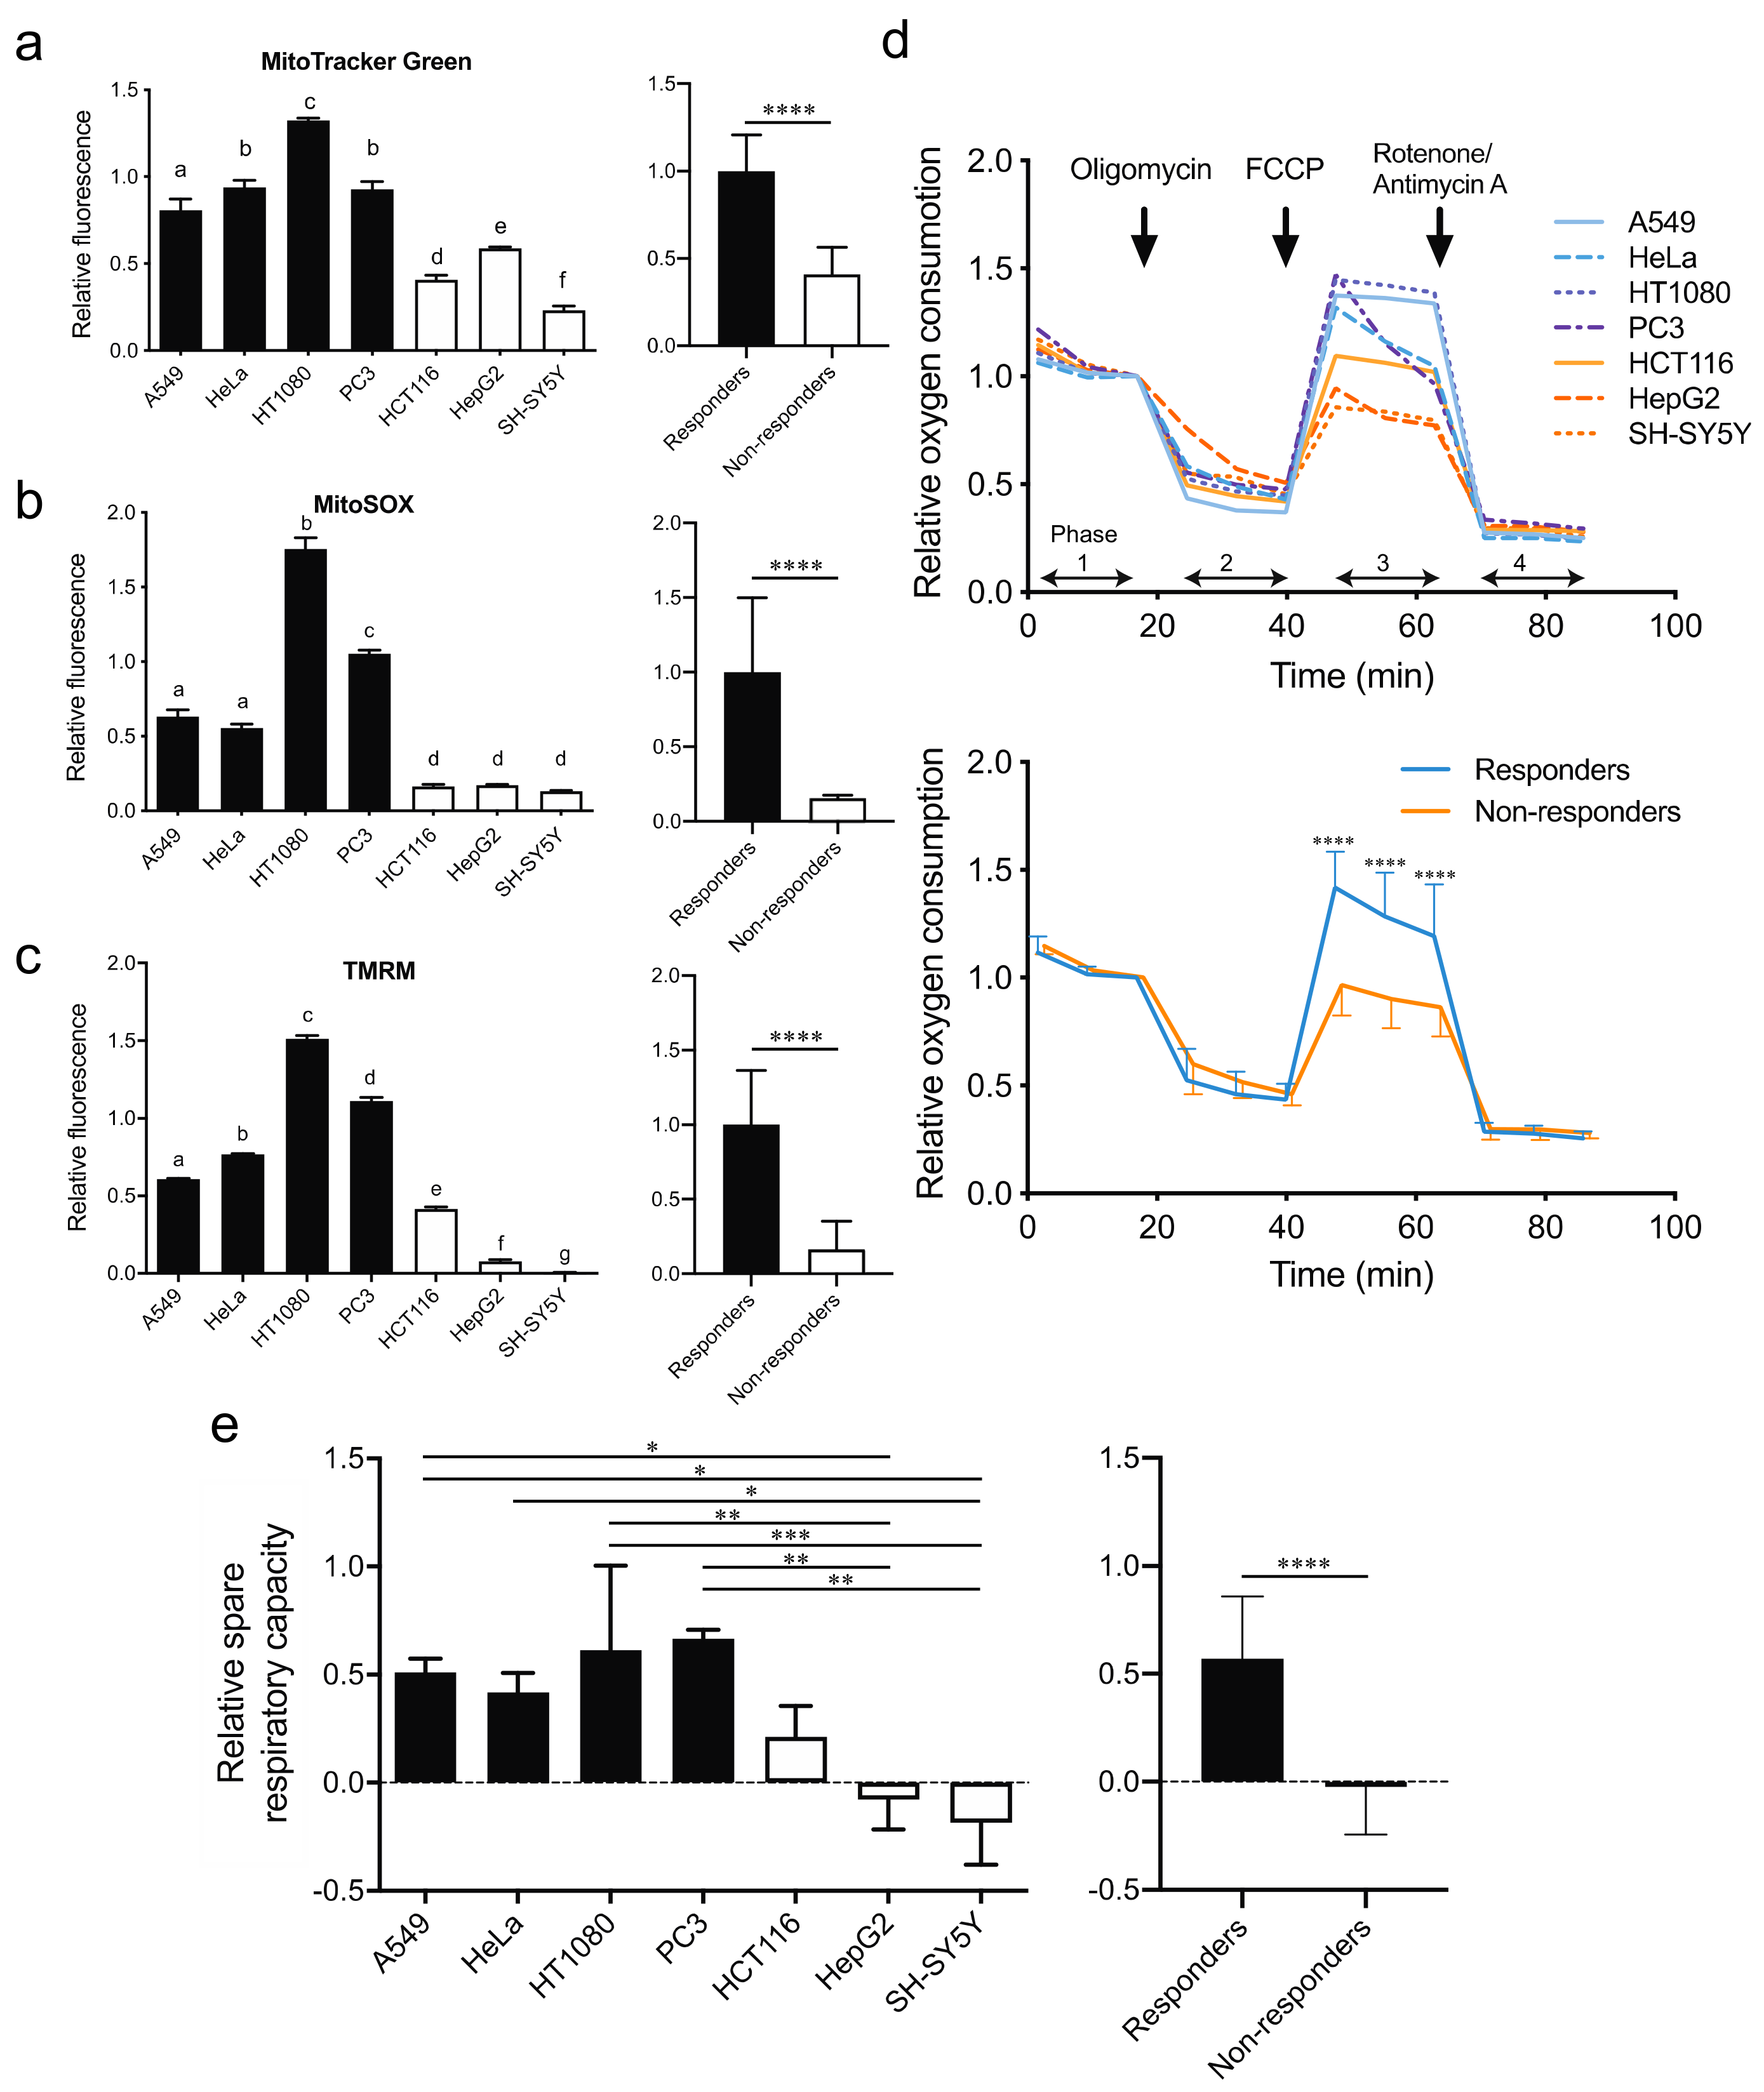
2.4. The Responders Exhibit Higher Mitochondrial ETC Activities and Shorter Doubling Time Than the Non-Responders
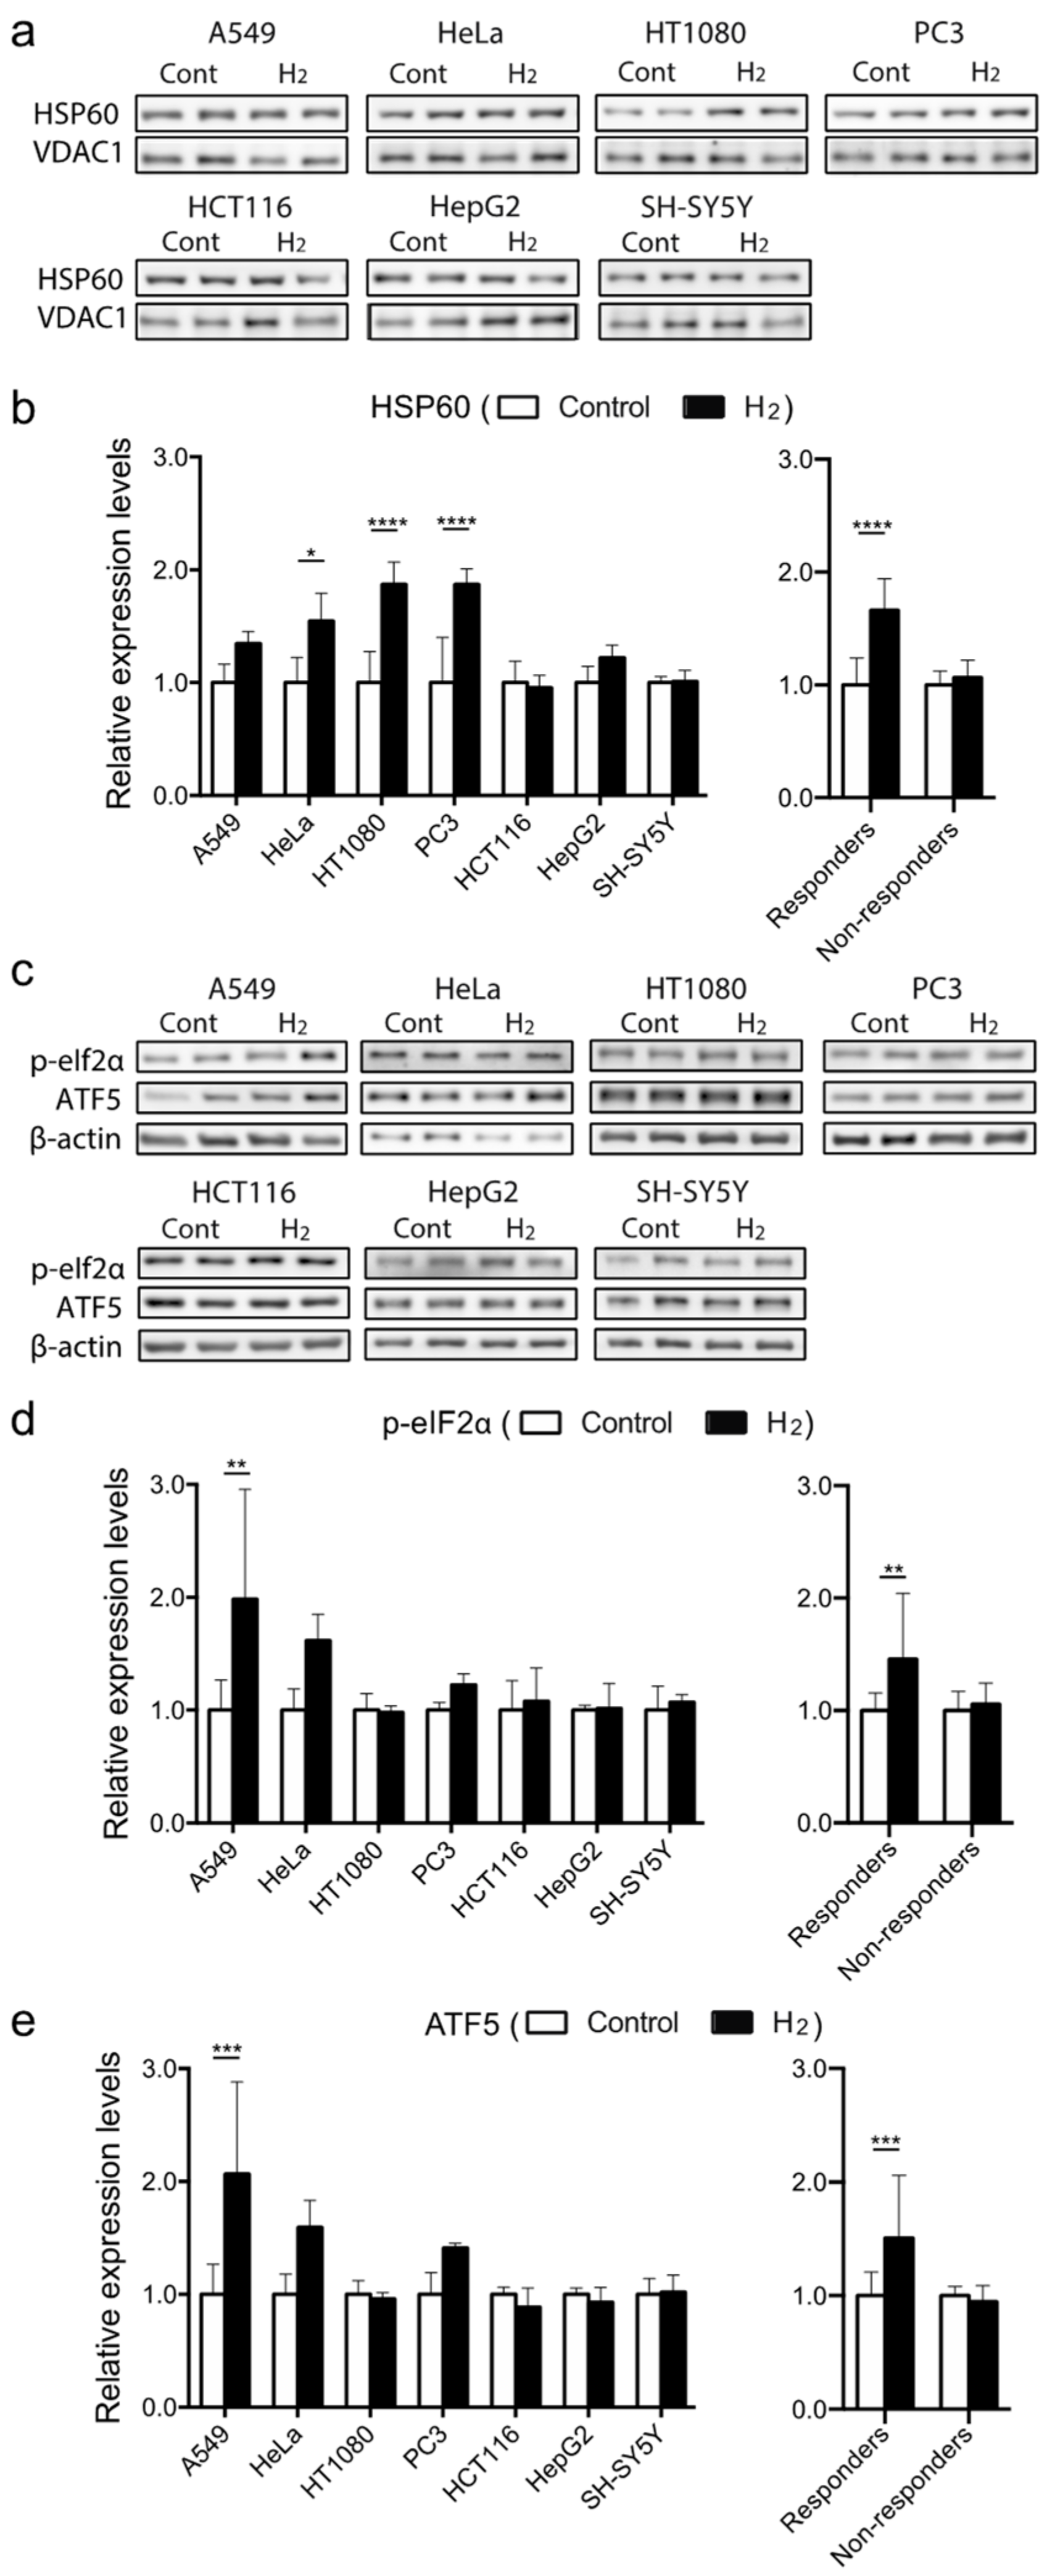
2.5. Molecular Hydrogen Induces Mitochondrial Unfolded Protein Response (mtUPR) in Hydrogen-Responsive Cells
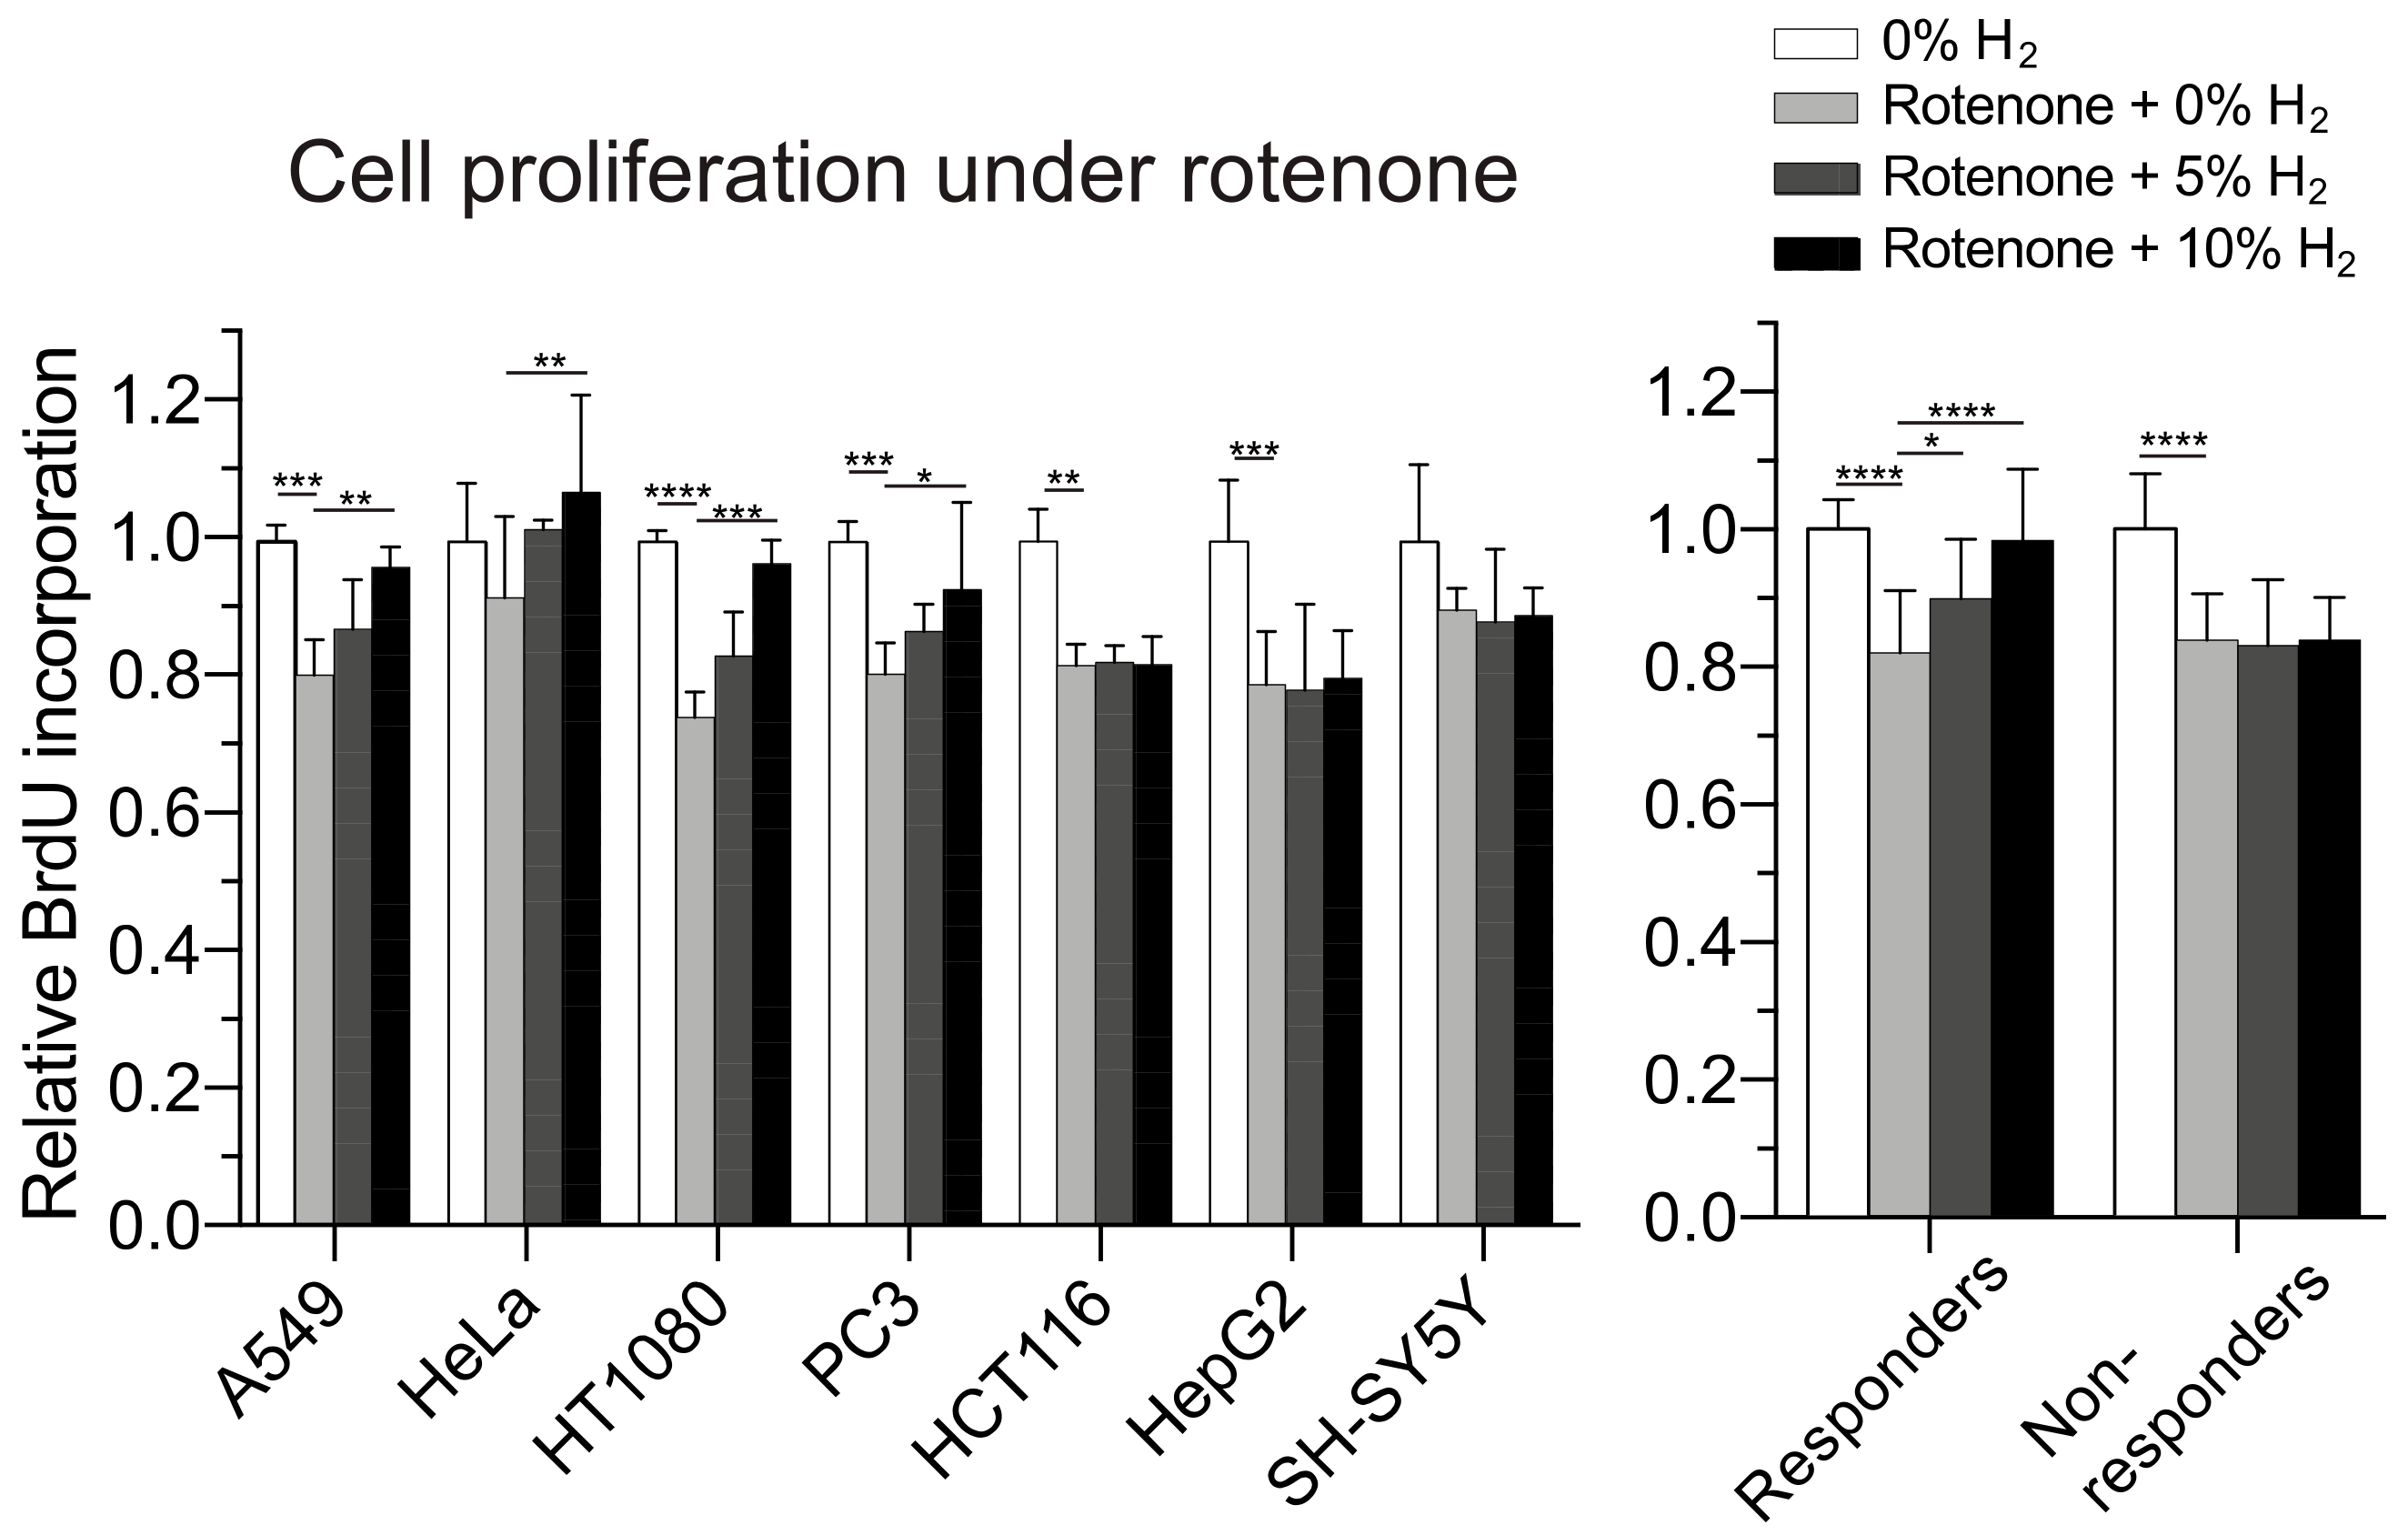
2.6. Molecular Hydrogen Modulates Mitochondrial Stress and Promotes Cell Proliferation
3. Discussion
4. Materials and Methods
4.1. Cell Culture
4.2. Cell Culture with Hydrogen Gas
4.3. Cellular Proliferation Analysis
4.4. Cellular ROS Measurement
4.5. Mitochondrial Function Assay
4.6. Oxygen Consumption Rate Analysis
4.7. Cellular Doubling Time Analysis
4.8. Preparation of Cell Lysates and Western Blotting
4.9. Treatment of Cells with Rotenone
4.10. Gene Set Enrichment Analysis (GSEA) of 28 Microarray Datasets of the Seven Cell Lines
4.11. Statistical Analyses
5. Conclusions
Supplementary Materials
Author Contributions
Funding
Institutional Review Board Statement
Informed Consent Statement
Data Availability Statement
Acknowledgments
Conflicts of Interest
References
- Hayashida, K.; Sano, M.; Ohsawa, I.; Shinmura, K.; Tamaki, K.; Kimura, K.; Endo, J.; Katayama, T.; Kawamura, A.; Kohsaka, S.; et al. Inhalation of hydrogen gas reduces infarct size in the rat model of myocardial ischemia-reperfusion injury. Biochem. Biophys. Res. Commun. 2008, 373, 30–35. [Google Scholar] [CrossRef] [PubMed]
- Stripp, S.T.; Happe, T. How algae produce hydrogen—News from the photosynthetic hydrogenase. Dalton Trans. 2009, 45, 9960–9969. [Google Scholar] [CrossRef] [PubMed] [Green Version]
- Hancock, J.T.; Russell, G. Downstream signaling form molecular hydrogen. Plants 2021, 10, 367. [Google Scholar] [CrossRef] [PubMed]
- Yang, M.; Dong, Y.; He, Q.; Zhu, P.; Zhuang, Q.; Shen, J.; Zhang, X.; Zhao, M. Hydrogen: A Novel Option in Human Disease Treatment. Oxid. Med. Cell. Longev. 2020, 2020, 8384742. [Google Scholar] [CrossRef] [PubMed]
- LeBaron, T.W.; Kura, B.; Kalocayova, B.; Tribulova, N.; Slezak, J. A New Approach for the Prevention and Treatment of Cardiovascular Disorders. Molecular Hydrogen Significantly Reduces the Effects of Oxidative Stress. Molecules 2019, 24, 2076. [Google Scholar] [CrossRef] [Green Version]
- Ichihara, M.; Sobue, S.; Ito, M.; Ito, M.; Hirayama, M.; Ohno, K. Beneficial biological effects and the underlying mechanisms of molecular hydrogen—Comprehensive review of 321 original articles. Med. Gas. Res. 2015, 5, 12. [Google Scholar] [CrossRef] [Green Version]
- Ohsawa, I.; Ishikawa, M.; Takahashi, K.; Watanabe, M.; Nishimaki, K.; Yamagata, K.; Katsura, K.; Katayama, Y.; Asoh, S.; Ohta, S. Hydrogen acts as a therapeutic antioxidant by selectively reducing cytotoxic oxygen radicals. Nat. Med. 2007, 13, 688–694. [Google Scholar] [CrossRef]
- Yu, J.; Zhang, W.; Zhang, R.; Jiang, G.; Tang, H.; Ruan, X.; Ren, P.; Lu, B. Molecular hydrogen attenuates hypoxia/reoxygenation injury of intrahepatic cholangiocytes by activating Nrf2 expression. Toxicol. Lett. 2015, 238, 11–19. [Google Scholar] [CrossRef]
- Xie, K.; Yu, Y.; Hou, L.; Chen, H.; Han, H.; Xiong, L.; Wang, G. Nrf2 is critical in the protective role of hydrogen gas against murine polymicrobial sepsis. Br. J. Anaesth. 2012, 108, 538–539. [Google Scholar]
- Tamaki, N.; Orihuela-Campos, R.C.; Fukui, M.; Ito, H.O. Hydrogen-Rich Water Intake Accelerates Oral Palatal Wound Healing via Activation of the Nrf2/Antioxidant Defense Pathways in a Rat Model. Oxid. Med. Cell. Longev. 2016, 2016, 5679040. [Google Scholar] [CrossRef] [Green Version]
- Kawamura, T.; Wakabayashi, N.; Shigemura, N.; Huang, C.S.; Masutani, K.; Tanaka, Y.; Noda, K.; Peng, X.; Takahashi, T.; Billiar, T.R.; et al. Hydrogen gas reduces hyperoxic lung injury via the Nrf2 pathway in vivo. Am. J. Physiol. Lung. Cell. Mol. Physiol. 2013, 304, L646–L656. [Google Scholar] [CrossRef] [Green Version]
- Diao, M.; Zhang, S.; Wu, L.; Huan, L.; Huang, F.; Cui, Y.; Lin, Z. Hydrogen Gas Inhalation Attenuates Seawater Instillation-Induced Acute Lung Injury via the Nrf2 Pathway in Rabbits. Inflammation 2016, 39, 2029–2039. [Google Scholar] [CrossRef] [PubMed]
- Chen, H.; Xie, K.; Han, H.; Li, Y.; Liu, L.; Yang, T.; Yu, Y. Molecular hydrogen protects mice against polymicrobial sepsis by ameliorating endothelial dysfunction via an Nrf2/HO-1 signaling pathway. Int. Immunopharmacol. 2015, 28, 643–654. [Google Scholar] [CrossRef]
- Murakami, Y.; Ito, M.; Ohsawa, I. Molecular hydrogen protects against oxidative stress-induced SH-SY5Y neuroblastoma cell death through the process of mitohormesis. PLoS ONE 2017, 12, e0176992. [Google Scholar]
- Kura, B.; Bagchi, A.K.; Singal, P.K.; Barancik, M.; LeBaron, T.W.; Valachova, K.; Soltes, L.; Slezak, J. Molecular hydrogen: Potential in mitigating oxidative-stress-induced radiation injury. Can. J. Physiol. Pharmacol. 2019, 97, 287–292. [Google Scholar] [CrossRef] [PubMed]
- Lin, Y.; Ohkawara, B.; Ito, M.; Misawa, N.; Miyamoto, K.; Takegami, Y.; Masuda, A.; Toyokuni, S.; Ohno, K. Molecular hydrogen suppresses activated Wnt/beta-catenin signaling. Sci. Rep. 2016, 6, 31986. [Google Scholar] [CrossRef] [PubMed]
- Nishiwaki, H.; Ito, M.; Negishi, S.; Sobue, S.; Ichihara, M.; Ohno, K. Molecular hydrogen upregulates heat shock response and collagen biosynthesis, and downregulates cell cycles: Meta-analyses of gene expression profiles. Free Radic. Res. 2018, 52, 434–445. [Google Scholar] [CrossRef] [PubMed]
- Sobue, S.; Inoue, C.; Hori, F.; Qiao, S.; Murate, T.; Ichihara, M. Molecular hydrogen modulates gene expression via histone modification and induces the mitochondrial unfolded protein response. Biochem. Biophys. Res. Commun. 2017, 493, 318–324. [Google Scholar] [CrossRef] [PubMed]
- Zhao, Q.; Wang, J.; Levichkin, I.V.; Stasinopoulos, S.; Ryan, M.T.; Hoogenraad, N.J. A mitochondrial specific stress response in mammalian cells. EMBO J. 2002, 21, 4411–4419. [Google Scholar] [CrossRef]
- Zhou, D.; Palam, L.R.; Jiang, L.; Narasimhan, J.; Staschke, K.A.; Wek, R.C. Phosphorylation of eIF2 directs ATF5 translational control in response to diverse stress conditions. J. Biol. Chem. 2008, 283, 7064–7073. [Google Scholar] [CrossRef] [Green Version]
- Harding, H.P.; Novoa, I.; Zhang, Y.; Zeng, H.; Wek, R.; Schapira, M.; Ron, D. Regulated translation initiation controls stress-induced gene expression in mammalian cells. Mol. Cell 2000, 6, 1099–1108. [Google Scholar] [CrossRef]
- Pareek, G.; Pallanck, L.J. Inactivation of Lon protease reveals a link between mitochondrial unfolded protein stress and mitochondrial translation inhibition. Cell Death Dis. 2018, 9, 1168. [Google Scholar] [CrossRef] [PubMed] [Green Version]
- Fiorese, C.J.; Schulz, A.M.; Lin, Y.F.; Rosin, N.; Pellegrino, M.W.; Haynes, C.M. The Transcription Factor ATF5 Mediates a Mammalian Mitochondrial UPR. Curr. Biol. 2016, 26, 2037–2043. [Google Scholar] [CrossRef] [PubMed] [Green Version]
- Deng, P.; Haynes, C.M. Mitochondrial dysfunction in cancer: Potential roles of ATF5 and the mitochondrial UPR. Semin. Cancer Biol. 2017, 47, 43–49. [Google Scholar] [CrossRef] [PubMed]
- Lambert, C.M.; Roy, M.; Meloche, J.; Robitaille, G.A.; Agharazii, M.; Richard, D.E.; Bonnet, S. Tumor necrosis factor inhibitors as novel therapeutic tools for vascular remodeling diseases. Am. J. Physiol. Heart Circ. Physiol. 2010, 299, H995–H1001. [Google Scholar] [CrossRef] [Green Version]
- Meloche, J.; Paulin, R.; Courboulin, A.; Lambert, C.; Barrier, M.; Bonnet, P.; Bisserier, M.; Roy, M.; Sussman, M.A.; Agharazii, M.; et al. RAGE-dependent activation of the oncoprotein Pim1 plays a critical role in systemic vascular remodeling processes. Arterioscler. Thromb. Vasc. Biol. 2011, 31, 2114–2124. [Google Scholar] [CrossRef] [Green Version]
- Nogueira, N.P.; Saraiva, F.M.S.; Oliveira, M.P.; Mendonca, A.P.M.; Inacio, J.D.F.; Almeida-Amaral, E.E.; Menna-Barreto, R.F.; Laranja, G.A.T.; Torres, E.J.L.; Oliveira, M.F.; et al. Heme modulates Trypanosoma cruzi bioenergetics inducing mitochondrial ROS production. Free Radic. Biol. Med. 2017, 108, 183–191. [Google Scholar] [CrossRef]
- Verma, S.P.; Das, P. Monensin induces cell death by autophagy and inhibits matrix metalloproteinase 7 (MMP7) in UOK146 renal cell carcinoma cell line. Vitr. Cell. Dev. Biol. Anim. 2018, 54, 736–742. [Google Scholar] [CrossRef]
- Wu, Z.; Senchuk, M.M.; Dues, D.J.; Johnson, B.K.; Cooper, J.F.; Lew, L.; Machiela, E.; Schaar, C.E.; DeJonge, H.; Blackwell, T.K.; et al. Mitochondrial unfolded protein response transcription factor ATFS-1 promotes longevity in a long-lived mitochondrial mutant through activation of stress response pathways. BMC Biol. 2018, 16, 147. [Google Scholar] [CrossRef] [Green Version]
- Shpilka, T.; Haynes, C.M. The mitochondrial UPR: Mechanisms, physiological functions and implications in ageing. Nat. Rev. Mol. Cell Biol. 2018, 19, 109–120. [Google Scholar] [CrossRef]
- Wang, Y.T.; Lim, Y.; McCall, M.N.; Huang, K.T.; Haynes, C.M.; Nehrke, K.; Brookes, P.S. Cardioprotection by the mitochondrial unfolded protein response requires ATF5. Am. J. Physiol. Heart Circ. Physiol. 2019, 317, H472–H478. [Google Scholar] [CrossRef] [PubMed]
- Zhao, Y.S.; An, J.R.; Yang, S.; Guan, P.; Yu, F.Y.; Li, W.; Li, J.R.; Guo, Y.; Sun, Z.M.; Ji, E.S. Hydrogen and Oxygen Mixture to Improve Cardiac Dysfunction and Myocardial Pathological Changes Induced by Intermittent Hypoxia in Rats. Oxid. Med. Cell. Longev. 2019, 2019, 7415212. [Google Scholar] [CrossRef] [PubMed] [Green Version]
- Lin, Y.F.; Haynes, C.M. Metabolism and the UPR(mt). Mol. Cell 2016, 61, 677–682. [Google Scholar] [CrossRef] [PubMed] [Green Version]
- Berger, E.; Rath, E.; Yuan, D.; Waldschmitt, N.; Khaloian, S.; Allgauer, M.; Staszewski, O.; Lobner, E.M.; Schottl, T.; Giesbertz, P.; et al. Mitochondrial function controls intestinal epithelial stemness and proliferation. Nat. Commun. 2016, 7, 13171. [Google Scholar] [CrossRef] [Green Version]
- Deepa, S.S.; Bhaskaran, S.; Ranjit, R.; Qaisar, R.; Nair, B.C.; Liu, Y.; Walsh, M.E.; Fok, W.C.; Van Remmen, H. Down-regulation of the mitochondrial matrix peptidase ClpP in muscle cells causes mitochondrial dysfunction and decreases cell proliferation. Free Radic. Biol. Med. 2016, 91, 281–292. [Google Scholar] [CrossRef] [Green Version]
- Koromilas, A.E. Roles of the translation initiation factor eIF2alpha serine 51 phosphorylation in cancer formation and treatment. Biochim. Biophys. Acta 2015, 1849, 871–880. [Google Scholar] [CrossRef]
- Ye, J.; Kumanova, M.; Hart, L.S.; Sloane, K.; Zhang, H.; De Panis, D.N.; Bobrovnikova-Marjon, E.; Diehl, J.A.; Ron, D.; Koumenis, C. The GCN2-ATF4 pathway is critical for tumour cell survival and proliferation in response to nutrient deprivation. EMBO J. 2010, 29, 2082–2096. [Google Scholar] [CrossRef] [Green Version]
- Angelastro, J.M. Targeting ATF5 in Cancer. Trends Cancer 2017, 3, 471–474. [Google Scholar] [CrossRef]
- Ishihara, S.; Yasuda, M.; Ishizu, A.; Ishikawa, M.; Shirato, H.; Haga, H. Activating transcription factor 5 enhances radioresistance and malignancy in cancer cells. Oncotarget 2015, 6, 4602–4614. [Google Scholar] [CrossRef] [Green Version]
- Zhou, C.; Sun, H.; Zheng, C.; Gao, J.; Fu, Q.; Hu, N.; Shao, X.; Zhou, Y.; Xiong, J.; Nie, K.; et al. Oncogenic HSP60 regulates mitochondrial oxidative phosphorylation to support Erk1/2 activation during pancreatic cancer cell growth. Cell Death Dis. 2018, 9, 161. [Google Scholar] [CrossRef] [Green Version]
- Ohno, K.; Ito, M.; Ichihara, M.; Ito, M. Molecular hydrogen as an emerging therapeutic medical gas for neurodegenerative and other diseases. Oxid. Med. Cell. Longev. 2012, 2012, 353152. [Google Scholar] [CrossRef] [PubMed] [Green Version]
- Hirayama, M.; Ito, M.; Minato, T.; Yoritaka, A.; LeBaron, T.W.; Ohno, K. Inhalation of hydrogen gas elevates urinary 8-hydroxy-2’-deoxyguanine in Parkinson’s disease. Med. Gas. Res. 2018, 8, 144–149. [Google Scholar] [PubMed]
- Kasai, S.; Shimizu, S.; Tatara, Y.; Mimura, J.; Itoh, K. Regulation of Nrf2 by Mitochondrial Reactive Oxygen Species in Physiology and Pathology. Biomolecules 2020, 10, 320. [Google Scholar] [CrossRef] [PubMed] [Green Version]
- Vringer, E.; Tait, S.W.G. Mitochondria and Inflammation: Cell Death Heats up. Front. Cell Dev. Biol. 2019, 7, 100. [Google Scholar] [CrossRef] [PubMed]
- Okatsu, K.; Oka, T.; Iguchi, M.; Imamura, K.; Kosako, H.; Tani, N.; Kimura, M.; Go, E.; Koyano, F.; Funayama, M.; et al. PINK1 autophosphorylation upon membrane potential dissipation is essential for Parkin recruitment to damaged mitochondria. Nat. Commun. 2012, 3, 1016. [Google Scholar] [CrossRef] [PubMed] [Green Version]
- Pellegrino, M.W.; Haynes, C.M. Mitophagy and the mitochondrial unfolded protein response in neurodegeneration and bacterial infection. BMC Biol. 2015, 13, 22. [Google Scholar] [CrossRef] [Green Version]
- Fu, Y.; Ito, M.; Fujita, Y.; Ito, M.; Ichihara, M.; Masuda, A.; Suzuki, Y.; Maesawa, S.; Kajita, Y.; Hirayama, M.; et al. Molecular hydrogen is protective against 6-hydroxydopamine-induced nigrostriatal degeneration in a rat model of Parkinson’s disease. Neurosci. Lett. 2009, 453, 81–85. [Google Scholar] [CrossRef]
- Ito, M.; Hirayama, M.; Yamai, K.; Goto, S.; Ito, M.; Ichihara, M.; Ohno, K. Drinking hydrogen water and intermittent hydrogen gas exposure, but not lactulose or continuous hydrogen gas exposure, prevent 6-hydorxydopamine-induced Parkinson’s disease in rats. Med. Gas. Res. 2012, 2, 15. [Google Scholar] [CrossRef] [Green Version]
- Yoritaka, A.; Takanashi, M.; Hirayama, M.; Nakahara, T.; Ohta, S.; Hattori, N. Pilot study of H(2) therapy in Parkinson’s disease: A randomized double-blind placebo-controlled trial. Mov. Disord. 2013, 28, 836–839. [Google Scholar] [CrossRef]
- Yoritaka, A.; Ohtsuka, C.; Maeda, T.; Hirayama, M.; Abe, T.; Watanabe, H.; Saiki, H.; Oyama, G.; Fukae, J.; Shimo, Y.; et al. Randomized, double-blind, multicenter trial of hydrogen water for Parkinson’s disease. Mov. Disord. 2018, 33, 1505–1507. [Google Scholar] [CrossRef]
- Luengo, A.; Li, Z.; Gui, D.Y.; Sullivan, L.B.; Zagorulya, M.; Do, B.T.; Ferreira, R.; Naamati, A.; Ali, A.; Lewis, C.A.; et al. Increased demand for NAD(+) relative to ATP drives aerobic glycolysis. Mol. Cell 2021, 81, 691–707.e6. [Google Scholar] [CrossRef] [PubMed]
- Vesselle, H.; Salskov, A.; Turcotte, E.; Wiens, L.; Schmidt, R.; Jordan, C.D.; Vallieres, E.; Wood, D.E. Relationship between non-small cell lung cancer FDG uptake at PET, tumor histology, and Ki-67 proliferation index. J. Thorac. Oncol. 2008, 3, 971–978. [Google Scholar] [CrossRef] [PubMed] [Green Version]
- Liu, M.Y.; Xie, F.; Zhang, Y.; Wang, T.T.; Ma, S.N.; Zhao, P.X.; Zhang, X.; Lebaron, T.W.; Yan, X.L.; Ma, X.M. Molecular hydrogen suppresses glioblastoma growth via inducing the glioma stem-like cell differentiation. Stem. Cell. Res. Ther. 2019, 10, 145. [Google Scholar] [CrossRef] [PubMed] [Green Version]
- Rosvall, M.; Bergstrom, C.T. Multilevel compression of random walks on networks reveals hierarchical organization in large integrated systems. PLoS ONE 2011, 6, e18209. [Google Scholar] [CrossRef] [Green Version]
- Rosvall, M.; Bergstrom, C.T. Maps of random walks on complex networks reveal community structure. Proc. Natl. Acad. Sci. USA 2008, 105, 1118–1123. [Google Scholar] [CrossRef] [Green Version]
- Akagi, J.; Baba, H. Hydrogen gas restores exhausted CD8+ T cells in patients with advanced colorectal cancer to improve prognosis. Oncol. Rep. 2019, 41, 301–311. [Google Scholar] [CrossRef] [Green Version]
- Chen, J.; Mu, F.; Lu, T.; Ma, Y.; Du, D.; Xu, K. A Gallbladder Carcinoma Patient With Pseudo-Progressive Remission After Hydrogen Inhalation. Onco Targets Ther. 2019, 12, 8645–8651. [Google Scholar] [CrossRef] [Green Version]
- Nakashima-Kamimura, N.; Mori, T.; Ohsawa, I.; Asoh, S.; Ohta, S. Molecular hydrogen alleviates nephrotoxicity induced by an anti-cancer drug cisplatin without compromising anti-tumor activity in mice. Cancer Chemother. Pharmacol. 2009, 64, 753–761. [Google Scholar] [CrossRef]
- Yang, Q.; Ji, G.; Pan, R.; Zhao, Y.; Yan, P. Protective effect of hydrogen-rich water on liver function of colorectal cancer patients treated with mFOLFOX6 chemotherapy. Mol. Clin. Oncol. 2017, 7, 891–896. [Google Scholar] [CrossRef] [Green Version]
- Kang, K.M.; Kang, Y.N.; Choi, I.B.; Gu, Y.; Kawamura, T.; Toyoda, Y.; Nakao, A. Effects of drinking hydrogen-rich water on the quality of life of patients treated with radiotherapy for liver tumors. Med. Gas Res. 2011, 1, 11. [Google Scholar] [CrossRef] [Green Version]
- Katakami, N.; Kaneto, H.; Matsuoka, T.A.; Takahara, M.; Maeda, N.; Shimizu, I.; Ohno, K.; Osonoi, T.; Kawai, K.; Ishibashi, F.; et al. Adiponectin G276T gene polymorphism is associated with cardiovascular disease in Japanese patients with type 2 diabetes. Atherosclerosis 2012, 220, 437–442. [Google Scholar] [CrossRef] [PubMed]
- Runtuwene, J.; Amitani, H.; Amitani, M.; Asakawa, A.; Cheng, K.C.; Inui, A. Hydrogen-water enhances 5-fluorouracil-induced inhibition of colon cancer. PeerJ. 2015, 3, e859. [Google Scholar] [CrossRef] [PubMed] [Green Version]
- Yang, Y.; Liu, P.Y.; Bao, W.; Chen, S.J.; Wu, F.S.; Zhu, P.Y. Hydrogen inhibits endometrial cancer growth via a ROS/NLRP3/caspase-1/GSDMD-mediated pyroptotic pathway. BMC Cancer 2020, 20, 28. [Google Scholar] [CrossRef] [PubMed]
- Zhu, B.; Cui, H.; Xu, W. Hydrogen inhibits the proliferation and migration of gastric cancer cells by modulating lncRNA MALAT1/miR-124-3p/EZH2 axis. Cancer Cell Int. 2021, 21, 70. [Google Scholar] [CrossRef]
- Chen, J.B.; Kong, X.F.; Lv, Y.Y.; Qin, S.C.; Sun, X.J.; Mu, F.; Lu, T.Y.; Xu, K.C. “Real world survey” of hydrogen-controlled cancer: A follow-up report of 82 advanced cancer patients. Med. Gas Res. 2019, 9, 115–121. [Google Scholar]
- Frajese, G.V.; Benvenuto, M.; Mattera, R.; Giampaoli, S.; Ambrosin, E.; Bernardini, R.; Giganti, M.G.; Albonici, L.; Dus, I.; Manzari, V.; et al. Electrochemically Reduced Water Delays Mammary Tumors Growth in Mice and Inhibits Breast Cancer Cells Survival In Vitro. Evid. Based Complement. Alternat. Med. 2018, 2018, 4753507. [Google Scholar] [CrossRef] [Green Version]
- Jiang, Y.; Liu, G.; Zhang, L.; Cheng, S.; Luo, C.; Liao, Y.; Guo, S. Therapeutic efficacy of hydrogenrich saline alone and in combination with PI3K inhibitor in nonsmall cell lung cancer. Mol. Med. Rep. 2018, 18, 2182–2190. [Google Scholar]
- Wang, D.; Wang, L.; Zhang, Y.; Zhao, Y.; Chen, G. Hydrogen gas inhibits lung cancer progression through targeting SMC3. Biomed. Pharmacother. 2018, 104, 788–797. [Google Scholar] [CrossRef]
- Liu, L.; Yan, Z.; Wang, Y.; Meng, J.; Chen, G. Suppression of autophagy facilitates hydrogen gas-mediated lung cancer cell apoptosis. Oncol. Lett. 2020, 20, 112. [Google Scholar] [CrossRef]
- Roberts, B.J.; Fife, W.P.; Corbett, T.H.; Schabel, F.M., Jr. Response of five established solid transplantable mouse tumors and one mouse leukemia to hyperbaric hydrogen. Cancer Treat. Rep. 1978, 62, 1077–1079. [Google Scholar]


Publisher’s Note: MDPI stays neutral with regard to jurisdictional claims in published maps and institutional affiliations. |
© 2022 by the authors. Licensee MDPI, Basel, Switzerland. This article is an open access article distributed under the terms and conditions of the Creative Commons Attribution (CC BY) license (https://creativecommons.org/licenses/by/4.0/).
Share and Cite
Hasegawa, T.; Ito, M.; Hasegawa, S.; Teranishi, M.; Takeda, K.; Negishi, S.; Nishiwaki, H.; Takeda, J.-i.; LeBaron, T.W.; Ohno, K. Molecular Hydrogen Enhances Proliferation of Cancer Cells That Exhibit Potent Mitochondrial Unfolded Protein Response. Int. J. Mol. Sci. 2022, 23, 2888. https://0-doi-org.brum.beds.ac.uk/10.3390/ijms23052888
Hasegawa T, Ito M, Hasegawa S, Teranishi M, Takeda K, Negishi S, Nishiwaki H, Takeda J-i, LeBaron TW, Ohno K. Molecular Hydrogen Enhances Proliferation of Cancer Cells That Exhibit Potent Mitochondrial Unfolded Protein Response. International Journal of Molecular Sciences. 2022; 23(5):2888. https://0-doi-org.brum.beds.ac.uk/10.3390/ijms23052888
Chicago/Turabian StyleHasegawa, Tomoya, Mikako Ito, Satoru Hasegawa, Masaki Teranishi, Koki Takeda, Shuto Negishi, Hiroshi Nishiwaki, Jun-ichi Takeda, Tyler W. LeBaron, and Kinji Ohno. 2022. "Molecular Hydrogen Enhances Proliferation of Cancer Cells That Exhibit Potent Mitochondrial Unfolded Protein Response" International Journal of Molecular Sciences 23, no. 5: 2888. https://0-doi-org.brum.beds.ac.uk/10.3390/ijms23052888