Introduction
Keloids are fibroproliferative skin lesions/disorders that occur following trauma, inflammation, surgery or burns but can also occur spontaneously [
1]. While unique to humans, keloids usually manifest in pigmented individuals including Blacks, Hispanics and Asians [
2]. They occur in Blacks with familial predisposition and extend beyond the margins of the original wounds, and rarely regress [
3]. The disorder represents a deviation from the fundamental processes of wound healing, which include cell migration and proliferation, inflammation, increased synthesis and secretion of cytokines and extracellular matrix proteins, and remodeling of the newly synthesized matrix [
4]. Thus, keloids are benign tumors, which have undergone a single hit in a two-hit theory of carcinogenesis [
5,
6,
7].
It has been established that keloids produce excess extracellular matrix, especially collagen [
8]. Several cytokines have been implicated in the pathogenesis of keloids, including epidermal, fibroblast and platelet derived growth factors [
4]. Different forms of TGF-β’s have been shown to contribute to scarring with TGF-β 1and 2 having a larger influence on collagen formation than TGF-β 3 [
9,
10,
11,
12].
The specific aim of this study was to elucidate what gene products are differentially expressed in keloid dermal fibroblasts (KDF) compared to normal human dermal fibroblasts (NDF) in long-term established cultures using the Human cDNA Expression Array. RNA Fingerprinting Kit was also used to determine if there were any genes that are unique to KDF or NDF.
Materials and Methods
Cells
Normal dermal fibroblasts (CRL 1906) and keloids (CRL 1762) were obtained from the American Type Culture Collection (ATCC). CRL 1906 (CCD-974Sk) was originally obtained from the face of a 61-year old black female donor and was dispatched after 2 passages. Meanwhile, CRL 1762 was obtained from a keloid of a 35-year old black female with a passage number 11 at delivery. The cells were propagated in Dulbeco’s minimum essential media containing 10% fetal bovine serum and antibiotics (100 units/ml penicillin, 100 mg/ml streptomycin). The cells were maintained in 5% CO2 incubator at 370C and passaged near confluency using Trypsin-EDTA. The cells were rendered quiescent by serum deprivation for 24 hours prior to extracting RNA.
RNA
Poly A+mRNA was extracted using Quiagen protocol for mid-size extraction procedure (Rneasy Midi Handbook: Qiagen, 1997). The passage number for both the cell lines was 15. Tissue culture flasks (75 cm2; 10-15) were required for Clontech's Atlas™ Human cDNA Expression Array (User Manual [PT3140-1]) and the same amount was required for Clontech's Delta RNA Fingerprinting Kit (User Manual [PT1173-1]).
Human Atlas Array
For down-/up-regulation, NDF versus KDF was compared using Clontech's Atlas™ Human cDNA Expression Array. This array has 588 human cDNAs spotted in duplicate on a membrane.
Poly A
+mRNA from each sample was used to synthesize cDNA probes labeled with [α-
32P]dATP. RNA was obtained as described above and treated with DNase using the following conditions: 2.0 µl Poly A+RNA (1mg/ml), 1.0 µl 10xDNAse 1 buffer, 0.2 µl DNAse 1 (1unit/µl) and 6.8 µl deionized water. After DNAse treatment, RNA was precipitated, resuspended and quantitated spectrophotometrically. Aliquots were electrophoresed on a gel incorporating ethidium bromide to ensure good quality. cDNA was then synthesized. Poly A+ RNA sample (1µg of RNA) along with 1µl of 10X CDS primer mix was incubated at 70
oC for 2 min and then at 50
oC for 2 min. To this, 2µl of 5X reaction buffer, 1 µl of 10x dNTP mix (for dATP label), 3.5 µl ([α-
32P]dATP (3000 Ci/mmol, 10 mCi/ml), 0.5 µl DTT (100 mM),1 µl MMLV RT were added. This mixture was incubated at 50
oC for 20 min and stopped by adding 1µl of 10x termination mix.
32P labeled cDNA was purified and separated from unincorporated
32P labeled nucleotides by passing the mixture through chrom spin-200 DEPC-H
2O column. cDNA probe was hybridized and the blot washed. The samples were exposed to x-ray film at -70
oC and developed (
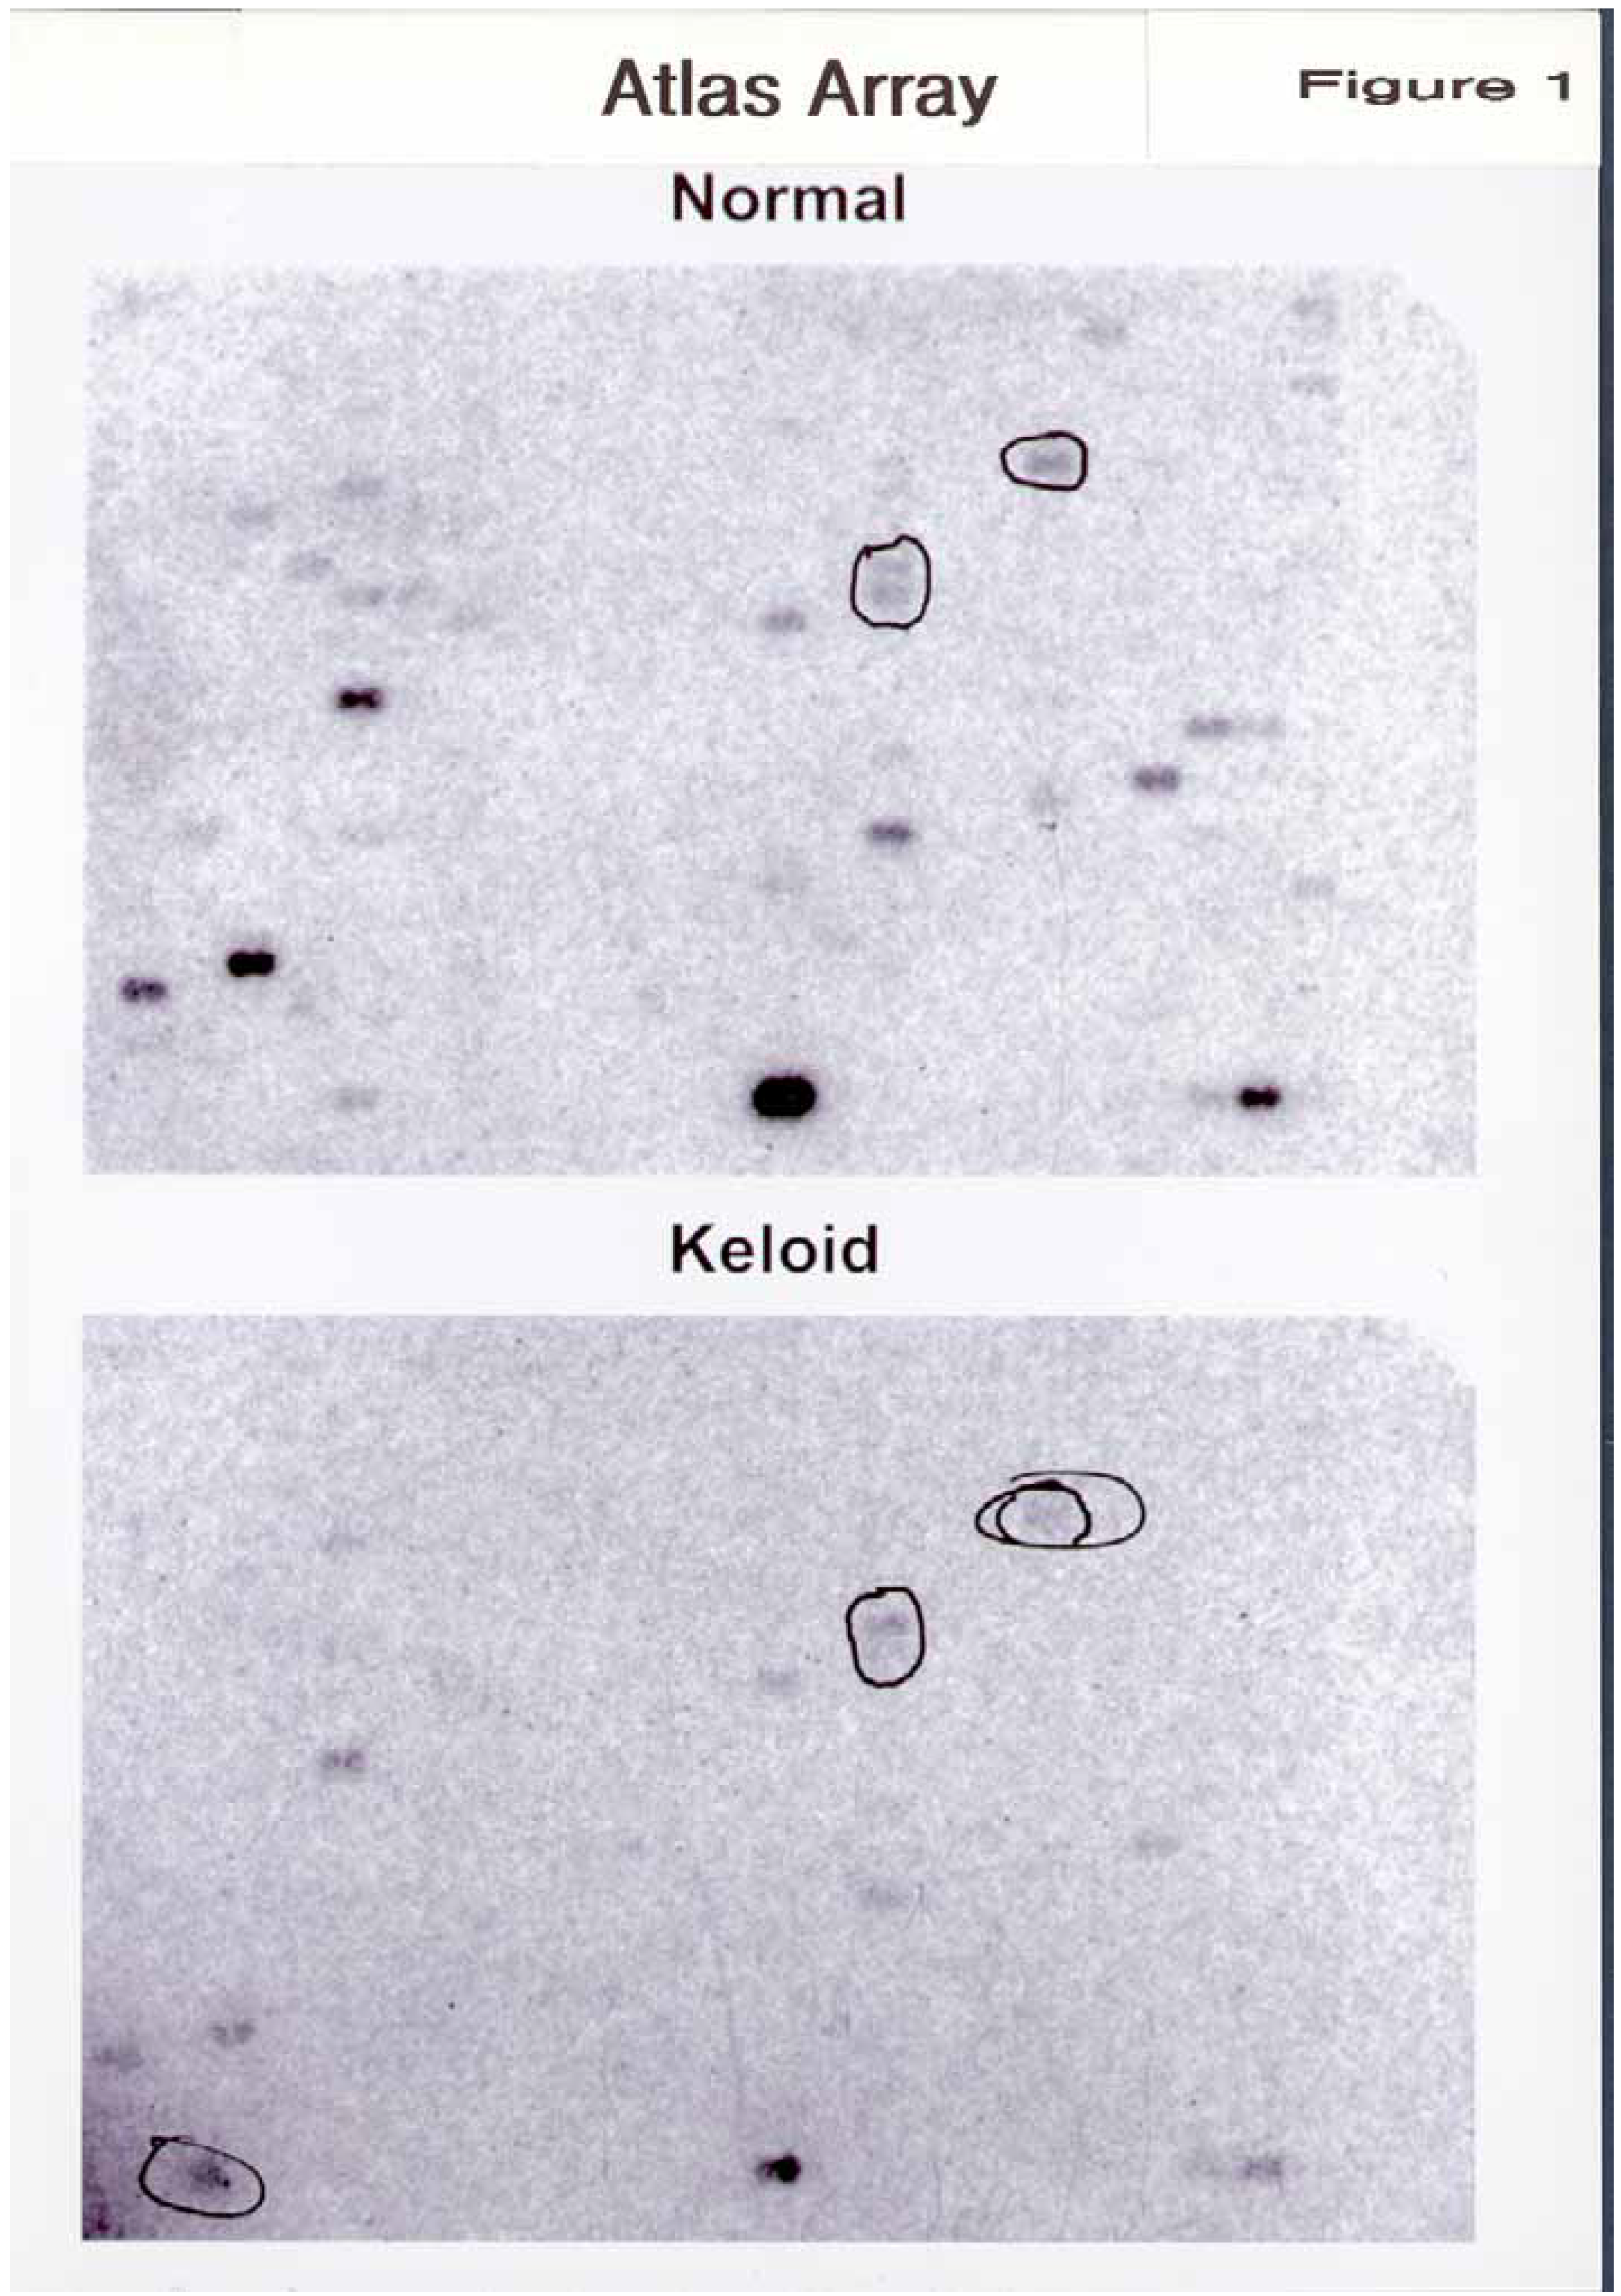
Figure 1). Transparent orientation grid is used to allow identification of cDNA corresponding to positive hybridization signals.
Reverse Transcription-Polymerase Chain Reaction (RT-PCR)
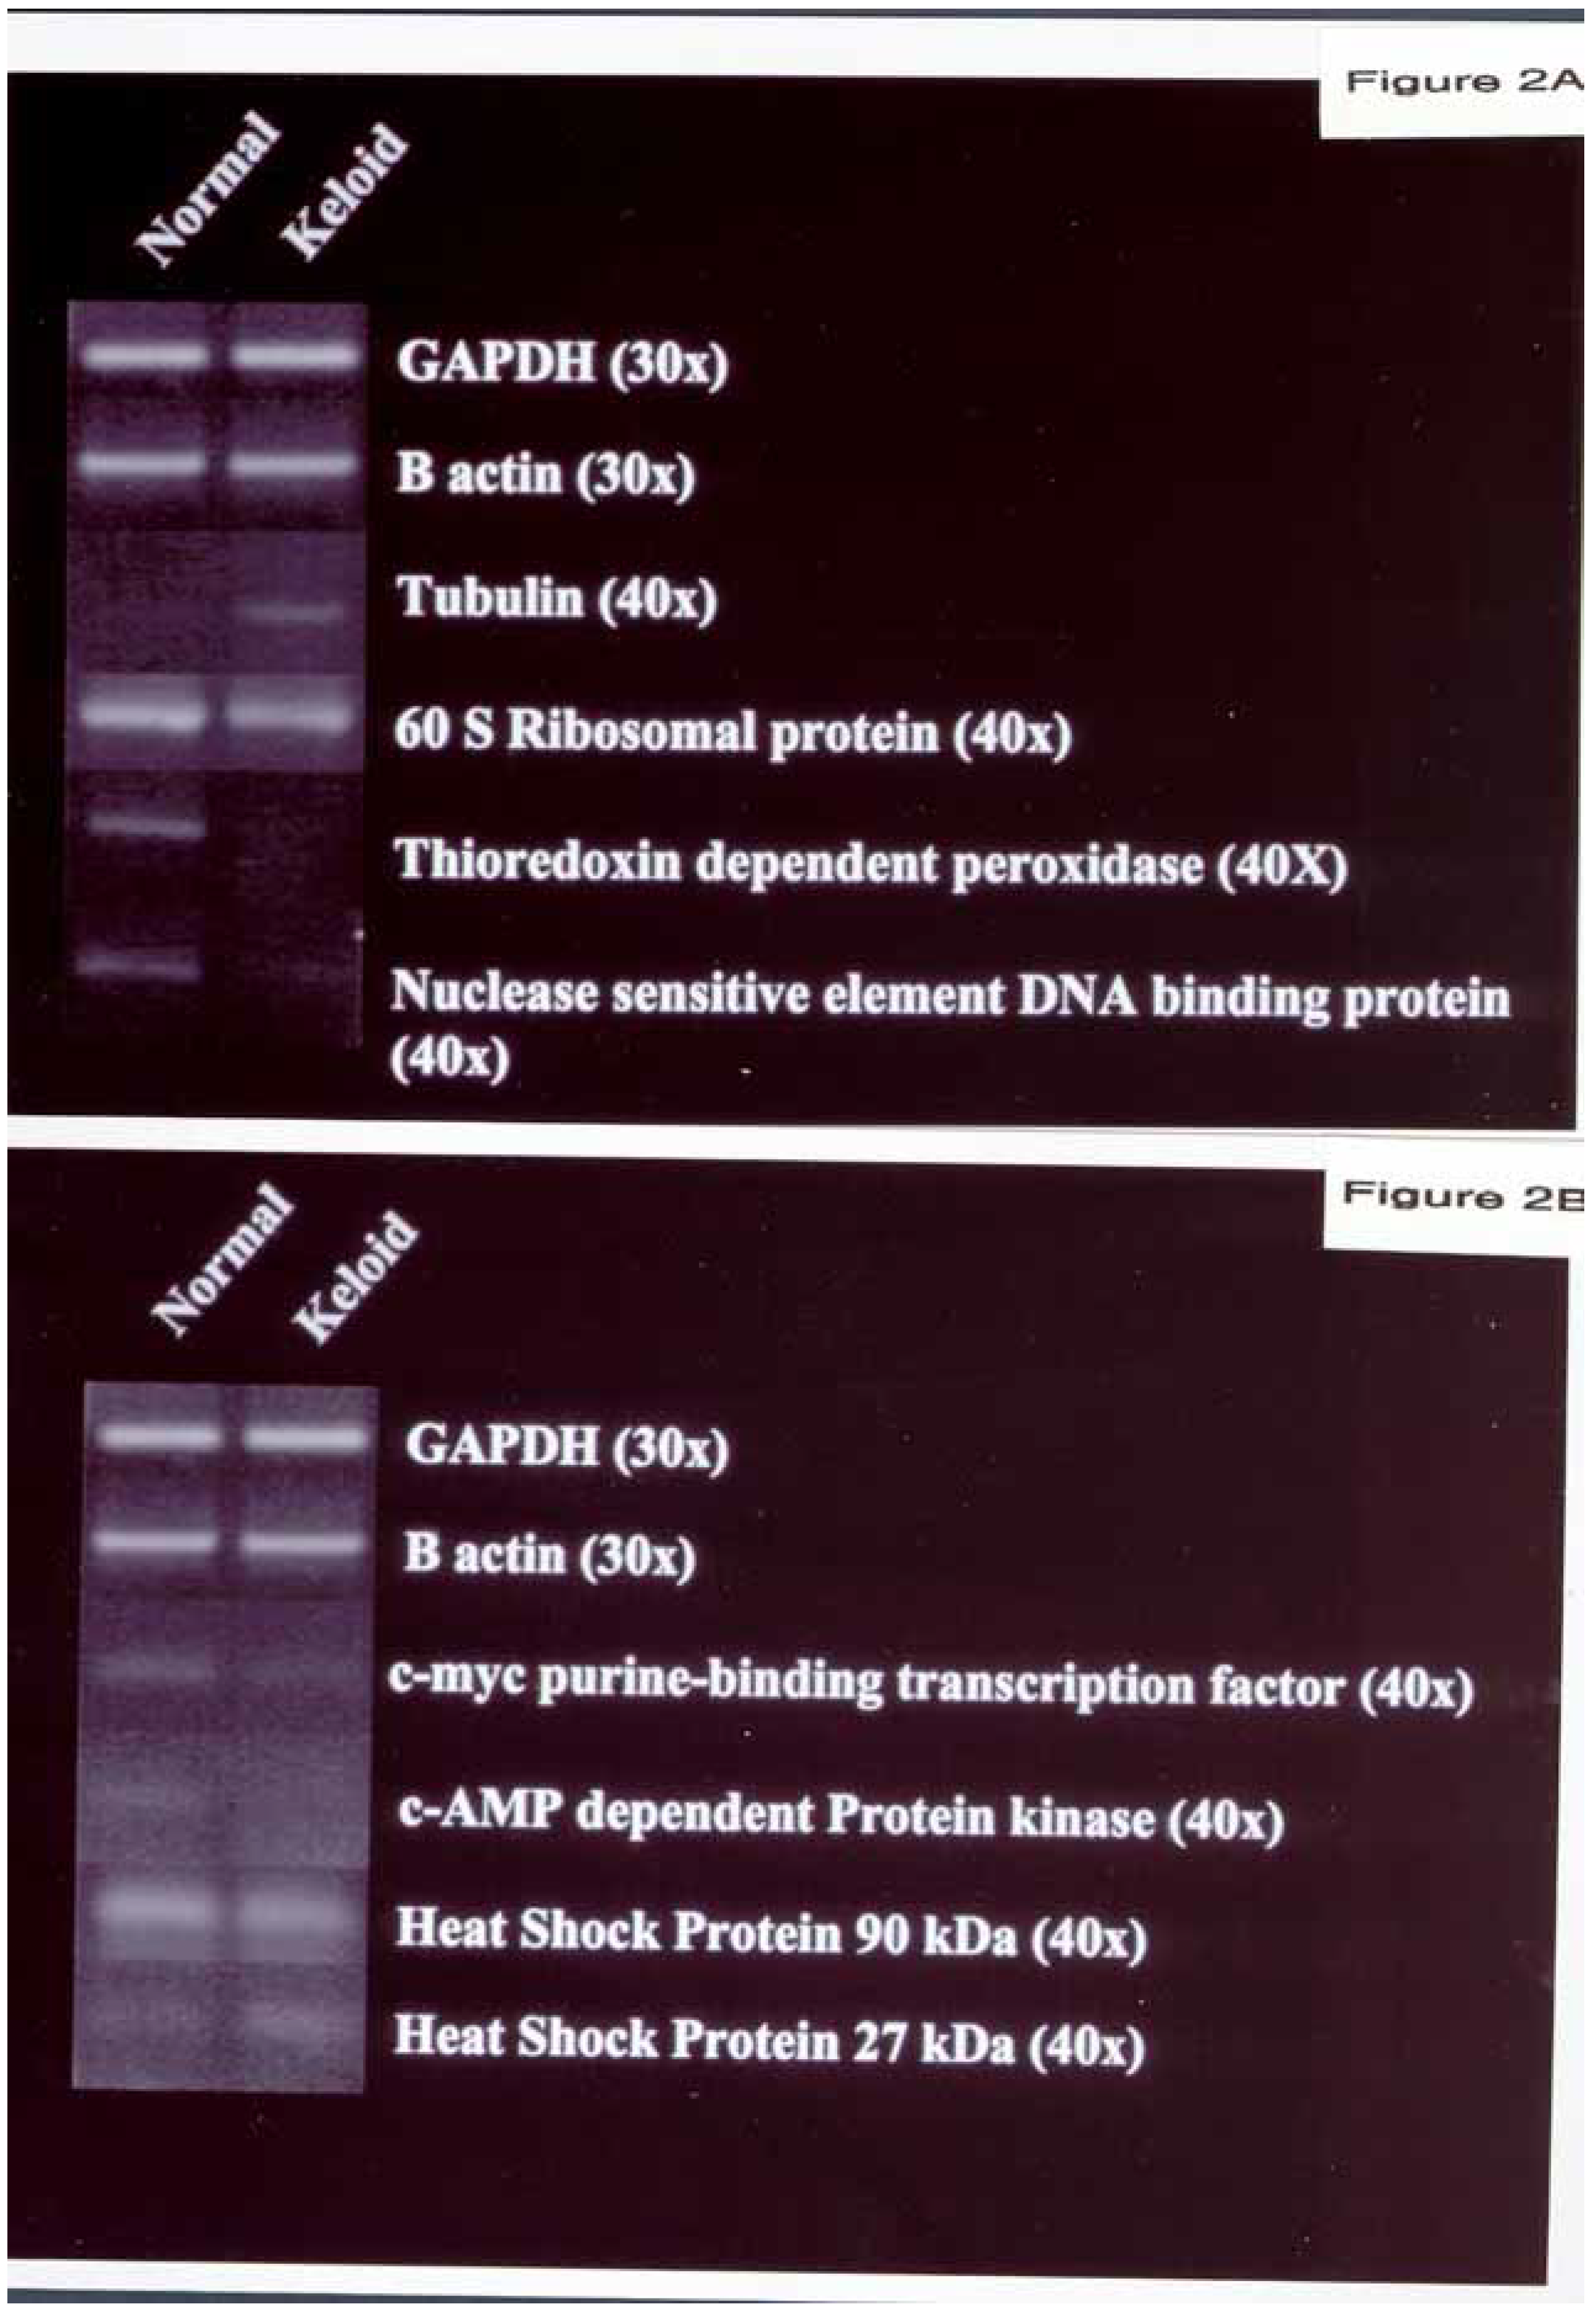
RNA from the above described extraction procedure was used in RT-PCR. The reverse transcription (RT) was done exactly the same as above. The sequence of the appropriate genes was obtained from Clontech corresponding to the sequence used in the Atlas Array. The polymerase chain reaction (PCR) was performed under the following conditions in a 25 µl reaction in a Perkin Elmer DNA Thermal Cycler: 10 pmol each primer, 200 µM dNTP, 1.25 U Taq, and 1X Taq reaction buffer (Promega). The PCR reactions were optimized for annealing temperature and were performed at 30-cycle number for the housekeeping gene GAPDH and beta-actin and 40-cycle number for other proteins (as detected by overlaying NDF on top of KDF). GAPDH and beta actin were amplified from the same RT reaction as an internal standard to ensure equivalence between controls. Polaroid photos of ethidium stained gels are shown in
Figure 2A and B, and results were semi-quantitative using this method.
Liver glyceraldehyde 3-phosphate dehydrogenase (GAPDH) gave an amplicon length of 269 bp [
13]. The sense primer sequence was 5’ggctctccagaacatcatccctgc and the anti-sense primer sequence was 5’gggtgtcgctgttgaagtcagagg. Cytoplasmic beta actin (β actin) gave an amplicon length of 385 bp [
14]. The sense primer sequence was 5’ctacgtcgccctggacttcgagc while the anti-sense primer sequence was 5’gatggagccgccgatccacacgg. The specific PCR primers used were from the following proteins:
- 1)
- 2)
Heat Shock Protein 27 kDa [
16],
- 3)
60 S ribosomal protein, a DNA binding protein [
17],
- 4)
Thioredoxin dependent peroxidase [
18],
- 5)
Nuclease sensitive element DNA binding protein [
19],
- 6)
c-myc purine-binding transcription factor, [
20],
- 7)
c-AMP dependent protein kinase [
21] and
- 8)
Heat Shock Protein 90 kDa [
22].
The specific primers used for the polymerase chain reaction corresponded to the genes that were positive in the Atlas Array. The sequence and the details of the gene products that were amplified from the results of the Atlas Array were available from the vendor.
RNA Fingerprinting Kit
Unique gene products were studied using the RNA Fingerprinting Kit. In this procedure, cDNA species were produced by reverse transcription of RNA, using an Oligo (dT) primer (30mer) consisting of a unique sequence followed by 9 thymidine bases followed by two other bases at the 3' end. RT was performed as described. RT conditions for a 10 µl reaction were: 2 µg RNA, 1µM (oligo(dT)) primer, 50µM dNTPs, 1X reaction buffer (5X supplied by the manufacturer) and 200 U MMLV-RT. RNA was incubated with oligo (dT) primers at 70oC for 3 min. RT was performed at 42 oC for 60 min and then terminated by heating at 75oC for 10 min. The enzyme was heat killed. These reverse transcribed cDNA species were then used as templates for PCR in the presence of radiolabelled dATP, using the same poly (T) primer and a 24-base primer arbitrary in sequence. Specifically, 1 µl (10%) of the RT reaction was used for PCR amplification of the cDNAs in a 20µl reaction, representing amplification of cDNA from 0.2 µg of total cellular RNA. The PCR reaction was performed under the following conditions in a Perkin Elmer DNA Thermal Cycler: 20µM each of arbitrary “P” primers and Oligo(dT) “T” primers and 50 µM dNTP and [α-32P]dATP (1000-3000 Ci/mmol; 3.3 µM; final concentration 50 nM) in 10X KlenTaq PCR reaction buffer and Advantage KlenTaq polymerase mix. This was subjected to one cycle of 94oC for 5 min, 40oC for 5 min and 68oC for 5 min. This was followed by two cycles of 94oC for 2 min, 40oC for 5 min and 68oC for 5 min. Finally, this was followed by 25 cycles of 94oC for 1 min, 60oC for 1 min, 68oC for 2 min followed by incubation at 68oC for additional 7 min. The radiolabelled samples were resolved on 6% acrylamide-urea DNA sequencing gel. The gel was autoradiographed by standard techniques. Differentially expressed genes were then identified in side-by-side analysis.
Results
Atlas Array hydridization was performed twice. There was less than 10% variation between the two different membrane sets on the phosphorimager analysis (
Figure 1).
Discarding the smudges and the classical housekeeping genes, we found 8 genes that were differentially expressed. Of the 8 genes, the breakdown was as follows (
Figure 2A and B).
Figure 1.
Differential gene expression in human keloid and normal dermal fibroblasts using Atlas Human Array. Poly A+ RNA was isolated from normal (upper panel) and keloid dermal fibroblasts (lower panel). 32P-labeled cDNA probes were generated from each poly A+ RNA sample and hybridized to the Atlas Human Array (#7740-1) according to the manufacturer’s protocol. Each PCR-amplified cDNA fragment is 200-500 bp and has been spotted in duplicate (8-10 ng of cDNA/dot). Membranes were exposed to Kodak Bio MS x-ray film with a BioMax MS intensifying screen at -70oC for 7 days. The bands that are circled show some of the obvious alterations in the level of expression.
Figure 2.
Different effect of keloid and normal dermal fibroblasts on gene expression from positively identified genes in Atlas Array. The genes that were down-regulated in KDF are: 60 S ribosomal protein, DNA binding protein, thioredoxin dependent peroxidase, nuclease sensitive element DNA binding protein,
c-myc purine-binding transcription factor, c-AMP dependent protein kinase and HSP 90kDa. The genes that are up-regulated in KDF are tubulin (
Fig. 2A), and HSP 27kDa (
Fig. 2B). The various genes are compared with GAPDH and β-actin. The primers used are illustrated in
Table 1 and the conditions used are described in Materials and Methods.
A housekeeping gene that was up regulated was brain-specific tubulin alpha 1 subunit.
- 1)
Three transcription factors and DNA-binding proteins that were down regulated were 60 S ribosomal protein L6, Thioredoxin dependent peroxidase and nuclease sensitive element DNA binding proteins.
- 2)
One apoptosis related gene that was down-regulated was c-myc purine-binding transcription factor.
- 3)
One intracellular signal transduction modulator that was down-regulated was c-AMP dependent protein kinase.
- 4)
Two stress response proteins that were effected were Heat Shock Protein (HSP) 90kDa and HSP 27kDa. HSP 90 was down regulated and HSP 27kDa was up-regulated.
We performed RT-PCR to confirm the Atlas Array results. RT-PCR gave the same qualitative results as the Atlas Array.
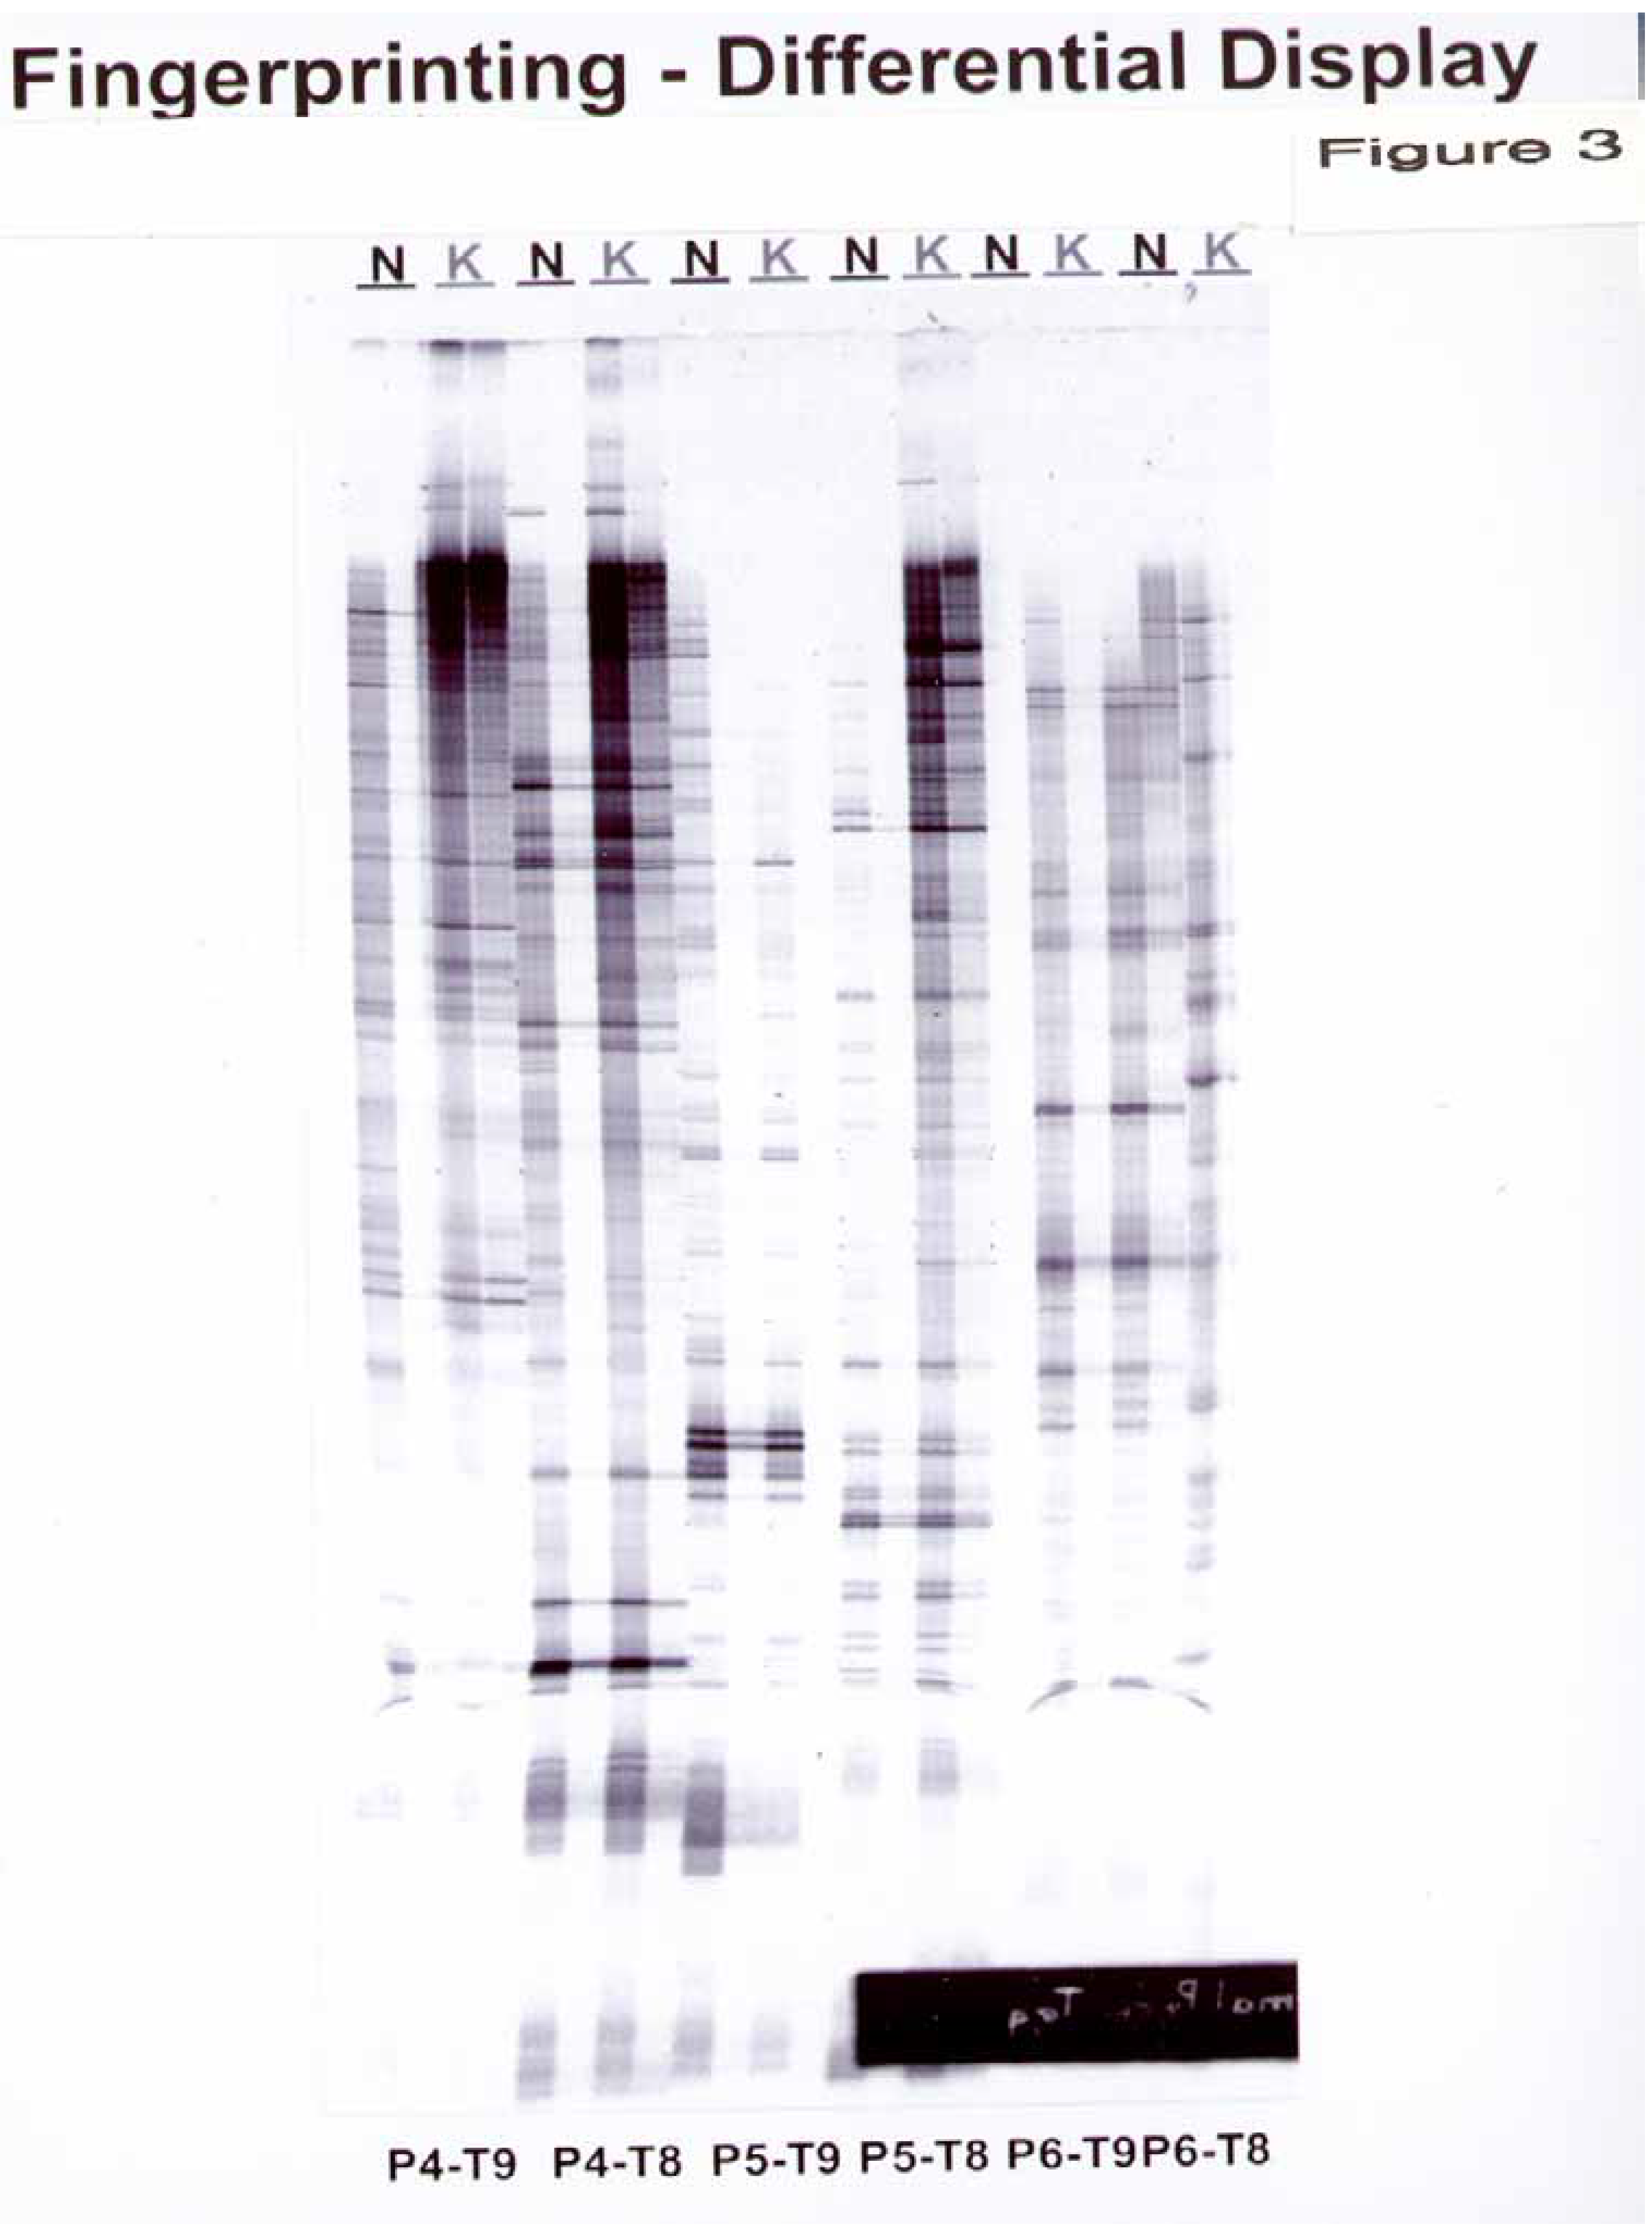
In RNA fingerprinting, we observed 17 bands with 3 arbitrary and 2 oligo(dT) primers. (
Figure 3) The sequences of the arbitrary PCR primers and Oligo(dT) primers are listed in
Table 1.
Table 1.
Sequences of primers included in the DeltaTM RNA fingerprinting kit
Table 1.
Sequences of primers included in the DeltaTM RNA fingerprinting kit
| | Arbitrary PCR primers |
| P4 | 5’-ATTAACCCTCACTAAATGCTGGTAG-3’ |
| P5 | 5’-ATTAACCCTCACTAAAGATCTGACTG-3’ |
| P6 | 5’-ATTAACCCTCACTAAATGCTGGGTG-3’ |
| | Oligo(dT) PCR primers |
| T8 | 5’CATTATGCTGAGTGATATACTTTTTTTTTGC-3’ |
| T9 | 5’CATTATGCTGAGTGAATATCTTTTTTTTTGG-3’ |
Discussion
The cDNA array data for cells in tissue culture passaged for 15 times demonstrates a very important distinction. After a number of passages in
in-vitro, cells lose the characteristic up-regulation of TGF– β1 and 2 [
9,
10,
11,
23]. To confirm the absence of a signal in the Atlas array, we performed RT-PCR for TGF-β 1,2 and 3. Surprisingly, no signal was found for TGF-β. The lack of TGF-β expression is extremely significant. TGF-β expression is a hallmark of keloid production and the fact that it is absent from these cells may have a profound influence on the RNA expression profiles. The aberrant lack of TGF-β expression may most likely be attributed to the advanced passage of cells.
Figure 3.
Differential display from normal versus keloid dermal fibroblasts using a Clontech’s Delta™ RNA Fingerprinting Kit. RNA was extracted as described in the Materials and Methods and reverse-transcribed with RTase. Polymerase chain reaction (PCR) of the resultant cDNA was performed with oligo(dT) PCR primers and arbitrary PCR primers listed in
Table 1. The PCR products were analyzed on 6% DNA sequencing gel. Dots across the lanes indicate amplified mRNA present in the samples. The NDF and KDF samples were run as two lanes with one lane corresponding to the original mixture and the second lane corresponding to a dilute (1:100) sample
A point to note is that cells were rendered quiescent by serum deprivation after 24 hrs. This synchronizes all the cells to the same point in the cell cycle. Thus, the genes which are expressed in the KDF and NDF are not due to the cell cycling process but are due to the pathologic response seen when comparing the two different types of fibroblasts.
There was no way to be certain that the phenotypes of the two cell lines tested were the same, however, according to light microscopy they were. Under ideal circumstances, the NDF and the KDF should be taken from the same location or derived from an old scar that did not form a keloid.
It is well established that keloids have a high proliferation activity compared to NDF [
24]. One hypothesis for the keloid scarring is the persistent activation of fibroblasts by chronic exposure to cytokines, like TGF-β, resulting in alterations in the production of collagen and glycosaminoglycans [
25].KDF showed a marked increase in extracellular matrix gene expression with prominent elevation in type I procollagen mRNA when compared to control fibroblasts cultured from uninvolved skin of normal subjects [
26]. The altered biosynthesis is due to an increase in the steady levels of mRNA, which could be due to an increased copy number or decreased turnover [
26]. Keloids have also been shown to have marked alterations in integrin expression, which are cell membrane structures that link cells to extracellular matrix [
27]. In the Atlas Array pro alpha 1 (I) collagen, fibronectin, extracellular matrix gene expression, type I procollagen and alpha1 integrin were not present on the array and thus could not be analyzed with the technique. Thus, an inherent difficulty is that only the genes contained on the Atlas Array will be identified.
The difference between the Atlas Array and mRNA differential display is that the Atlas Array enables one to measure the extent of expression in 588 known genes while the gene expressed in the mRNA differential display are unknown and have to be further sequenced and identified. Thus, Differential display technology may detect unique gene product(s) that have not previously been identified. The second main advantage of differential display is that the method requires small amounts of tissue/cells for direct comparison of the transcriptional profiles. Additionally, the advantage of investigating one cell type
in-vitro is that a defined cellular entity is being determined rather than the whole tissue with heterogeneous composition which may have more than one cell type contributing to the gene products [
28].
The genes up-regulated in KDF are α tubulin and HSP 27, while the down-regulated genes were viz., 60 S ribosomal protein, Thioredoxin dependent peroxidase, nuclease sensitive binding protein, c-myc binding protein, c-AMP dependent protein kinase and HSP 27. The description of the altered mRNA expression of the different proteins is as follows:
1) Brain-specific tubulin alpha 1 subunit(housekeeping gene)
Tubulin is the building block of microtubules. Introduction of it in dermal fibroblasts promotes cell division [
29]. KDF are proliferating more than NDF. Thus, KDF have an up-regulated expression of tubulins. Furthermore, transformation increases cell mobility and the appearance of long, thin cytoplasmic tails consisting of post-transcriptionally modified tubulins [
30]. Since KDF is a benign form of cancer, it is plausible that tubulin is up regulated in KDF.
2) Heat Shock Protein 27 kDa(stress response protein)
Mitogenic stimulation phosphorylates HSP 27 at a serine residue. It also plays a role in signal transduction. HSP 27 protects against ischemic and reoxygenation-mediated injury and inhibits apoptosis induction [
31]. This is up-regulated in KDF as keloid derived fibroblasts have depressed apoptosisand possess a greater proliferative potential than NDF [
32].
3) 60 S ribosomal protein L6, (transcription factors & DNA-binding protein)
The L6 protein from the large ribosomal subunit is one of the 82 different proteins of the ribosome [
33]. The mutation in this ribosomal protein is responsible for producing antibiotic resistance. KDF show down-regulation of L6. The rationale for its down-regulation in KDF is not understood.
4) Thioredoxin dependent peroxidase (transcription factors & DNA-binding proteins)
Thioredoxin is a small ubiquitous dithiol protein which joins the FAD-containing enzyme thioredoxin-reductase (TR) and NADPH as a hydrogen donor for ribonucleotide reductase which is essential for DNA synthesis and general protein disulphide reductase involved in redox regulation [
34]. The TR has a characteristic Cys-Se-Cys (selenocysteine) sequence as a redox center while thioredoxin peroxidase (TPx) functions only when linked to a sulfhydryl reducing system. This natural killer-enhancing factor also belongs to the thioredoxin dependent peroxidase-family. TPx interacts with the product of a proliferation association gene, pag, which is also a thiol specific antioxidant [
35]. TPx is responsible for protecting the cell against hypoxia and ischemic injury [
36]. Down-regulation of TR leads to lowering of cellular defense against peroxidation, and increases the risk for cell injury and apoptosis. The expression was down regulated in KDF in contrast to NDF.
5) Nuclease sensitive element DNA binding protein(transcription factors & DNA-binding proteins)
The homopurine/homopyrimidine-rich region sensitive to S1 nuclease activity binds the nuclease-sensitive element DNA binding protein. This protein binds both duplex and the C-rich strand
of c-myc nuclease sensitive element in a specific sequence manner
. Data suggests that this nuclear factor may directly or indirectly enhance transcription and thus be influential in the regulation of essential growth-control genes [
37,
38]. Down-regulation of this gene implies decreased apoptosis. There is down-regulation of the gene in KDF.
6) c-myc purine-binding transcription factor (PuF) (apoptosis related gene)
Transactivating factor PuF interacts with a nuclease hypersensitive element located upstream from the
c-myc gene. PuF was identified as being encoded by nm23-H2/NDP kinase gene [
37]. The nm23 expression is strictly related to the state of growth of the cells. Studies have demonstrated that there is a link between nm23 and the
c-myc oncogene suggesting that the nm23 protein can function
in-vitro in the transcriptional regulation of
c-myc expression. [
39]. Keloid is a form of benign cancer and an up-regulation of this gene induces keloids to divide more rapidly than normal fibroblasts. Down-regulation would lead to decreased programmed cell death in KDF [
7].
7) c-AMP dependent protein kinase (intracellular signal transduction modulators)
This protein phosphorylates specific substrate proteins involved in signal transduction on serine and threonine residues [
40]. Signal transduction plays a key regulatory role in the growth and metastatic potential of tumor cells. These signaling pathways form an interconnecting grid to regulate the homeostatic, survival, and invasive functions of the cell. Among the key regulatory molecules in these pathways are the serine/threonine-protein kinases, also known as cyclic AMP-dependent protein kinase (PKA). Oxidative stress serves as a mechanism to inhibit PKA activity. Down-regulation of these kinases in KDF reflects a decrease in oxidative stress and therefore decreases the risk for cellular injury and apoptosis [
40]. There is also a down-regulation of c-AMP-dependent protein kinase suggesting decreased apoptosis and oxidative stress in KDF.
8) Heat Shock Protein 90 kDa (stress response protein)
HSP 90 synthesis is associated with the replicative potential of the cells used. Aged diploid fibroblasts have a down-regulation of HSP 90 [
41]. Keloids show a down-regulation of HSP 90.
It has been previously shown that 8 apoptosis-related genes were significantly under-expressed in keloid tissue compared with normal scarring [
7]. These genes were defenders against cell death (DADD-1),
c-myc transcription factor, cytoplasmic glutathione S-transferase, microsomal glutathione-S-transferase, glutathione peroxidase, tumor necrosis factor receptor 1-associated protein, 19kDa interacting protein 3, and cytoplasmic dyenin light chain 1. Our observations were similar only in the up-regulation of
c-myc transcription factor and in the up-regulation of thioredoxin dependent peroxidase, an enzyme very similar in function to cytoplasmic glutathione-S-transferase, microsomal glutathione-S-transferase and glutathione peroxidase. It has also been reported that the receptor tyrosine kinase signals in KDF are more active than NDF [
42,
43].
In this study, all of the genes expressed fall in the pattern supporting the notion that the KDF have a greater proliferative capacity than the NDF and that there is decreased apoptosis among keloid fibroblasts. Our study suggests that there may be decreased oxidative stress in keloids coupled with decreased apoptosis. These results confirm and extend those of Calderon et al [
44].
After 15 passages in KDF, the Atlas Array identified altered expression of 8 genes out of 588 present on the array. In contrast, the RNA Fingerprinting Kit demonstrated that there are a maximum of 17 genes which may be differently regulated in KDF compared to NDF.
Studies using established dermal fibroblasts from keloids and normals with the Atlas Array identified changes in specific gene expression relevant to intracellular signaling stress proteins and transcription factors potentially involved in keloid formation. Differential display PCR suggests additional genes (at least 8) may be involved. This data should be interpreted with caution as these cells that were obtained after 15 passages may reduce their gene expression. Furthermore, genes that were up-/down-regulated may have been altered secondarily as a result of keloid formation. The Atlas Array only examined 588 genes, 8 of which were affected; whereas, the RNA Fingerprinting Kit with 3 arbitrary and 2 oligo-dT-specific primers gave 17 unique bands representing a maximum of at least 17 differentially regulated genes. Since the Atlas Array was confirmed by RT-PCR, it is reasonable to suggest that there is alteration in gene expression involving apoptosis, transcription factors, stress response genes and housekeeping genes in cells that have undergone 15 passages. Additional work will focus on the cloning of genes from the 17 bands obtained in fingerprinting and in designing specific studies where the tissue from keloid or old scars, rather than established cell lines, will be used.


