Quantitative Structure-Activity Relationships of Noncompetitive Antagonists of the NMDA Receptor: A Study of a Series of MK801 Derivative Molecules Using Statistical Methods and Neural Network

Abstract
:Introduction
Methods and Equipment


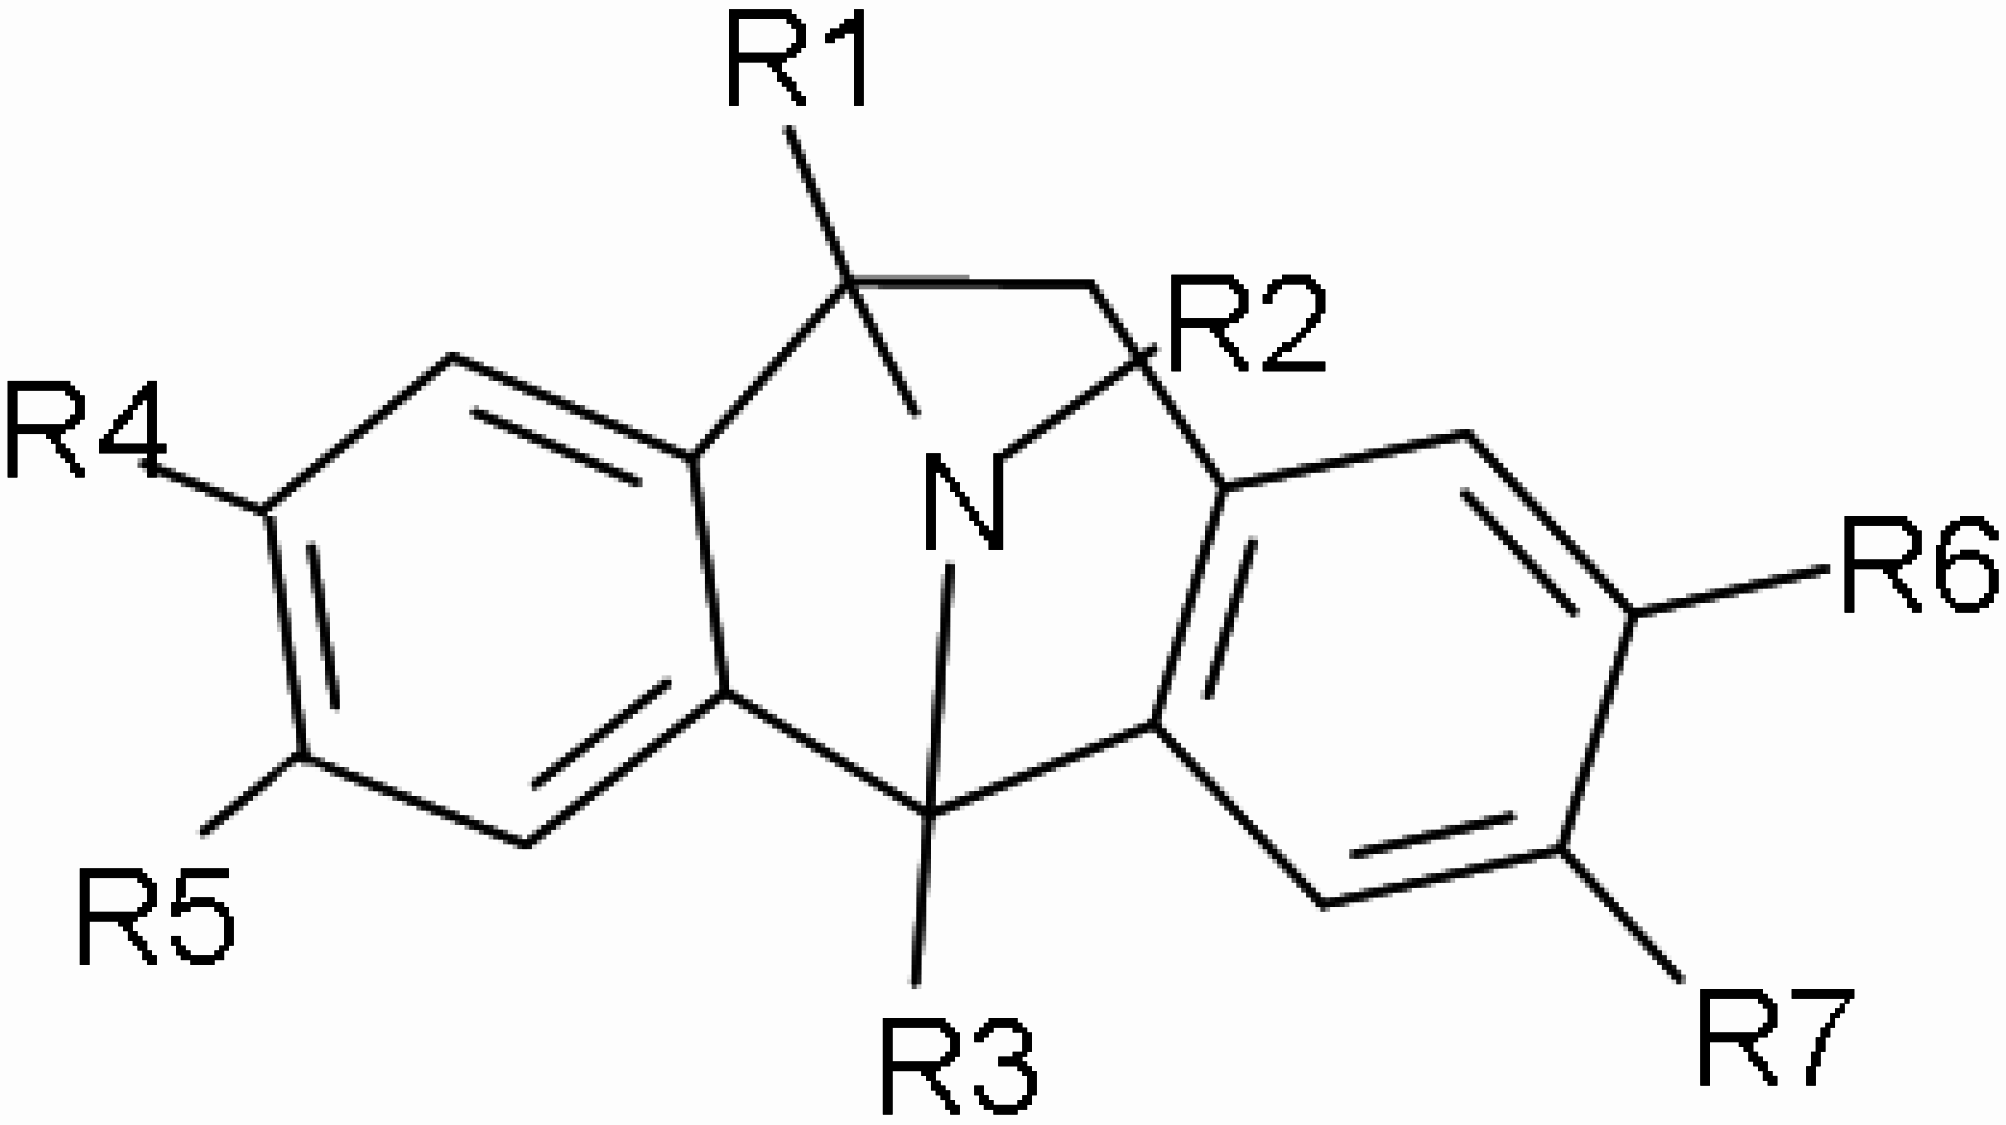
| N° | R1 | R2 | R3 | R4 | R5 | R6 | R7 | ki. μM | logKi-obs | logKi-mra | logKi-nn |
|---|---|---|---|---|---|---|---|---|---|---|---|
| 1 | H | CH3 | CH3 | H | H | H | H | 0.610 | -0.215 | -0.004 | -0.219 |
| 2 | H | H | CH3 | H | H | H | H | 0.056 | -1.252 | -1.605 | -1.232 |
| 3 | CH3 | CH3 | CH3 | H | H | H | H | 0.710 | -0.149 | -0.210 | -0.138 |
| 4 | H | OH | CH3 | H | H | H | H | 19.000 | 1.279 | 1.411 | 1.279 |
| 5 | H | H | CH2CH3 | H | H | H | H | 0.045 | -1.347 | -1.299 | -1.200 |
| 6 | H | CH2CH3 | H | H | H | H | H | 24.000 | 1.380 | 1.313 | 1.375 |
| 7 | OH | OH | CH2CO2ET | H | H | H | H | 4500.000 | 3.653 | 3.525 | 3.653 |
| 8 | OH | H | CH2CO2ET | H | H | H | H | 3.600 | 0.556 | 0.509 | 0.735 |
| 9 | H | H | CH2CH2OH | H | H | H | H | 0.260 | -0.585 | -0.850 | -0.485 |
| 10 | H | H | CH2CO2ET | H | H | H | H | 0.550 | -0.260 | -0.263 | -0.637 |
| 11 | H | H | CH(OH)CH2OH | H | H | H | H | 0.320 | -0.495 | 0.288 | -0.118 |
| 12 | H | H | CH2OH | H | H | H | H | 0.350 | -0.456 | -1.143 | -0.580 |
| 13 | H | H | CH2F | H | H | H | H | 0.160 | -0.796 | -0.882 | -0.590 |
| 14 | H | H | CH2CH2F | H | H | H | H | 0.174 | -0.759 | -0.583 | -1.005 |
| 15 | H | H | CH2SC6H5 | H | H | H | H | 73.000 | 1.863 | 2.107 | 1.778 |
| 16 | H | H | CH2S(O)C6H5 | H | H | H | H | 160.000 | 2.204 | 2.101 | 2.492 |
| 17 | OH | H | CH3 | H | H | H | H | 0.077 | -1.114 | -0.833 | -0.944 |
| 18 | F | H | CH3 | H | H | H | H | 0.930 | -0.032 | -0.195 | 0.017 |
| 19 | H | H | CH=CH2 | H | H | H | H | 0.087 | -1.060 | -1.066 | -1.167 |
| 20 | OH | H | CH2CO2H | H | H | H | H | 280.000 | 2.447 | 2.340 | 2.377 |
| 21 | OH | H | CH2CONH2 | H | H | H | H | 6.400 | 0.806 | 0.892 | 0.506 |
| 22 | Cl | H | CH2CO2H | H | H | H | H | 4500.000 | 3.653 | 3.710 | 3.594 |
| 23 | Cl | H | CH2CONH2 | H | H | H | H | 90.000 | 1.954 | 2.262 | 2.032 |
| 24 | H | H | CH(OH)CO2H | H | H | H | H | 1000.000 | 3.000 | 2.694 | 2.859 |
| 25 | Cl | H | CH2CH2Cl | H | H | H | H | 53.000 | 1.724 | 1.606 | 1.671 |
| 26 | H | H | CH3 | H | H | Cl | H | 0.084 | -1.076 | -1.260 | -1.407 |
| 27 | H | H | CH3 | H | Cl | H | H | 0.011 | -1.959 | -1.605 | -1.232 |
| 28 | H | H | CH3 | H | H | Br | H | 0.180 | -0.745 | -0.815 | -0.745 |
| 29 | H | H | CH3 | H | H | OCH3 | H | 0.036 | -1.444 | -1.305 | -1.407 |
| 30 | H | H | CH3 | H | H | OH | H | 0.023 | -1.638 | -1.445 | -1.407 |
| 31 | H | H | CH3 | H | NH2 | H | H | 0.027 | -1.569 | -1.485 | -1.407 |
| 32 | H | H | CH3 | H | Br | H | H | 0.080 | -1.097 | -1.605 | -1.232 |
| 33 | H | H | CH3 | H | I | H | H | 0.011 | -1.959 | -1.605 | -1.232 |
| 34 | H | H | CH3 | H | OCH3 | H | H | 0.046 | -1.337 | -0.861 | -1.406 |
| 35 | H | H | CH3 | H | OH | H | H | 0.018 | -1.745 | -1.637 | -1.407 |
| 36 | H | H | CH3 | H | CH2OH | H | H | 0.137 | -0.863 | -1.113 | -1.406 |
| 37 | H | H | CH3 | H | CH3 | H | H | 0.034 | -1.469 | -1.233 | -1.407 |
| 38 | H | H | CH3 | H | (CH2)3CH3 | H | H | 1.250 | 0.097 | -0.117 | -0.699 |
| 39 | H | H | CH3 | H | C6H5 | H | H | 0.032 | -1.495 | -1.491 | -0.699 |
| 40 | H | H | CH3 | OCH3 | H | H | H | 0.610 | -0.215 | -0.272 | -1.232 |
| 41 | H | H | CH3 | H | H | H | OCH3 | 0.033 | -1.481 | -1.605 | -1.232 |
| 42 | H | H | CH3 | OH | H | H | H | 0.277 | -0.558 | -0.487 | -1.232 |
| 43 | H | H | CH3 | H | H | H | OH | 0.049 | -1.310 | -1.605 | -1.232 |
| 44 | H | H | CH3 | H | F | F | H | 0.031 | -1.509 | -1.425 | -1.407 |
Results and Discussion
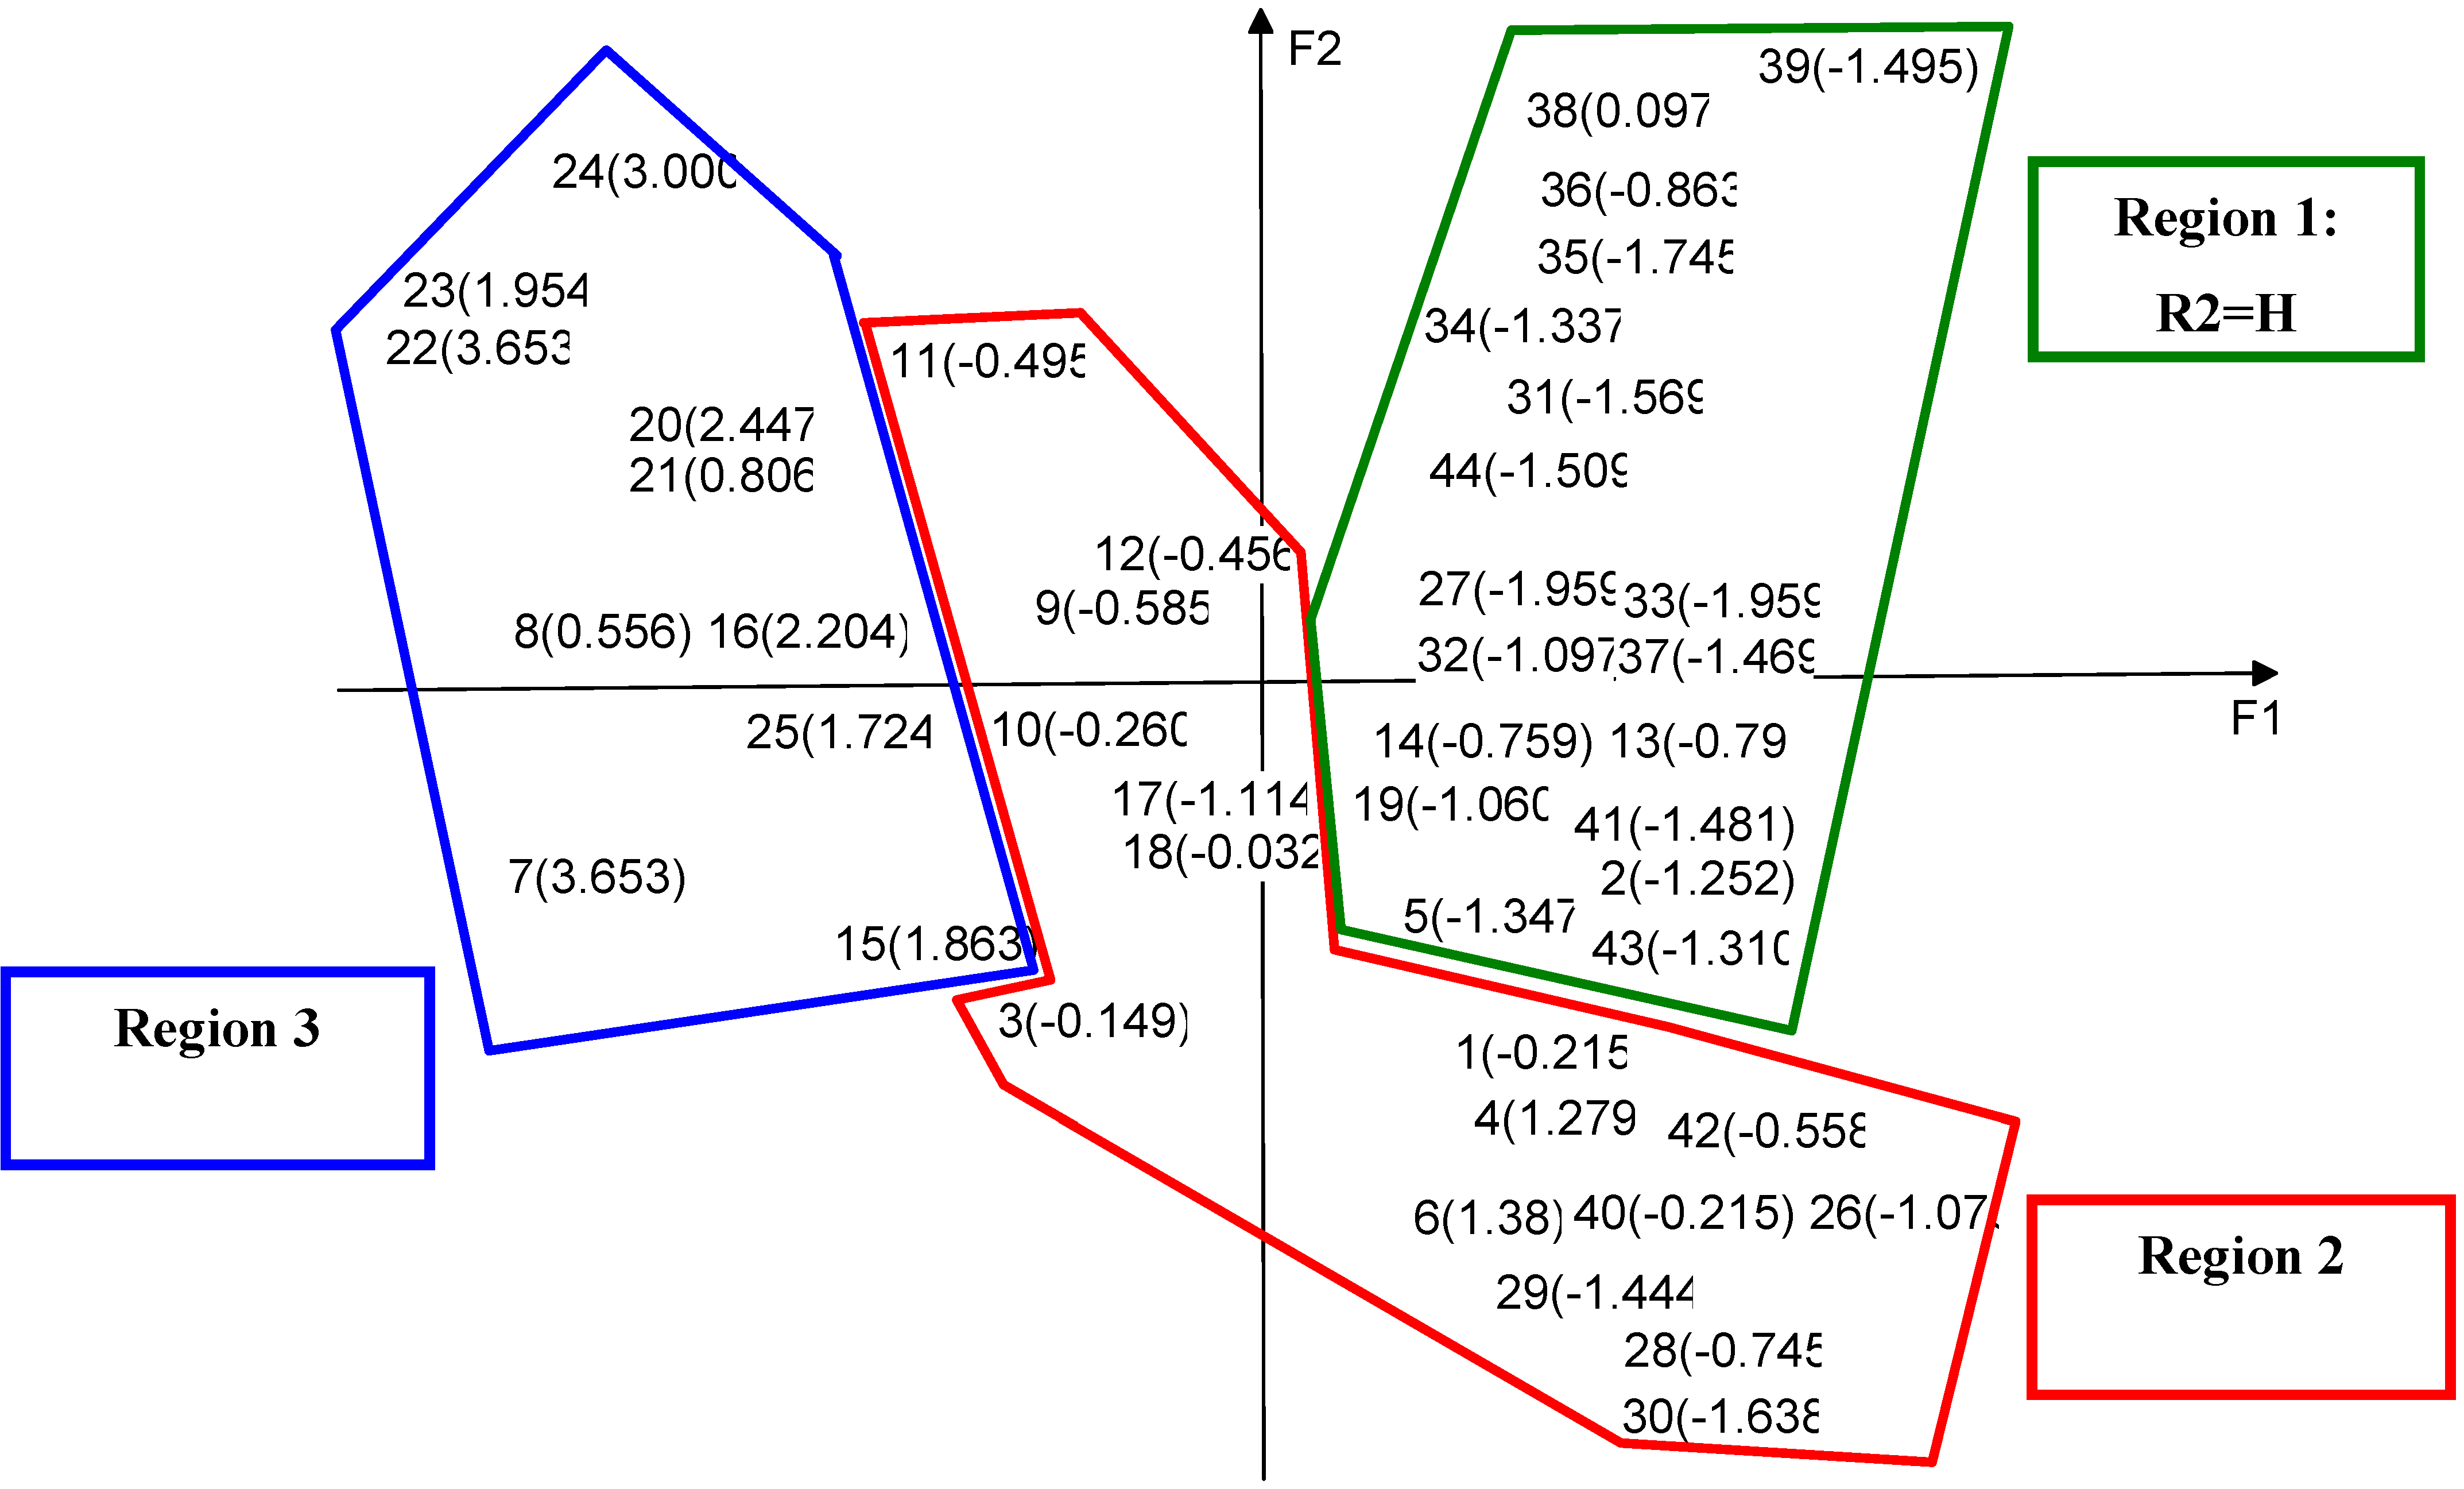
Principal Components Analysis
| Descriptor | F1 | F 2 | F 3 | Descriptor | F 1 | F 2 | F 3 |
| EN(R3) | 0.073 | 0.000 | 0.000 | Fi(R5) | 0.007 | 0.000 | 0.022 |
| L(R3) | 0.069 | 0.000 | 0.000 | Fpi(R5) | 0.006 | 0.000 | 0.025 |
| MW(R3) | 0.069 | 0.000 | 0.000 | MR(R6) | 0.006 | 0.000 | 0.000 |
| VW(R3) | 0.063 | 0.000 | 0.000 | MW(R6) | 0.006 | 0.000 | 0.001 |
| HBA(R3) | 0.062 | 0.000 | 0.000 | HBA(R7) | 0.006 | 0.090 | 0.042 |
| MR(R3) | 0.056 | 0.000 | 0.000 | HBA(R4) | 0.006 | 0.067 | 0.085 |
| EN(R1) | 0.044 | 0.000 | 0.000 | EN(R7) | 0.005 | 0.090 | 0.042 |
| HBA(R1) | 0.043 | 0.000 | 0.000 | EN(R4) | 0.005 | 0.067 | 0.065 |
| VW(R1) | 0.037 | 0.000 | 0.000 | MW(R7) | 0.005 | 0.089 | 0.041 |
| MW(R1) | 0.035 | 0.000 | 0.000 | MW(R4) | 0.005 | 0.066 | 0.085 |
| Fi(R1) | 0.035 | 0.000 | 0.000 | L(R7) | 0.005 | 0.088 | 0.041 |
| HBD(R1) | 0.034 | 0.000 | 0.000 | L(R4) | 0.005 | 0.065 | 0.064 |
| L(R1) | 0.033 | 0.000 | 0.000 | VW(R7) | 0.005 | 0.083 | 0.038 |
| Fpi(R3) | 0.030 | 0.000 | 0.000 | VW(R4) | 0.005 | 0.061 | 0.060 |
| MR(R1) | 0.027 | 0.000 | 0.000 | MR(R7) | 0.005 | 0.079 | 0.037 |
| EN(R5) | 0.021 | 0.000 | 0.055 | MR(R4) | 0.005 | 0.058 | 0.057 |
| VW(R5) | 0.020 | 0.000 | 0.055 | L(R6) | 0.004 | 0.000 | 0.000 |
| MR(R5) | 0.017 | 0.000 | 0.055 | HBD(R5) | 0.003 | 0.000 | 0.004 |
| HBD(R3) | 0.017 | 0.000 | 0.000 | HBD(R7) | 0.002 | 0.030 | 0.014 |
| MW(R5) | 0.012 | 0.000 | 0.038 | HBD(R4) | 0.002 | 0.022 | 0.022 |
| L(R5) | 0.008 | 0.000 | 0.046 | EN(R2) | 0.002 | 0.000 | 0.000 |
| Fi(R3) | 0.008 | 0.000 | 0.000 | Fi(R7) | 0.002 | 0.024 | 0.011 |
| HBA(R5) | 0.008 | 0.000 | 0.016 | Fi(R4) | 0.002 | 0.017 | 0.017 |
| EN(R6) | 0.008 | 0.000 | 0.001 | Fi(R6) | 0.002 | 0.000 | 0.000 |
| HBD(R2) | 0.008 | 0.000 | 0.000 | HBD(R6) | 0.001 | 0.000 | 0.000 |
| HBA(R2) | 0.008 | 0.000 | 0.000 | MW(R2) | 0.001 | 0.000 | 0.000 |
| VW(R6) | 0.008 | 0.000 | 0.001 | L(R2) | 0.001 | 0.000 | 0.000 |
| Fi(R2) | 0.007 | 0.000 | 0.000 | VW(R2) | 0.000 | 0.000 | 0.000 |
| HBA(R6) | 0.007 | 0.000 | 0.001 | MR(R2) | 0.000 | 0.000 | 0.000 |

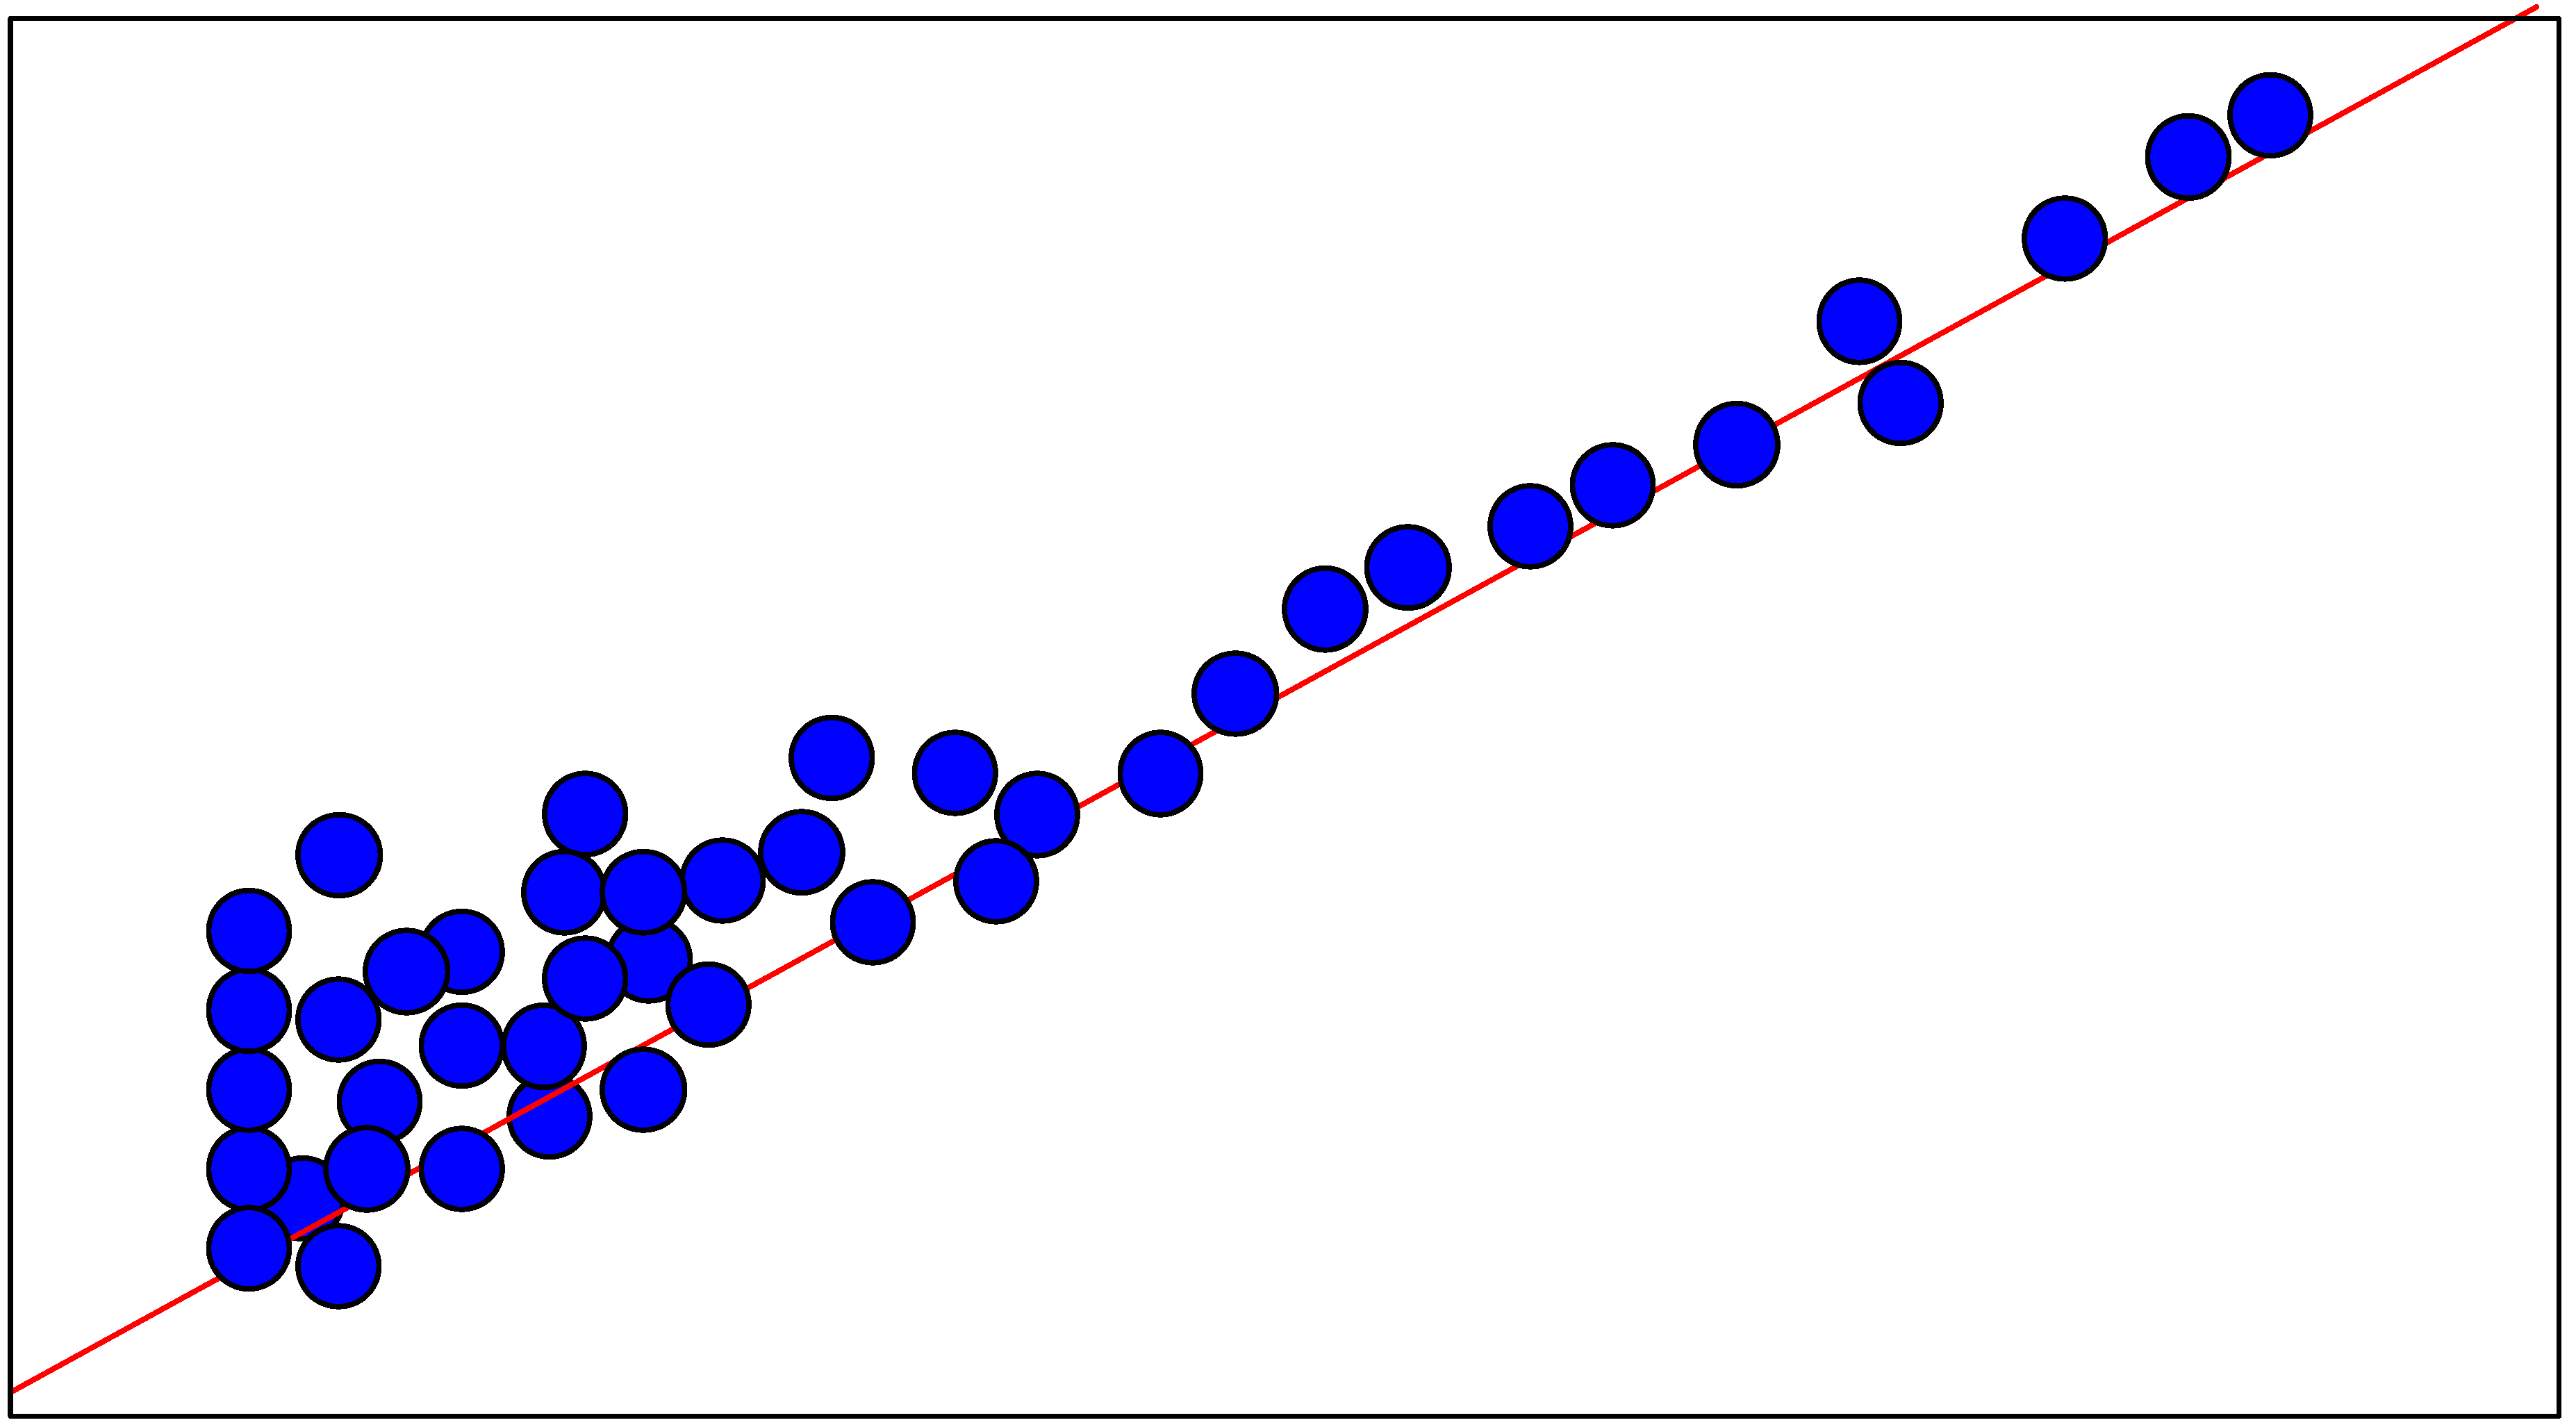
Multiple Regression Analysis
| Descriptor | Coefficient | Standard error | t-value |
| MW(R1) | 0.099 | 0.014 | 7.280 |
| MW(R6) | 0.010 | 0.004 | 2.753 |
| VW(R1) | -0.155 | 0.046 | -3.337 |
| VW(R2) | -0.091 | 0.036 | -2.541 |
| L(R3) | -0.744 | 0.180 | -4.135 |
| L(R5) | 0.372 | 0.073 | 5.113 |
| EN(R2) | 0.998 | 0.115 | 8.665 |
| EN(R3) | 0.285 | 0.049 | 5.801 |
| HBD(R3) | 2.381 | 0.293 | 8.130 |
| HBD(R5) | -0.505 | 0.335 | -1.506 |
| HBA(R4) | 0.860 | 0.168 | 5.132 |
| Fpi(R3) | 0.132 | 0.063 | 2.091 |
| Fpi(R5) | -0.229 | 0.069 | -3.311 |
| Fi(R3) | 0.614 | 0.125 | 4.911 |
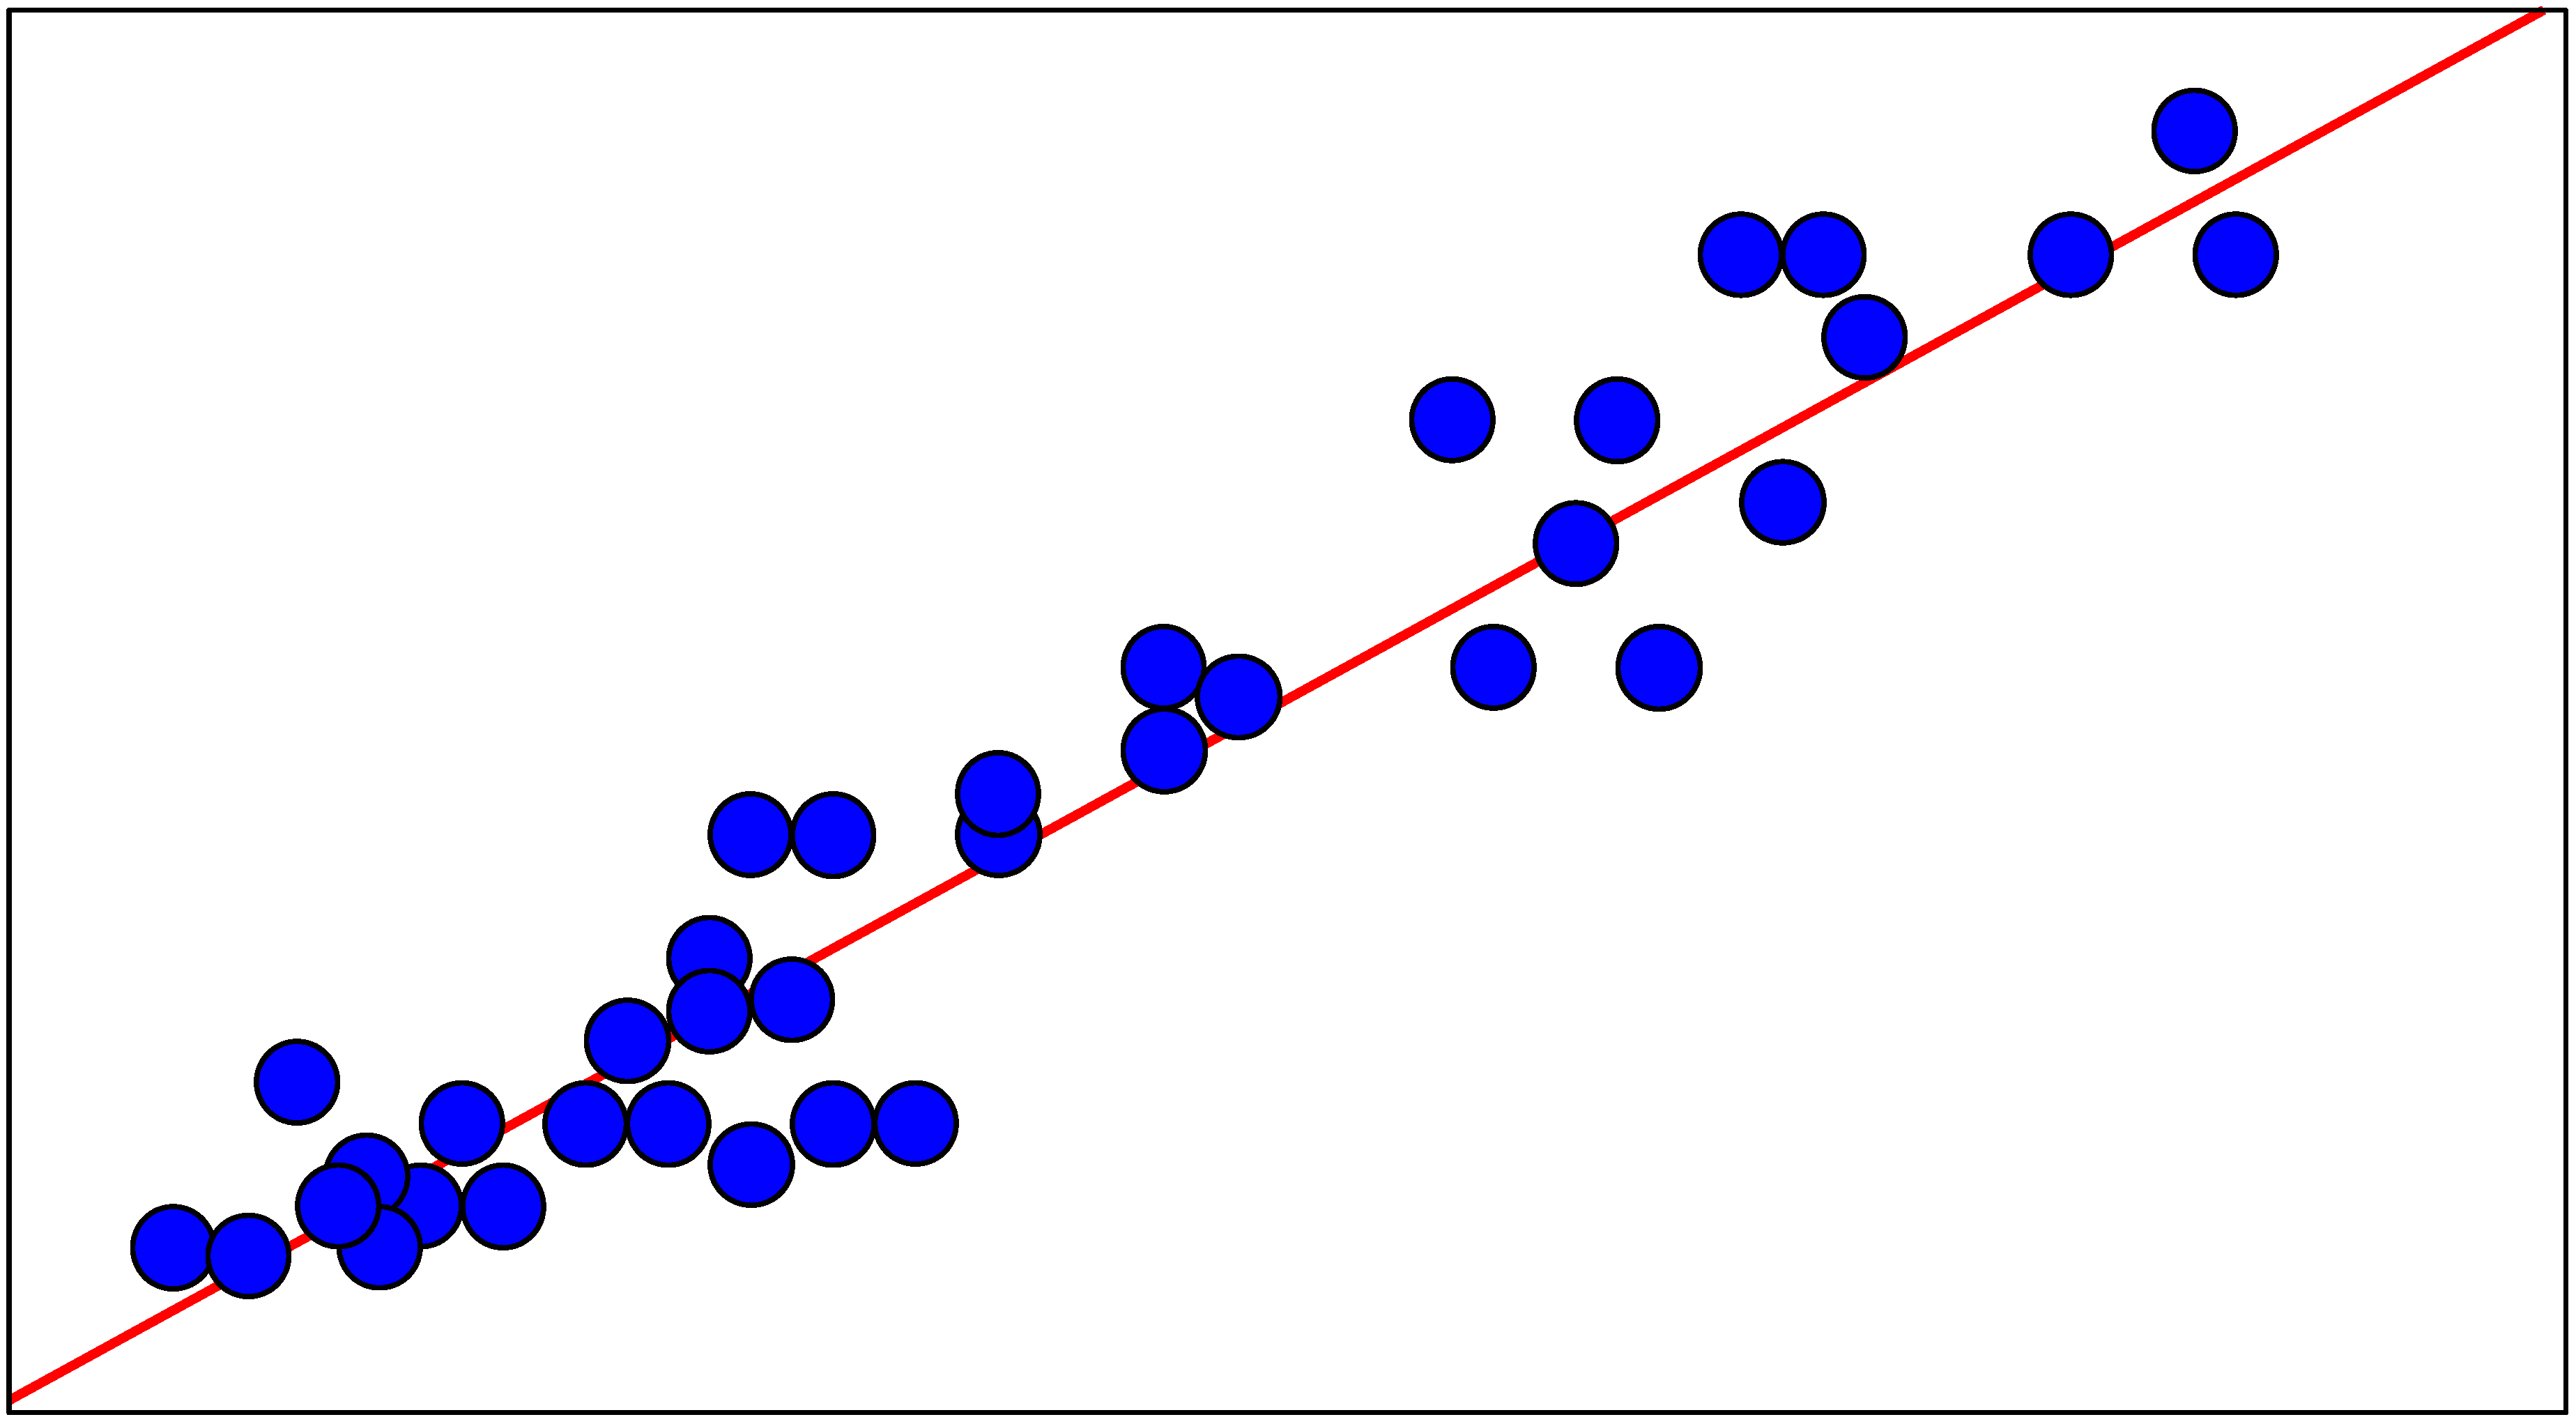
Neural Network
Training

Test
| N° | logKi-obs | logKi-cv | N° | logKi-obs | logKi-cv |
| 1 | -0.215 | -0.304 | 23 | 1.954 | 3.307 |
| 2 | -1.252 | -1.334 | 24 | 3.000 | 2.857 |
| 3 | -0.149 | -0.093 | 25 | 1.724 | 0.600 |
| 4 | 1.279 | 1.283 | 26 | -1.076 | -1.143 |
| 5 | -1.347 | -1.177 | 27 | -1.959 | -1.295 |
| 6 | 1.380 | 1.825 | 28 | -0.745 | -0.652 |
| 7 | 3.653 | 3.912 | 29 | -1.444 | -1.236 |
| 8 | 0.556 | 2.012 | 30 | -1.638 | -1.374 |
| 9 | -0.585 | -0.354 | 31 | -1.569 | -1.302 |
| 10 | -0.260 | 0.023 | 32 | -1.097 | -1.235 |
| 11 | -0.495 | -0.484 | 33 | -1.959 | -1.309 |
| 12 | -0.456 | -1.142 | 34 | -1.337 | -1.293 |
| 13 | -0.796 | -0.853 | 35 | -1.745 | -1.268 |
| 14 | -0.759 | -0.708 | 36 | -0.863 | -1.143 |
| 15 | 1.863 | 1.540 | 37 | -1.469 | -1.303 |
| 16 | 2.204 | 3.383 | 38 | 0.097 | -1.225 |
| 17 | -1.114 | -1.261 | 39 | -1.495 | -0.172 |
| 18 | -0.032 | -1.057 | 40 | -0.215 | -1.277 |
| 19 | -1.060 | -1.174 | 41 | -1.481 | -1.349 |
| 20 | 2.447 | 2.913 | 42 | -0.558 | -1.205 |
| 21 | 0.806 | 0.117 | 43 | -1.310 | -1.265 |
| 22 | 3.653 | 3.065 | 44 | -1.509 | -1.408 |

| Compound N° | R1 | R2 | R3 | R4 | R5 | R6 | R7 | Ki, μM | logKi-obs | logKi-test |
| 45 | H | CH3 | H | H | H | H | H | 12.000 | 1.081 | 0.972 |
| 46 | H | CH2CH2OH | H | H | H | H | H | 71.000 | 1.854 | 2.066 |
| 47 | H | H | CH2CH2CH3 | H | H | H | H | 8.600 | 0.921 | 0.750 |
| 48 | OH | H | CH2CH2OH | H | H | H | H | 0.074 | -1.328 | -1.229 |
| 49 | H | H | CH(OH)CO2ET | H | H | H | H | 0.390 | -0.408 | -0.547 |
| 50 | Cl | H | CH2CH2OH | H | H | H | H | 0.280 | -0.553 | -0.542 |
Conclusion
References
- Olney, J.W. Annu. Rev. Pharmacol. 1990, 30, 47. [CrossRef]
- Meldrum, B.S.; Garthwaite, J. Trends Pharmacol. Sci. 1990, 11, 379.
- Andrianov, G.N.; Bretschneider, F.; Peters, R.C. Neuroscience 1997, 79, 1231.
- Thompson, W. J.; Anderson, P. S.; et al. J. Med. Chem. 1990, 33, 789. [CrossRef] [PubMed]
- Kroemer, R. T.; Koutsilieri, E.; Hecht, P.; Liedl, K.R.; Riederer, P.; Kornhuber, J. J. Med. Chem. 1998, 41, 393. [CrossRef]
- Cone, E. J.; Mcquinn, R.L.; Shannon, H.E. J. Pharmacol. Exp. Ther. 1983, 228, 147.
- Lloyd, E.J.; Andrews, P.R. J. Med. Chem. 1986, 29, 453. [CrossRef]
- Andrews, P.R.; Lloyd, E.J. Prog. Med. Chem. 1986, 23, 91.
- Andrews, P.R.; Lloyd, E.J.; Martin, J.L.; Munro, S.L.A. J. Mol. Graphics 1986, 4, 41. [CrossRef]
- Wong, M.G.; Defina, J.A.; Andrews, P.R. J. Med. Chem. 1986, 29, 562. [CrossRef]
- Laguerre, M.; Elhallaoui, M.; Carpy, A. Molecular modeling of noncompetitive antagonists of NMDA receptor. In Trends in QSAR and Molecular Modeling 92ESCOM; Wermuth, C.G., Ed.; 1992; pp. 444–445. [Google Scholar]
- Elhallaoui, M. Modélisation moléculaire d'antagonistes non compétitifs du récepteur NMDA. Doctoral dissertation, Bordeaux II, France, 1994. [Google Scholar]
- Elhallaoui, M.; Carpy, A.; Laguerre, M.; Ouazzani, C.F. J. Mol. Model. 2002, 8, 65–72. [CrossRef]
- STATLAB TM, Logiciel d'Analyse statistique de données, version 2, développée par DELBEC T., JAMBU M. and all, 1992.
- SYSTAT version 5.02 for windows by SYSTAT, INC., 1800 sherman Ave. Evanston, IL USA 60201.
- MATLAB, the language of technical computing, version 5.2.0.3084, January 17, 1998.
- Bondi, A. J. Phys. Chem 1964, 68, 441.
- Pauling, L. The Nature Of Chemical Bond, Third Edition ed; Cornell University Press, 1960; p. 85. [Google Scholar]
- Hanch, C.; Leo, A.; Unger, S.H.; Kim, K.H.; Nikaitani, D.; Lien, E.J. J. Med. Chem. 1973, 16, 1207. [CrossRef]
- Chastrette, M.; Zakarya, D.; Elmouaffek, A. Eur. J. Med. Chem. –Chim. Ther. 1986, 21, 505.
- Nys, G.G.; Rekker, R.F. Chim. Ther. 1973, 8, 521.
- Nys, G.G.; Rekker, R.F. Eur. J. Med. Chem. 1974, 9, 361.
- Rekker, R.F. The Hydrophobic Fragmental Constant; Elseiver: Amsterdam, 1977; p. 31. [Google Scholar]
- Broto, P.; Moreau, G.; Vandycke, C. Eur. J. Med. Chem. –Chim. Ther. 1984, 19, 61.
- Broto, P.; Moreau, G.; Vandycke, C. Eur. J. Med. Chem. –Chim. Ther. 1984, 19, 66.
- Breindl, A.; Beck, B.; Clark, T.; Robert, C.; Glen, R.C. J. Mol. Model. 1997, 3, 142. [CrossRef]
- So, S.-S.; Richards, W. G. J. Med. Chem. 1995, 35, 3201. [CrossRef]
- Oinuma, H.; Miyako, K.; Yamanaka, M.; Nomoto, K.I.; Katoh, H.; Sawada, K.; Shino, M.; Mamano, S. J. Med. Chem. 1990, 33, 905. [CrossRef]
- Aoyama, T.; Suzuki, Y.; Ichikawa, H. J. Med. Chem. 1990, 33, 2583. [CrossRef]
- Lopez-Rodriguez, M.L.; Morcillo, M.J.; Fernandez, E.; Rosado, M.L.; Pardo, L.; Schaper, K.J. J. Med. Chem. 2001, 44(2), 186–197. [CrossRef]
- Andrea, T.A.; Kalayeh, H. J. Med. Chem. 1991, 34, 2824–2836. [CrossRef]
- Cramer, R. D., III; Bunce, J. D.; Patterson, D. E. Quant. Struct. -Act. Relat. 1988, 7, 18. [CrossRef]
© 2003 by MDPI (http://www.mdpi.org). Reproduction for noncomercial purposes permitted.
Share and Cite
Elhallaoui, M.; Elasri, M.; Ouazzani, F.; Mechaqrane, A.; Lakhlifi, T. Quantitative Structure-Activity Relationships of Noncompetitive Antagonists of the NMDA Receptor: A Study of a Series of MK801 Derivative Molecules Using Statistical Methods and Neural Network. Int. J. Mol. Sci. 2003, 4, 249-262. https://0-doi-org.brum.beds.ac.uk/10.3390/i4050249
Elhallaoui M, Elasri M, Ouazzani F, Mechaqrane A, Lakhlifi T. Quantitative Structure-Activity Relationships of Noncompetitive Antagonists of the NMDA Receptor: A Study of a Series of MK801 Derivative Molecules Using Statistical Methods and Neural Network. International Journal of Molecular Sciences. 2003; 4(5):249-262. https://0-doi-org.brum.beds.ac.uk/10.3390/i4050249
Chicago/Turabian StyleElhallaoui, M., M. Elasri, F. Ouazzani, A. Mechaqrane, and T. Lakhlifi. 2003. "Quantitative Structure-Activity Relationships of Noncompetitive Antagonists of the NMDA Receptor: A Study of a Series of MK801 Derivative Molecules Using Statistical Methods and Neural Network" International Journal of Molecular Sciences 4, no. 5: 249-262. https://0-doi-org.brum.beds.ac.uk/10.3390/i4050249