Introduction
Transfer of a proton from one atom to another may be considered as one of the most general and important reactions in chemistry [
1]. Unlike electron transfer reactions which involve exchange of charges between the reactants, the transfer of a proton also results in transport of mass and in that sense may be considered as a simplest realistic model for all chemical transformations. The pioneering works of Weber [
2], Förster [
3,
4] and Weller [
5,
6] have provoked the photochemists to study this phenomenon in excited electronic states. Although proton transfer reactions could be fast enough to compete relatively fast non-radiative transitions from higher excited states (S
2, S
3 etc.), only comparatively long-lived first excited singlet and triplet states have received attention so far. Again in the first excited electronic state, proton transfer normally takes place from equilibrated lowest vibronic level, although wavelength dependence in some cases suggests that higher vibronic states are involved [
7,
8,
9]. Since proton transfer reaction is associated with a charge separation along with a mass transfer, the process gets modified remarkably in the excited state compared with that in the ground state because of the charge redistribution upon photoexcitation. There are a number of excellent reviews covering different aspects of the excited state proton transfer (ESPT) process [
10,
11,
12,
13,
14,
15,
16].
Microheterogeneous environments are capable of providing micropockets of desired polarity and viscosity. Quite often they provide microenvironments very similar to the biological environments – thus allowing trial experiments prior to in-vivo study. These environments are provided by aqueous micelles, aqueous cyclodextrins (CD) etc.
Micellar systems, because of their diverse application, principally, because of their likeliness to biological systems, have drawn the attention of the photoscientists [
17,
18]. In aqueous micelles the organic fluorophores prefer to reside within the apolar micellar phase in most of the cases. The photophysical/photochemical reactions, thus, experience a dramatic modification due to the encapsulation of the probe. Study of the proton transfer reaction in micellar environment was stimulated by a seminal paper of Duynstee and Grunwald, where they showed that anionic surfactants inhibit while cationic ones enhance the rate of alkaline fading of some triphenylmethane dyes and sulfophthalein indicators [
19]. That the micellar solutions affect the proton transfer process was conclusively established independently by Farnandez and Fromherz [
20] and Harris and Selinger [
21]. Afterwards, a number of works have come out in the field mostly devoted to the study of the influence of the micellar environment on the ESPT reaction and some proposing ESPT as a probe to study the micellar environment [
22,
23,
24,
25].
Cyclodextrins are linked glucopyranose rings forming a doughnut shaped structure [
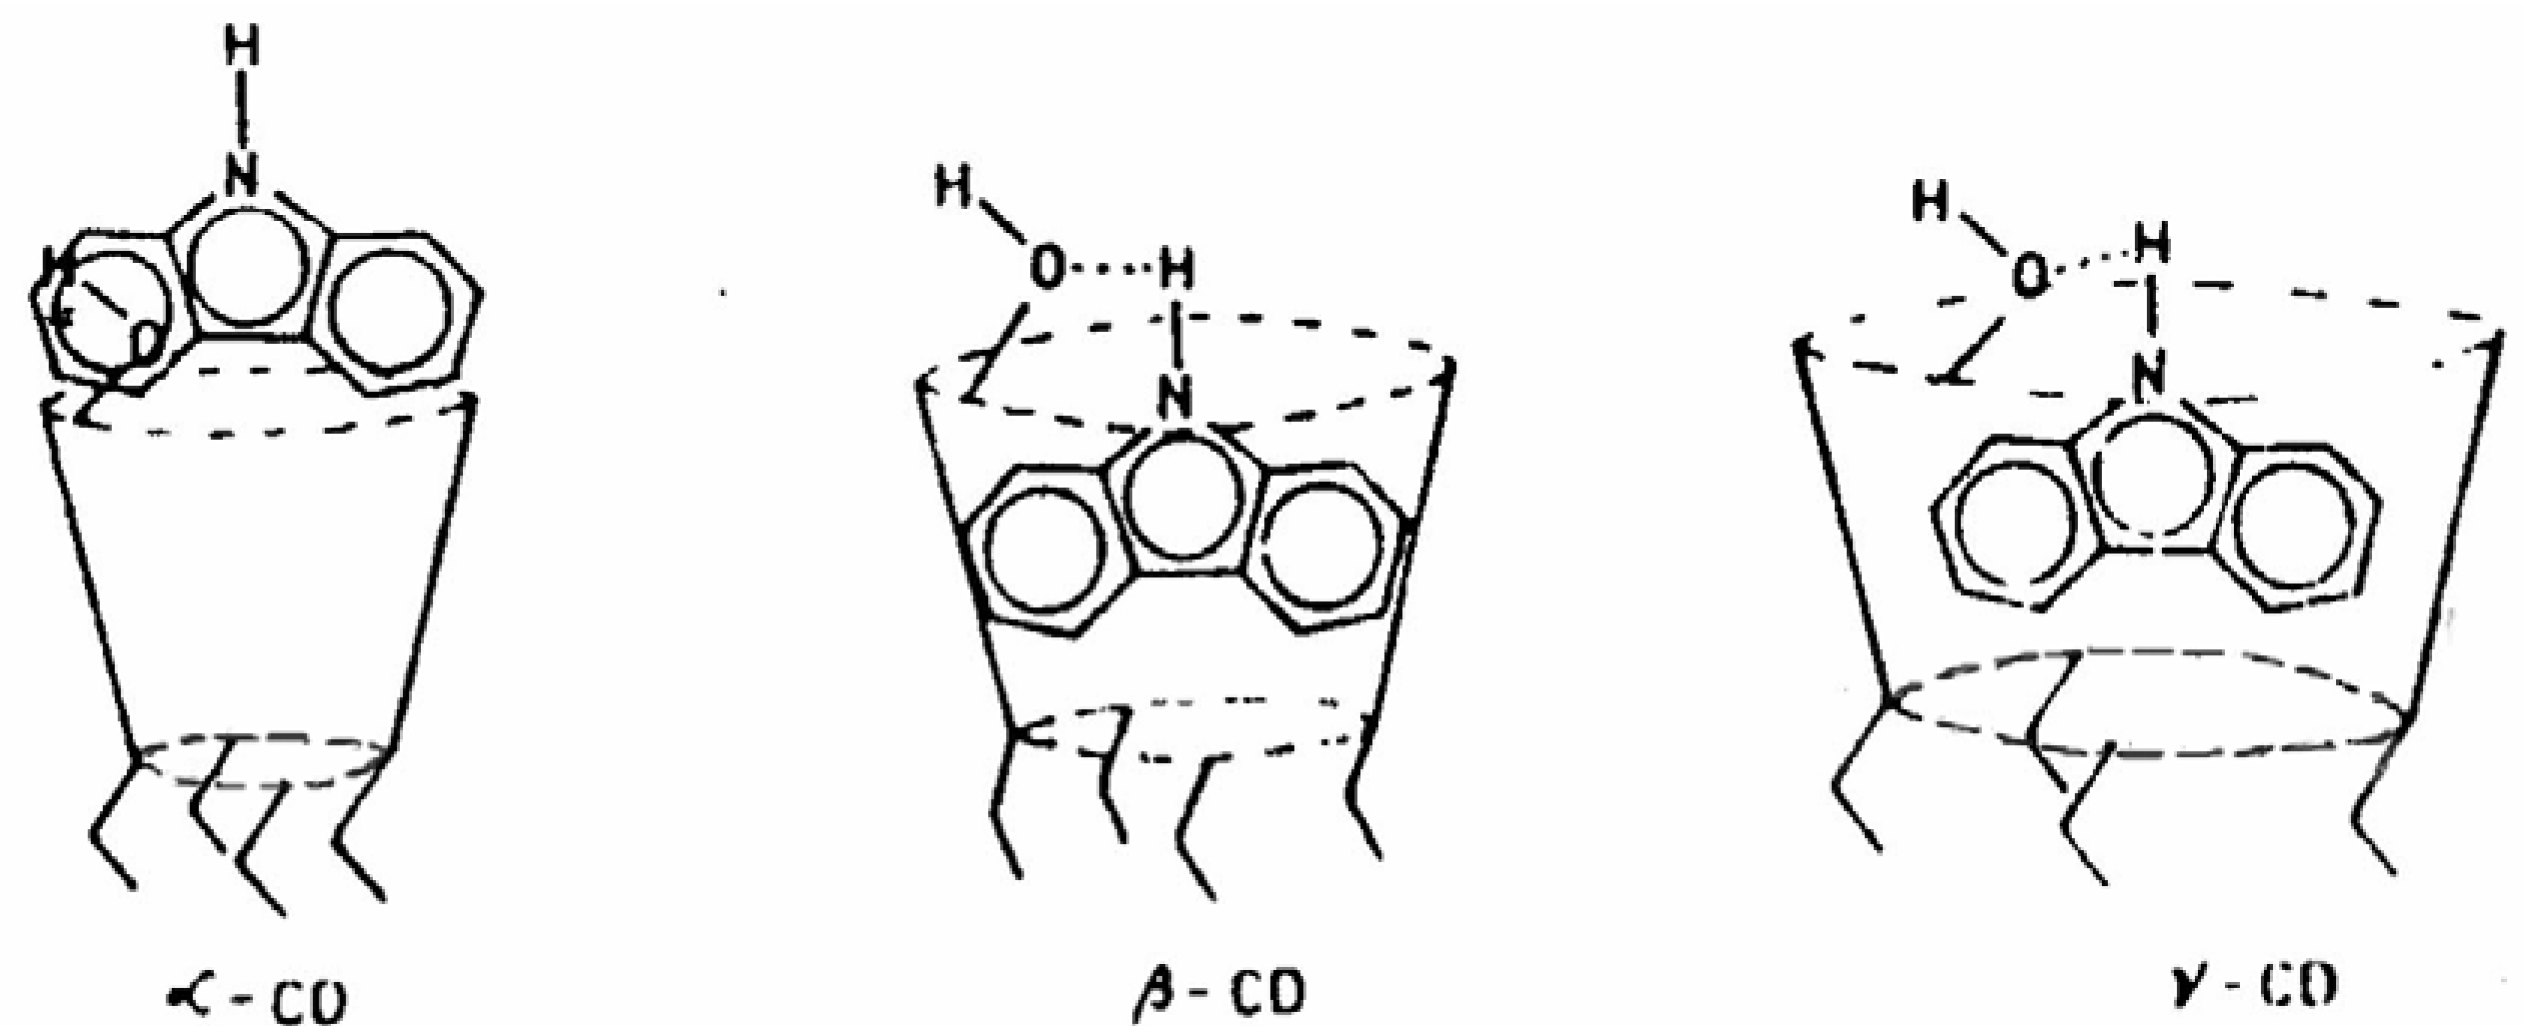
26]. The number of glucose units and, consequently, the cavity diameter increases on going from α-CD to γ-CD through β-CD [
27]. CDs with different cavity diameters have been used advantageously to sequester guests on the basis of size. This property has been exploited to use CDs in drug delivery technique. They are, thus, interesting microvessels for appropriately sized molecules and the resulting supramolecules serve as excellent miniature models of enzyme-substrate complexes. The reduced polarity and the restricted space provided by the CD cavity markedly influence a number of photophysical and photochemical processes [
28,
29]. Shizuka et al. have demonstrated that prototropic reactions are affected by inclusion of the substrate molecules in CD cavities [
30,
31]. Their fluorescence studies have revealed that β-naphthol forms 1:1 inclusion complexes with α-, β- and γ-CDs with different association constants. The mode of inclusion is different in different CDs – modifying the prototropic reaction differently.
During an intermolecular proton transfer reaction protonated and deprotonated forms of the probe are the important reaction partners. When one of these two is non-fluorescent (quite common situation), the ESPT process is monitored by the gradual change of the single fluorescence with the addition of the external base or acid. However, when both the prototropic species are fluorescent the situation becomes very friendly. One can look at the relative change in the two emissions to get the detail of the process. Because both the fluorescences result under the identical experimental condition, their relative measure can overcome many of the instrumental as well as experimental artifacts. Carbazole (CAZL) is a nice fluorophore that undergoes ESPT reaction producing well separated dual luminescence. The compound is stable enough at ambient temperature to perform the experiments in a convenient way. The present article discusses the ESPT reaction of CAZL and explores some of its applications in various directions. The use of the dual luminescence arising out of the photoreaction has been utilized to determine excited state acidity constant (pK*) in a convenient way with a rearrangement of Weller’s equation. Its explicit use in probing different aspects of microheterogeneous liquid environments has also been discussed.
ESPT of Carbazole
Steady state study
Excited state proton transfer of CAZL resulting in dual fluorescence was first studied by Capomacchia and Schulman about three decades ago [
32]. Upon photoexcitation (n-π* transition) a charge migration takes place from the nitrogen centre to the π* orbital distributed over the benzene rings. This leads to a remarkable enhancement in the acidity of the molecular system in its lowest excited singlet (S
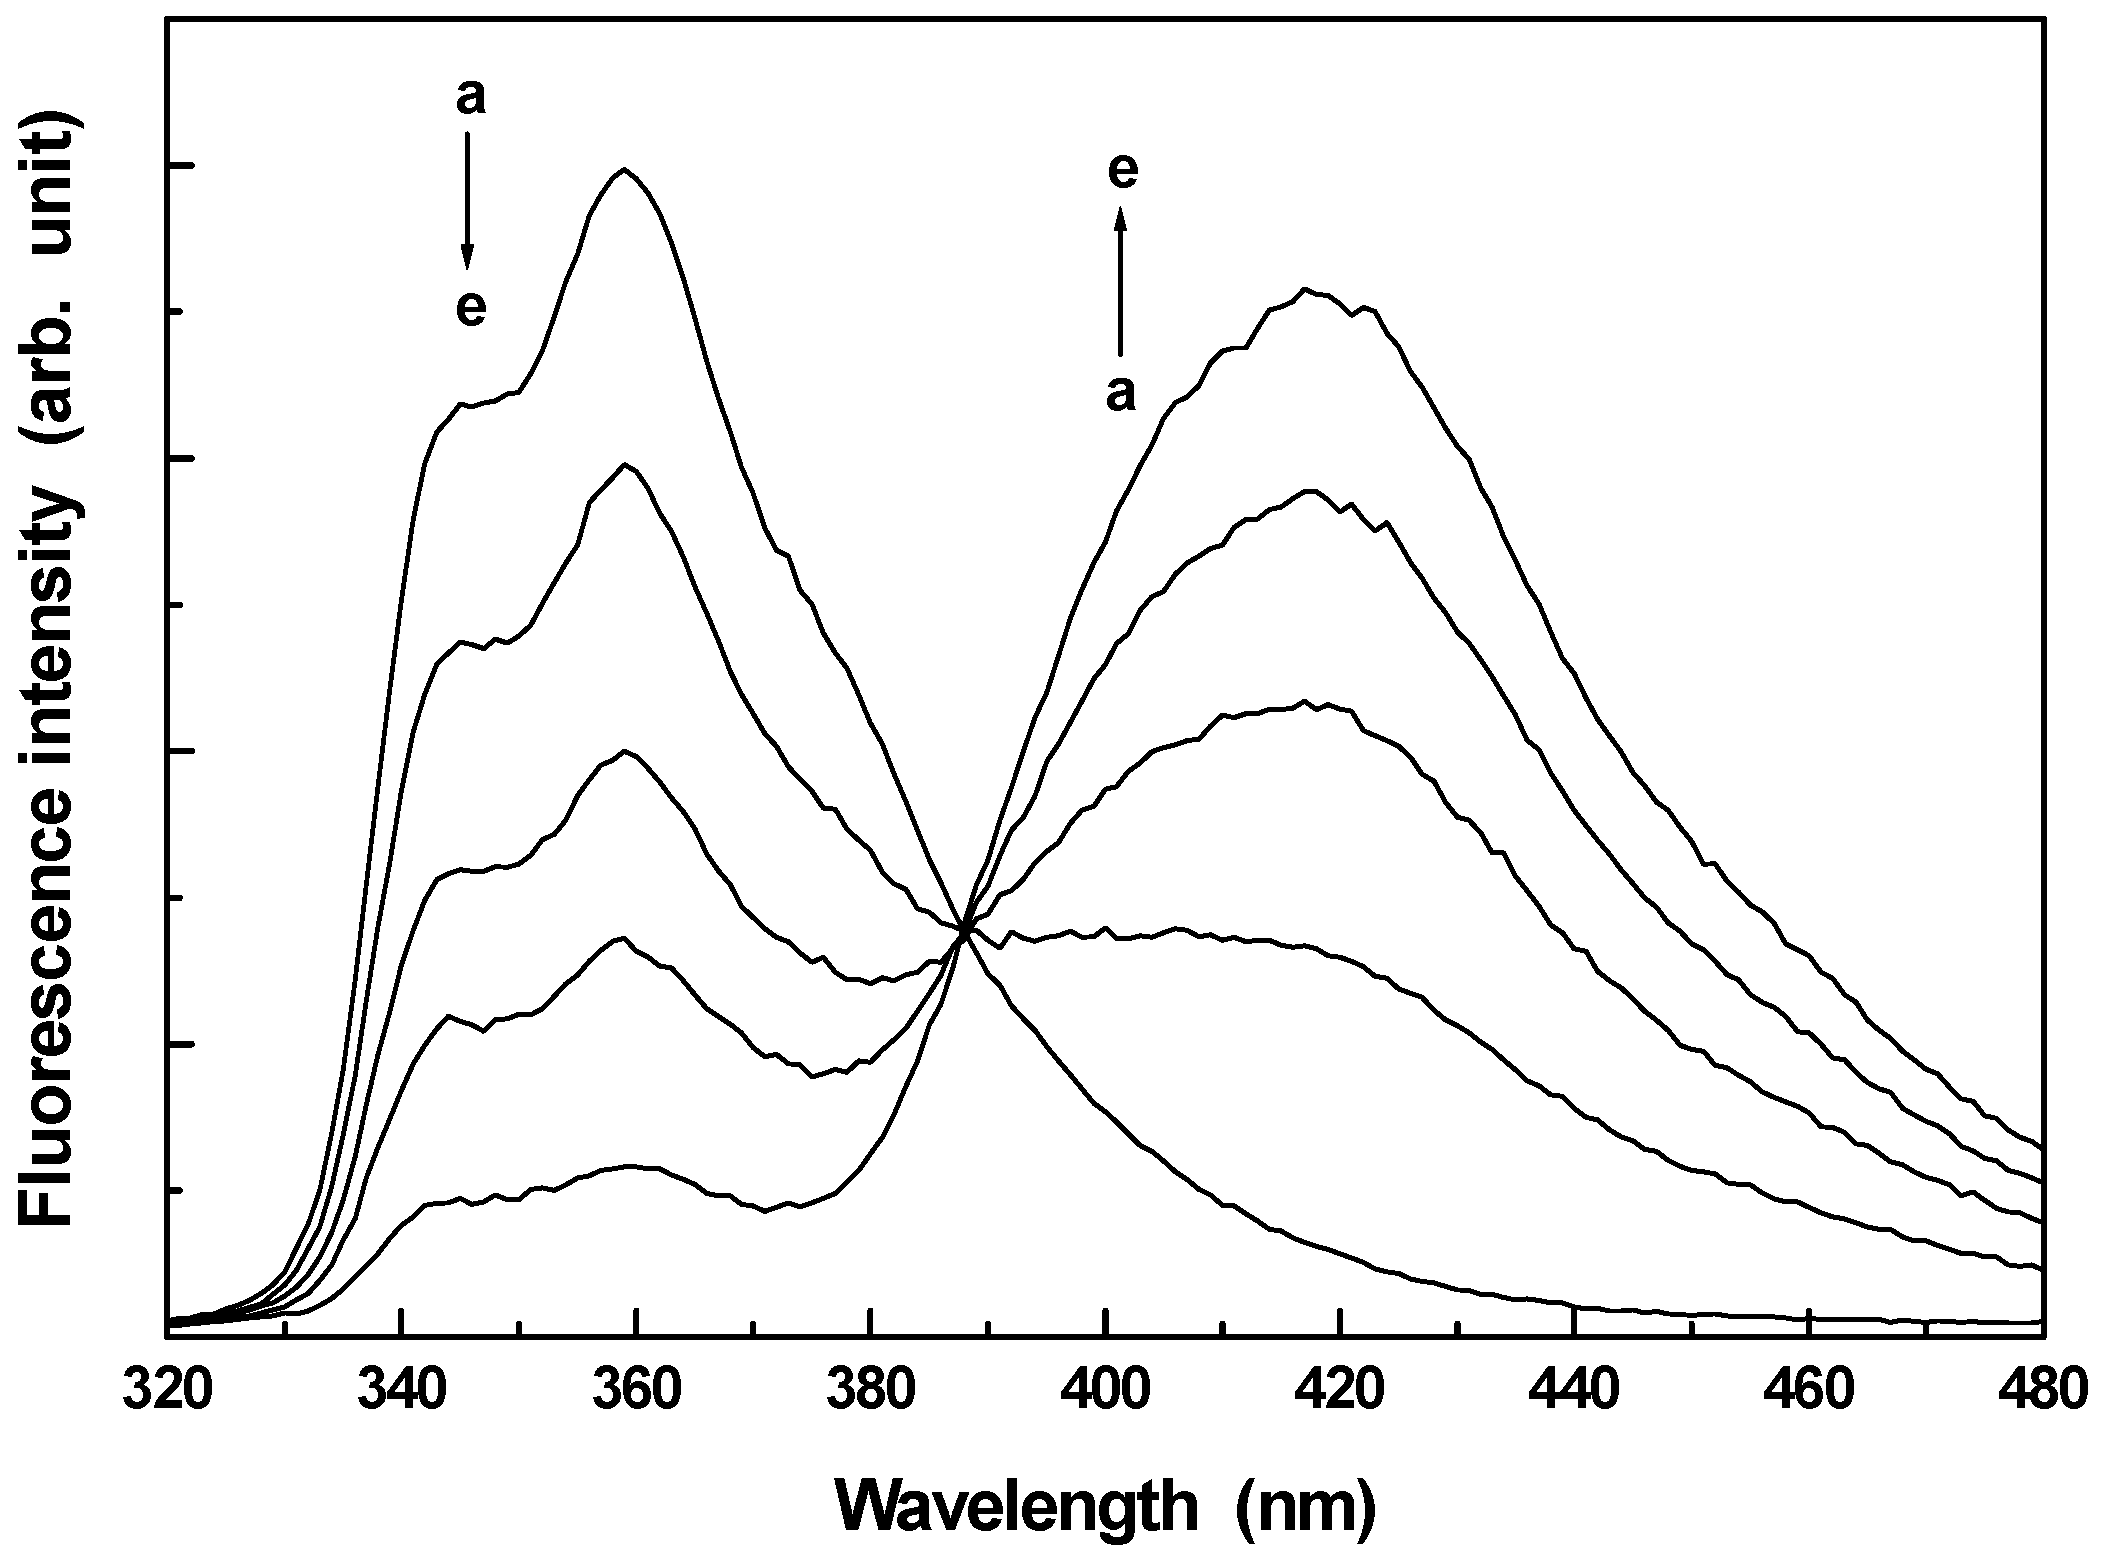
1) state. In pure aqueous solution CAZL gives a structured fluorescence with a maximum at around 360 nm. This is assigned to the fluorescence from the neutral molecular species. With the gradual addition of external alkali (NaOH) the 360 nm fluorescence decreases with a concomitant increase in a new red shifted broad and structureless emission assigned to the anionic species formed through intermolecular proton transfer with the added alkali in the S
1 state [
32]. The absorption spectrum, however, remains unchanged with the addition of alkali suggesting that the prototropic reaction involved here is not a ground state process but it takes place only in the photoexcited state.
Fig. 1 presents the variation of fluorescence of CAZL with added alkali. From the fluorescence titration Capomacchia and Schulman determined the pK* to be 11.9 following Weller’s technique.
In the steady-state fluorometric method Weller’s technique is generally used for the determination of pK* of the prototropic probe [
5,
6]. Weller’s technique is based on the fluorometric titration of a chromophore by a prototropic quencher, leading to a plot of I/I
0 (where I and I
0 are the luminescence intensities of the chromophore in the presence and absence of the quencher) vs. the pH of the solution. The curve takes a sigmoidal shape and the steady state pK* is obtained from the pH value at the inflexion point. For compounds showing dual luminescence during prototropic reactions, pK* is obtained from the pH at the cross-over point of the two curves, each resulting from a particular emitting species (protonated or deprotonated). Although very simple and most widely used, Weller’s method faces some inherent difficulties [
33]. The reliability of the method depends largely on the
Figure 1.
Fluorescence spectra of CAZL in presence of different concentrations of NaOH. a → e corresponds to 0.0, 0.005, 0.01, 0.02 and 0.06M NaOH respectively. The excitation wavelength is 295 nm.
Figure 1.
Fluorescence spectra of CAZL in presence of different concentrations of NaOH. a → e corresponds to 0.0, 0.005, 0.01, 0.02 and 0.06M NaOH respectively. The excitation wavelength is 295 nm.
homogeneity and stability of the instrumental response at each data point. As the graphical plot is non-linear, the number of experimental data points also plays an important role. The more the number of data points (particularly near the inflexion point), the more precise the inflexion point and, consequently, determined pK*. In addition, it is often difficult to obtain accurate I
0 values for the species produced in the photoexcited state by the proton transfer process. High concentration of prototropic quencher may cause additional quenching effects other than prototropic quenching (such as proton induced quenching [
14]). Lastly, the data points seem to be scattered more densely at either the beginning or the tail ends of the curves. This is because, in theses regions, a small error in the numerator or denominator (that has a very low magnitude) leads to a large deviation.
Simultaneous consideration of the dual fluorescence of fluorophores like CAZL makes the method simpler. Here, instead of I/I
0, logarithm of I
─/I (where I and I
─ are the fluorescence intensities of the protonated and deprotonated species respectively at a particular concentration of the prototropic quencher) is plotted against the pH of the solution. A simple mathematical treatment [
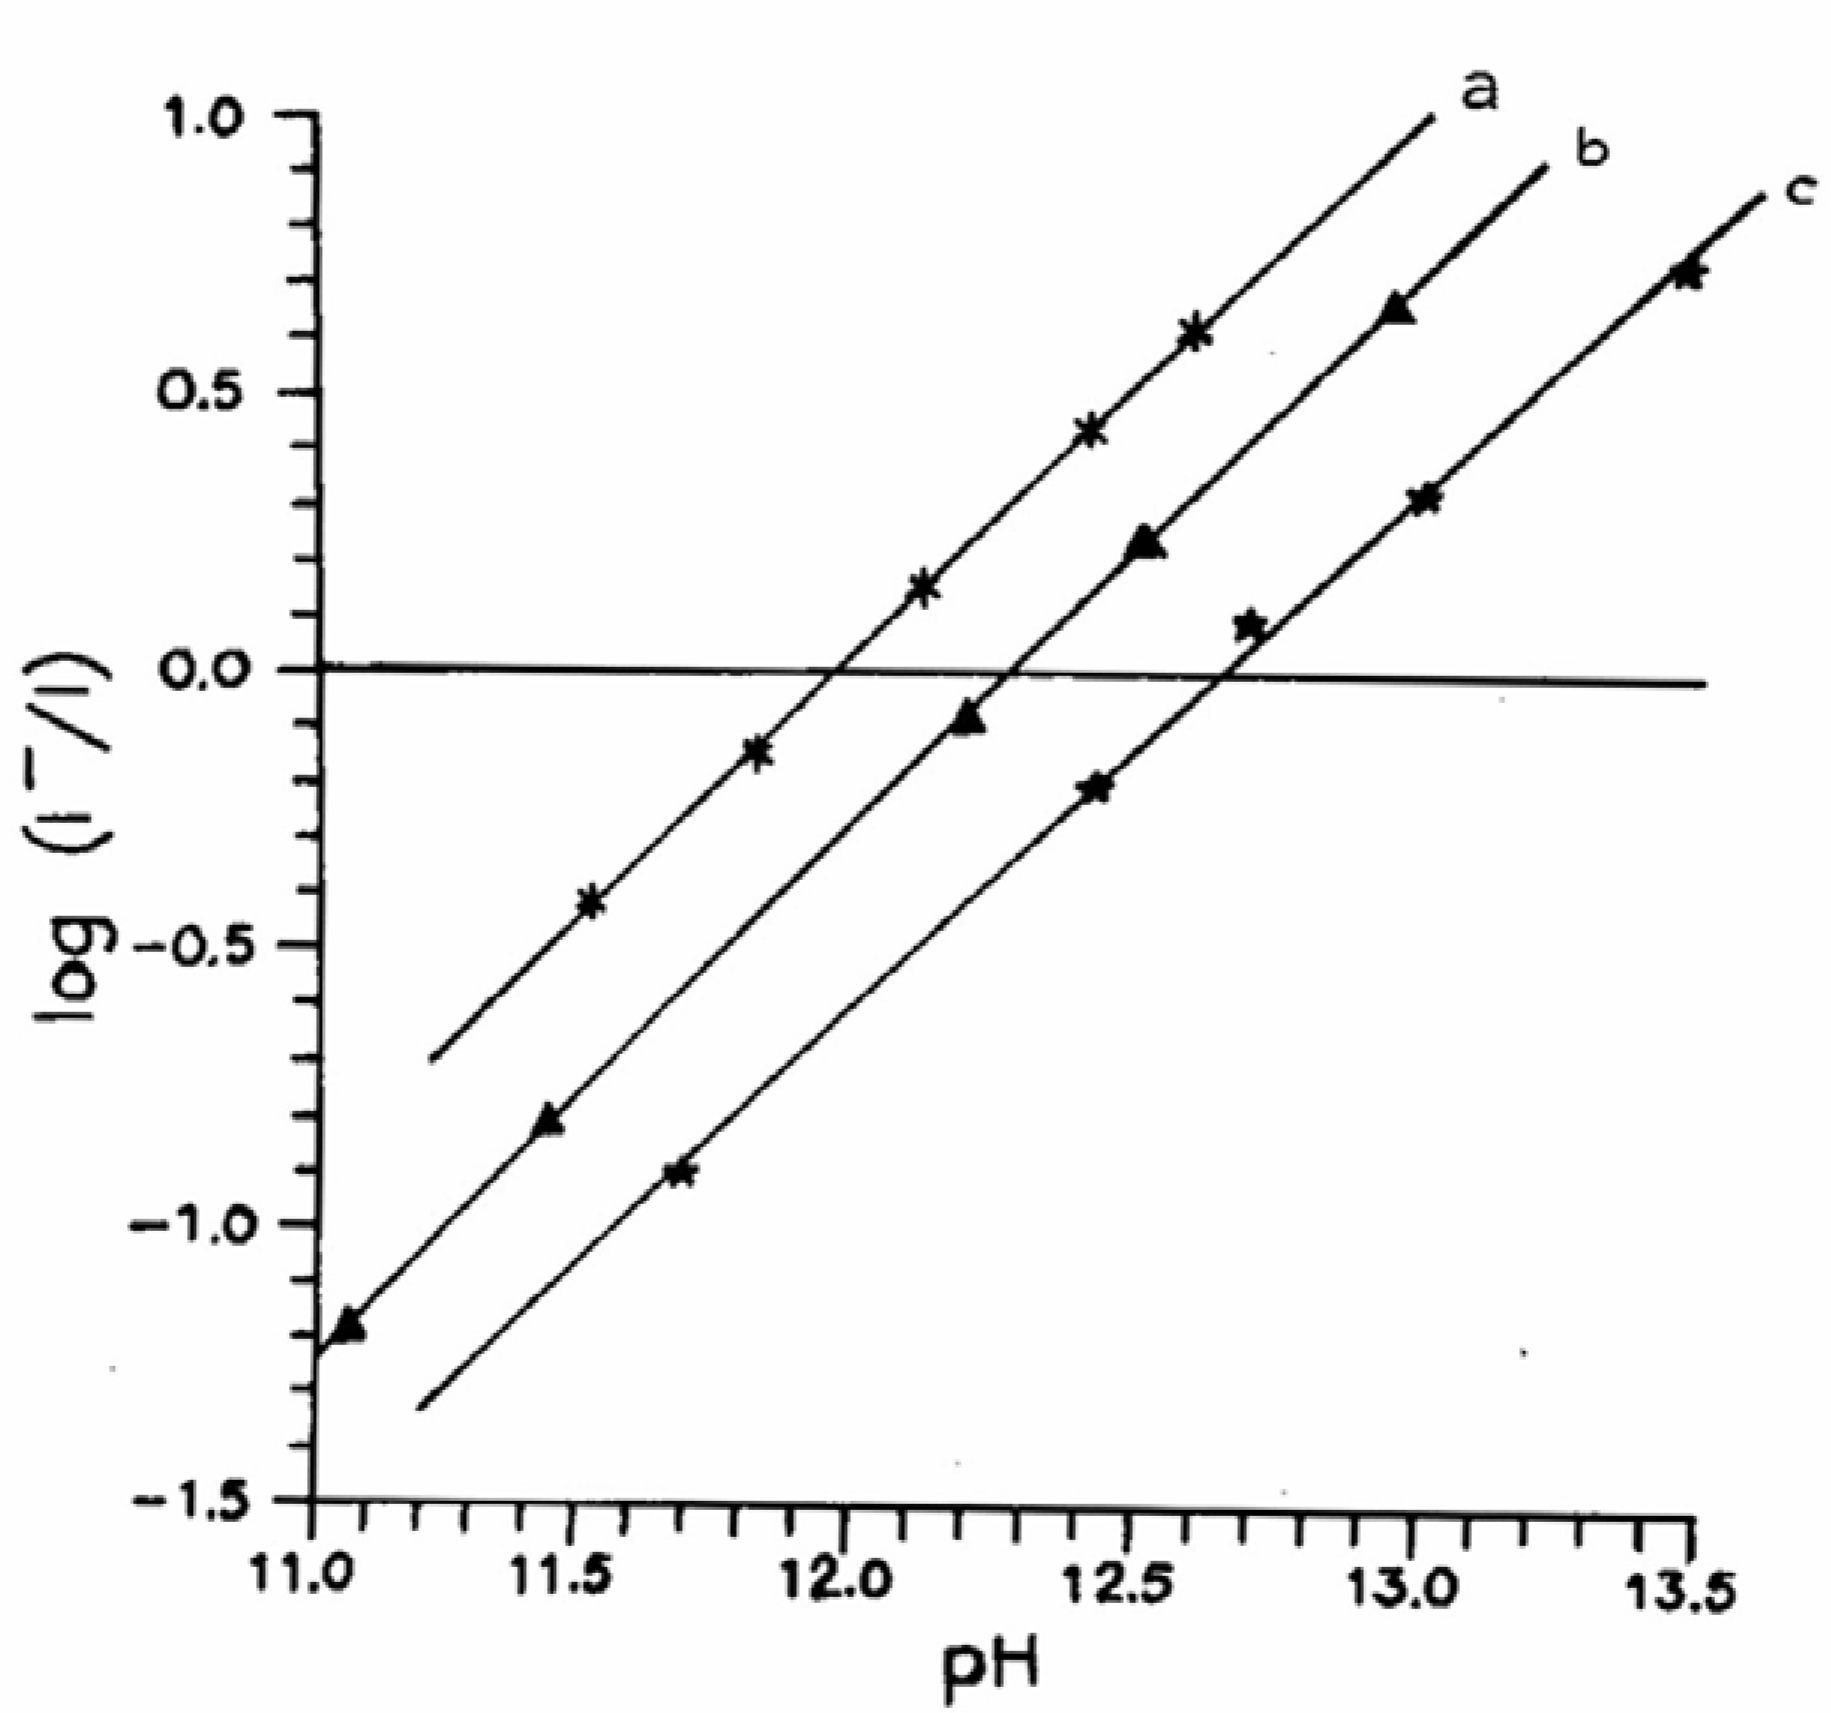
33] reveals that log(I
─/I) will be linear to the solution pH. The intercept of the straight line on the pH axis gives directly a measure of the steady state pK*.
By using the ratio of the intensities of both the prototropic species within an experimental set, the instrumental artifacts are overcome to a large extent. The method does not require the I
0 value for the excited state prototropic product, measurement of which, as stated above, is difficult. Moreover, due to the linear nature of the plot, one can safely avoid the data points at both the beginning and the tail ends. In spite of being simpler, a detail analysis shows that the intercept really gives [pK* + log (φ
─/φ] instead of pK* [
33]. In order to obtain exact pK* value, measurement of the quantum yields of both the forms is required. When the quantum yields of both the prototropic species are similar in magnitude, one gets directly the pK*.
Fig.2 shows a set of plots of log(I
─/I) vs. pH of the solution for three different compounds in presence of NaOH. The method has been extended for CAZL with other bases as well. The determined values of pK* for carbazole (CAZL), indazole (INDZ) and 2-(o-hydroxyphenyl)benzimidazole (2HB) with different prototropic quenchers are listed in
Table 1.
Figure 2.
Plot of log(I─/I) vs. pH of the solution: (a) CAZL – NaOH; (b) INDZ –NaOH; (c) 2HB – NaOH.
Figure 2.
Plot of log(I─/I) vs. pH of the solution: (a) CAZL – NaOH; (b) INDZ –NaOH; (c) 2HB – NaOH.
Table 1.
Steady state pK* values determined in aqueous medium.
Table 1.
Steady state pK* values determined in aqueous medium.
| | | pK* value |
| Compound | Base | Present method | Weller’s method |
| CAZL | NaOH | 11.92 | 11.9 |
| INDZ | NaOH | 12.21 | 12.2 |
| 2HB | NaOH | 12.62 | 12.6 |
| CAZL | NH4OH | 11.45 | 11.24 |
| | Ethylamine | 11.86 | 11.44 |
| | Diethylamine | 11.87 | 11.47 |
| | Triethylamine | 11.91 | 11.64 |
Time-resolved study
Widely separated emissions allow us to determine the excited state lifetimes of the individual species [
34] and hence to know the kinetic detail of the ESPT process.
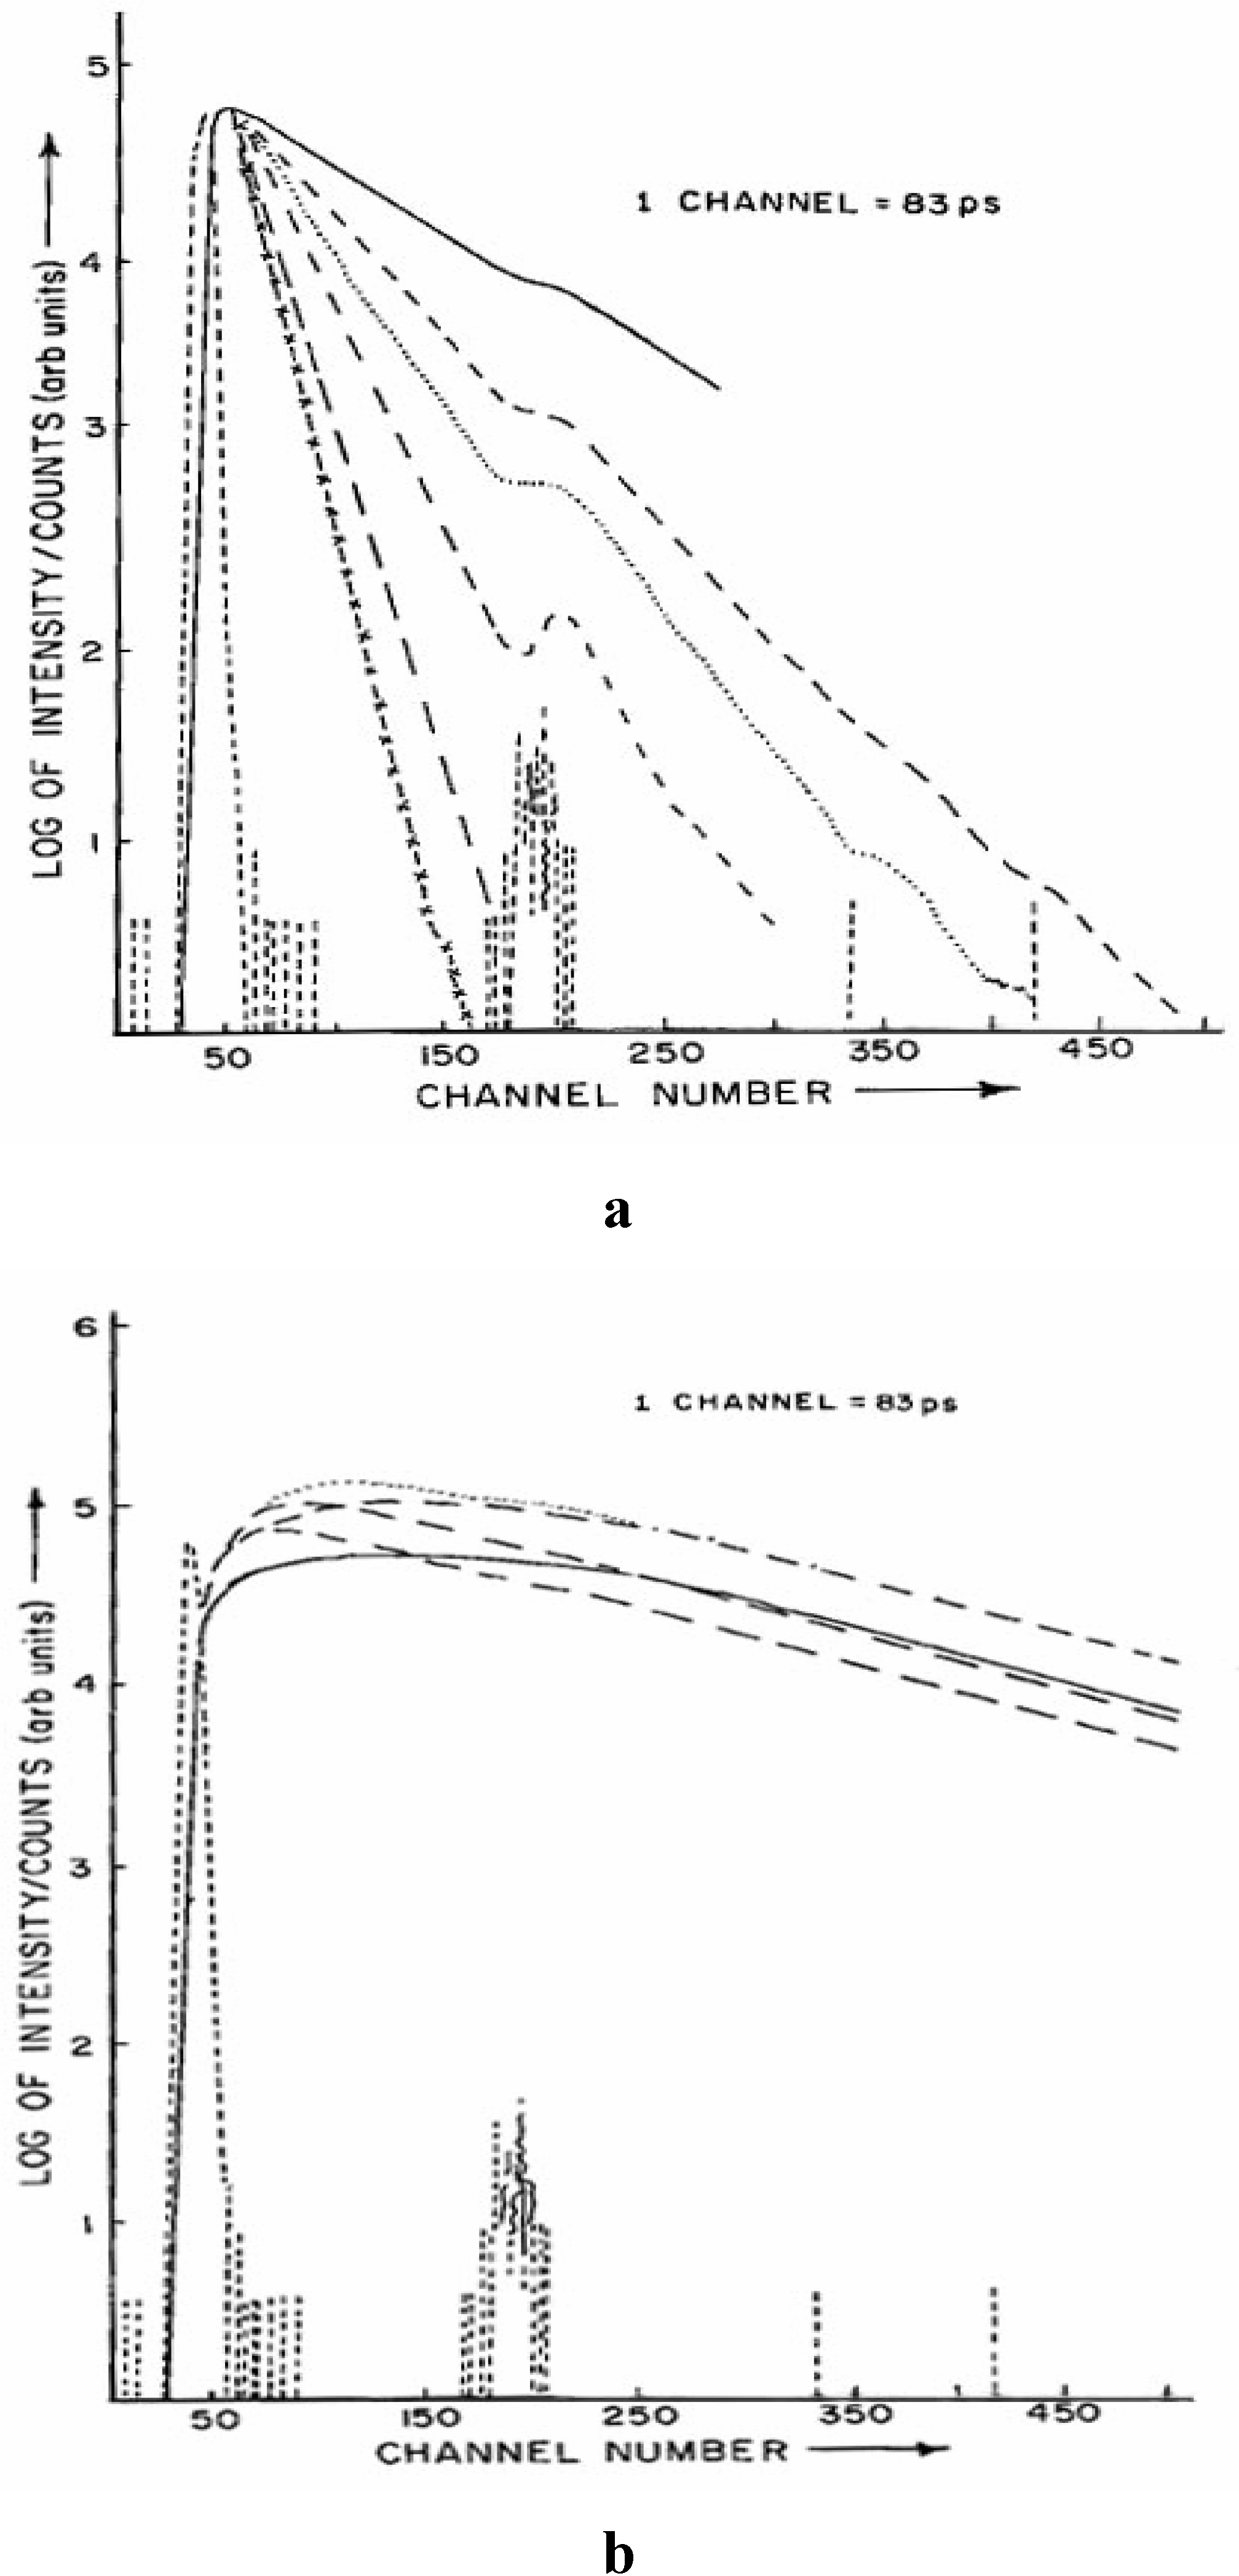
Fig. 3 shows the decay profiles of the neutral (monitored at 360 nm) and anionic species (monitored at 415 nm) of CAZL in presence of different concentrations of NaOH. The decay at 360 nm is found to be single exponential and
Figure 3.
Fluorescence decay curves of the a) neutral CAZL monitored at 360 nm (λexc. = 295 nm) and b) anionic species of CAZL monitored at 415 nm (λexc. = 295 nm). Different concentrations of OH─ from top to bottom in (a) are: 0.0N, 0.005N, 0.01N, 0.02N, 0.04N and 0.06N respectively (…….. is the pump profile). Different signs of the various decay curves in (b) correspond the same signs in the decay curves in (a) with the given concentrations.
dependent on the pH of the solution. With an increase in the solution pH the decay becomes faster. The 415 nm emission is clearly bi-exponential showing a build-up followed by a decay. The growth time is shortened as the pH of the solution increases, however the decay time remains unchanged.
Table 2 summarizes the lifetimes of the prototropic species at different solution pH.
Table 2.
Fluorescence decay parameters of CAZL at different pH.
Table 2.
Fluorescence decay parameters of CAZL at different pH.
| Alkali conc. (M) | pH | τ1 (ns) (360 nm emission) | τ2 (ns) (420 nm emission) | Mean τ2 (ns) |
| 0.00 | 7.0 | 9.97 | — | |
| 0.005 | 11.7 | 5.7 | 19.8 | |
| 0.01 | 12.0 | 4.6 | 20.6 | |
| 0.02 | 12.3 | 3.1 | 20.2 | 20.7 |
| 0.04 | 12.6 | 2.0 | 21.7 | |
| 0.06 | 12.8 | 1.5 | 21.5 | |
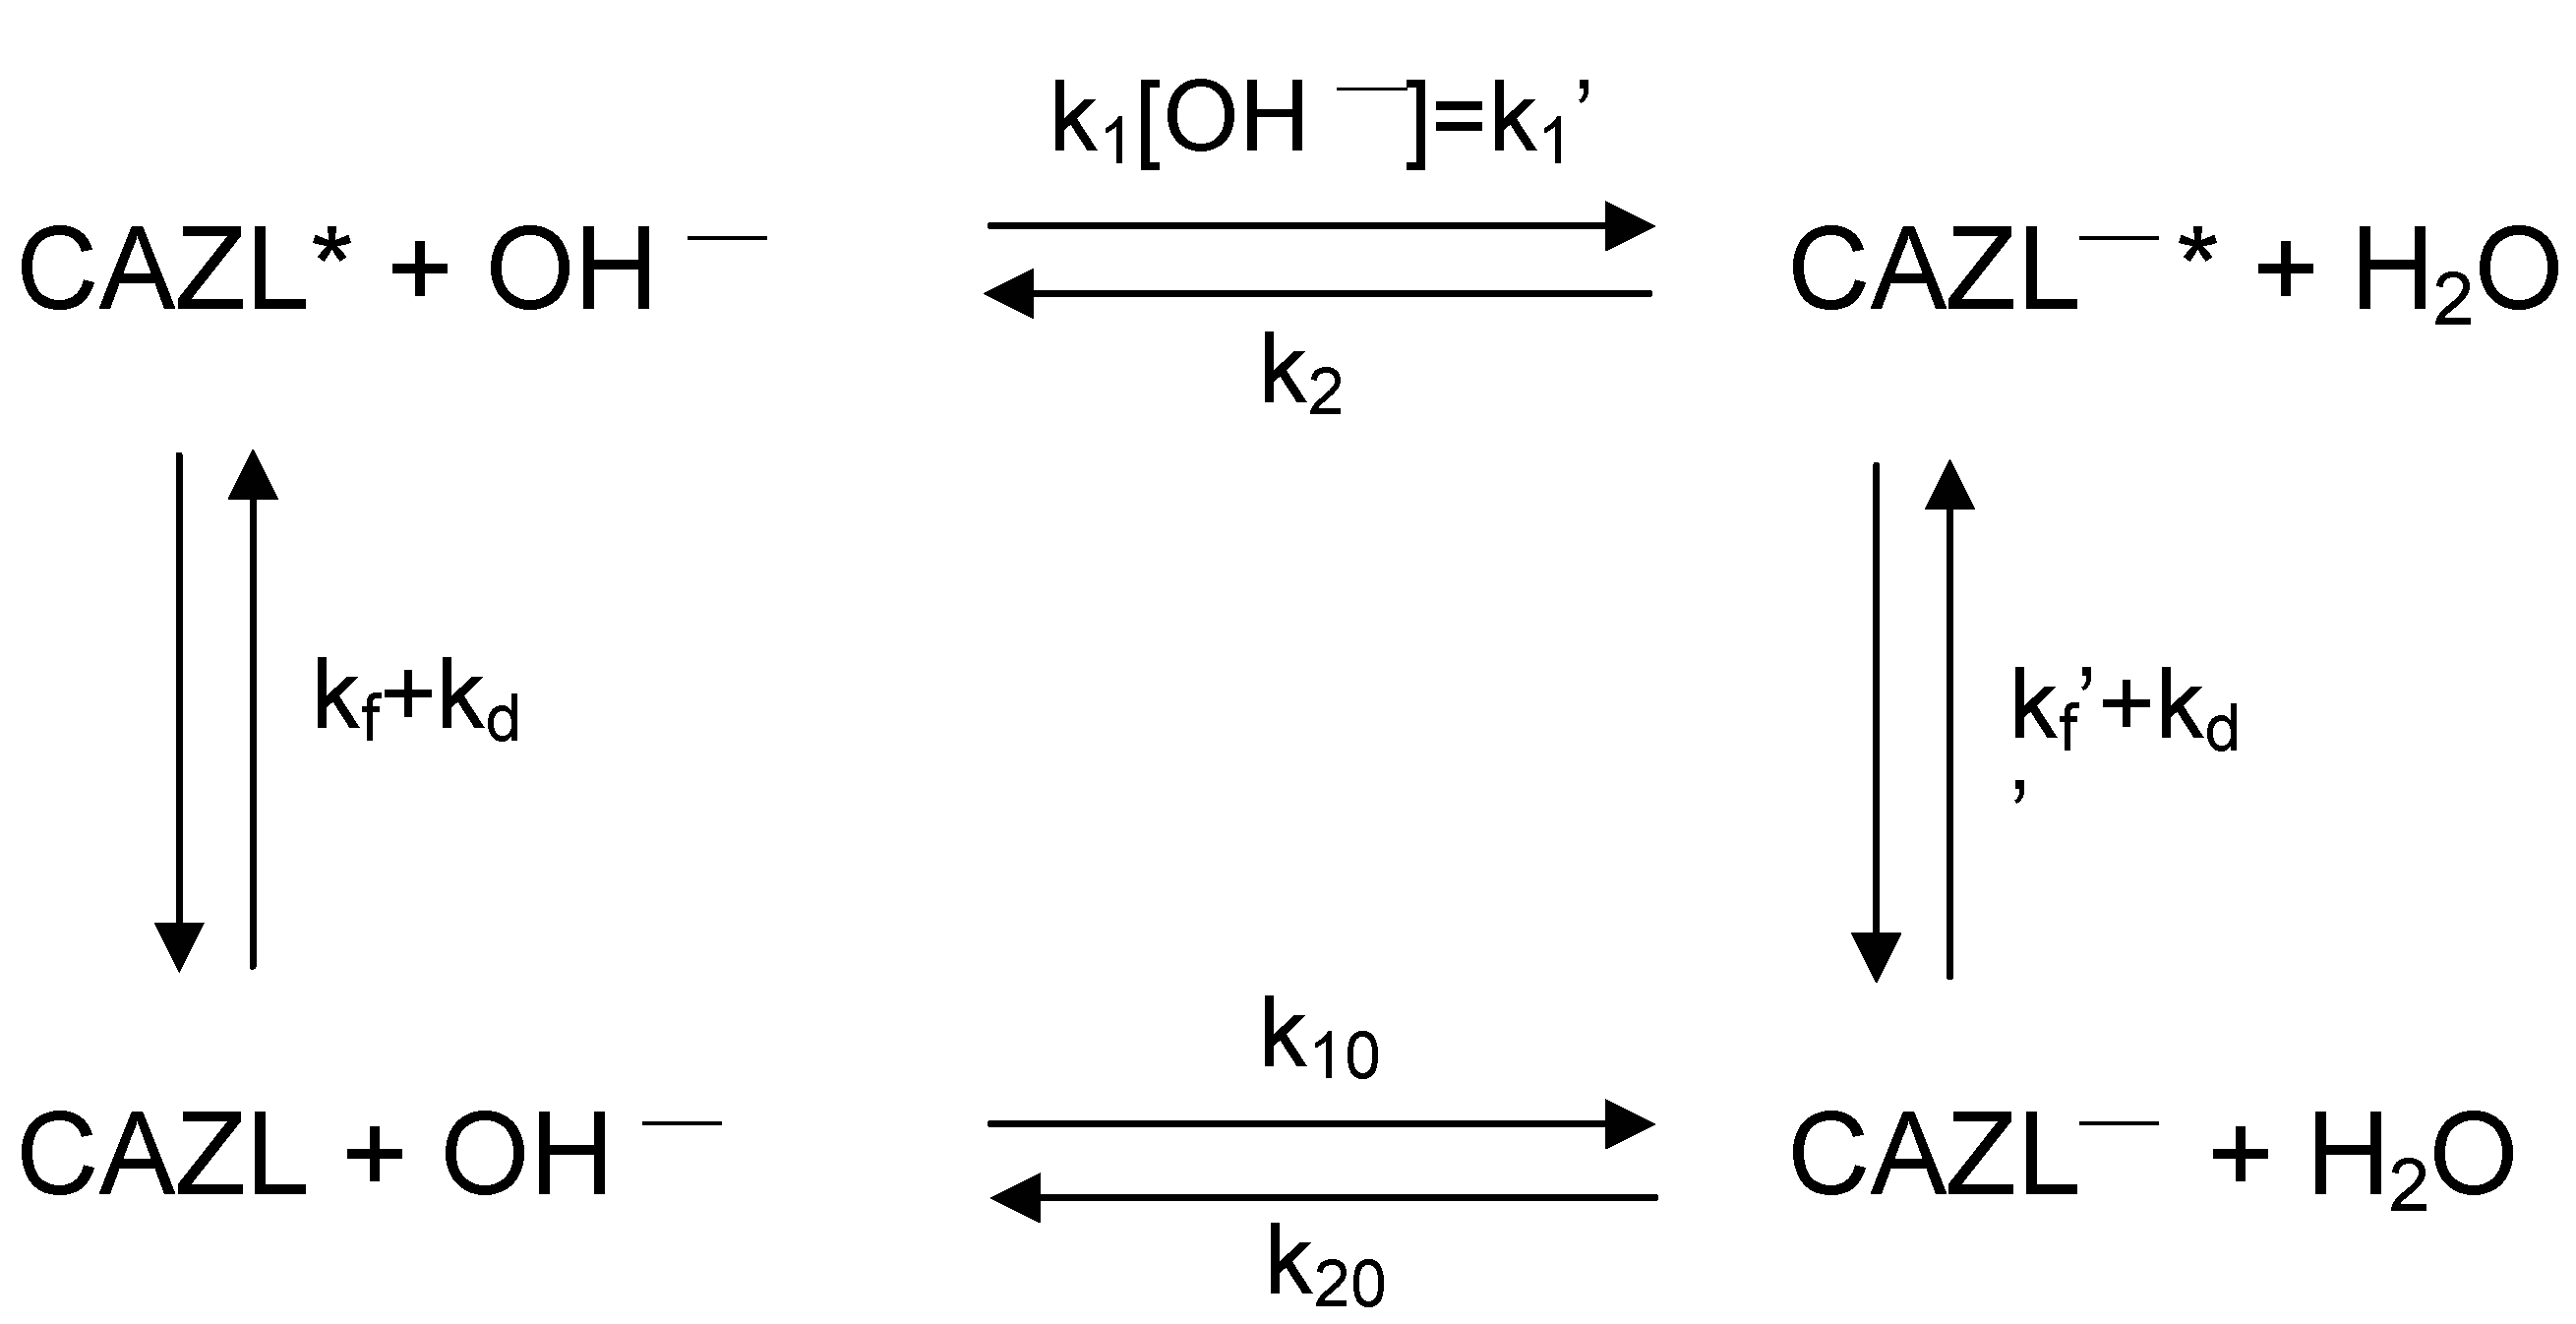
A detailed kinetic analysis as shown by Samanta et al. [
34] considering
Scheme 1 for the prototropic process yielded the rate constants for the individual processes as presented in
Table 3.
Scheme 1.
Proton transfer reaction of CAZL with various rate constants. CAZL and CAZL─ represent carbazole and the corresponding anion; the starred terms are the corresponding species in the S1 state. k1’ and k2 are the pseudo-first-order rate constants for the forward and the backward reaction in the excited state, k10 and k20 are the corresponding rate constants in the ground state, kf and kf´ are the rate constants for fluorescence of carbazole and the anion respectively, kd and kd´ are the respective non-radiative constants.
Table 3.
Rate constants and pK* of CAZL derived from fluorescence decay parameters.
Table 3.
Rate constants and pK* of CAZL derived from fluorescence decay parameters.
| Rate constant | Value |
| kd + kf | 1.0 × 10⁸ s-1 |
| kd´+ kf´ | 4.5 × 10⁷ s-1 |
| k1 | 9.0 × 10⁹ M-1s-1 |
| k2 | 8.5 × 10⁶ s-1 |
The rate constant for the excited state deprotonation process is three orders of magnitude more than the back reprotonation process. This is justified by the single exponential character of the 360 nm emission decay. The backward process is too slow to contribute in the neutral decay through the reprotonation of the anionic species in the excited state. A drastic difference in the k1 and k2 values unequivocally establishes that the prototropic equilibrium is not established within the lifetime of the excited CAZL. This suggests that the pK* value for the ESPT reaction of CAZL measured through steady state method is not reliable.
Steady state titrimetric methods give an estimate of the apparent pK* which may not always correspond to the true equilibrium pK* values [
32,
35]. The apparent pK* will change if the lifetime of the excited state is altered on the addition of the quenchers. This anomaly results from the transitory character of the excited species, which does not always allow equilibrium to be reached. A cursory look at the apparent pK* obtained by the fluorometric titration method shows that, despite large differences in the molecular structure and acid-base properties in the ground state, almost all amines have pK* around 12 for the deprotonation reaction [
11]. One wonders why. A little reflection will, however, show that if the equilibrium pK* is much less than 12, say 8, even the diffusion-controlled deprotonation rate (with a rate constant of about 10
10 M
-1s
-1) at pH 8, 9 or 10 will be much slower than the rate of the decay of the excited species, and the production of the deprotonated form will thus be insignificant. The overall consequence of the transitory character of the species will be that in fluorometric titrations the deprotonated form will not be detected till a pH of 11 or 12 is reached [
36]. From their kinetic measurements Samanta et al. put forward a value of pK* as10.98, one unit lower than the apparent pK* value as reported by Schulman et al. [
32,
34]. Later on it was realized that the reverse reprotonation reaction rate was too much small compared with the ongoing competing other fast processes, to be determined with any accuracy at all, and the estimated pK* gives only an upper limit. Chattopadhyay and Chowdhury looked for an alternative prototropic reaction of CAZL where the reverse reaction was appreciable compared with the forward reaction rate [
36]. Furthermore, they could control both the forward (deprotonation) and the backward (reprotonation) reaction rates by proper addition of external base and its conjugate acid. Thus, they could study the ESPT reaction of CAZL in ammonia both from steady state and dynamical methods yielding the similar values of pK* of CAZL which was as low as 7.6. This result reflects a tremendous enhancement in the acidic property of CAZL in the S
1 state (pK* = 7.6 [
36]) compared to that in the ground state (pK = 21.1 [
32]).
To understand whether the ESPT reaction of CAZL and some other related molecular systems, namely, indole (IND) and diphenylamine (DPA), is activation energy dependent or barrierless process, Chattopadhyay et al. studied the temperature dependence of the excited state prototropic reactions for these systems in protic (aqueous) as well as aprotic (aceonitrile) media using the picosecond time-resolved dynamic technique [
37]. The determined rate constants of the excited state deprotonation processes at different temperatures using various external bases are presented in
Table 4. The
Table 4.
Rate constants for different excited state deprotonation reactions at various temperatures.
Table 4.
Rate constants for different excited state deprotonation reactions at various temperatures.
| | | | Rate constant (109 M-1 s-1) |
| Compound | Base | Medium | 60C | 160C | 260C | 380C | 460C |
| IND | NaOH | H2O | 17.60 | 21.61 | 26.38 | 31.12 | 35.01 |
| DPA | NaOH | H2O | 15.31 | 16.73 | 21.50 | 26.69 | 28.51 |
| CAZL | NaOH | H2O | 5.54 | 6.84 | 9.03 | 11.81 | 14.42 |
| | NH3 | H2O | 0.40 | 0.47 | 0.59 | 0.83 | 0.93 |
| | EtNH2 | H2O | 1.44 | 1.56 | 1.94 | 2.36 | 2.55 |
| | Et2NH | H2O | 1.56 | 1.85 | 2.52 | 2.62 | 3.35 |
| | Et3N | H2O | 1.10 | 1.19 | 1.62 | 2.03 | 2.40 |
| | | CH3CN | 0.74 | 0.77 | 0.80 | 0.84 | 0.86 |
activation barriers for the reaction in different conditions derived therefrom is given in
Table 5. For all the studied molecular systems with different bases the activation energies are determined to be around 4.0 and 1.0 kcal mol
-1 in aqueous and acetonitrile media respectively. The calculated diffusional barriers for these environments are 4.1 and 1.2 kcal mol
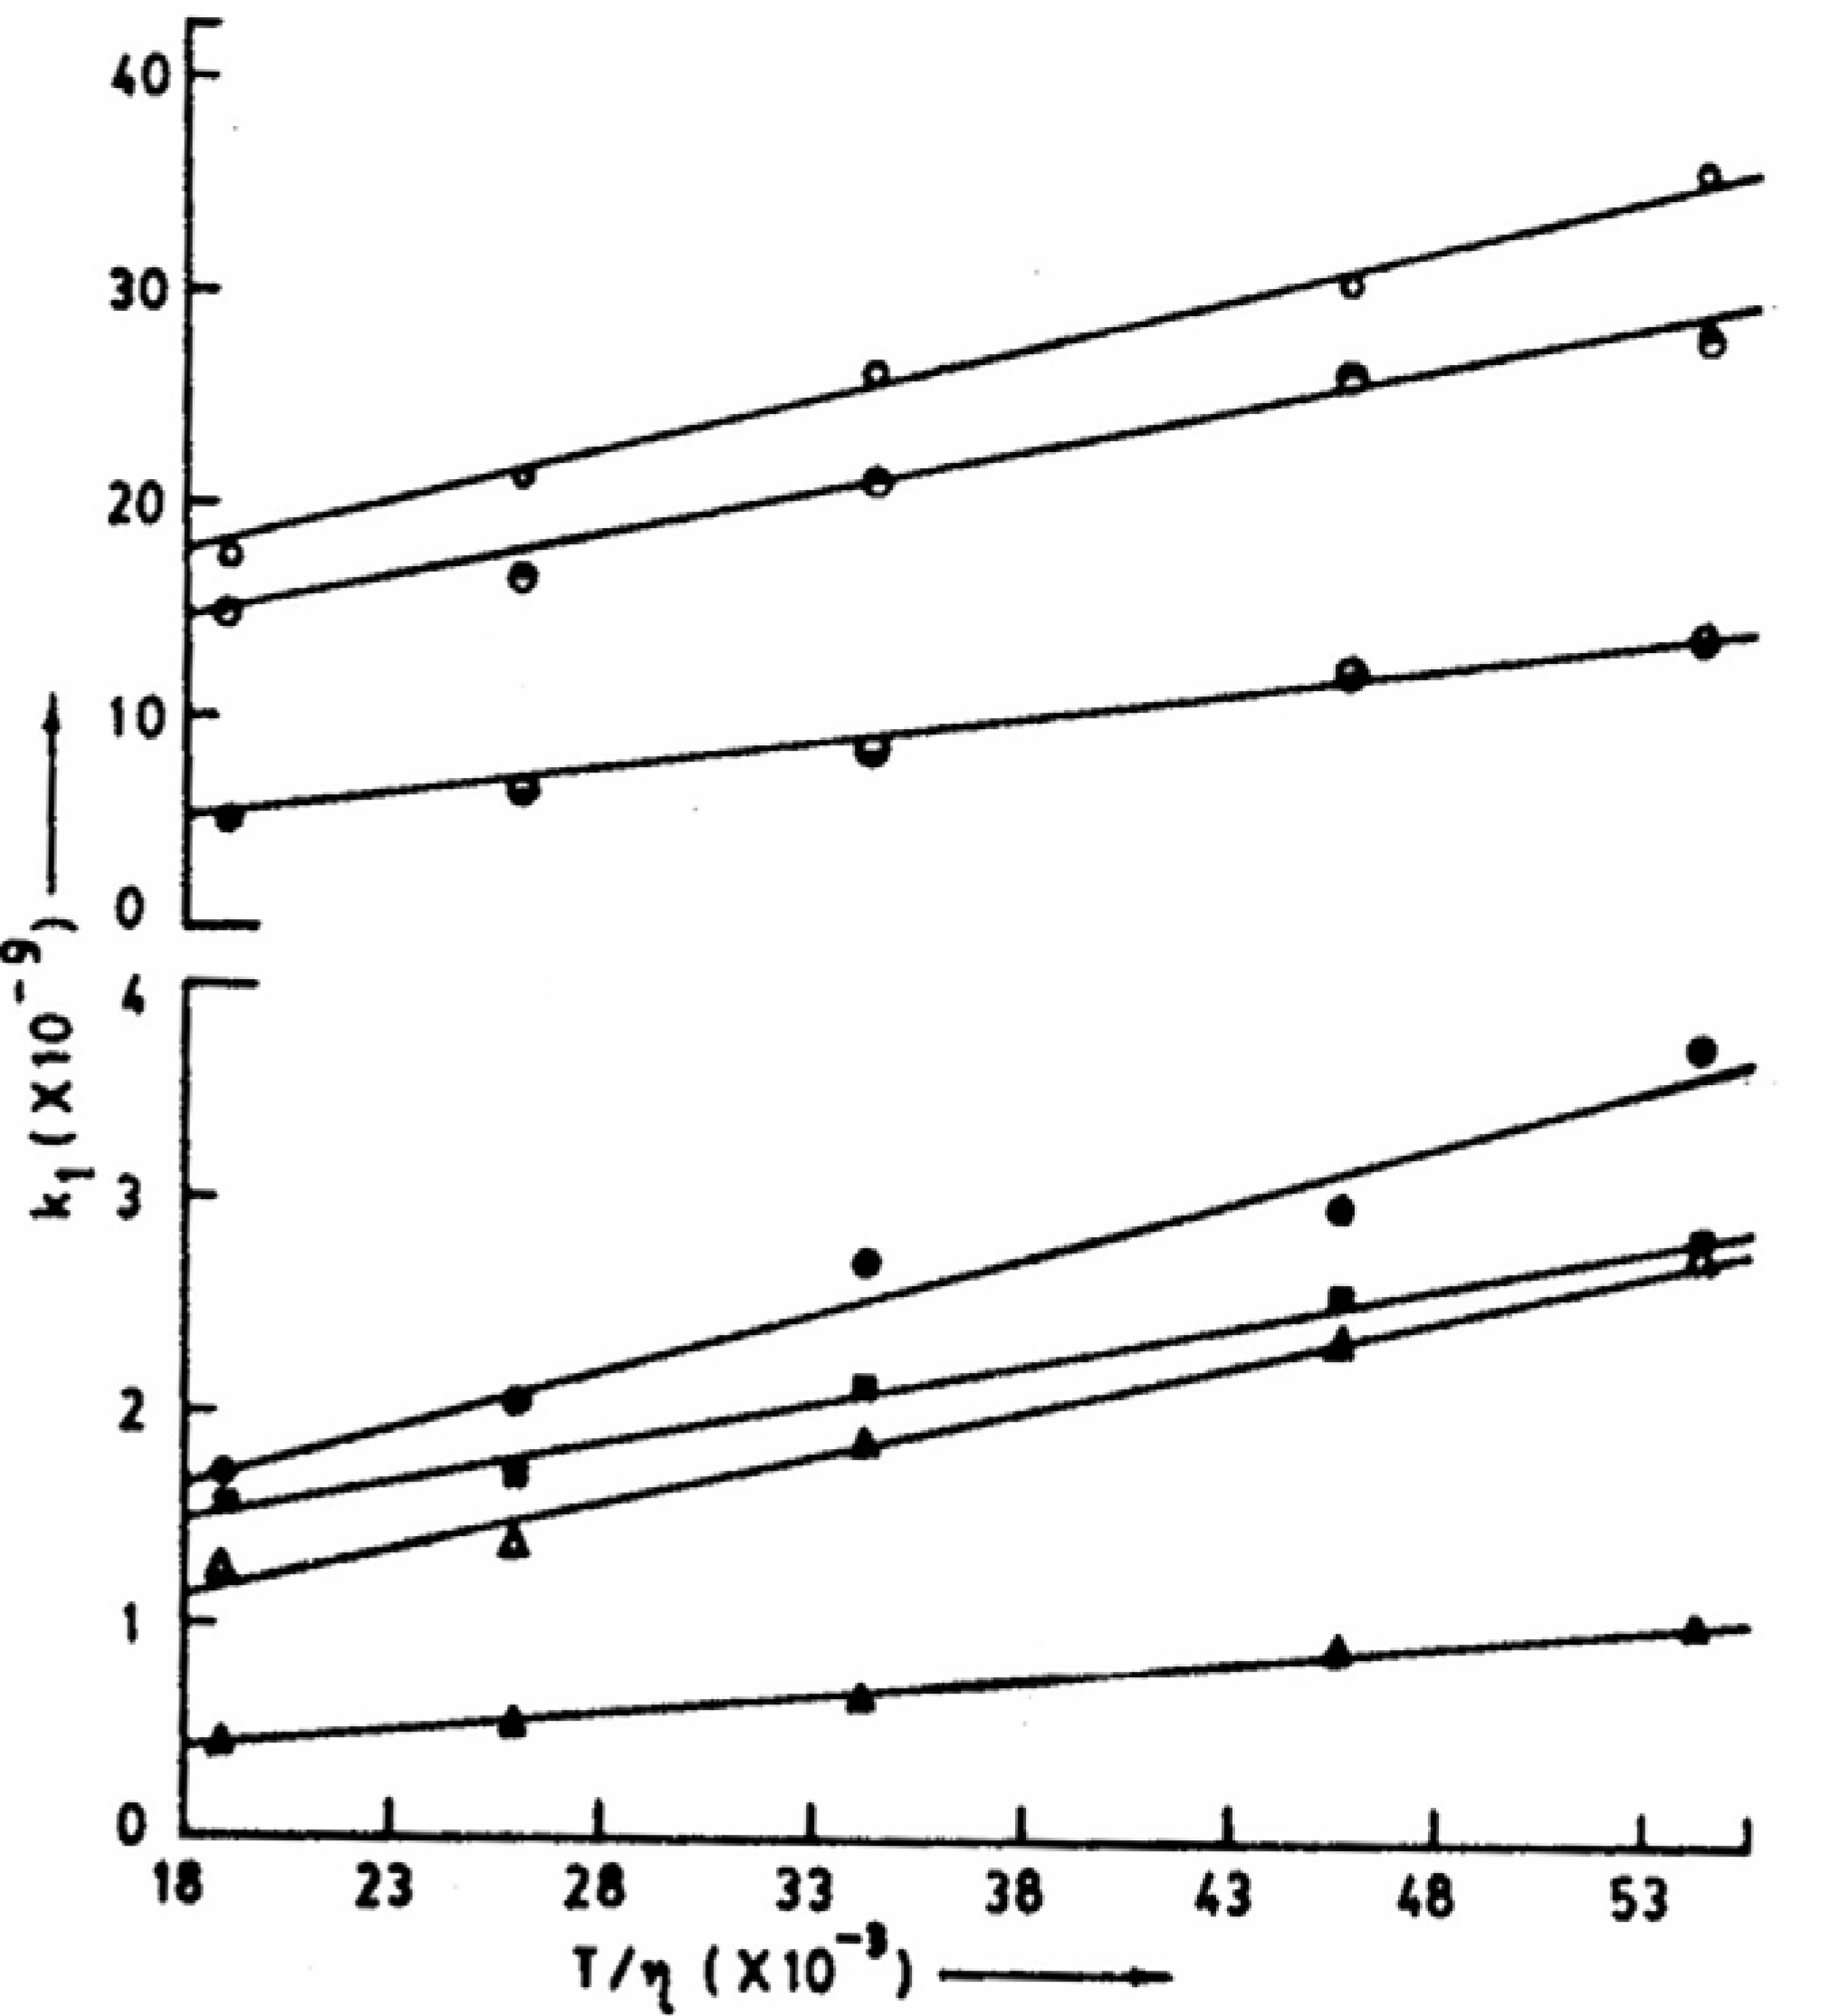
-1. This clearly indicates that the energy barrier for the ESPT process is simply the barrier experienced by the medium to flow suggesting the process to be exclusively diffusion controlled. This was further substantiated from the linearity of the plots of k
1 (rate constant of the deprotonation process) vs. T/η (
fig. 4) for aqueous solutions [
38].
Table 5.
Activation energies for different deprotonation processes.
Table 5.
Activation energies for different deprotonation processes.
| Compound | Base | Activation energy (kcal mol-1) |
| Aqueous medium | Acetonitrile medium |
| IND | NaOH | 3.0 ± 0.2 | |
| DPA | NaOH | 3.1 ± 0.2 | |
| CAZL | NaOH | 4.2 ± 0.2 | |
| | NH3 | 4.0 ± 0.2 | |
| | EtNH2 | 2.9 ± 0.2 | |
| | Et2NH | 3.5 ± 0.2 | |
| | Et3N | 3.8 ± 0.2 | 0.9 ± 0.2 |
| Diffusional barrier | 4.1 | 1.2 |
Figure 4.
Plots of k1 vs. T/η for different experimental sets of ESPT reactions. Top to bottom represents IND-NaOH, DPA-NaOH, CAZL-NaOH, CAZL-Et2NH, CAZL-EtNH2, CAZL-Et3N and CAZL-NH3 (all are in aqueous solutions, η at different temperatures have been taken from CRC Handbook of Chemistry and Physics, 67th Edn., 1986, F-37 and F-38).
Application of ESPT of Carbazole to Look Into the Microheterogeneous Environments
Knowing the characteristics of the ESPT of CAZL well, we are now ready to exploit the reaction to study different microheterogeneous liquid environments like aqueous micelles, cyclodextrins and also effect of addition of external agents on these environments.
Aqueous Micelles
Determination of CMCs
In one of our papers we reported the influence of the micellar environments, like cetyltrimethylammonium bromide (CTAB), triton-X 100 (TX) and sodium dodecyl sulphate (SDS), on the ESPT reac-tion of CAZL [
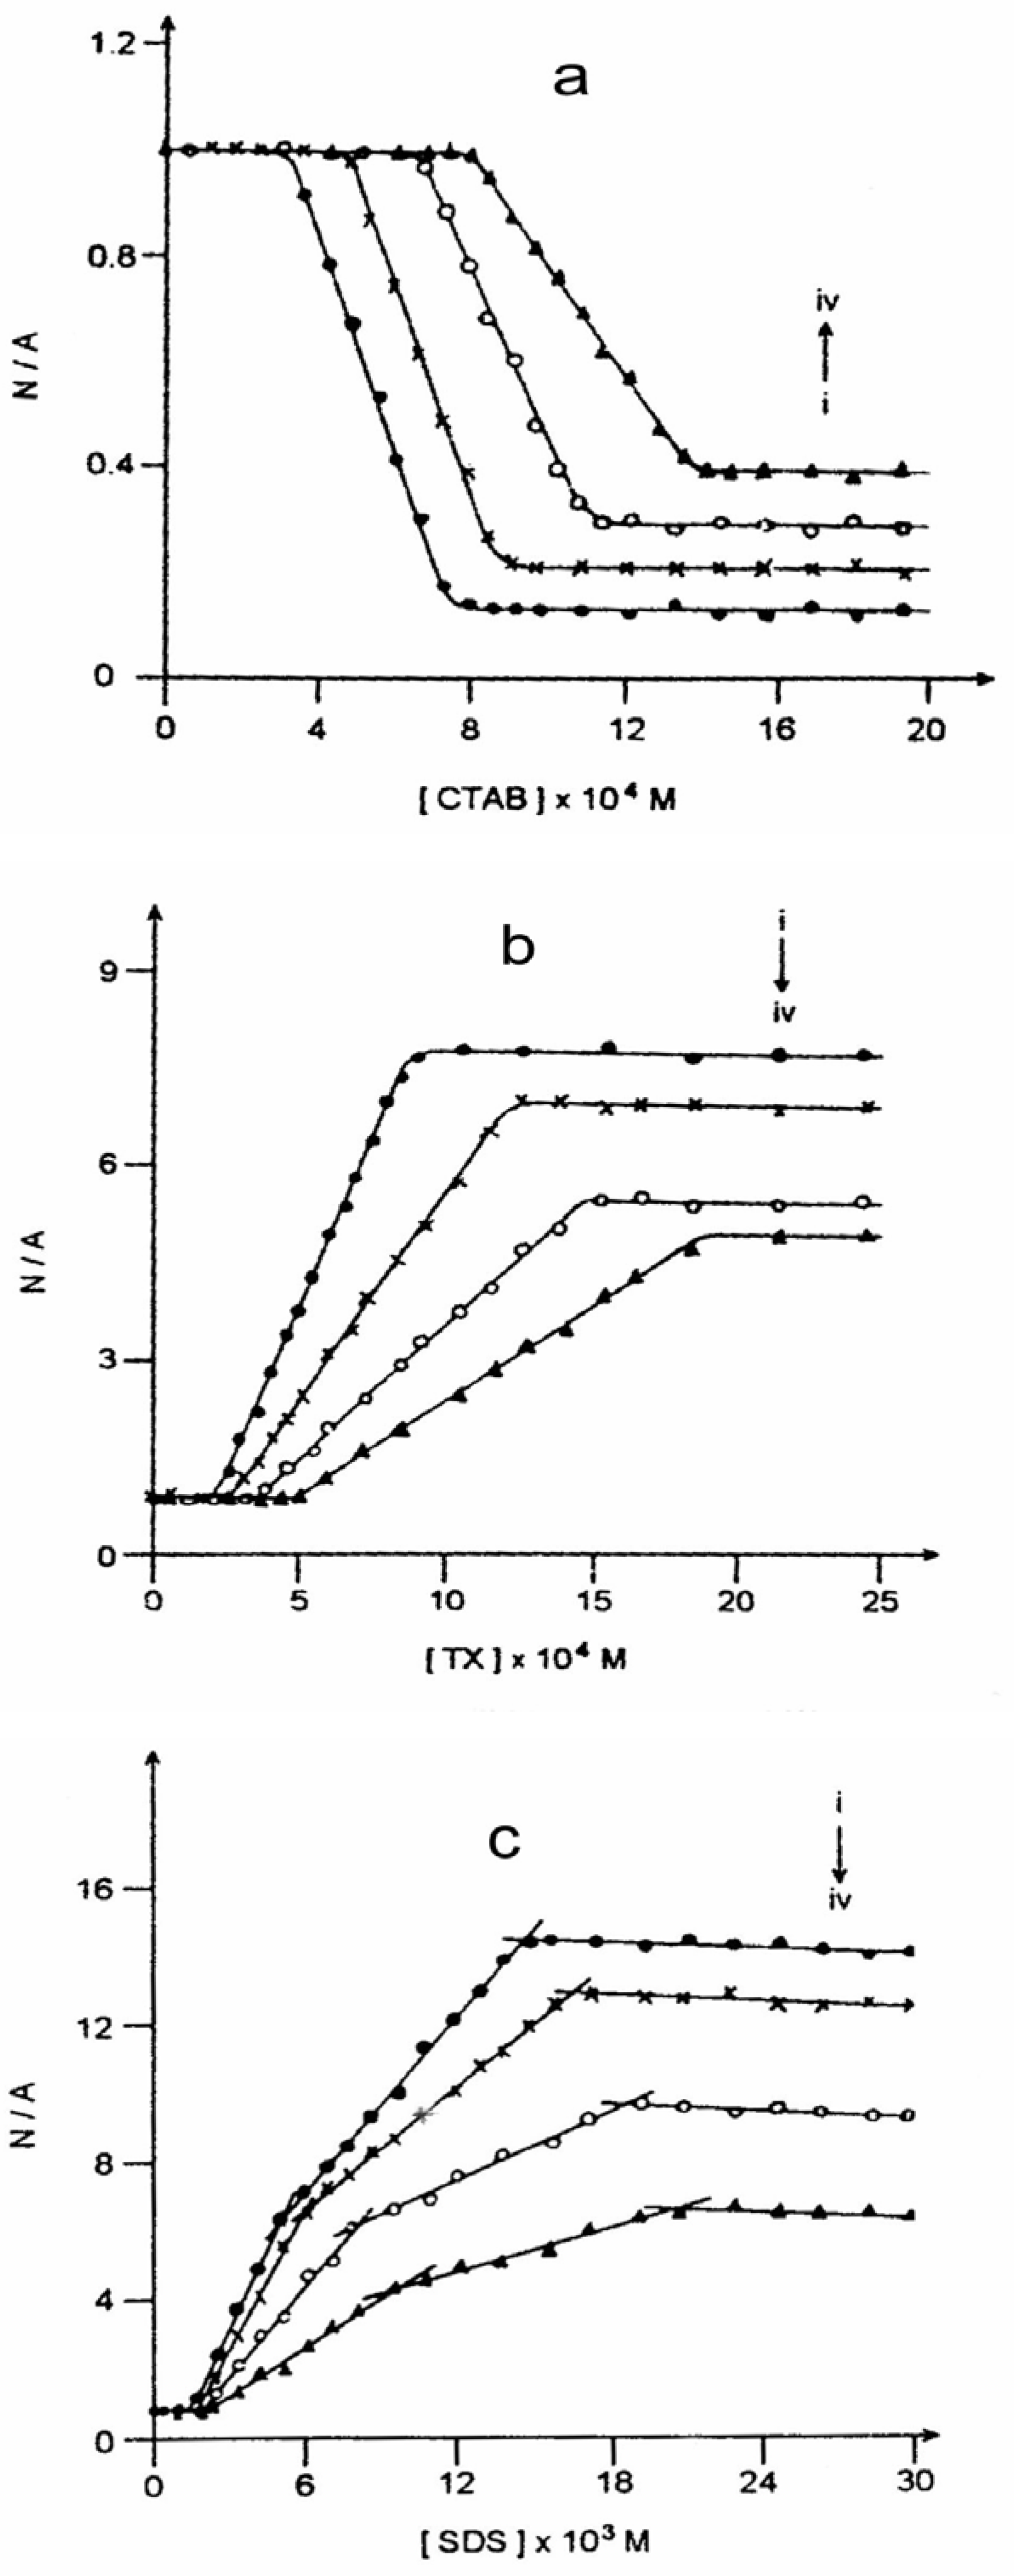
22]. Taking advantage of the dual luminescence corresponding to the two prototropic species during the ESPT reaction, it is possible to determine conveniently the critical micellar concentration (CMC) of the aqueous micellar systems. Neutral/anion (N/A) emission yield ratio (for steady state study) and fluorescence lifetime of the neutral species (τ
360) (for time-resolved study) are plotted against surfactant concentrations. The sharp break points, by convention, are assigned to the CMCs.
Figure 5 and
Figure 6 present such plots for the steady state and time-resolved studies respectively. The experiments suggest multiple CMCs for all the micellar systems. This aspect has been dealt with
Figure 5.
(a) Plot of neutral/anion emission yield ratio (N/A) against CTAB concentration in the presence of (i) 0.0, (ii) 1.0, (iii) 2.5 and (iv) 4.0 molar urea.(b) Plot of neutral/anion emission yield ratio (N/A) against TX concentration in the presence of (i) 0.0, (ii) 1.0, (iii) 2.5 and (iv) 4.0 molar urea.(c) Plot of neutral/anion emission yield ratio (N/A) against SDS concentration in the presence of (i) 0.0, (ii) 1.0, (iii) 2.5 and (iv) 4.0 molar urea.
Figure 6.
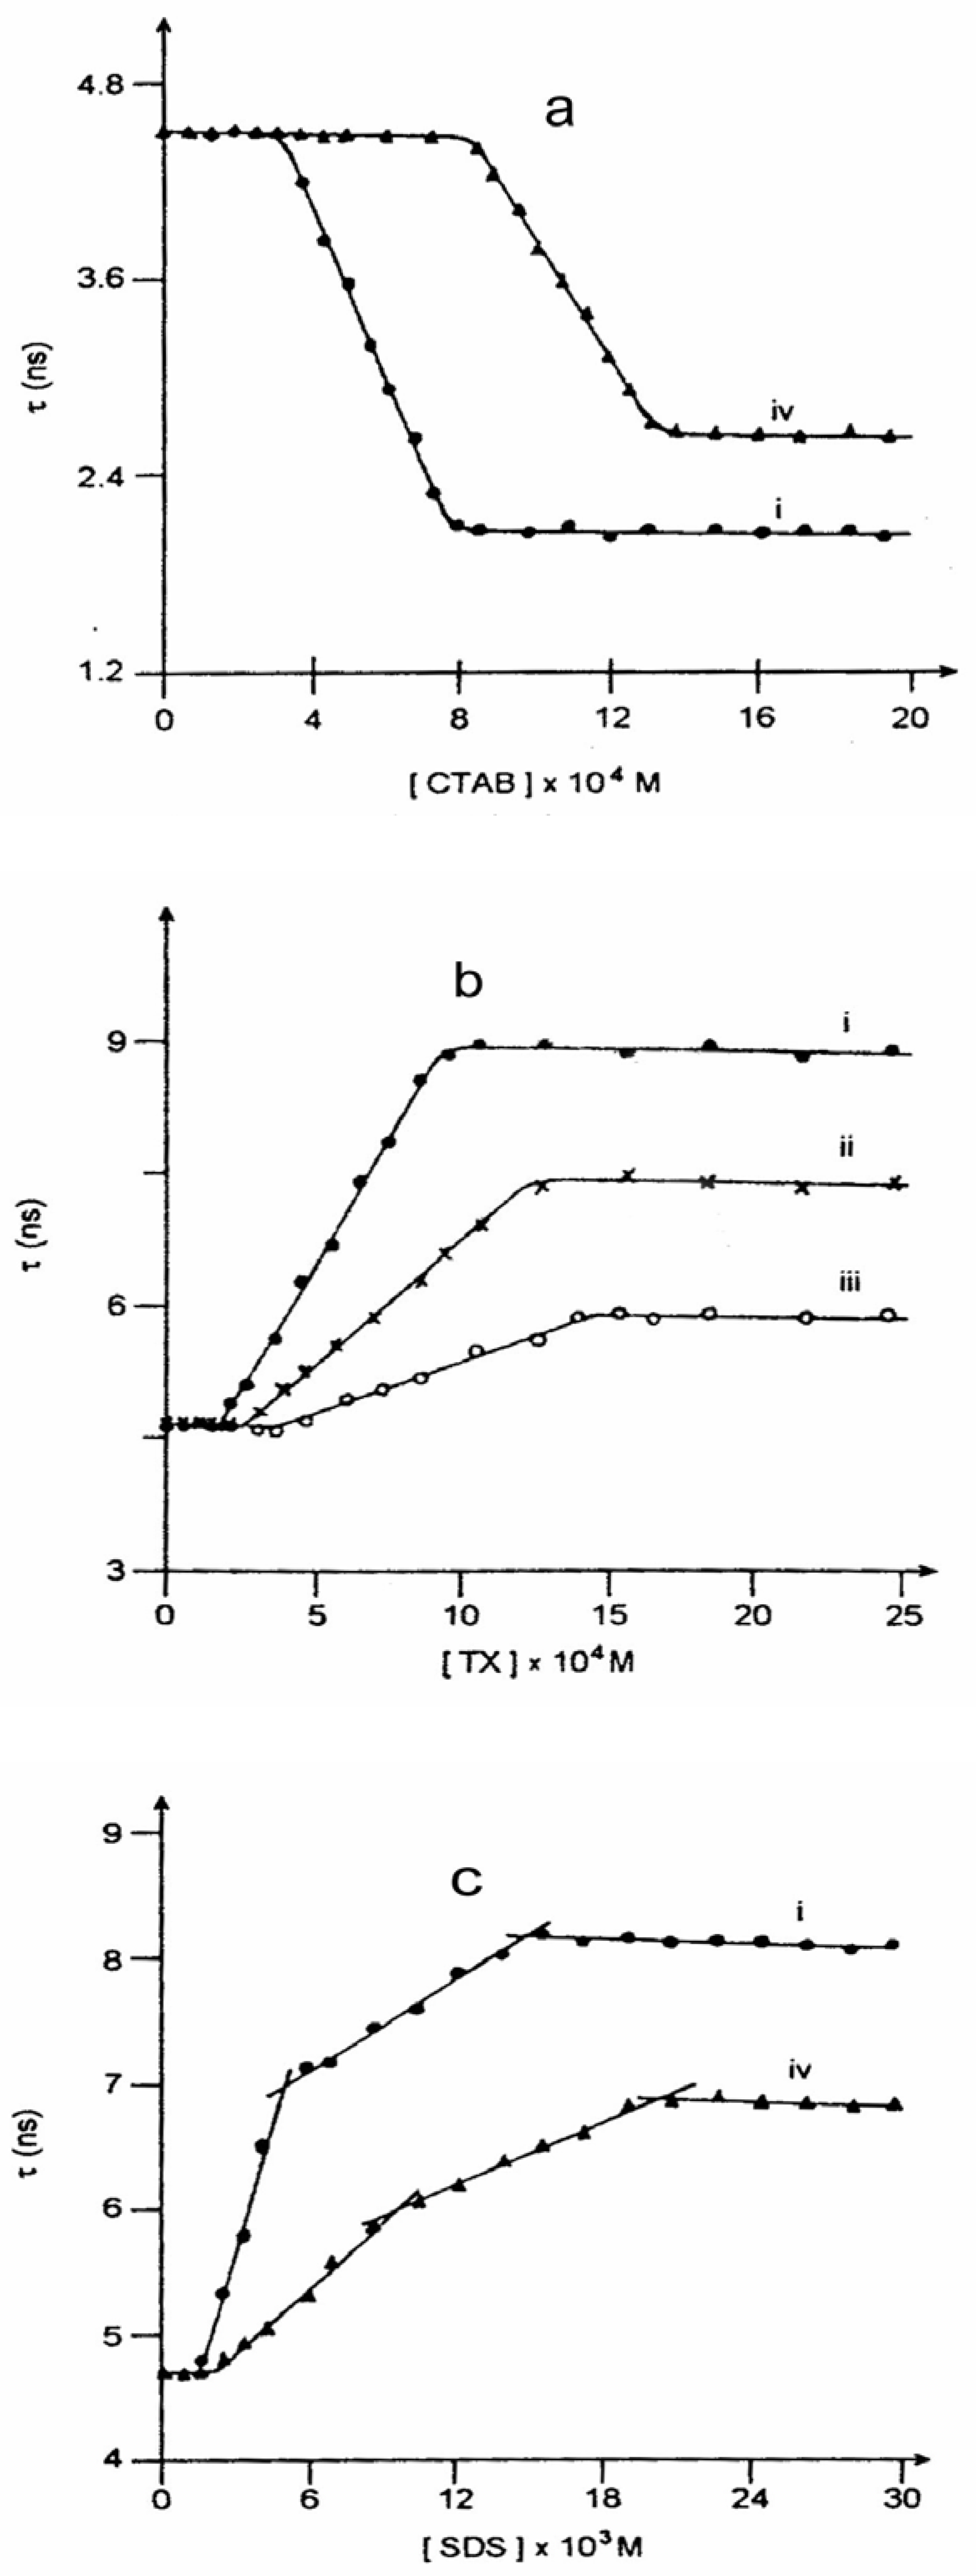
(a) Plot of lifetime of neutral CAZL (τ360) against CTAB concentration (i) in absence and (ii) in presence of 4.0 molar urea.(b) Plot of lifetime of neutral CAZL (τ360) against TX concentration in presence of (i) 0.0, (ii) 1.0 and (iii) 2.5 molar urea.(c) Plot of lifetime of neutral CAZL (τ360) against SDS concentration (i) in absence and (ii) in presence of 4.0 molar urea.
Figure 6.
(a) Plot of lifetime of neutral CAZL (τ360) against CTAB concentration (i) in absence and (ii) in presence of 4.0 molar urea.(b) Plot of lifetime of neutral CAZL (τ360) against TX concentration in presence of (i) 0.0, (ii) 1.0 and (iii) 2.5 molar urea.(c) Plot of lifetime of neutral CAZL (τ360) against SDS concentration (i) in absence and (ii) in presence of 4.0 molar urea.
in a separate communication [
39].
Table 6 presents the experimental CMC values for different aqueous micellar systems in the presence of various concentrations of urea.
Table 6.
Estimated CMCs for aqueous CTAB, TX and SDS systems in absence and in the presence of urea.
Table 6.
Estimated CMCs for aqueous CTAB, TX and SDS systems in absence and in the presence of urea.
| | | CMCs × 104(M) estimated through |
| Surfactant | Urea | Steady state study | Decay analysis |
| | (M) | CMC1 | CMC2 | CMC3 | CMC1 | CMC2 | CMC3 |
| CTAB | 0.0 | 3.0 | 7.5 | a | 3.0 | 7.6 | a |
| | 1.0 | 4.5 | 8.8 | a | b | b | a |
| | 2.5 | 6.5 | 11.2 | a | b | b | a |
| | 4.0 | 8.0 | 13.8 | a | 8.2 | 13.7 | a |
| TX | 0.0 | 2.0 | 9.0 | a | 1.8 | 8.9 | a |
| | 1.0 | 2.6 | 12.0 | a | 2.5 | 12.1 | a |
| | 2.5 | 3.6 | 14.5 | a | 3.4 | 14.7 | a |
| | 4.0 | 5.0 | 18.5 | a | b | b | a |
| SDS | 0.0 | 15 | 50 | 147 | 15 | 50 | 150 |
| | 1.0 | 17 | 60 | 165 | b | b | b |
| | 2.5 | 19 | 81 | 186 | b | b | b |
| | 4.0 | 21 | 96 | 206 | 20 | 95 | 204 |
Nature of Micellar Surface Charge
It is known that aqueous micelles can have different electrical characteristics on the surface of the micellar units. Thus, CTAB forms cationic, SDS anionic and TX non-ionic micelles in aqueous solutions. Since proton transfer is a process of charge separation, the ionic character of the environment around the probe is supposed to affect the equilibrium quotient of the ESPT reaction of CAZL. On the reverse way, looking at the relative variation of the I
─/I with addition of surfactant concentration one can assign the nature of the surface charge of the micellar units. An increase in the I
─/I value would reflect that the ESPT process is favored in the micellar phase and a decrease in the I
─/I value would mean that the process is disfavored. Since ESPT leads to the formation of anion from CAZL a favor to the reaction means that the micellar surface charge is positive and hence it stabilizes the anionic species produced through the photoreaction. A similar explanation would suggest a negative surface charge to a micellar system where the ESPT of CAZL is disfavored. Hence,
fig. 5 proposes that CTAB has a positive and SDS a negative surface charge. TX disfavors the ESPT of CAZL but to a much lesser extent as compared to that of SDS (
fig. 5(b) and
5(c)). This might suggest that the amount of restriction the prototropic reaction experiences here is less from the surface charge and more from the nonpolar microenvironment of the TX micelles which is in conformity with the non-ionic nature of the TX micelle.
Phase transition of Triton-X-100 at high ionic strength
In an aqueous Tritin-X-100 medium ([TX]= 5x10
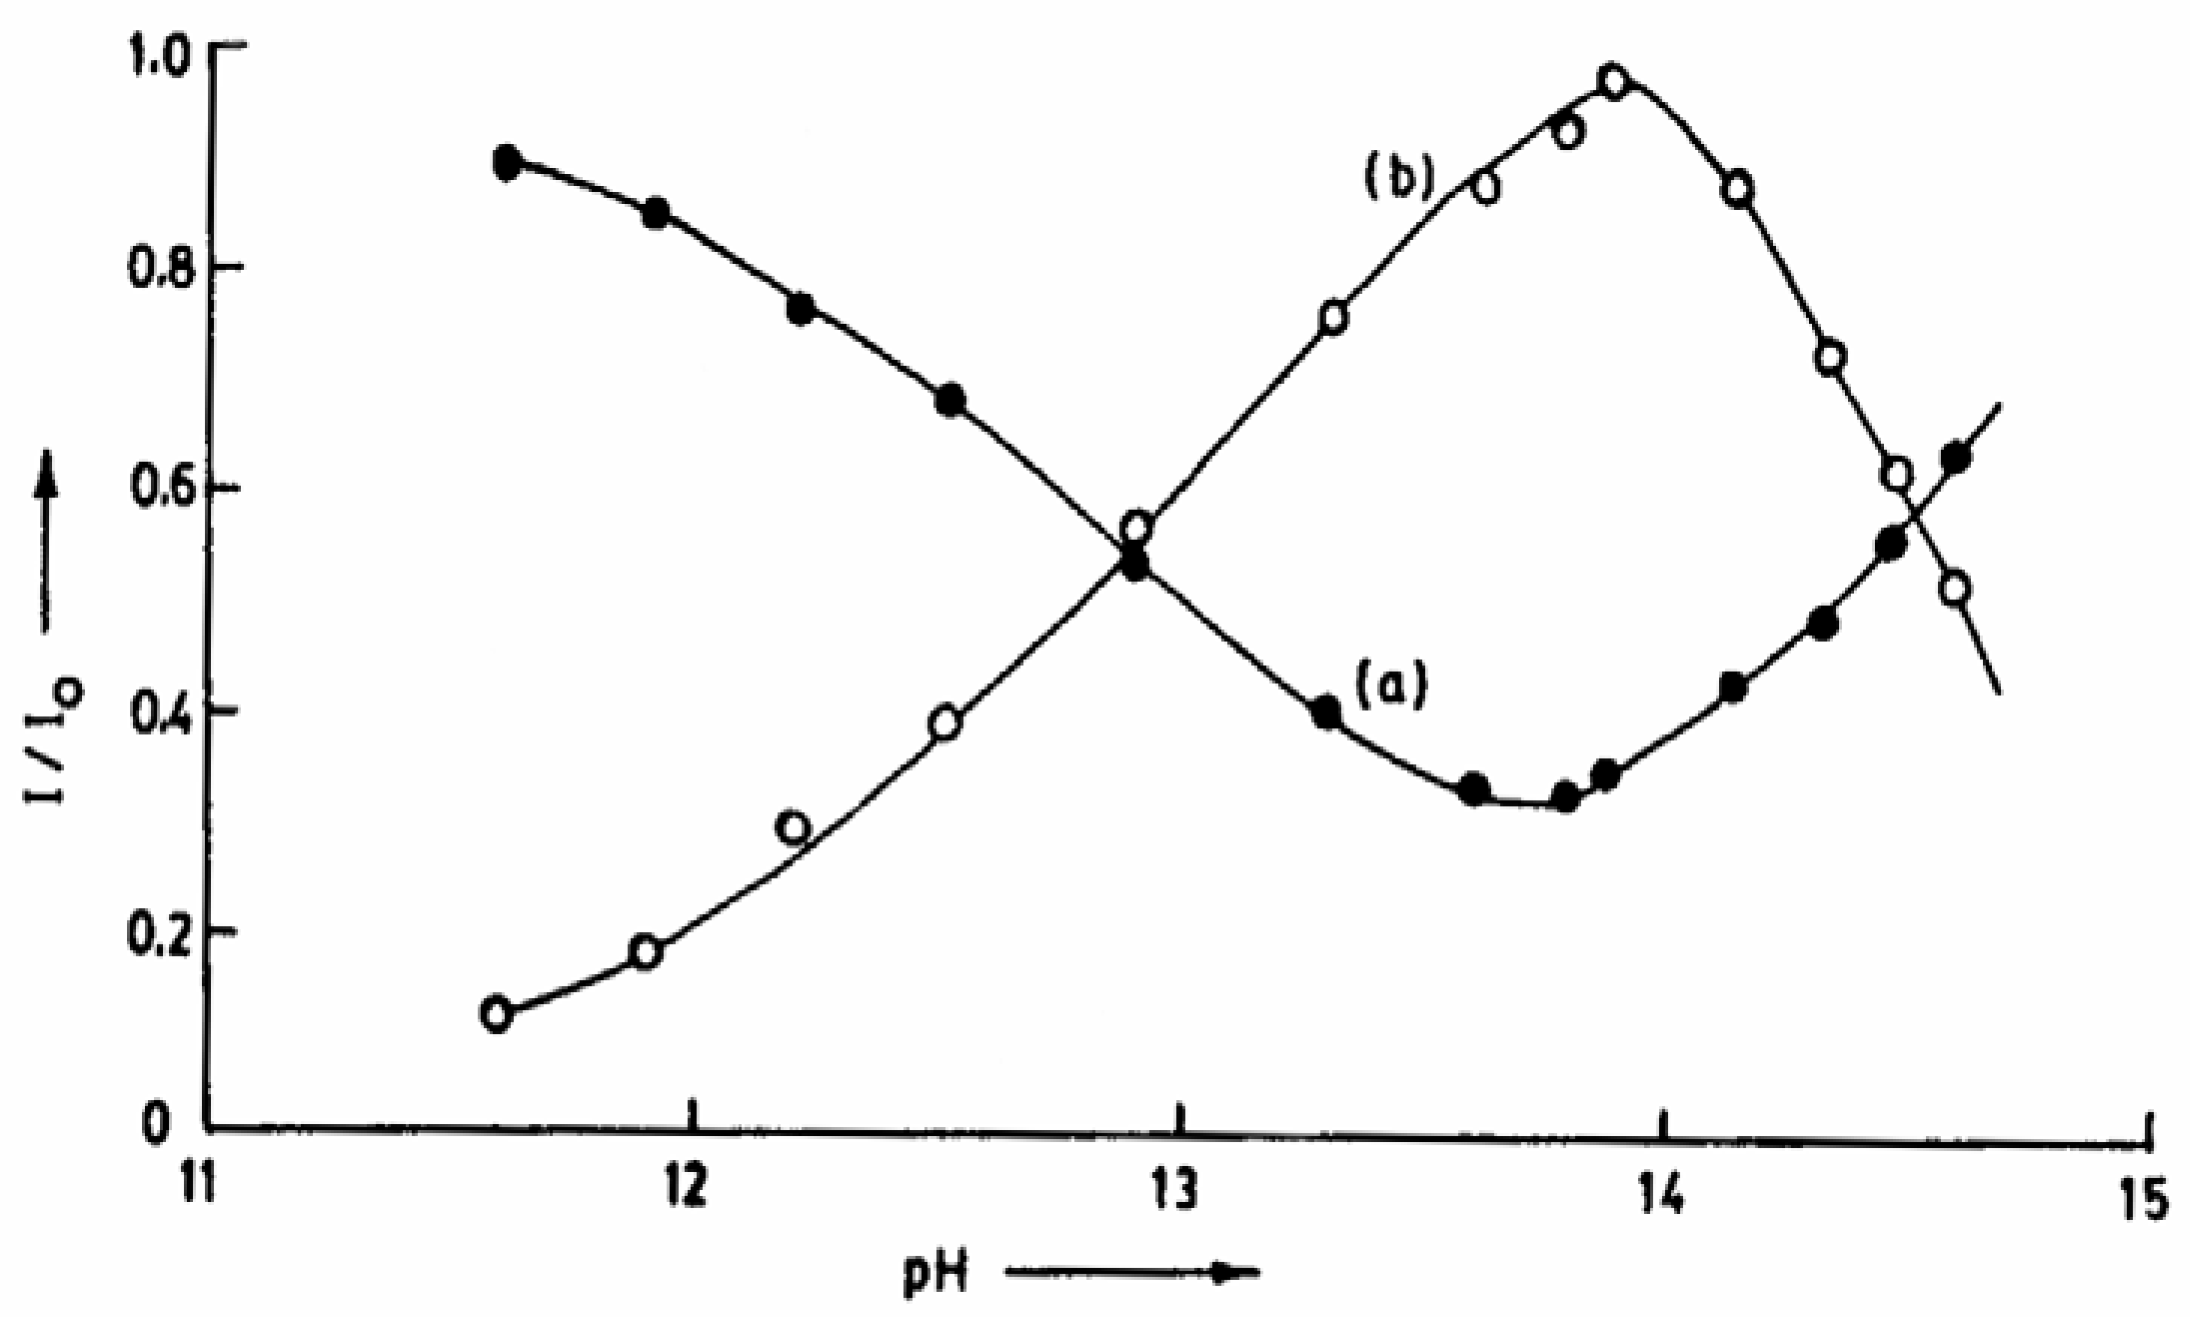
-4M) above the CMC value the anion fluorescence of CAZL increases at the cost of the neutral fluorescence as the prototropic quencher NaOH is added to the solution. However, after a sufficiently high concentration of the base has been added, an inversion in the ratio of neutral:anion luminescence is noticed reflecting a change in micellar nature.
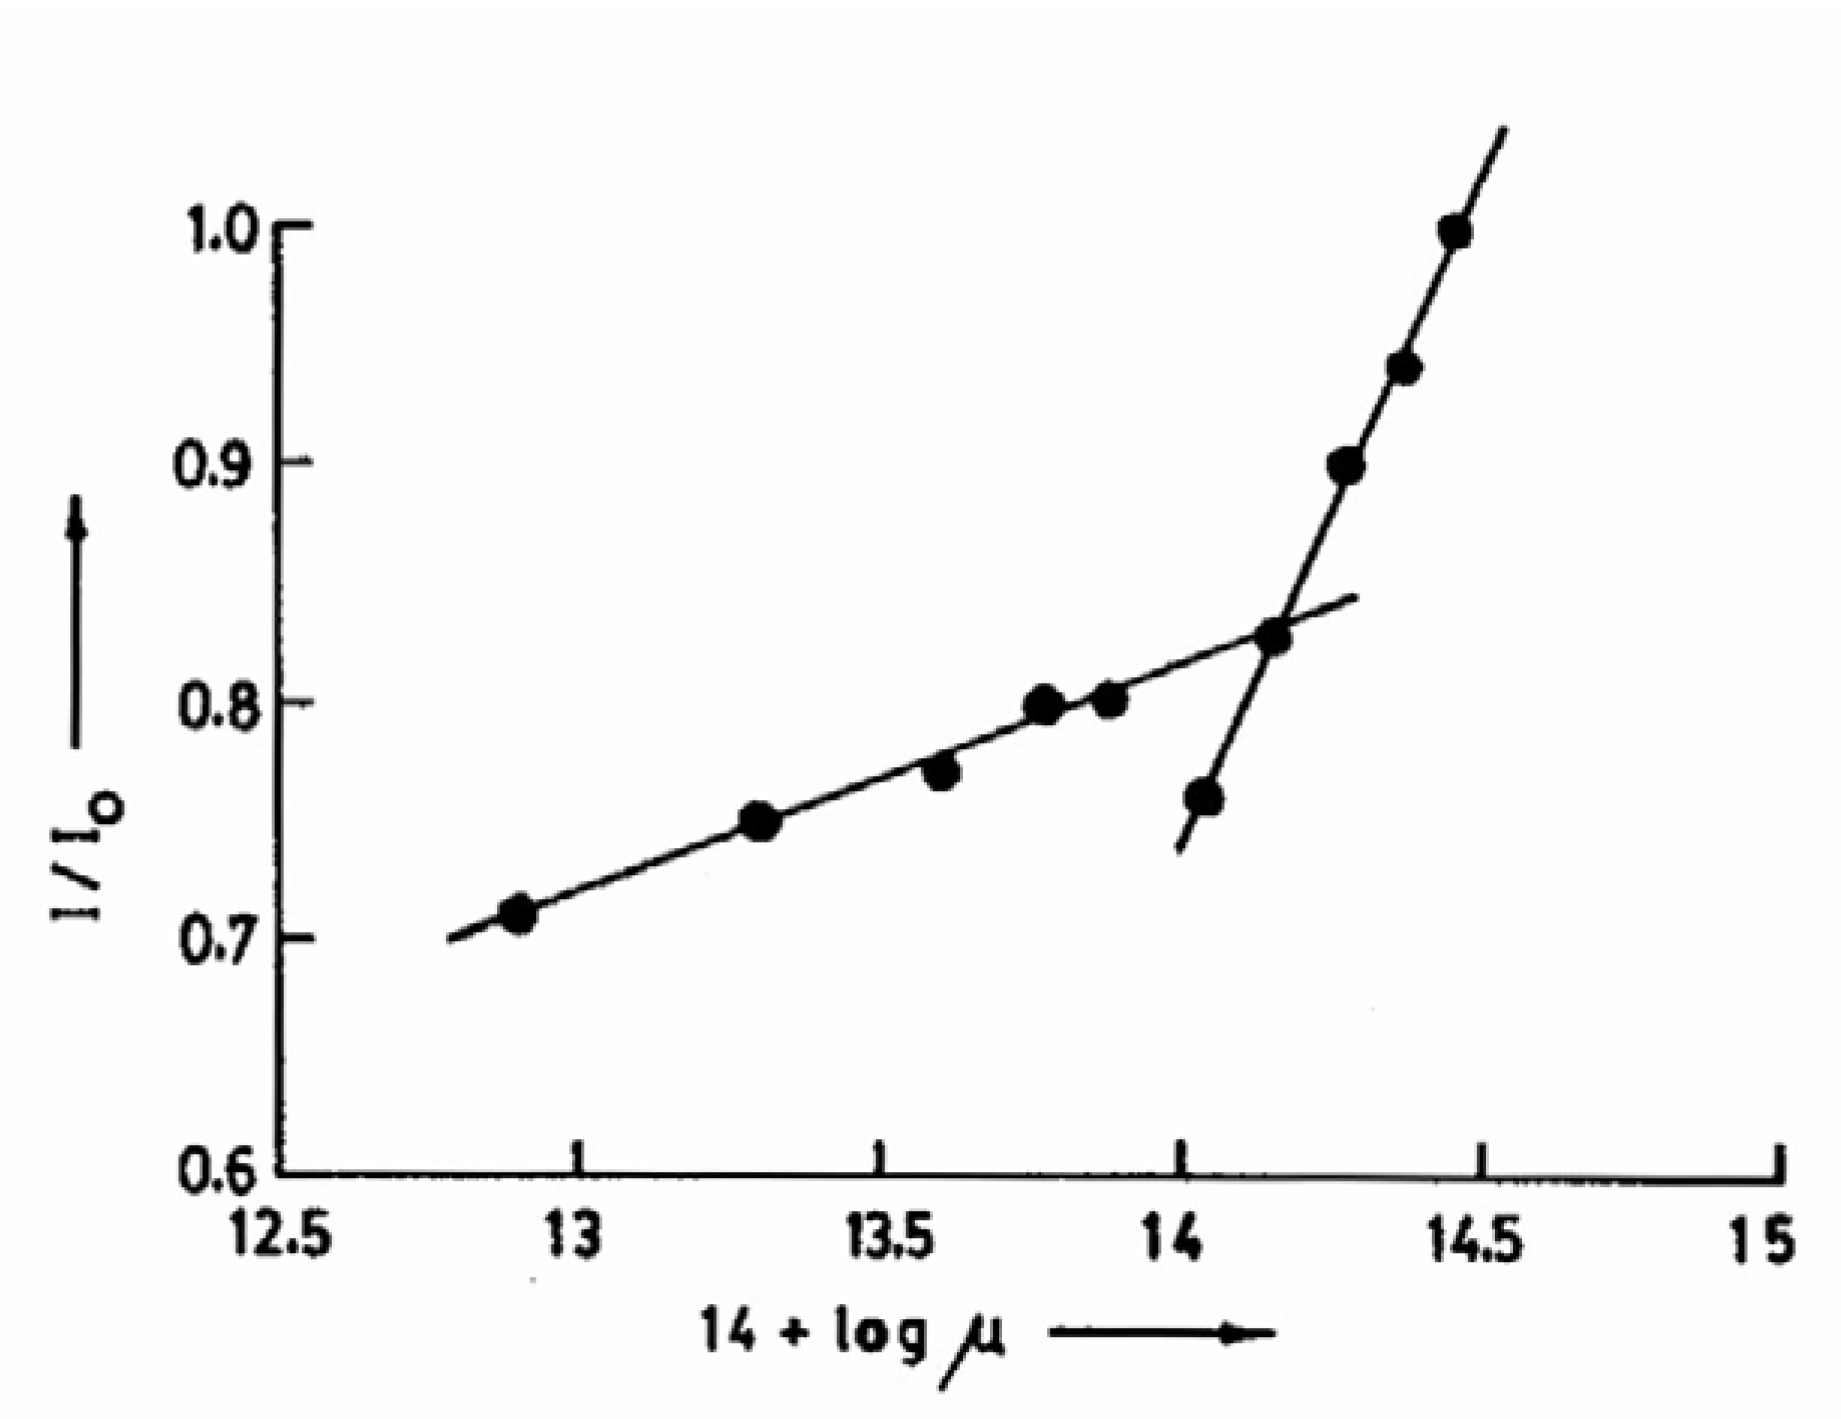
Fig.7 shows the variation of the individual luminescences during the prototropic reaction of CAZL in TX with an increase in the solution pH. The figure clearly points to this inversion above pH 13.5. The change is reversible, indicating that neither the probe nor the microenvironment of the probe undergoes a permanent modification. The transformation in TX is apparently caused by the high ionic strength of the concentrated NaOH solution, as the same change is observed by adding KCl externally. The relative enhancement of the neutral fluorescence at high KCl concentration in the presence of NaOH is shown in
fig.8. The break point in the plot of I/I
0 vs. 14+log μ corresponds to the inversion point in
Fig. 7.
This observation is explained by considering the phase transition of the micelle. A logical proposition is put forward as follows. The small spherical micelles aggregate to form larger ones (which are commonly considered to be rod-shaped). This increases the volume to surface ratio, and the number of CAZL molecules enclosed within the micellar core (less accessible to OH
─ for the deprotonation process because of the non-polar environment) increases, resulting in an enhancement of the neutral:anion fluorescence ratio. The phase transformation of non-ionic systems like dimethylolylamine oxide has already been shown by Ikeda et al. from their light scattering experiments [
40]. They have shown that the said non-ionic system can associate to form rod-like micelles with a molecular weight as high as 10
6 in a concentrated NaCl solution in the presence of 10
-3 M HCl. The
Figure 7.
Plot of I/I0 of CAZL vs. pH of aqueous TX (5x10⁻⁴M) solution : (a) neutral and (b) anion.
Figure 7.
Plot of I/I0 of CAZL vs. pH of aqueous TX (5x10⁻⁴M) solution : (a) neutral and (b) anion.
Figure 8.
Plot of I/I0 of CAZL vs. 14 + log μ.
Figure 8.
Plot of I/I0 of CAZL vs. 14 + log μ.
phenomenon has been explained by the proposition that the smaller micelles aggregate to form larger ones through the development of a potential on the micellar surface by protonation; this is then followed by the salting-out effect [
41]. A much simpler steady-state experiment with the ESPT of CAZL can suggest a phase transformation of a non-ionic micellar system through the exploitation of its dual fluorescence coming out of this photoreaction.
Location of the probe
The ESPT reaction of CAZL further suggests the probable location of the probe in different micellar microenvironments. Although the steady state fluorescence spectrum of the anion is unstructured in both water and aqueous SDS solutions, it is well structured in aqueous solutions of TX and CTAB. This simple observation dictates that in all these environments the probe does not experience the same polarity in its immediate environment and suggests that the location of the probe is not equivalent in all theses environments. A similar resolved anion emission band is observed in propanolic solvent, indicating that in TX-water and CTAB-water CAZL anion resides at a location where the environment is remarkably less polar than pure aqueous phase. Thus, the observations predict that in SDS medium the anion resides in aqueous phase only. The negative surface charge of SDS micelles, as discussed before, also supports this observation by imposing repulsion to the photoproduced anion compelling it to leave the micellar environment and to reside into the bulk aqueous phase only. In TX and CTAB micelles, the situation is not so straightforward. While the spectral resolution indicates a non-aqueous environment, the anion lifetime corresponds to that in the aqueous phase [
22]. The complicacy has been resolved by proposing that the fluorophore resides at the micellar interfacial region, keeping the aromatic rings, responsible for the anionic spectral resolution, inside the micellar phase and the polar part (>NH) of the probe into the aqueous phase. A cationic surface charge of CTAB and the non-ionic nature of TX support that in these systems the anion can reside at the micellar surface.
Effect of urea
Interest in the study of the effect of urea on the photophysical and/or photochemical processes of probes in different microheterogeneous environments stems from the denaturing action of urea towards proteins [
42,
43,
44]. To explain this action two propositions have been put forward. The first school believes that urea breaks the liquid structure of the solvent water and according to the second school urea displaces some water molecules from the periphery of the microheterogeneous units (like micelles, cyclodextrins, proteins etc), which eventually modifies the solvation of the fluorophore. Surface tension measurements [
45] and computer simulations [
46] support the second proposition and dictate that there is hardly any difference between the water molecules in the vicinity of the urea molecules from those in the bulk. Recent studies from our group also reveal that it is the expulsion of the probe that results from the addition of urea to the solution [
25,
47].
Figure 5 and
Figure 6 reflect that there is hardly any effect of urea until the first CMC is reached in all the micellar systems. This establishes that urea modifies the micellar units, and not water itself. Thus, urea is not a water structure breaker [
48].
Urea affects the neutral to anion ratio (N/A) of CAZL or τ
360 values as CMC
1 is reached or crossed. In the presence of urea in micellar solutions, a change in the relative fluorescence yield is observed at a much higher surfactant concentration as compared to that in its absence (
fig. 5). The lifetime of the neutral CAZL species (τ
360) also starts to deviate much later in the presence of urea (
fig. 6). Both the observations reflect that the CMCs of the surfactant solutions increase in the presence of urea (
Table 6) quite similar to the denaturing action of urea on proteins. The discrepancies between the values in absence and in the presence of urea are too large to be explained by urea-induced change in the microviscosity or micropolarity.
Aqueous Cyclodextrins
ESPT reaction of different prototropic probes is modified in the presence of cyclodextrins (CDs). Shizuka and coworkers [
30,
31] and Eaton [
49] established that the proton transfer rates for the naphthylamine-CD and naphthol-CD systems are decreased remarkably compared to the rates for the free fluorophores in pure aqueous medium. Our own work on ESPT of CAZL, however, shows that the deprotonation rate is enhanced upon encapsulation of the probe. The details of the proton transfer of CAZL in different CDs have been reported elsewhere [
50,
51]. In these reports encapsulation of CAZL have been established through fluorescence anisotropy and fluorescence quenching experiments. The principal observation of our experiments is that the prototropic equilibrium shifts toward the anionic form on encapsulation of CAZL in CDs. This trend is just the opposite to what is observed in naphthol or naphthylamine systems [
50]. Measurement of the individual rates reflects that the forward deprotonation rate constant (k
1) gets nearly doubled whereas the back reprotonation rate constant (k
2) remains unaffected upon encapsulation of CAZL in β- and γ-CDs. The individual rate constants for the ESPT process estimated in different CD environments are tabulated in
Table 7 (see later). It is pertinent to mention here that CAZL molecule is too big to be included within α-CD leaving no reflection on the k
1 values with the addition of α-CD.
An interesting observation during the study of ESPT of CAZL in the presence of β-CD is the resolution of the fluorescence band of the anion (similar observation was noticed in aqueous TX and CTAB environments). The anionic emission is however unresolved in the γ-CD environments. This differential behavior is explained from the difference in the cavity sizes of β- and γ-CD. While the former one has enough cavity space just to embed CAZL, the latter one is big enough to include some water molecules along with the probe molecule.
Thus, whether or not the excited state prototropic process is favored depends on the CD-imposed microenvironment of the guest molecule as well as the location of the deprotonation center. Using the same CD, the deprotonation rates are found to be lowered when the deprotonating groups are ─NH
2 (naphthylamines) or ─OH (naphthols), but enhanced when the group is a heterocyclic >NH (CAZL). The discrepancy between the results for CAZL and naphthylamines or naphthols is ascribed to the rigidity of the >NH site of CAZL compared with the free ─NH
2 or ─OH groups. For the latter two groups of compounds, the prototropic centers are embedded within the CD cavities and hence the deprotonation process is restricted because of a less polar environment as well as less accessibility of the external base (OH¯) in such environments. The observations during study of the ESPT of CAZL in aqueous and aqueous CD environments establish that [
50,
25] the fluorophore sits in the rim regions of β- and γ-CD. The enhanced deprotonation has been explained by a cooperative proton transfer mechanism following the flip-flop hydrogen bonding of the alcoholic ─OH groups of CDs in the rim region [
51,
52,
53]. The encapsulation pattern of CAZL in different CDs and the cooperative proton transfer has been schematically presented in
Fig. 9. High local concentration of the alcoholic ─OH groups around the deprotonation center of CAZL facilitates the prototropic process through cooperative action [
50]. The dual fluorescence of CAZL, thus, suggests the location as well as the orientation of the probe in the CD cavities.
Figure 9.
Schematic encapsulation of CAZL in different CDs.
Figure 9.
Schematic encapsulation of CAZL in different CDs.
Effect of urea
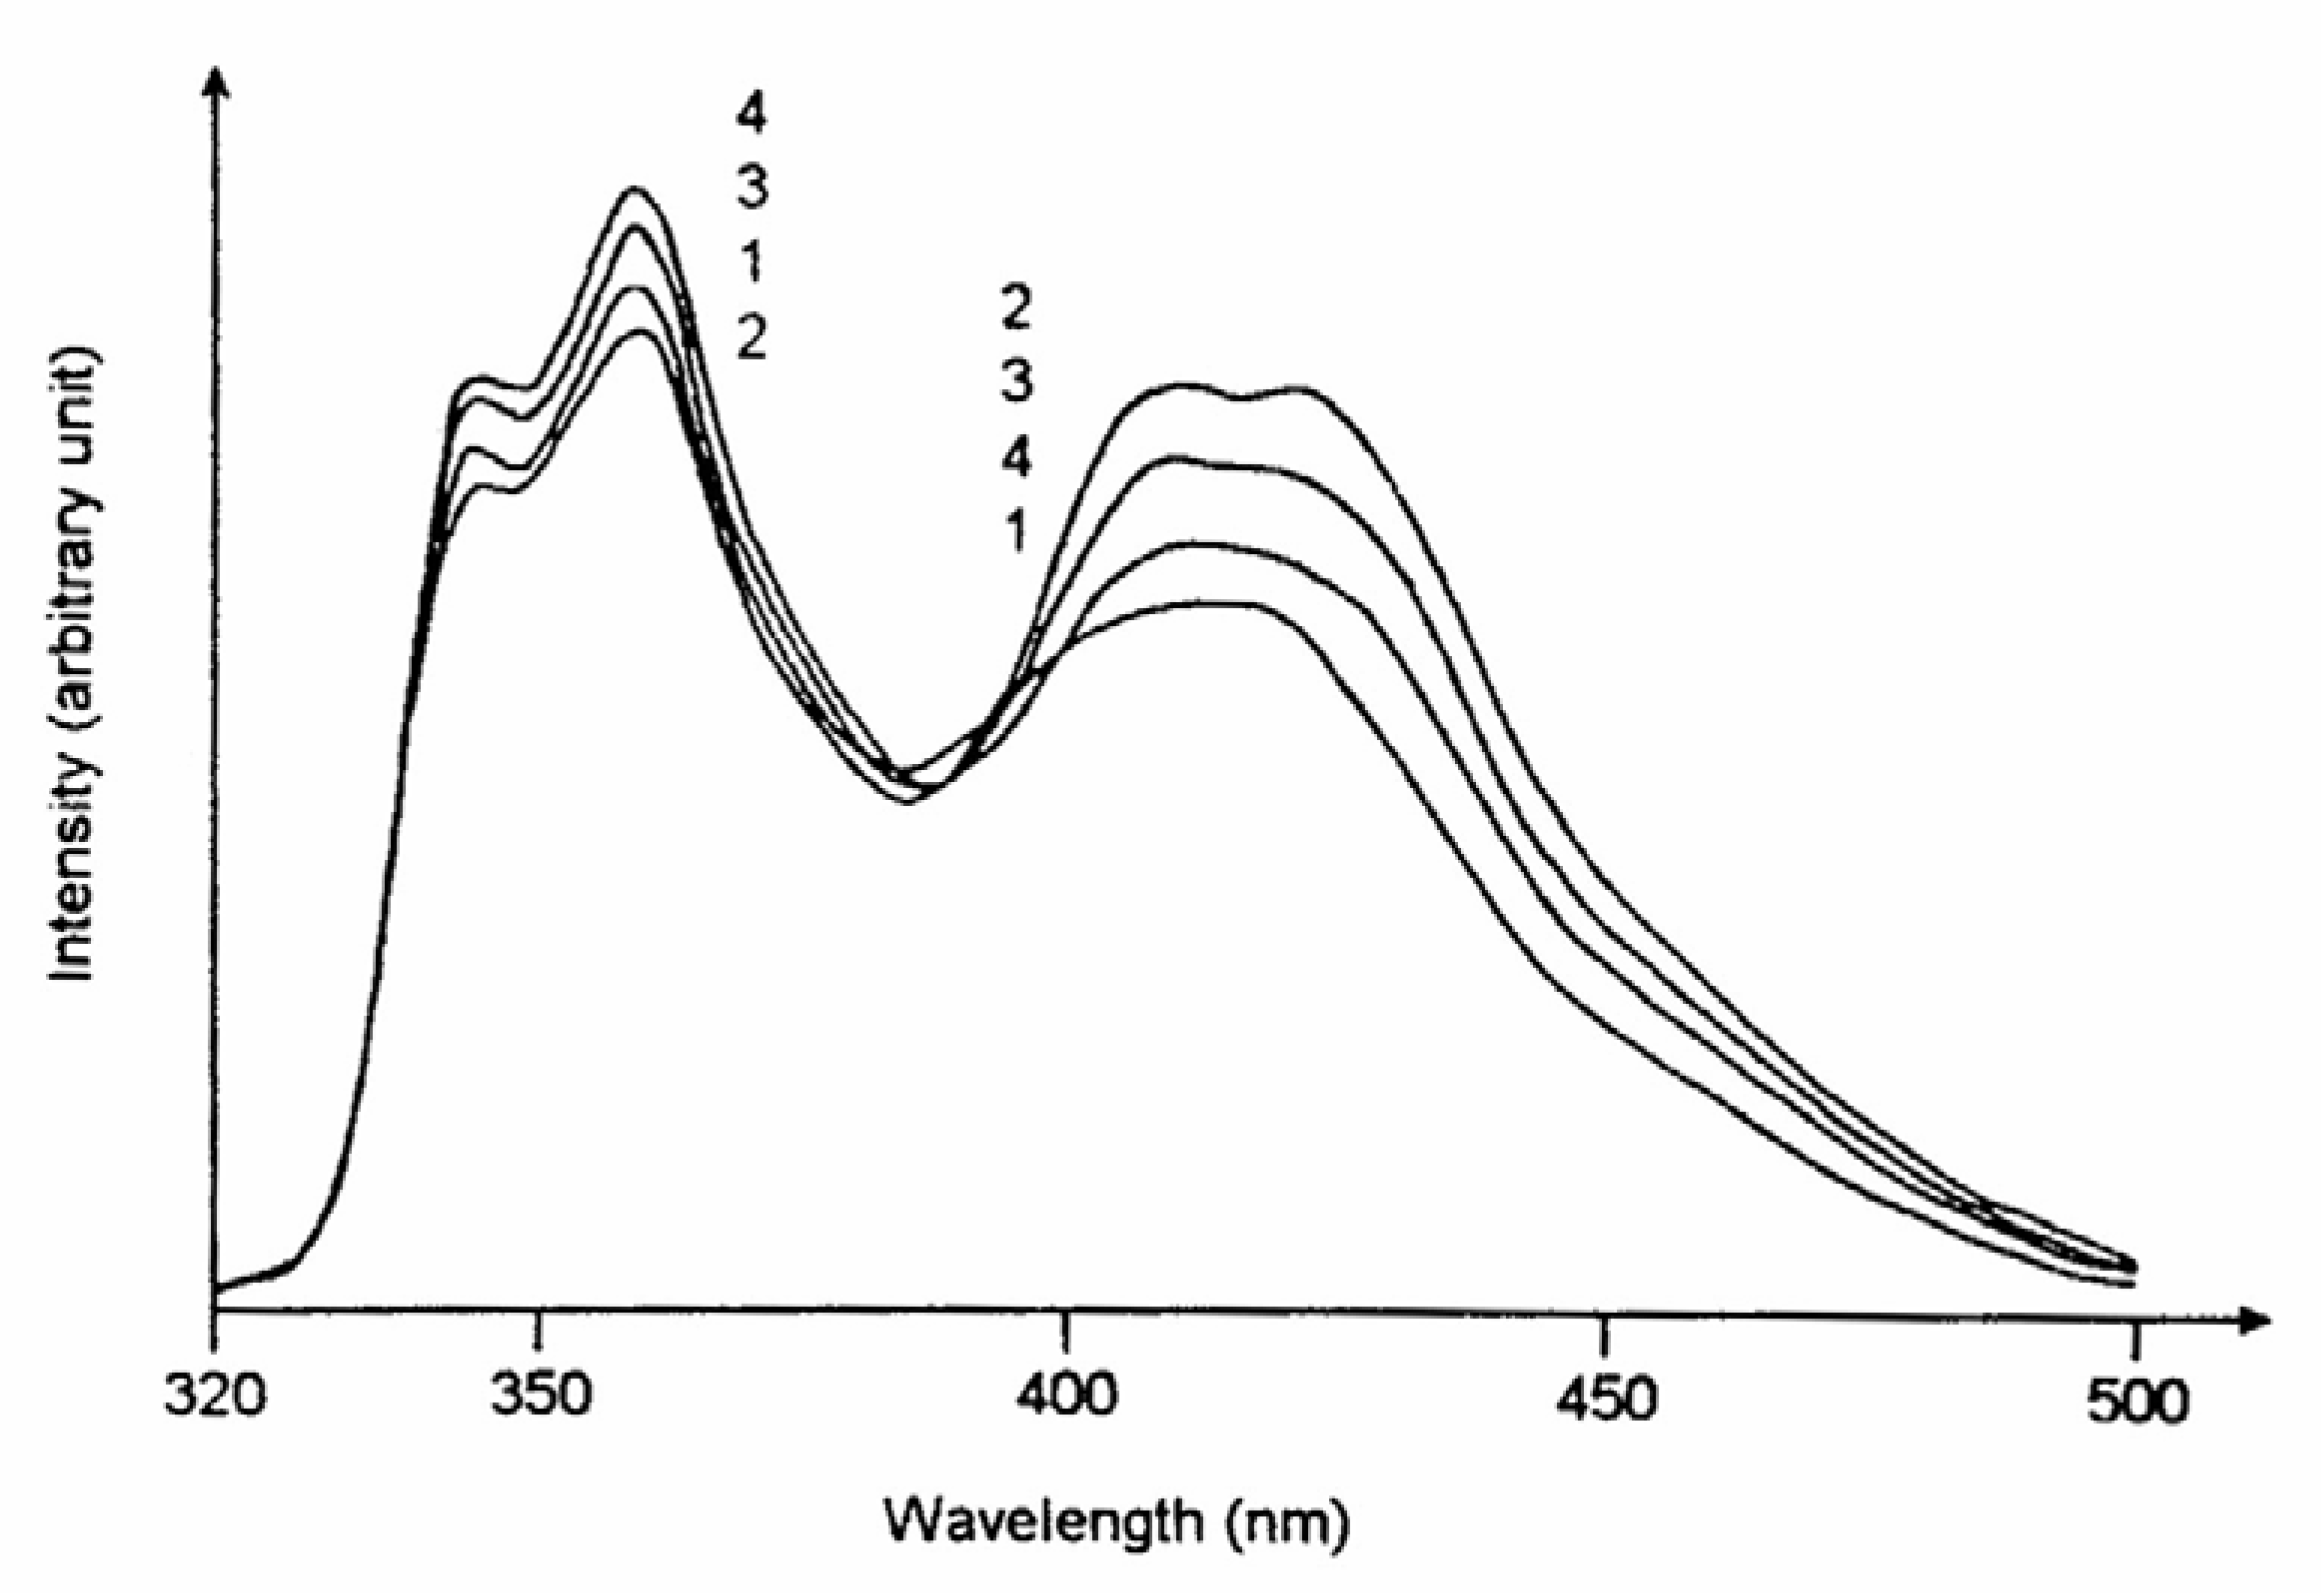
The variation of the steady state fluorescence of an aqueous solution of CAZL with subsequent addition of β-CD followed by urea at a definite pH (=12) is shown in
Fig. 10.
The figure dictates that with the inclusion of CAZL in β-CD, the anion yield (emission at 415 nm) is enhanced at the cost of the neutral emission (360nm) the alkali concentration remaining the same. Addition of urea to the resulting solution, however, reverses the intensities of the bands indicating that urea induces a remarkable change in the microenvironment around the probe. The first part is just a reproduction of what has been discussed above while the latter part shows the effect of addition of urea to the microenvironment. Upon encapsulation with the CDs, the deprotonation rate constant for the ESPT process increases leading to a relative enhancement of the anionic emission. As mentioned before, the anionic emission of CAZL in the presence of β-CD is structured. It is interesting to note that the vibronic resolution is lost and the band resembles to that produced in pure aqueous medium as and when sufficient amount of urea (2M) is added to the system. This observation suggests that urea expels CAZL from the CD environment to the bulk aqueous phase. From the time-resolved decay measurements the rate constants for the ESPT process have been measured and they are presented in
Table 7.
Figure 10.
Steady state fluorescence spectra of CAZL in different aqueous environments at pH 12: (1) in water, (2) in 5mM β-CD, (3) in 5mM β-CD plus 1M urea and (4) in 5mM β-CD plus 2M urea. CAZL concentration is same in all the cases.
Figure 10.
Steady state fluorescence spectra of CAZL in different aqueous environments at pH 12: (1) in water, (2) in 5mM β-CD, (3) in 5mM β-CD plus 1M urea and (4) in 5mM β-CD plus 2M urea. CAZL concentration is same in all the cases.
Table 7.
Rate constants for the ESPT reaction of CAZL in the presence of different additives.
Table 7.
Rate constants for the ESPT reaction of CAZL in the presence of different additives.
| Rate constant | Water | 5mM β-CD | 5mM β-CD + 2M urea |
| k1 (M-1s-1) | 1.0 x 10¹⁰ | 1.9 (±0.1) x 1010 | 8.1 (±0.2) x 109 |
| k2 (s-1) | 8.5 x 10⁶ | 8.0 (±0.2) x 106 | 8.2 (±0.2) x 106 |
The rate constant values reflect that while the forward rate constant for the ESPT process of CAZL is enhanced by 90% in the presence of β-CD; it falls within the range of that obtained in pure aqueous phase on addition of 2M urea. The rate constant for the backward process, however, remains practically unaffected in all the modifications of the environment. The rate analyses categorically reflect that in the presence of 2M urea, the ESPT reaction is taking place in an environment, which is very similar to the bulk water. The slight lowering in the deprotonation rate constant is ascribed to the lowering in the bulk polarity due to the addition of reasonable amount of urea.
Both the unresolved fluorescence band of the anion as well as the rate constant values establish that the CAZL molecule, which in association with β-CD, was in a microenvironment different from water, in the presence of urea, goes into an environment which is nothing but bulk aqueous phase modified by urea. Thus, urea seems to expel the probe molecule from the CD cavity to the bulk water.
The expulsion of CAZL molecule from the CD environment has also been established by the fluorescence quenching study of the fluorophore by potassium iodide. The quenching rate constants have been estimated following the steady state fluorescence quenching of the fluorophore with the quencher and the lifetime of the former in the absence of the quencher. The values of the quenching rate constants are given in
Table 8.
The value of the quenching rate constant in the presence of β-CD and urea together is much higher than that for the probe in β-CD solution only. This reflects that in the presence of added urea the fluorophore is no more within the CD cavity. The former rate constant value is, however, a bit below the value obtained in pure aqueous phase. An independent quenching study of CAZL in aqueous urea solution ([urea]=2M) also yielded a rate constant value close to that obtained in an environment with β-CD and urea together (
Table 8). The agreement between the two rate constant values establishes that the fluorophore CAZL, originally embedded within β-CD cavity, is released to the bulk aqueous phase in the presence of urea.
Table 8.
Rate constants for quenching of CAZL by KI.
Table 8.
Rate constants for quenching of CAZL by KI.
| Medium | KSV | τ0 (ns) | Quenching rate constant (M-1s-1) |
| Water | 20.0 | 10.0 | 2.00 (±0.2) x 109 |
| 5mM β-CD | 10.2 | 10.5 | 0.97 (±0.1) x 109 |
| 5mM β-CD + 2M urea | 14.5 | 10.1 | 1.43 (±0.2) x 109 |
| 2M urea | 13.6 | 9.9 | 1.37 (±0.2) x 109 |


