Article

Impact of Habitat Loss and Mining on the Distribution of Endemic Species of Amphibians and Reptiles in Mexico

by
Fernando Mayani-Parás
1,*,
Francisco Botello
1,
Saúl Castañeda
2 and
Víctor Sánchez-Cordero
1
1
Departamento de Zoología, Instituto de Biología UNAM, Circuito Exterior s/n, Ciudad Universitaria, CDMX 04510, Mexico
2
Departamento de monitoreo biológico y planeación de conservación, Conservación Biológica y Desarrollo Social, A. C., CDMX 04870, Mexico
*
Author to whom correspondence should be addressed.
Submission received: 20 August 2019 / Revised: 9 October 2019 / Accepted: 12 October 2019 / Published: 5 November 2019
(This article belongs to the Special Issue Systematics and Conservation of Neotropical Amphibians and Reptiles)

Abstract

:
Mexico holds an exceptional diversity and endemicity of amphibian and reptile species, but several factors pose a threat to their conservation. Here, we produced ecological niche models for 179 Mexican endemic amphibian and reptile species and examined the impact of habitat loss and mining activities on their projected potential distributions, resulting in their extant distributions. We compared extant species distributions to the area required to conserve a minimum proportion of the species distribution. The combined impact of habitat loss and mining on extant species distribution was significantly higher than the impact of habitat loss alone. Only 40 species lost <30% of their distribution, while 83 species lost between 30–50%, 54 species lost between 50–80%, and 2 species lost more than 80% of their distribution. Furthermore, the size and configuration of the area required to conserve 20% of the extant species distributions changed considerably by increasing the number of fragments, with a potential increase in local population extirpations. Our study is the first to address the combined impact of habitat loss and mining on a highly vulnerable rich endemic species group, leading to a decrease in their potential distribution and a potential increase in the extinction risk of species.

1. Introduction

Mexico holds an exceptional species richness and endemicity of amphibians and reptiles, ranking in the top three countries worldwide [1]. It has over 376 species of amphibians and 864 species of reptiles, and approximately 65% and 57% of these species, respectively, are endemic [2,3]. However, it has been argued that both amphibians and reptiles are the two most vulnerable groups of terrestrial vertebrates, being at significantly higher risk than mammals and birds [4,5,6] for threats such as habitat loss and fragmentation. One third of the species of amphibians worldwide are threatened with extinction according to IUCN [7], and only 35% of Neotropical and Nearctic species are in the IUCN Least Concern Category [5,6]. Species of reptiles have been less studied, but they are also highly vulnerable to these threats [8], and it is likely that reptiles are at high risk of extinction as well [4]. In general, both groups are highly dependent on the environmental conditions and are very vulnerable to pathogens, invasive species, ultraviolet-B exposure, and pollution [9,10,11,12]. Several factors, such as habitat loss and fragmentation, water pollution, climate change, and mining have been identified to negatively affect their breeding activities, reproduction, and survival performance [13,14], leading to the reduction of species range size and local population extirpation.
Mexico has lost over 13.5 million ha of natural vegetation in the last 50 years [1] due to annual deforestation rates greater than 1% nationwide [15]. This habitat loss and fragmentation affects most ecosystems and species of flora and fauna, increasing the vulnerability and extinction risk of species [16]. Since species of amphibians and reptiles have dispersal limitations [17], their movements between habitat fragments are limited and going from unfavorable to favorable habitats is unlikely [13,14]. As a result, the Global Amphibian Assessment suggests that habitat loss impacts 89% of the threatened amphibian species in the Americas, which is three times the impact of any other threat [18]. Recent studies have proposed that human-induced habitat loss is important, affecting the diversity and abundance of amphibian and reptile species [19] in Neotropical habitats [20], xeric habitats [21], and dry plains [22]. Furthermore, small-range species are more likely to show population declines [23]. For example, 70% of Mexican species of amphibians and 80% of species of reptiles have restricted distributional ranges and high environmental specialization, increasing their vulnerability [24]. In fact, the distributions of endemic amphibian and reptile species have declined 80% and 70%, respectively [25].
In addition to habitat loss, mining activities are suspected to impose a high risk to species of amphibians and reptiles, but this has been poorly studied. Mexico ranks second in silver production worldwide and is one of the countries with the largest production of gold, zinc, copper, and other minerals [26]. There are currently 1531 mining projects (884 more than in 2010), of which 1113 projects are in the exploration stage (where perforations are made to determine the available minerals), 63 are under the construction of the mine, 274 are in the production stage where the minerals are being extracted, and 81 have been postponed [27]. After exploitation, environmental regulations recommend closing and restoring the affected areas. However, the companies are not forced to elaborate an integrated plan of mining closure and restoration [27]. Most mining projects are open pit mining, which is conducted at large scale, generating pollution of rivers and aquifers with heavy metals, large quantities of polluting debris, acid drainage, continuous emissions of gases and dust into the atmosphere, and the local removal of all plant and animal species [28,29]. Mining activities are considered of public utility. They are prioritized over any other use or activity in the territory and can be conducted regardless of the regime of land tenure, such as territories of indigenous people, urban areas, and private and social property [29]. There are currently more than 24,000 terrestrial active mining concessions covering over 20 million ha, and 14 marine concessions covering approximately 740 marine ha [30,31,32]. A total of 85% of mining activities are located in areas with vegetation cover holding ecological integrity [33,34]. Furthermore, the legislation does not restrict the possibility of establishing mining activities in most categories of protected areas [29], which has resulted in 73 mining projects covering more than 2 million ha inside protected areas and Ramsar sites; while 60,000 ha are located inside the core zones of protected areas [31,35,36].
Academic and NGO organizations assessing species extinction risk at a global level (IUCN) and at a national level (Mexican governmental ecological regulations) consider habitat loss and habitat fragmentation as the main variables to assign species extinction risk; the higher the proportion of habitat loss in their distributions, the higher the category assigned for species extinction risk [37]. However, other potential factors affecting the conservation status of species, such as mining activities, are largely underestimated. In this study, we (1) analyzed the combined impact of habitat loss and mining activities on potential species distributions of Mexican endemic amphibian and reptile species, and (2) determined the modifications and area needed to conserve a minimum proportion (20%) of the extant distribution of these species.

2. Materials and Methods

2.1. Point Occurrence Data

The study included Mexican endemic species of amphibians and reptiles. We compiled point occurrence data for 275 species of amphibians and 474 species of reptiles from the Global Biodiversity Information Facility website (GBIF; https://www.gbif.org/; accessed on 25 January 2018). We excluded (1) all point occurrence data prior to 1970; (2) points that had a resolution lower than 2 decimals of degree or no geographic coordinates (decimal latitud = 0, empty, 99, −99); (3) fossil records; (4) alive specimens (from zoos); (5) data obtained from iNaturalist (www.iNaturalist.com.mx), since those records do not have collected and verifiable specimens, and (6) records that were found within the same pixel of the bioclimatic variables from the WorldClim, used for constructing the models (see below; 1km2). In ArcMap, we eliminated all points that did not coincide with the currently recognized distribution of the species. Once the databases were refined, we included only the species with a minimum of 10 records. The minimum number of 10 records per species was defined based on published information for an adequate species distribution modeling approach in Maxent [38].

2.2. Potential Species Distributions

For each species, the polygons of the Mexican terrestrial ecoregions, including occurrence points, were selected, leaving a 50 km buffer zone surrounding them to be used as the modeling area (M region) [39,40]. The environmental variables used to construct potential species distributions were nineteen bioclimatic variables (~1 km2) from the WorldClim database (https://www.worldclim.org/; accessed on 31 January 2018) [41]. Variables with a correlation r > 0.7 were considered redundant and only one was included [42].
We generated the ecological niche models following the methodology described by Sánchez-Cordero [43]. Using the ENMeval library [44] in the R software [45], 10,000 background points were selected within the modeling area to parameterize the model, the block method was used to divide the presence data into training and testing groups [46], and 5 regularization multipliers and 13 feature classes were established to adjust the models. From a total of 65 models per species, the best model was selected based on the omission rate and the area under the curve (AUC), and projected into a discrete presence/absence map through a maximum sensitivity plus specificity threshold [47]. The area of each potential species distribution was obtained using the Consnet software package [16,48,49] by obtaining the number of cells occupied by each species and multiplying this number by 0.78, the size in km2 of the used rack cells.

2.3. Extant Species Distributions

From the potential species distribution models, we obtained two scenarios, as follows: (1) Extant species distributions due to habitat loss, and (2) extant species distributions due to habitat loss and mining activities. Habitat loss was estimated based on the land use and vegetation coverage map [33], which contains information on habitat transformation since 1968, and includes transformed areas into agricultural, rural, or urban settlements. For mining activities, we used the official mining concession map, which has information of all mining concessions since 1942 that are still active today [50]. Furthermore, we used the software package ConsNet on potential species distribution, extant species distribution due to habitat loss, and extant species distribution due to habitat loss and mining activities to analyze the area of occupancy of each species under each scenario.
Potential species distributions were compared with extant species distributions under each scenario and the percentage of the reduction in their distributions was obtained. We divided species in four groups according to percentage ranges of their distribution loss, as follows: (1) Species that lost <30% of their distribution; (2) species that lost between 30–50% of their distribution; (3) species that lost between 50–80% of their distribution, and (4) species that lost >80% of their distribution.

2.4. Selection of Priority Areas for Conservation

For each scenario of potential species distribution, extant species distributions due to habitat loss, and extant species distribution due to both habitat loss and mining activities, we obtained the selection of priority areas for conservation using the ConsNet software package, which allows the identification of conservation solutions by defining multiple previously set criteria [16,48,49]. ConsNet allows searching for the best solutions for different objectives according to the required conservation plan. For example, it can search for the minimum selected area and the best surrogate representation without considering any other restrictions, such as shape or connectivity. Similarly, a conservation solution can be searched for by considering, for example, the best representation, minimum area, connectivity, and/or shape configuration. The conservation target for all species was set to 20% of their distribution under the three scenarios, considering that all species are endemic and have limited distributions. We searched for the best representation with the minimum area and shape using the RF4 adjacency algorithm with a basic neighbor selection, and running 200,000 iterations to find the best solution. We obtained the total area (km2) of conservation, perimeter, number of clusters, shape, and total representation of the species on the conservation area network.

2.5. Statistical Analysis

Using the statistical package StatSoft STATISTICA [51], we analyzed the differences in the reduction of extant species distributions due to habitat loss and extant species distribution due to habitat loss and mining activities, respectively (Student’s t-test). We also performed two different one-way ANOVAs to determine differences between species of amphibians and reptiles under each scenario.

3. Results

Of a total of 749 endemic species of amphibians and reptiles, we produced robust potential species distributions for 62 species of amphibians and 117 species of reptiles. There were a total of 10,079 records, ranging from 10 as in Sceloporus zosteromus, Phyllodactylus unctus, Lithobates sierramadrensis, Craugastor pozo, and Incilius cavifrons, to 514 as in Sceloporus torquatus.

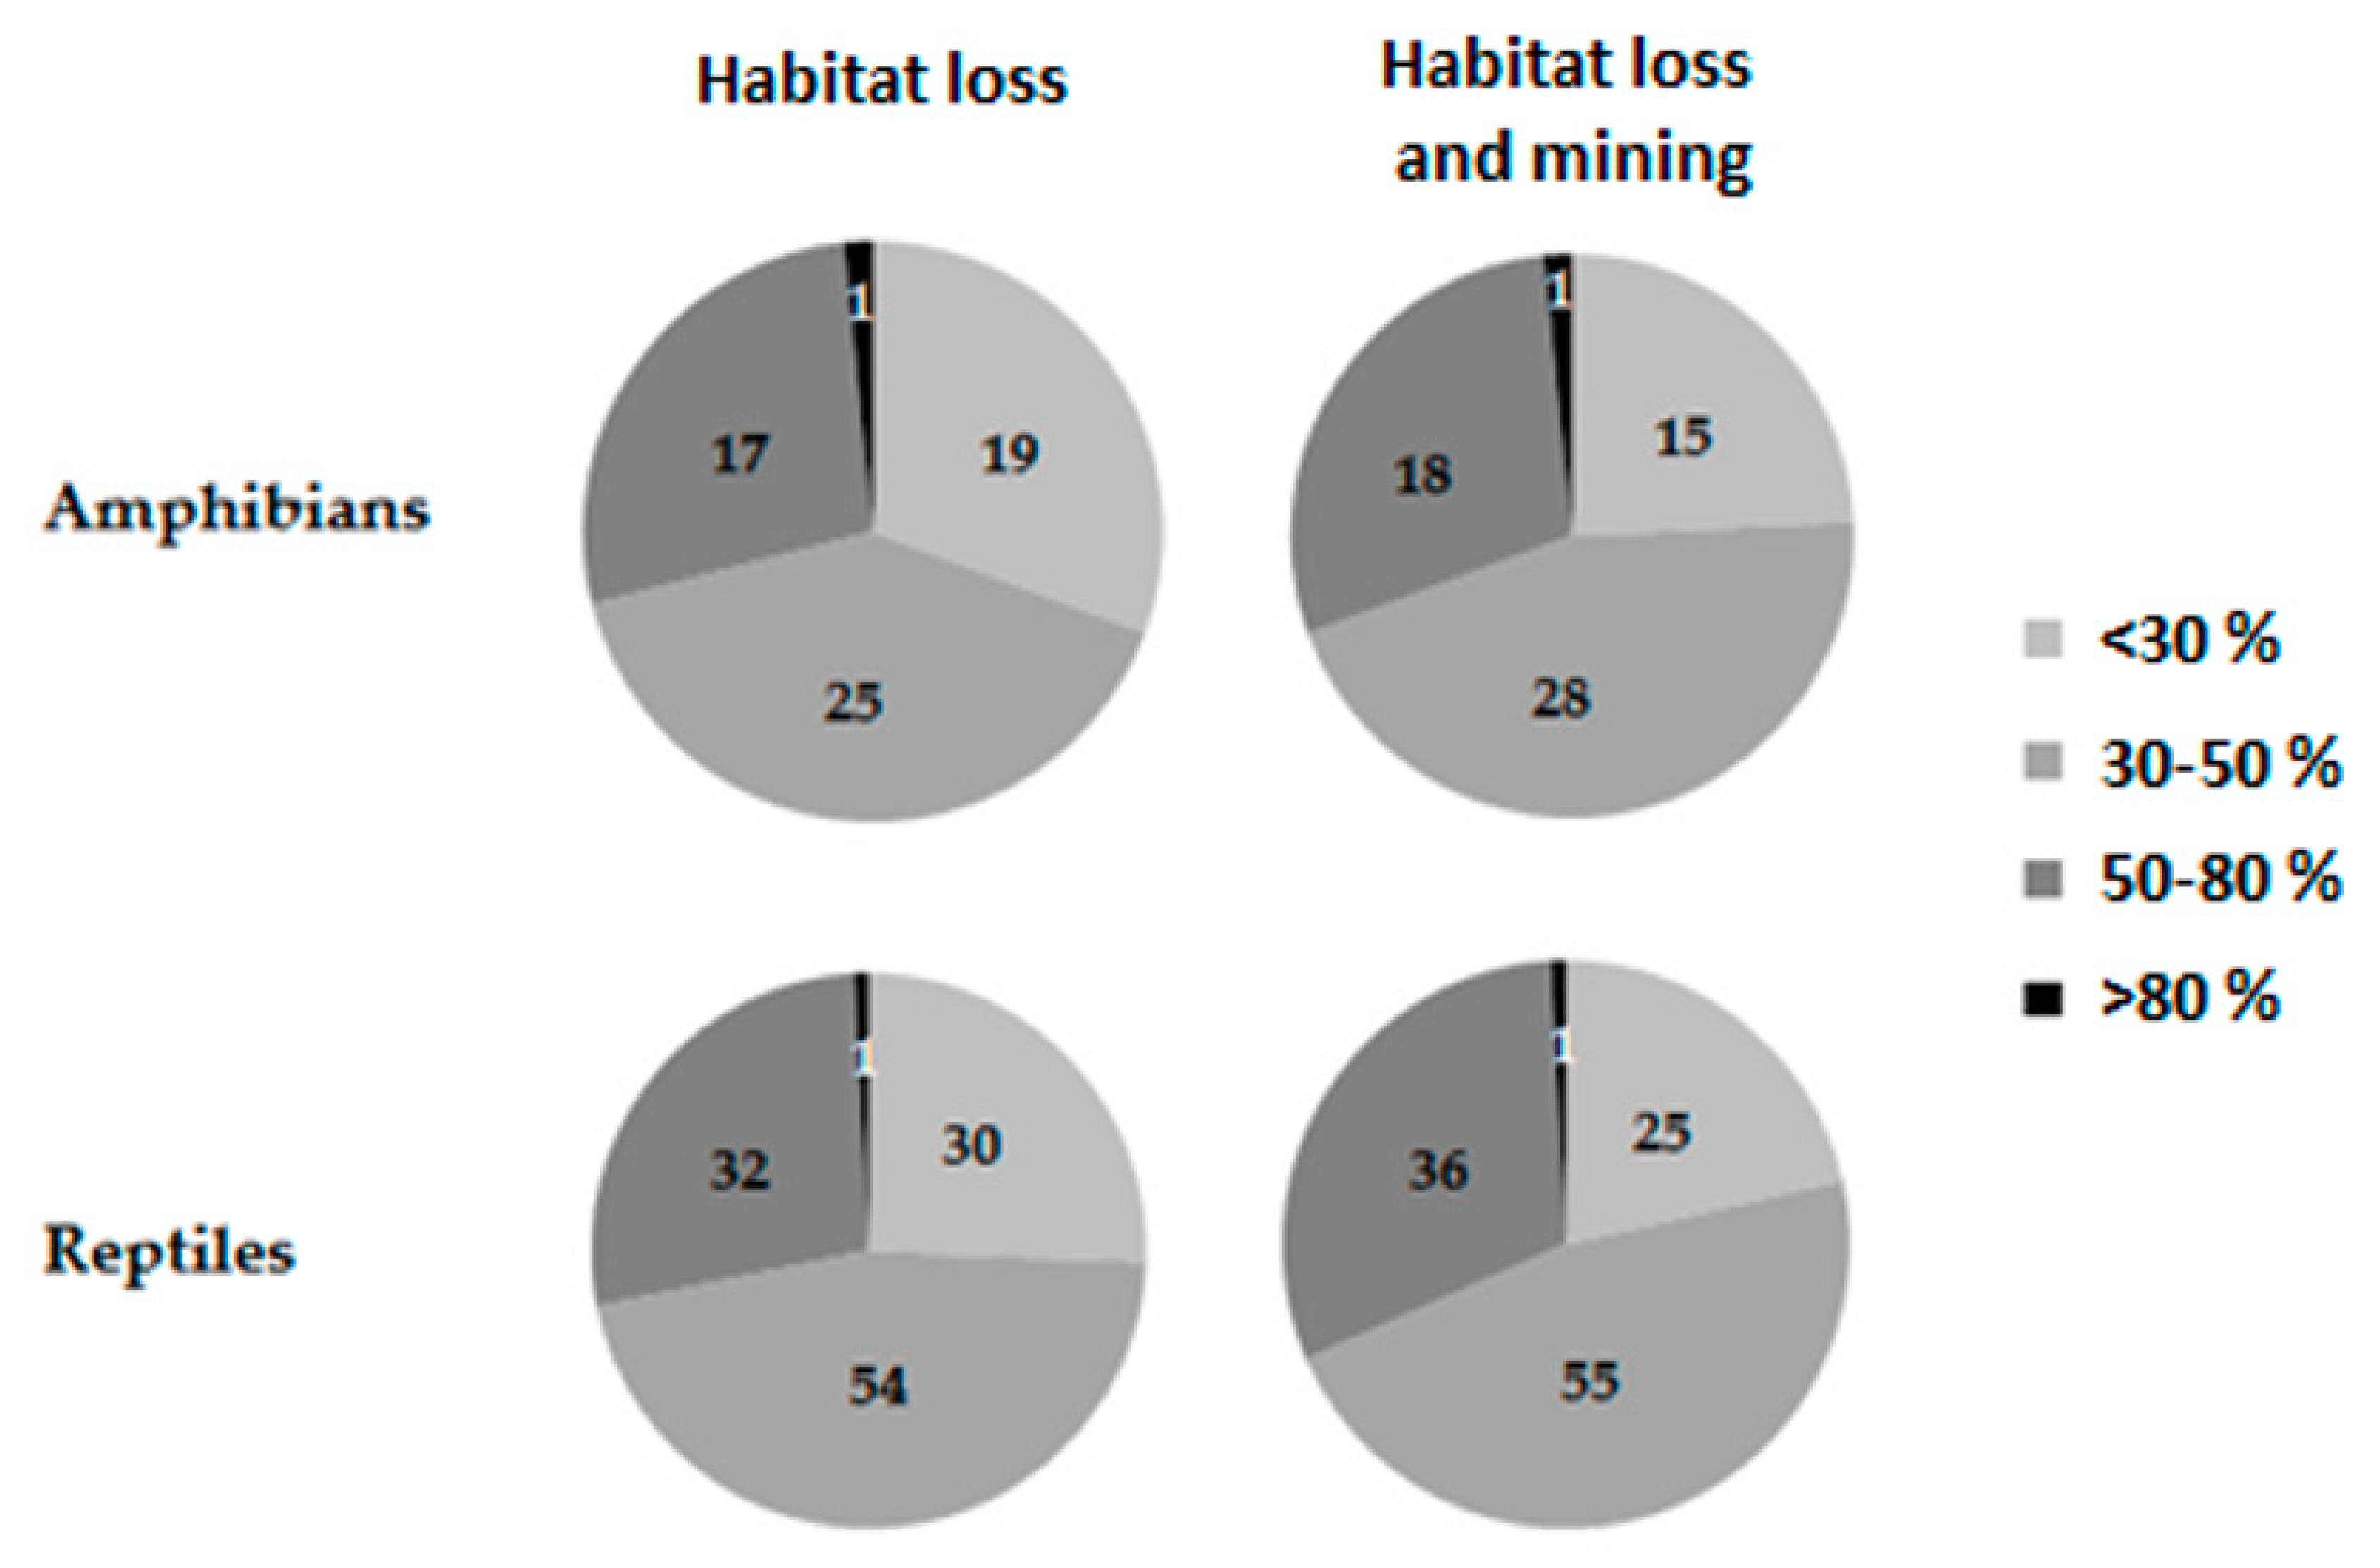
3.1. Extant Species Distributions

A total of 49 species showed a reduction of less than 30% of their potential distribution due to habitat loss. The remaining 130 species lost more than 30% of habitat, as follows: A total of 79 species lost between 30–50% of their distribution, 49 species lost between 50–80%, and 2 species lost more than 80% (Figure 1; Figure 2; Supplementary Material: Table S1). There was no significant difference in the impact of habitat loss on species of amphibians and reptiles (F = 0.203, df = 1, p = 0.65).
The combined impact of habitat loss and mining activities in extant species distribution was significantly higher (extant species distribution due to habitat loss: 40.56 ± 16.15; extant species distribution due to habitat loss and mining: 42.16 ± 15.67; t = −20.10, df = 178, p < 0.001), but it did not differ between species of amphibians and reptiles (F = 0.341, df = 1, p = 0.56). Of the 179 endemic species of amphibians and reptiles, only 40 species lost less than 30% of their distribution, while 83 species lost between 30–50%, 54 species lost between 50–80%, and two species lost more than 80% of their distribution (Figure 1; Table S1). The contribution of mining activities increased the percentage of distribution loss of all species, and resulted in nine species increasing from a loss <30% to a loss between 30–50%, and five species increased from a loss between 30–50% to a loss between 50–80% of their distribution (Figure 1; Table S1).

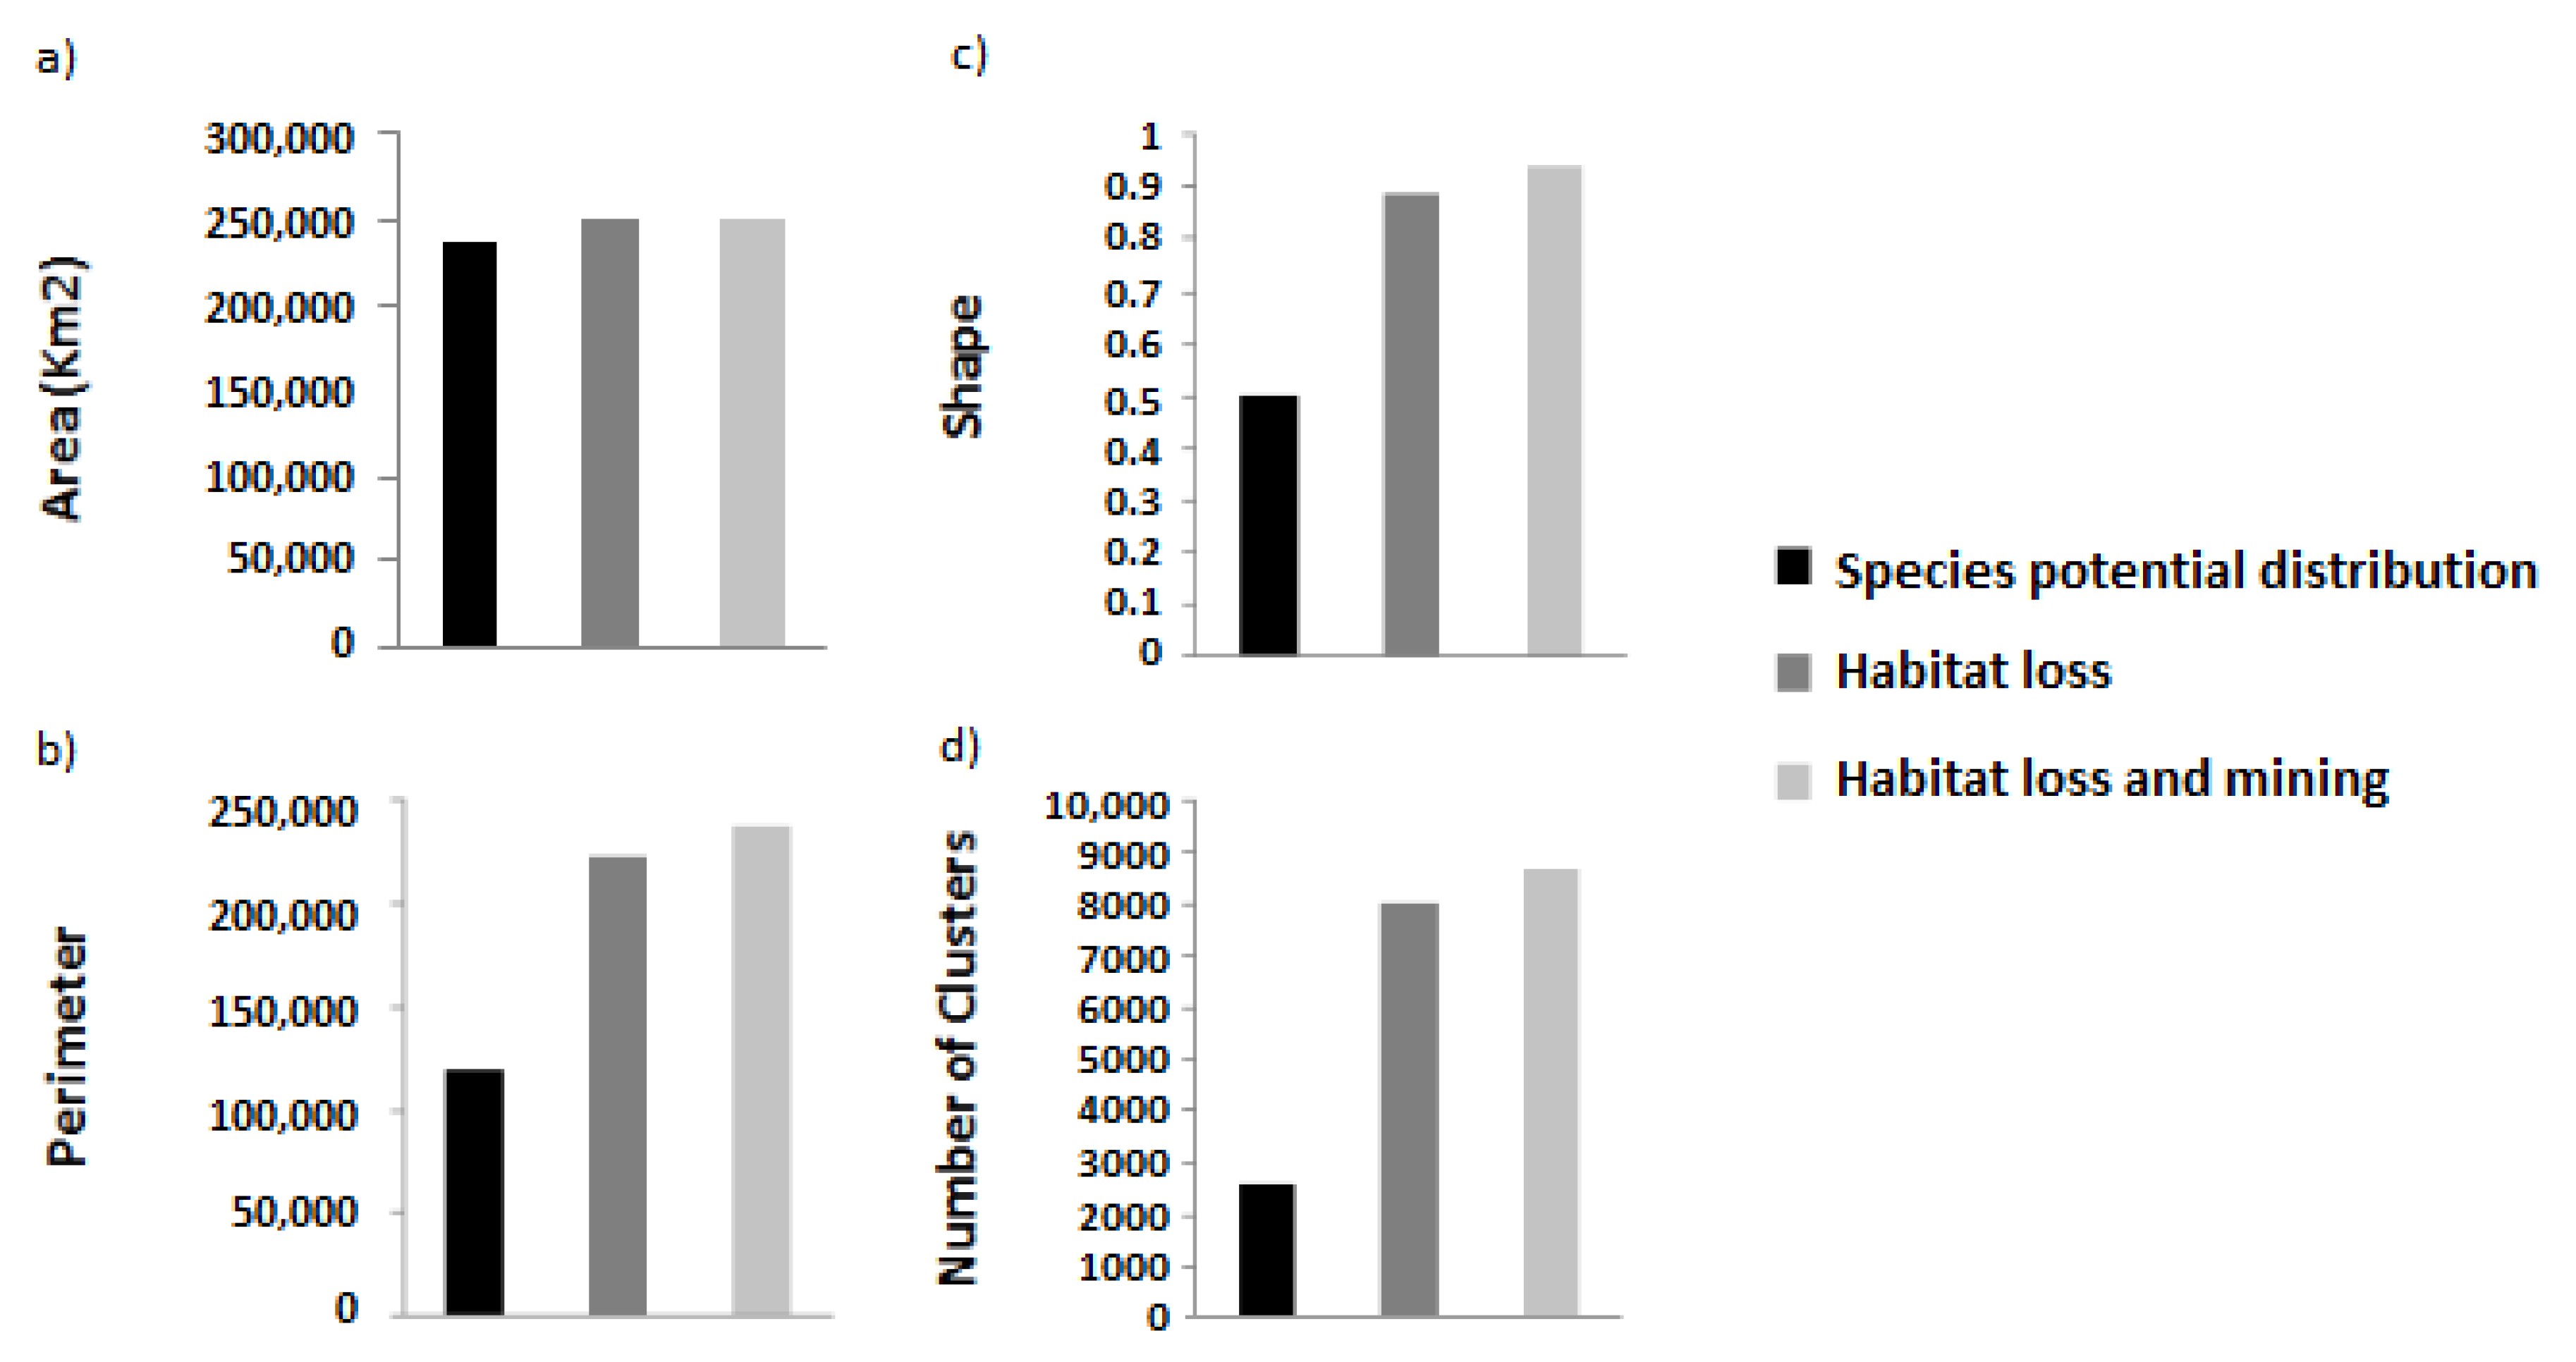
3.2. Conservation Area Network under Three Scenarios

Under the scenario of potential species distribution, the conservation area network representing 20% of species distributions, resulted in a total of 237,195 km2 contained in 2624 clusters, with a perimeter of 222,715.21 km, and a shape of 0.50 (perimeter/area). Under the scenario of extant species distribution due to habitat loss in a total of 250,563 km2 contained in 8010 clusters, a perimeter of 222,715.21 km and a shape of 0.88 resulted. Under the scenario of extant species distribution due to habitat loss and mining activities in a total of 251,678.80 km2, a perimeter of 237,148.20 km, 8706 clusters and a shape of 0.94 resulted (Figure 3).

4. Discussion

Habitat loss has been identified as a major factor negatively affecting biodiversity and threatening species conservation worldwide [13,14,15], but there is a need to study the impact of other large-scale factors such as mining. Here, we based our analyses assuming that habitat loss and habitat fragmentation affects the conservation status of the endemic species of amphibians and reptiles included in this study. We argue that it is more convenient for conservation purposes to impose a higher risk for a species due to habitat loss (even if this does not harm a species), than to leave the species under the same risk category under the assumption that habitat loss does not harm that species [19,52,53]. This argument is particularly important for endemic species showing small ranges of distribution.
Our results show that the combined negative impact of habitat loss and mining activities increased the loss of distribution of all species of amphibians and reptiles. For example, when considering only habitat loss, 49 species out of 179 species of amphibians and reptiles retained enough remnant natural habitat in their distribution, but 130 species lost more than 30% of their distributions, which could increase their vulnerability. When we added the combined impact of habitat loss and mining, all species distributions were reduced. Only 40 species showed less than 30% of habitat loss in their distributions, while 83 lost more than 30% of their distribution, 54 lost more than half of their potential distribution, and two species are in a critical situation where they only have less than 20% of their distribution remaining (Figure 1; Table S1).
Mining activities have become a relevant threat and could be causing species to increase their extinction risk. Of the 179 species included in our study, only 50 species (35 amphibians and 15 reptiles) are currently included in the IUCN red list of endangered species [4]. However, we believe that if other factors such as mining were systematically included into the assessment of species extinction risk, more species of amphibians and reptiles should be included in an extinction risk category. Furthermore, of the 179 species included in our study, 10 species have not been assessed by the IUCN or are under the data deficient (DD) category. When all of the species occurring in Mexico are considered, the number increases to over 38 amphibians (10% of all species in Mexico) in the DD category [19] and 307 reptiles (36.2% of all species in Mexico) in the DD or not evaluated (NE) categories [54]. Moreover, IUCN does not consider species of amphibians extinct in the wild, but some reports suggest that at least 35 species are possibly extinct, and IUCN categorizes them as DD, EN, or CR [55,56]. Clearly, more efforts are needed to improve the assessment of species of amphibians and reptiles given that many species have not been assigned with a proper risk category.
Our study only analyzed the impact of mining over species distributions, but other factors caused by mining activities, such as pollution of rivers and aquifers, polluting debris, acid drainage, gas and dust emissions, and local removal of all vegetation [28], could increase the impact of mining over species and further increase species extinction risks. It has been recently reported that 84 of the 632 highly contaminated sites in Mexico are caused by mining activities, of which 11 are found inside protected areas [57]. Therefore, further studies should focus on obtaining an integrated scenario of the impact of mining activities on biodiversity conservation. In Mexico, more than 20 million ha have concessions to carry out mining activities, and this area could double by the end of 2019 [29]. There is an increasing concern that current law regulations consider mining activities as a priority, to the point that they can even be established inside protected areas. In order to adequately conserve biodiversity and meet the international conservation commitments to conserve 17% of the territory and not to allow mining activities inside protected areas, the Mexican government must urgently change sections of the environmental legislation.
Besides reducing species range size, habitat fragmentation has other implications on species conservation status. The configuration of the conservation area network solution ranked worst when including the combined impact of habitat loss and mining activities by increasing its area, perimeter, number of habitat fragments, and shape, with expected negative consequences for endemic and micro endemic species with dispersal limitations [58]. This increases risks of local population extirpation, and a decreasing genetic diversity of species [59]. Other factors, such as climate change, have also been considered to have a negative impact on species of amphibians and reptiles. It has been proposed that climate change will significantly increase the extinction risks in the short term. For example, it has been reported that an average reduction of about 64% in the current geographical range of endemic amphibians could be expected by the year 2080, with 50% of the species losing more than 60% of their distributions [60].
Protected areas are keystone initiatives to conserve biodiversity worldwide [61,62]. Thus, their adequate management, to ensure their long-term viability and to support the strategic development of conservation area networks, is essential [63,64]. Worldwide, these areas have helped to protect more than 2000 million ha [65] and in Mexico they protect around 25 million ha, representing more than 12% of the Mexican territory [66]. However, protected areas do not appear to adequately represent most biodiversity in Mexico, as shown by some studies using well-studied faunistic groups [16,63,67], and some biodiversity hotspots remain unprotected [67]. The population decline of species of amphibians and reptiles has been well documented, but these groups are not often taken into account when establishing conservation objectives [68,69]. Only 31% of the amphibians (29% of endemics) and 76% of the reptiles (46% of endemics) living in Mexico occur inside protected areas [70]. Furthermore, biodiversity representation in protected areas will be inadequate under current and climate change scenarios [71,72,73]. Our study provides baseline information suggesting that, as a result of the combined impact of habitat loss and mining activities, species of amphibians and reptiles are in greater danger of extinction than previously known and these factors should be included in more integrated criteria for adequately assigning species conservation status.

Supplementary Materials

The following are available online at https://0-www-mdpi-com.brum.beds.ac.uk/1424-2818/11/11/210/s1, Table S1: Percentage of distribution lost caused by the impact of habitat loss and habitat loss and mining activities for the Mexican endemic species of amphibians and reptiles.

Author Contributions

Conceptualization, F.M.-P. and F.B. methodology, S.C. and F.M.-P.; data analyses, S.C. and F.M.-P.; discussion and writing, F.M.-P., F.B., and V.S.-C.

Funding

F. Mayani-Parás was supported by a scholarship (Posgrado en Ciencias Biológicas of Universidad Nacional Autónoma de México and CONACyT (CVU 853134). This research was funded by the Instituto de Biología, Universidad Nacional Autónoma de México.

Acknowledgments

We thank the suggestions made by three reviewers that improved the quality of this manuscript.

Conflicts of Interest

The authors declare no conflict of interest.

References

  1. SEMARNAT. Informe de la Situación del Medio Ambiente en México. Compendio de Estadísticas Ambientales. Indicadores Clave, de Desempeño Ambiental y de Crecimiento Verde; Edición 2015; Semarnat: Mexico City, México, 2016.
  2. Flores-Villela, O.; García-Vázquez, U.O. Biodiversidad de Reptiles en México. Rev. Mex. Biodivers. 2014, 85, 31. [Google Scholar] [CrossRef]
  3. Olea, G.P.; Flores-Villela, O.; Almeralla, C.M. Biodiversidad de Anfibios en México. Rev. Mex. Biodivers. 2014, 85, 33. [Google Scholar]
  4. IUCN. IUCN Red List of Threatened Species 2006; International Union for the Conservation of Nature (IUCN): Gland, Switzerland, 2006. [Google Scholar]
  5. Stuart, S.N.; Chanson, J.S.; Cox, N.A.; Young, B.E.; Rodrigues, A.S.L.; Fischman, D.L.; Waller, R.W. Status and Trends of Amphibian Declines and Extinctions Worldwide. Science 2004, 306, 1783–1786. [Google Scholar] [CrossRef] [Green Version]
  6. Beebee, T.J.C.; Griffiths, R.A. The Amphibian Decline Crisis: A Watershed for Conservation Biology? Biol. Conserv. 2005, 125, 271–285. [Google Scholar] [CrossRef]
  7. Baillie, J.E.M.; Hilton-Taylor, C.; Stuart, S.N. 2004 IUCN Red List of Threatened Species. A Global Species Assessment; IUCN: Gland, Switzerland; Cambridge, UK, 2004. [Google Scholar]
  8. Gibbons, J.W.; Scott, D.E.; Ryan, T.J.; Buhlmann, K.A.; Tuberville, T.D.; Metts, B.S.; Greene, J.L.; Mills, T.; Leiden, Y.; Poppy, S.; et al. The Global Decline of Reptiles, Déjà Vu Amphibians: Reptile Species are Declining on a Global Scale. Six Significant Threats to Reptile Populations are Habitat Loss and Degradation, Introduced Invasive Species, Environmental Pollution, Disease, Unsustainable Use, and Global Climate Change. Bioscience 2000, 50, 653–667. [Google Scholar] [CrossRef]
  9. Broomhall, S.D.; Osborne, W.S.; Cunningham, R.B. Comparative Effects of Ambient Ultraviolet-B Radiation on Two Sympatric Species of Australian Frogs. Conserv. Biol. 2000, 14, 420–427. [Google Scholar] [CrossRef]
  10. Kiesecker, J.M.; Blaustein, A.R.; Belden, L.K. Complex Causes of Amphibian Population Declines. Nature 2001, 410, 681–684. [Google Scholar] [CrossRef]
  11. Hecnar, S.J. Acute and Chronic Toxicity of Ammonium Nitrate Fertilizer to Amphibians from Southern Ontario. Environ. Toxicol. Chem. Int. J. 1995, 14, 2131–2137. [Google Scholar] [CrossRef]
  12. Davidson, C.; Shaffer, H.B.; Jennings, M.R. Declines of the California Red-Legged Frog: Climate, UV-B, Habitat, and Pesticides Hypotheses. Ecol. Appl. 2001, 11, 464–479. [Google Scholar] [CrossRef]
  13. Gardner, T.A.; Barlow, J.; Peres, C.A. Paradox, Presumption and Pitfalls in Conservation Biology: The Importance of Habitat Change for Amphibians and Reptiles. Biol. Conserv. 2007, 138, 166–179. [Google Scholar] [CrossRef]
  14. Becker, C.G.; Fonseca, C.R.; Baptista-Haddad, C.F.; Fernándes-Batista, R.; Prado, P.I. Habitat Split and the Global Decline of Amphibians. Nature 2007, 318, 1775–1777. [Google Scholar] [CrossRef] [Green Version]
  15. Sarukhán, J.; Koleff, P.; Carabias, J.; Soberón, J.; Dirzo, R.; Llorente-Bousquets, J.; Halffter, G.; González, R.; March, I.; Mohar, A.; et al. Capital Natural de México. Síntesis: Conocimiento Actual, Evaluación y Perspectivas de Sustentabilidad; Comisión Nacional Para el Conocimiento y Uso de la Biodiversidad: Mexico City, México, 2009. [Google Scholar]
  16. Botello, F.; Sánchez-Cordero, V.; Ortega-Huerta, M.A. Disponibilidad de Hábitats Adecuados Para Especies de Mamíferos a Escalas Regional (Estado de Guerrero) y Nacional (México). Rev. Mex. Biodivers. 2015, 86, 226–237. [Google Scholar] [CrossRef]
  17. Ochoa-Ochoa, L.M.; Rodríguez, P.; Mora, F.; Flores-Villela, O.; Whittaker, R.J. Climate Change and Amphibian Diversity Patterns in Mexico. Biol. Conserv. 2012, 150, 94–102. [Google Scholar] [CrossRef]
  18. Young, B.E.; Stuart, S.N.; Chanson, J.S.; Cox, N.A.; Boucher, T.M. Disappearing Jewels: The Status of New World Amphibians. Appl. Herpetol. 2005, 2, 429–435. [Google Scholar]
  19. Frías-Alvarez, P.; Zúniga-Vega, J.J.; Flores-Villela, O. A General Assessment of the Conservation Status and Decline Trends of Mexican Amphibians. Biodivers. Conserv. 2010, 19, 3699–3742. [Google Scholar] [CrossRef]
  20. Rovito, S.M.; Parra-Olea, G.; Vásquez-Almazán, C.R.; Papenfuss, T.J.; Wake, D.B. Dramatic Declines in Neotropical Salamander Populations are an Important Part of the Global Amphibians Crisis. Proc. Natl. Acad. Sci. USA 2009, 106, 3231–3236. [Google Scholar] [CrossRef]
  21. Lovich, R.E.; Grismer, L.L.; Danemann, G. Conservation Status of the Herpetofauna of Baja California, México and Associated Islands in the Sea of Cortez and Pacific Ocean. Herpetol. Conserv. Biol. 2009, 4, 358–378. [Google Scholar]
  22. Sigala-Rodríguez, J.J.; Greene, H.W. Landscape Change and Conservation Priorities: Mexican Herpetofaunal Perspectives at Local and Regional Scales. Rev. Mex. Biodivers. 2009, 80, 231–240. [Google Scholar]
  23. Botts, E.A.; Erasmus, B.F.; Alexander, G.J. Small Range Size and Narrow Niche Breadth Predict Range Contractions in South African Frogs. Glob. Ecol. Biogeogr. 2013, 22, 567–576. [Google Scholar] [CrossRef]
  24. Flores-Villela, O. Análisis de la Distribución de la Herpetofauna de México. Ph.D. Thesis, Facultad de Ciencias, UNAM, Mexico City, México, 1991. [Google Scholar]
  25. Ochoa-Ochoa, L.M.; Flores-Villela, O. Áreas de Diversidad y Endemismo de la Herpetofauna Mexicana. Report; UNAM CONABIO: Mexico City, México, 2006. [Google Scholar]
  26. INEGI. La Minería en México 2014; INEGI: Mexico City, Mexico, 2014.
  27. Fundar, Centro de Análisis e Investigación, A.C. Anuario 2018. Las Actividades Extractivas en México: Desafíos Para la 4T; Fundar, Centro de Análisis e Investigación, A.C.: Mexico City, Mexico, 2018. [Google Scholar]
  28. Armendáriz-Villegas, E.J. Áreas Naturales Protegidas y Minería en México: Perspectivas y Recomendaciones; CIBNOR: Mexico City, Mexico, 2016. [Google Scholar]
  29. Fundar, Centro de Análisis e Investigación, A.C. Anuario 2017. Las Actividades en México: Minería e Hidrocarburos Hacia el fin del Sexenio; Fundar, Centro de Análisis e Investigación, A.C.: Mexico City, Mexico, 2018. [Google Scholar]
  30. Secretaría de Economía. Cartografía de Concesiones Mineras en el Territorio Nacional; Secretaría de Economía: Mexico City, Mexico, 2016.
  31. Secretaría de Economía. Cartografía de Concesiones Mineras en el Territorio Nacional; Secretaría de Economía: Mexico City, Mexico, 2017.
  32. INEGI. Marco Geoestadístico Nacional 2016; INEGI: Mexico City, Mexico, 2016.
  33. INEGI. 2014 Carta de Uso del Suelo y Vegetación Serie VI, Escala 1:250,000; INEGI: Mexico City, México, 2017.
  34. Equihua, M. Integridad Ecosistémica 2013; Conabio; Conafor: Mexico City, México, 2016.
  35. Comisión Nacional de Áreas Naturales Protegidas (Conanp). Zonificación Primaria; Conanp: Mexico City, México, 2017. [Google Scholar]
  36. Bezaury-Creel, J.E.; Torres-Origel, J.F.; Ochoa-Ochoa, L.M.; Castro-Campos, M.; Moreno-Díaz, N.; Llano, M.; Flores, C. Áreas Naturales Protegidas Estatales, del Distrito Federal, Municipales y Áreas de Valor Ambiental en México [Base de Datos Geográfica]; The Nature Conservancy/Comisión Nacional para el Conocimiento y Uso de la Biodiversidad: Mexico City, México, 2017. [Google Scholar]
  37. IUCN. IUCN Red List Categories and Criteria: Version 3.1, 2nd ed.; IUCN: Gland, Switzerland; Cambridge, UK, 2012. [Google Scholar]
  38. Wisz, M.S.; Hijmans, R.J.; Li, J.; Peterson, A.T.; Graham, C.H.; Guisan, A. NCEAS Predicting Species Distributions Working Group. Effects of Sample Size on the Performance of Species Distribution Models. Divers. Distrib. 2008, 14, 763–773. [Google Scholar] [CrossRef]
  39. Soberón, J.; Peterson, A.T. Interpretation of Models of Fundamental Ecological Niches and Species’ Distributional Areas. Biodivers. Inform. 2005, 2, 1–10. [Google Scholar] [CrossRef]
  40. Barve, N.; Barve, V.; Jiménez-Valverde, A.; Lira-Noriega, A.; Maher, S.P.; Peterson, A.T.; Soberón, J.; Villalobos, F. The Crucial Role of the Accessible Area in Ecological Niche Modeling and Species Distribution Modeling. Ecol. Model. 2011, 222, 1810–1819. [Google Scholar] [CrossRef]
  41. Hijmans, R.J.; Cameron, S.E.; Parra, J.L.; Jones, P.G.; Jarvis, A. Very High Resolution Interpolated Climate Surfaces for Global Land Areas. Int. J. Climatol. 2005, 25, 1965–1978. [Google Scholar] [CrossRef]
  42. Venette, R.C. Climate Analyses to Assess Risks from Invasive Forest Insects: Simple Matching to Advanced Models. Curr. For. Rep. 2017, 3, 255–268. [Google Scholar] [CrossRef]
  43. Sánchez-Cordero, V. Propuesta Metodológica Para Evaluar la Vulnerabilidad Actual y Futura Ante el Cambio Climático de la Biodiversidad en México: El Caso de las Especies Endémicas, Prioritarias y en Riesgo de Extinción; Instituto Nacional de Ecología y Cambio Climático: Mexico City, México, 2017. [Google Scholar]
  44. Muscarella, R.; Galante, P.J.; Soley-Guardia, M.; Boria, R.A.; Kass, J.M.; Uriarte, M.; Anderson, R.P. ENMeval: An R Package for Conducting Spatially Independent Evaluations and Estimating Optimal Model Complexity for Maxent Ecological Niche Models. Methods Ecol. Evol. 2014, 5, 1198–1205. [Google Scholar] [CrossRef]
  45. R Core Team. R: A Language and Environment for Statistical Computing; R Foundation for Statistical Computing: Vienna, Austria, 2014. [Google Scholar]
  46. Hijmans, R.J. Cross-Validation of Species Distribution Models: Removing Spatial Sorting Bias and Calibration with a Null Model. Ecology 2012, 93, 679–688. [Google Scholar] [CrossRef]
  47. Liu, C.; Berry, P.M.; Dawson, T.P.; Pearson, R.G. Selecting Thresholds of Occurrence in the Prediction of Species Distributions. Ecography 2005, 28, 385–393. [Google Scholar] [CrossRef]
  48. Ciarleglio, M.; Barnes, J.W.; Sarkar, S. ConsNet: New Software for the Selection of Conservation Area Networks with Spatial and Multi-Criteria Analyses. Ecography 2009, 32, 205–209. [Google Scholar] [CrossRef]
  49. Ciarleglio, M.; Barnes, J.W.; Sarkar, S. ConsNet-A Tabu Search Approach to the Spatially Coherent Conservation Area Network Design Problem. J. Heuristics 2010, 16, 537–557. [Google Scholar] [CrossRef]
  50. Secretaría de Economía, Gobierno de México. Available online: https://datos.gob.mx/busca/dataset/cartografia-minera-de-se (accessed on 1 June 2019).
  51. StatSoft STATISTICA. Data Analysis Software System, version 8.0; StatSoft, Inc.: Tulsa, OK, USA, 2007; Available online: http://www.statsoft.com (accessed on 20 June 2019).
  52. Sánchez-Cordero, V.; Illoldi-Rangel, P.; Linaje, M.; Sahotra, S.; Peterson, A.T. Deforestation and Extant Distributions of Mexican Endemic Mammals. Biol. Conserv. 2005, 126, 465–473. [Google Scholar] [CrossRef]
  53. Sánchez-Cordero, V.; Illoldi-Rangel, P.; Escalante, T.; Figueroa, F.; Rodríguez, G.; Linaje, M.; Fuller, T.; Sarkar, S. Deforestation and Biodiversity Conservation in Mexico. In Endangered Species: New Research; Columbus, A., Kuznetsov, L., Eds.; Nova Science Publishers: New Haven, CT, USA, 2009; pp. 279–297. [Google Scholar] [CrossRef]
  54. Wilson, L.D.; Mata-Silva, V.; Johnson, J.D. A Conservation Reassessment of the Reptiles of Mexico Based on the EVS Measure. Amphib. Reptile Conserv. 2013, 7, 1–47. [Google Scholar]
  55. Baena, M.L.; Halffter, G.; Lira-Noriega, A.; Soberón, J. Extinción de Especies. Conocimiento Actual de la Biodiversidad. In Capital Natural de México. Vol. 1; Soberón, J., Halffter, G., Llorente-Bousquets, J., Eds.; Comisión Nacional para el Conocimiento y Uso de la Biodiversidad: Distrito Federal, Mexico, 2008. [Google Scholar]
  56. Ochoa-Ochoa, L.; Urbina-Cardona, J.N.; Vázquez, L.B.; Flores-Villela, O.; Bezaury-Creel, J. The Effects of Governmental Protected Areas and Social Initiatives for Land Protection on the Conservation of Mexican Amphibians. PLoS ONE 2009, 4, e6878. [Google Scholar] [CrossRef] [PubMed]
  57. Secretaría de Medio Ambiente y Recursos Naturales (Semarnat). Sitios Contaminados; Semarnat: Mexico City, México, 2012.
  58. deMaynadier, P.G.; Hunter, M.L., Jr. Road Effects on Amphibian Movements in a Forested Landscape. Nat. Areas J. 2000, 20, 56–65. [Google Scholar]
  59. Reh, W.; Seitz, A. The Influence of Land Use on the Genetic Structure of Populations of the Common Frog (Rana Temporaria). Biol. Conserv. 1990, 54, 239–249. [Google Scholar] [CrossRef]
  60. García, A.; Ortega-Huerta, M.A.; Martinez-Meyer, E. Potential Distributional Changes and Conservation Priorities of Endemic Amphibians in Western Mexico as a Result of Climate Change. Environ. Conserv. 2014, 41, 1–12. [Google Scholar] [CrossRef]
  61. Chape, S.; Spalding, M.; Taylor, M.; Putney, A.; Ishwaran, N.; Thorsell, J.; Blasco, D.; Robertson, J.; Bridgewater, P.; Harrison, J.; et al. History, Definitions, Value and Global Perspective. In The World’s Protected Areas: Status, Values and Prospect in the 21st Century; Chape, S., Spalding, M., Jenkins, M., Eds.; University of California Press: Los Angeles, CA, USA, 2008. [Google Scholar]
  62. Gray, C.L.; Hill, S.L.; Newbold, T.; Hudson, L.N.; Börger, L.; Contu, S.; Scharlemann, J.P. Local Biodiversity is Higher Inside than Outside Terrestrial Protected Areas Worldwide. Nat. Commun. 2016, 7, 12306. [Google Scholar] [CrossRef]
  63. Margules, C.R.; Sarkar, S. Systematic Conservation Planning; Cambridge University Press: Cambridge, UK, 2007. [Google Scholar]
  64. Sarkar, S.; Dyer, J.S.; Margules, C.; Ciarleglio, M.; Kemp, N.; Wong, G.; Juhn, D.; Supriatna, J. Developing an Objectives Hierarchy for Multicriteria Decisions on Land Use Options, with a Case Study of Biodiversity Conservation and Forestry Production from Papua, Indonesia. Environ. Plan. B Urban Anal. City Sci. 2017, 44, 464–485. [Google Scholar] [CrossRef]
  65. UNEP; WCMC. State of the Wolrd´s Protected Areas 2007: Of Global Conservation Progress; UNEP-WCMC: Cambridge, UK, 2008. [Google Scholar]
  66. OCDE. OECD Environmental Data. Compendium 2008; Organisation for Economic Co-operation and Development: Paris, France, 2008. [Google Scholar]
  67. Comisión Nacional para el Conocimiento y Uso de la Biodiversidad (CONABIO). Capital Natural de México, vol II: Estado de Conservación y Tendencias de Cambio; Comisión Nacional para el Conocimiento y Uso de la Biodiversidad: Mexico City, Mexico, 2009.
  68. Pawar, S.; Koo, M.S.; Kelley, C.; Ahmed, M.F.; Chaudhuri, S.; Sarkar, S. Conservation Assessment and Prioritization of Areas in Northeast India: Priorities for Amphibians and Reptiles. Biol. Conserv. 2007, 136, 346–361. [Google Scholar] [CrossRef]
  69. Urbina-Cardona, J.N. Conservation of Neotropical Herpetofauna: Research Trends and Challenges. Trop. Conserv. Sci. 2008, 1, 359–375. [Google Scholar] [CrossRef]
  70. Santos-Barrera, G.; Pacheco, C.; Ceballos, G. La Conservación de los Anfibios y Reptiles de Mexico. Biodiversitas 2004, 57, 1–6. [Google Scholar]
  71. Ackerly, D.D.; Loarie, S.R.; Cornwell, W.K.; Weiss, S.B.; Hamilton, H.; Branciforte, R.; Kraft, N.J.B. The Geography of Climate Change: Implications for Conservation Biogeography. Divers. Distrib. 2010, 16, 476–487. [Google Scholar] [CrossRef]
  72. Alagador, D.; Cerdeira, J.O. Meeting Species Persistence Targets under Climate Change: A Spatially Explicit Conservation Planning Model. Divers. Distrib. 2017, 23, 703–713. [Google Scholar] [CrossRef]
  73. Monzón, J.; Moyer-Horner, L.; Baron-Palmar, M. Climate Change and Species Range Dynamics in Protected Areas. BioScience 2011, 11, 752–761. [Google Scholar] [CrossRef]
Figure 1. Number of Mexican endemic species of amphibians and reptiles in each group of percentage of distribution lost under each scenario.
Diversity 11 00210 g001
Figure 2. Distribution of Anaxyrus compactilis under three scenarios: (a) Potential species distribution; (b) extant species distribution due to habitat loss; and (c) extant species distribution due to habitat loss and mining activities.
Diversity 11 00210 g002
Figure 3. Area and configuration of the conservation area network (area, perimeter, shape, and number of clusters or fragments) including 20% of the 179 species potential distribution, species extant distribution due to habitat loss, and species extant distributions due to habitat loss and mining activities, respectively.
Diversity 11 00210 g003

