Article

A Multireference-Based Whole Genome Assembly for the Obligate Ant-Following Antbird, Rhegmatorhina melanosticta (Thamnophilidae)

by
Laís A. Coelho
1,2,*,
Lukas J. Musher
2,3 and
Joel Cracraft
2
1
Department of Ecology, Evolution and Environmental Biology, Columbia University, 10th floor Schermerhorn Building, 1200 Amsterdam Ave, New York, NY 10025, USA
2
Department of Ornithology, American Museum of Natural History, Central Park West at 79th Street, New York, NY 10024, USA
3
Richard Gilder Graduate School, American Museum of Natural History, Central Park West at 79th Street, New York, NY 10024, USA
*
Author to whom correspondence should be addressed.
Submission received: 12 July 2019 / Revised: 16 August 2019 / Accepted: 21 August 2019 / Published: 23 August 2019
(This article belongs to the Special Issue Genomic Analyses of Avian Evolution)

Abstract

:
Current generation high-throughput sequencing technology has facilitated the generation of more genomic-scale data than ever before, thus greatly improving our understanding of avian biology across a range of disciplines. Recent developments in linked-read sequencing (Chromium 10×) and reference-based whole-genome assembly offer an exciting prospect of more accessible chromosome-level genome sequencing in the near future. We sequenced and assembled a genome of the Hairy-crested Antbird (Rhegmatorhina melanosticta), which represents the first publicly available genome for any antbird (Thamnophilidae). Our objectives were to (1) assemble scaffolds to chromosome level based on multiple reference genomes, and report on differences relative to other genomes, (2) assess genome completeness and compare content to other related genomes, and (3) assess the suitability of linked-read sequencing technology for future studies in comparative phylogenomics and population genomics studies. Our R. melanosticta assembly was both highly contiguous (de novo scaffold N50 = 3.3 Mb, reference based N50 = 53.3 Mb) and relatively complete (contained close to 90% of evolutionarily conserved single-copy avian genes and known tetrapod ultraconserved elements). The high contiguity and completeness of this assembly enabled the genome to be successfully mapped to the chromosome level, which uncovered a consistent structural difference between R. melanosticta and other avian genomes. Our results are consistent with the observation that avian genomes are structurally conserved. Additionally, our results demonstrate the utility of linked-read sequencing for non-model genomics. Finally, we demonstrate the value of our R. melanosticta genome for future researchers by mapping reduced representation sequencing data, and by accurately reconstructing the phylogenetic relationships among a sample of thamnophilid species.

1. Introduction

Organismal biology has been revolutionized over the past decade by the ‘omics’ era, in which the rapid development of high-throughput sequencing technologies has enabled the acquisition of more genetic data than ever before, including for non-model organisms [1]. For example, collaborative endeavours to sequence thousands of bird (Bird10K project [2]) and other vertebrate genomes (Genome10K project [3]) across many countries and research groups have been launched in the past decade, and have produced promising results [4,5,6,7]. Thus, high-throughput sequencing has rapidly improved our ability to make robust inferences in various fields, including avian systematics [7,8,9], population genomics and phylogeography [10,11,12,13,14,15,16], biogeography [17,18], molecular evolution [19], and speciation [20]. There has been an especially rapid increase in the number of studies specifically using whole-genome sequencing (often combined with reduced representation approaches) to answer difficult ornithological questions [7,20,21,22,23]. Although the number of avian genomes available on GenBank has increased by more than tenfold over the past five years (from 11 [1] to 182 as of this writing) the total number is still relatively low; just under two percent of recognized avian species are represented compared with over 6% of mammals (see also Bird10K project [2]). Lower still is the number of available avian genomes that are assembled to the chromosome-level (only 18 on GenBank as of this writing, most of which were de novo assembled).
Current-generation (high-throughput) sequencing methods are improving the quality of genome assemblies by producing highly contiguous sequences that have traditionally been difficult due in part to the complications associated with assembling highly repetitive or heterozygous regions as well as centromeres [24,25,26]. Most publicly available non-model bird genomes are of relatively low contiguity, with more than half of the genomes containing tens or hundreds of thousands of relatively short contigs that are difficult to assemble into longer scaffolds. Additionally, many genomes have been of relatively poor quality, often missing thousands of GC rich genes, which are typically more difficult to sequence with short reads alone [25]. Improving contiguity of publicly available genomes is critical for improving inferences based on a range of biological methods, such as whole-genome resequencing, genotyping-by-sequencing, phylogenomics, historical demography [26], and determining architectural changes to the genome [27,28,29].
Chromosome level assemblies have typically been achieved by the combination of different genome sequencing and cytogenomics strategies, such as mate-paired and paired-end libraries, long-read sequencing, Hi-C sequencing, fluorescent in situ hybridization (FISH), and/or bacterial artificial chromosome (BAC) clones, which make the process very costly and labor-intensive [29,30,31,32,33]. The use of longread technology (e.g., Pacific Biosciences [29]) greatly increase the length of de novo assembled scaffolds and decreases gap content in genomes [34,35,36]. These methods have different advantages and pitfalls: PacBio can create long contigs with no gaps but with high sequencing error rates and cost [37]. In contrast, 10× Chromium linked-read sequencing has the advantage of reduced costs associated with high-throughput Illumina sequencing, but carries the limitations of short-reads in sequencing GC rich and high repeat density regions [37,38]. Recent developments in reference-based whole genome assembly methods assemble scaffolds to chromosomes based on available high-quality chromosome-level assemblies [39,40,41]. Reference-based chromosome assembly, in addition to long-read sequencing methods, create an exciting prospect of more accessible chromosome-level genome sequencing in the near future.
Among birds, few groups have been as important to understanding biotic diversification and macroevolutionary process than the New World suboscines (suborder Tyranni), which contain an enormous level of taxonomic, ecological, and functional diversity [17,18,42,43,44,45,46,47,48]. Within this group, the army ant-following clade, which includes multiple genera (Rhegmatorhina, Gymnopythis, Willisornis, Phaenostictus, Phlegopsis, and Pythis) has enamored researchers for decades and formed the foundation of many ecological, phylogeographic, biogeographic, and population genetic studies [47,49,50,51,52,53,54]. Such studies have been fundamental to developing and testing important evolutionary hypotheses, including for example, the hotly-debated history of Amazonian biogeography and diversification [49,52,55,56]. Additional genomic level data are necessary to help unravel how Amazonian history has affected avian demography and speciation. Despite the extensive interest in this group by many researchers, genomes are not publicly available for any of the six genera at present. In fact, only six suboscine genomes are currently available on NCBI GenBank (five species of Pipridae and one of Tyrannidae).
Here we present the first publicly available high contiguity genome for an army ant-following antbird (Tribe Pyithyini), the Hairy-crested Antbird (Rhegmatorhina melanosticta). In doing so, we report on genome contents and describe its potential for future use by other researchers. Our objectives are to (1) assemble scaffolds to chromosome level and report on structural differences from other genomes, (2) assess genome completeness and content relative to other published genomes, and (3) assess the suitability of linked-read sequencing assemblies in mapping reduced-representation markers that are broadly implemented in comparative phylogenomics and population genomics studies.

2. Methods

2.1. Genome Sequencing and De Novo Assembly

The study specimen was a wild caught adult female Reghmatorhina melanosticta from San Martin, Peru (Museum of Southwestern Biology voucher MSB:Birds:36483; http://arctos.database.museum/guid/MSB:Bird:36483). Muscle, heart and liver samples were frozen in liquid nitrogen and stored at −80 °C. Muscle tissue was transported to the sequencing facilities on dry ice for preservation of DNA quality. DNA extraction, linked-read library preparation and sequencing were carried out at the HudsonAlpha Genome Sequencing Center facilities (Huntsville, Alabama; https://hudsonalpha.org/sequencing/). High molecular weight DNA was extracted with Qiagen’s MagAttract Kit (Qiagen, Valencia, California). Fragment lengths were verified to be over the minimum ideal length for linked-read sequencing libraries (>50 Kb) with pulsed field gel analysis. The library for the 10× Chromium platform sequencing implements bead-in-emulsion barcoding to add location-barcodes to fragments that originated from a single long DNA molecule [57]. This barcode is then used to re-assemble the short reads into pseudo long-reads post sequencing [57]. The paired-end library was sequenced with the HiSeq X Illumina platform, with sequence read length of 150 bp and average insert size of 350 bp.
We implemented the Chromium Genome Software Suite package for raw read processing, scaffold level genome assembly and structural variant mapping. Raw reads processing and de novo genome assembly were done with the software Supernova version 2.1 [58,59], which includes adapter trimming within its pipeline. The raw reads were demultiplexed and assembled to scaffolds with default settings of the mkfastq and run functions, respectively. We ran Supernova version 2.1 assembler on 40 threads and 1Tb RAM on the Sackler Institute for Comparative Genomics private server at the American Museum of Natural History for three days. The final genome sequences were generated with the mkoutput function under the “pseudohap2” style [36]. The “pseudohap2” option generates two parallel fasta files corresponding to the paternal and maternal haplotypes of the sequence. This option flattens bubbles in variant regions by randomly selecting an allele and assigning it to one of the two haplotypes, resulting in two final genome sequences composed of scaffolds with mixed occurrence of paternal and maternal haplotypes.
We used the Longranger software version 2.2.2 to map and phase structural variants in the R. melanosticta genome [59]. Longranger implements the linked-read barcode information to enhance the performance of external variant calling software by mapping the 10× raw reads to a reference genome. Longranger performs optimally when using references with a reduced number of scaffolds (preferably under 1000 scaffolds). We mapped single nucleotide polymorphisms (SNPs) and variants only to scaffolds over 150 Kb. This length was chosen after an exploratory analysis showed a good trade-off; optimally reducing the number of scaffolds in the reference genome without losing a significant amount of sequence. The 150 Kb cutoff reduced the number of scaffolds by 13%, while only reducing the total genome length by one percent (96 excluded scaffolds with a total of 11.7 Mb). We mapped variants by running the wgs function of Longranger with the Genome Analysis ToolKit (GATK) [60] as the variant caller, and used the 619 scaffolds of the de novo assembled genome from the previous step as reference. Longranger filters variants that have VCF standard phred-scaled quality score lower than 15 (QUAL < 15) or 50 (QUAL < 50) if they are heterozygous or homozygous, respectively. Heterozygous sites with allele fraction under 15% are also excluded.

2.2. Single Reference Assisted Chromosome Level Assembly

We first assembled the R. melanosticta scaffolds to chromosomes using the software Chromosomer [40]. This method generates draft chromosome level assemblies based on a BLAST alignment [61] between the reference genome and target genome scaffolds [39]. The algorithm considers a scaffold to be anchored to a specific position on the reference genome if the ratio between the first and second highest alignment score is higher than a predefined ratio threshold (default is 1.2). If the ratio is lower than the threshold, the scaffold is not mapped; it is listed as unplaced (on a given chromosome) if the two best hits map to the same chromosome, or unlocalized, if the best hits are on different chromosomes [40]. Although Chromosomer is ideally implemented for genomes from closely related taxa, the conserved nature of avian genomes [62] likely reduces the rate of insertion errors associated with an increase in phylogenetic distance between the reference and target taxa. We mapped scaffolds to all available chromosome-level genomes of the order Passeriformes found on GenBank and to relatively high-quality genomes representing four other avian orders (Table 1). The total sample, in order of increasing relatedness (all reference passerines are of the suborder Passeri and are therefore equidistant to R. melanosticta), included (1) chicken (Gallus gallus, Galliformes) [63], (2) Rock Pigeon (Columba livia, Columbiformes) [64], (3) Anna’s hummingbird (Calypte anna, Apodiformes) [34], (4) Peregrine falcon (Falco peregrinus, Falconifomes) [64], (5) Kakapo (Strigops habroptila, Psittaciformes) [4], (6) Great Tit (Parus major, Passeriformes) [65], (7) House Sparrow (Passer domesticus, Passeriformes) [66], (8) Zebra Finch (Taenopygia guttata, Passeriformes) [34] and (9) Collared Flycatcher (Ficedula albicollis, Passeriformes) [67].
We converted the masked repeat regions from GenBank assemblies to BLAST readable masks with the convert2blastmask function from the NCBI BLAST+ package [68], implementing the “repeatmasker default” option. We created BLAST databases from each reference with makeblastdb and aligned R. melanosticta scaffolds to reference genome databases with blastn [68]. We mapped the target scaffolds to the reference genomes with the fragmentmap function from the Chromosomer package [40]. We set the gap size between non-overlapping scaffolds to 500 bp, which is higher than our maximum read insert-size [40]. Finally, the chromosomes were assembled with default options of the assemble function.

2.3. Multiple Reference Assisted Chromosome Level Assembly

The consistency of sequence adjacency across multiple genomes adds powerful information to referenced-based chromosome assembly [39,41]. We used the software Ragout 2 [39] to assemble the R. melanosticta scaffolds into chromosomes. Ragout uses phylogenetic information to reconstruct the most likely chromosome rearrangements for the target genome [39]. First we assembled the W chromosome separately based on Ficedula albicollis (ENA accession code PRJEB7359) [69], Calypte anna (Table 1) and Gallus gallus (GenBank accession number NC_006126.5) [70]; these were the only assembled W chromosomes we found to be publicly available. As our sample is female, we took this approach to (a) assemble the W chromosome of R. melanosticta and (b) exclude confounding W chromosome scaffolds that would not be correctly mapped to any scaffolds of the reference genomes, given that none of the genomes used for multireference assembly had the W chromosome. Then, we mapped the remaining scaffolds to the five available genomes of the taxa closest to R. melanosticta; all four passerine genomes used in the previous step and to S. habroptila, representing the sister group to Passeriformes (Table 1). We created the input genome alignments in hal format for the Ragout runs with Cactus, using default options [71]. The phylogenetic topology used as reference for the alignment was based on a recently published tree for passerines [18] with no branch length information (all branch lengths = 1, Supplementary Figure S1), and for the W chromosome the topology was based on another study [8]. Given the high contiguity and sequencing depth of the scaffolds from the Supernova de novo assembly, we then ran Ragout version 2.2 with the solid-scaffolds option. The W chromosome of F. albicollis was set to “draft” because it is assembled only to the scaffold level. All other settings were left to default options. Final chromosome names in the R. melanosticta genome were based on F. albicollis chromosomes (randomly selected by Ragout).
Finally, we visually assessed synteny between the R. melanosticta genome and the nine genomes used as references by creating synteny plots between the multiple-reference-based assembly (Ragout) and each single-reference-based assembly (Chromosomer). Instead of performing regular analyses of synteny, which usually involve anchoring homologous sites from target to reference genomes [72], we compared the scaffold-to-chromosome assignment for the R. melanosticta genome assemblies based on single references as an assessment of synteny across Aves. This approach allowed us to assess synteny while comparing the performance of the multireference and single-reference assembly methods. We used the single-reference assemblies of the antbird to make graphical representations of the genomes of the reference taxa because these assemblies are highly constrained to the reference genomes’ structure, although this approach loses any portion of the reference genomes that were not mapped to the R. melanosticta scaffolds. This strategy underestimates the amount of intra-chromosomal rearrangements in R. melanosticta in relation to other taxa, because the order of scaffold placement is guided by the sequence of the reference taxon. However, the high contiguity of the de novo assembled scaffolds (see Results) guarantees that some of the inherent arrangement of R. melanosticta genome remains represented within the scaffolds and allows for some assessment of synteny with other genomes (minimum suggested N50 for synteny representation is 1 Mb [72]). We plotted synteny maps in R version 3.5 [73] with the package ‘circlize’ [74], and chromosome ideograms with ‘karyoploteR’ [75]. Gaps inserted between scaffolds were removed from both types of plots for visualization purposes. Pseudo chromosome fragments (PCF) were concatenated for genome visualization with the orientation of the output fasta sequences (i.e., their concatenation does not represent actual sequence orientation or order in the R. melanosticta genome).

2.4. Evaluation of Genome Completeness

We evaluated genome completeness through direct assessment of assembly metrics such as expected and observed genome length, number of scaffolds and gap length, as well as content of well-known genomic regions of interest, such as target-capture markers and conserved single-copy genes. We estimated the proportion of sequence missing from our assembly by subtracting total gap length and final genome length from the expected genome length [76]. We used the haploid DNA content (in pg) based on flow cytometry of Rhegmatorina melanosticta (from the same specimen we used [77]) converted to Gb assuming 1 pg = 0.978 Gb [78] as an independent estimate of genome size, as well as Supernova’s default genome size estimate based on kmer distribution. We estimated within-scaffold gap lengths (number of bases marked as “N”) with the function comp from the seqtk package [79].
To evaluate the completeness of our genome assembly in relation to sequence content, we used the software Benchmarking Universal Single-Copy Orthologs version 3 (BUSCO) [80,81]. BUSCO measures genome completeness by quantifying the proportion of known genes from compiled datasets that are only present in genomes as single copies and are highly conserved (i.e., they are evolving under “single-copy control” and so conserved that they should be detectable in a variety of organisms [82]). BUSCO genes are good candidates for assessing genome completeness because the expectation that they are present in a given genome is reasonable from an evolutionary perspective [80,81,82,83]. We ran BUSCO on the R. melanosticta genome, plus nine related (Eufalconimorphae sensu [7,84]) genomes.
We first chose five genomes that were assembled to chromosome level and used as outgroups in our chromosome mapping approach: Falco peregrinus, Strigops habroptilus, Passer domesticus, Taeniopygia guttata, and Parus major. We then chose an additional four genomes from a recent study that sequenced dozens of bird genomes [7]: Nestor notabilis, Acanthisitta chloris, Corvus brachyrhynchus, and Manacus vitellinus. BUSCO outputs were summarized in three metrics: (1) percent complete BUSCOs (complete sequence matches), (2) percent fragmented BUSCOs (partial sequence matches), and (3) percent missing BUSCOs (unmatched BUSCO sequences). We finally compared missing genes across all species to those missing from R. melanosticta in order to understand whether missing genes were consistent or variable among all assemblies.
To evaluate the efficacy of harvesting target-capture data from linked-read sequencing genomes, we also mapped the Tetrapods-UCE-5kv1 probeset, which targets 5060 ultraconserved elements (UCEs; https://www.ultraconserved.org/). UCEs are genome-wide markers that are informative at both deep and shallow evolutionary timescales, and which have become widely used for phylogenomic and population genomic studies [12,13,85]. To do this, we used the phyluce pipeline for harvesting UCEs from genomes [86]. We converted the de novo assembled R. melanosticta genome from fasta to twoBit and extracted sequence length information from it with the faToTwoBit and twoBitInfo tools from the Kent Source Archive [87] We then aligned and harvested the UCE loci from the genome using scripts in the phyluce package.

2.5. Genotyping-by-Sequencing (GBS) Reference Mapping

In order to demonstrate the efficacy of our genome for potential future research, we mapped genotyping-by-sequencing data for six species in the family Thamnophilidae. Specimens were provided by two institutions, the American Museum of Natural History (AMNH) and the Museu Paraense Emilio Goeldi (MPEG) and included Thamnophilus aethiops (AMNH LJM 225), Myrmotherula menetriesii (AMNH GT104), Myrmotherula longipennis (AMNH GDR 275), Willisornis poecilinotus (AMNH GDR239), Hypocnemis rondoni (AMNH LJM325), and Phlegopsis nigromaculata (MPEG T15868). Library prep and sequencing was undertaken at the University of Wisconsin Biotechnology Center (Madison, WI) using Pstl and Mspl enzymes, with only the latter as the cutter. The 150 bp paired-end sequencing was performed on an Illumina NovaSeq 6000. We then used ipyrad 0.7.30 [88] to trim low-quality bases (minimum quality score = 20) from the raw Illumina reads, map the cleaned reads to the R. melanosticta reference genome at a 70% clustering threshold, and identify GBS loci with minimum statistical read depth of six. Mapped loci with more than ten ambiguous base calls, 15 heterozygous sites, or 12 SNPs were discarded to eliminate possibly erroneous and non-orthologous alignments. Because sequence divergence across these species is expected to be about 0.01–0.02 substitutions per site given a highly conserved coding gene [48], we chose these settings to allow for the somewhat higher levels of divergence expected from GBS loci. Sequences for all loci were then concatenated.
To determine the utility of the R. melanosticta assembly as a reference genome, we reconstructed the phylogenetic relationships of the six Thamnophilid species using RAxML version 8.2.4 [89], assuming a root demonstrated in previous works [42,48]. We applied 20 maximum likelihood searches assuming a GTR + gamma model of nucleotide substitution across the entire dataset. We additionally applied 500 bootstrap replicates to evaluate the robustness of each node given our data. Our expectation in employing these analyses is that a more complete genome will yield thousands of mapped GBS loci resulting in accurate, robust phylogenetic reconstruction, whereas a less complete genome would not.

3. Results

3.1. De Novo Assembly

We generated 560.02 million reads with a mean length of 140 b. The de novo assembly size was 1.03 Gb with raw and effective coverage of 62× and 38×, respectively. The fraction of sequence duplication was 7.5%, and the GC content of the assembly was 42.2%. The contig N50 was 136.8 Kb. The final genome had 715 scaffolds ranging from 13.8 to 0.1 Mb in length, with a N50 of 3.3 Mb. There were 5.3 million SNPs in the R. melanosticta genome, out of which 99.8% were phased. The longest phaseblock and the phaseblock N50 were 6.9 Mb and 1.9 Mb, respectively. Out of the 257 large structural variants that were called (over 30 Kb in size), 163 were deletions, 4 were sequence inversions, 22 were sequence duplications and 68 were distal (of at least 500 Kb) sequence translocations (Figure 1, Supplementary Figure S2). In addition to large structural variants, 3797 short deletions (from 50 bp to 30 Kb size range) were detected.

3.2. Reference-Based Assembly

The number of scaffolds mapped to chromosomes based on a single-reference ranged from 577 to 695 and did not vary exclusively due to phylogenetic distance from reference. While the range of scaffolds mapped was similar from passerines to G. gallus (most distantly related bird used), the fewest number of scaffolds mapped were in the C. anna and C. livia assemblies (Table 2). The number of chromosomes created ranged from 29 to 38, and closely reflected the number of chromosomes in reference assemblies. The length of gaps added to final assemblies ranged from 0.11 to 0.18 Mb (Table 2).
The genome assembled based on multiple reference genomes (henceforth referred to as the multireference genome or assembly) was composed of 46 pseudo-chromosome fragments (PCFs), which formed 27 chromosomes (Figure 1). Fifteen chromosomes were formed by a single PCF, nine chromosomes were formed by two separate PCFs, three were formed by three PCFs and the Z chromosome was formed by four disjointed PCFs. The PCFS ranged in length from 0.29 to 103.33 Mb, which correspond to the whole chromosome 22 PCF and one of the two PCFs of chromosome 3 PCFs, respectively. The genome assembly placed 595 of the 715 de novo assembled scaffolds, while 120 scaffolds (56.17 Mb) remained unplaced. Although the number of scaffolds that were unplaced in the multireference assembly was an order of magnitude larger than those unplaced in single-reference assemblies, the unplaced scaffolds represented only five percent of the original de novo assembly. The total assembly length was 990.29 Mb in 163 scaffolds (unplaced and PCFs combined), including gaps introduced between placed scaffolds (42.89 Mb, 4.3% of the assembly). The multireference assembly N50 was 53.31 Mb.

3.3. Genome Completeness
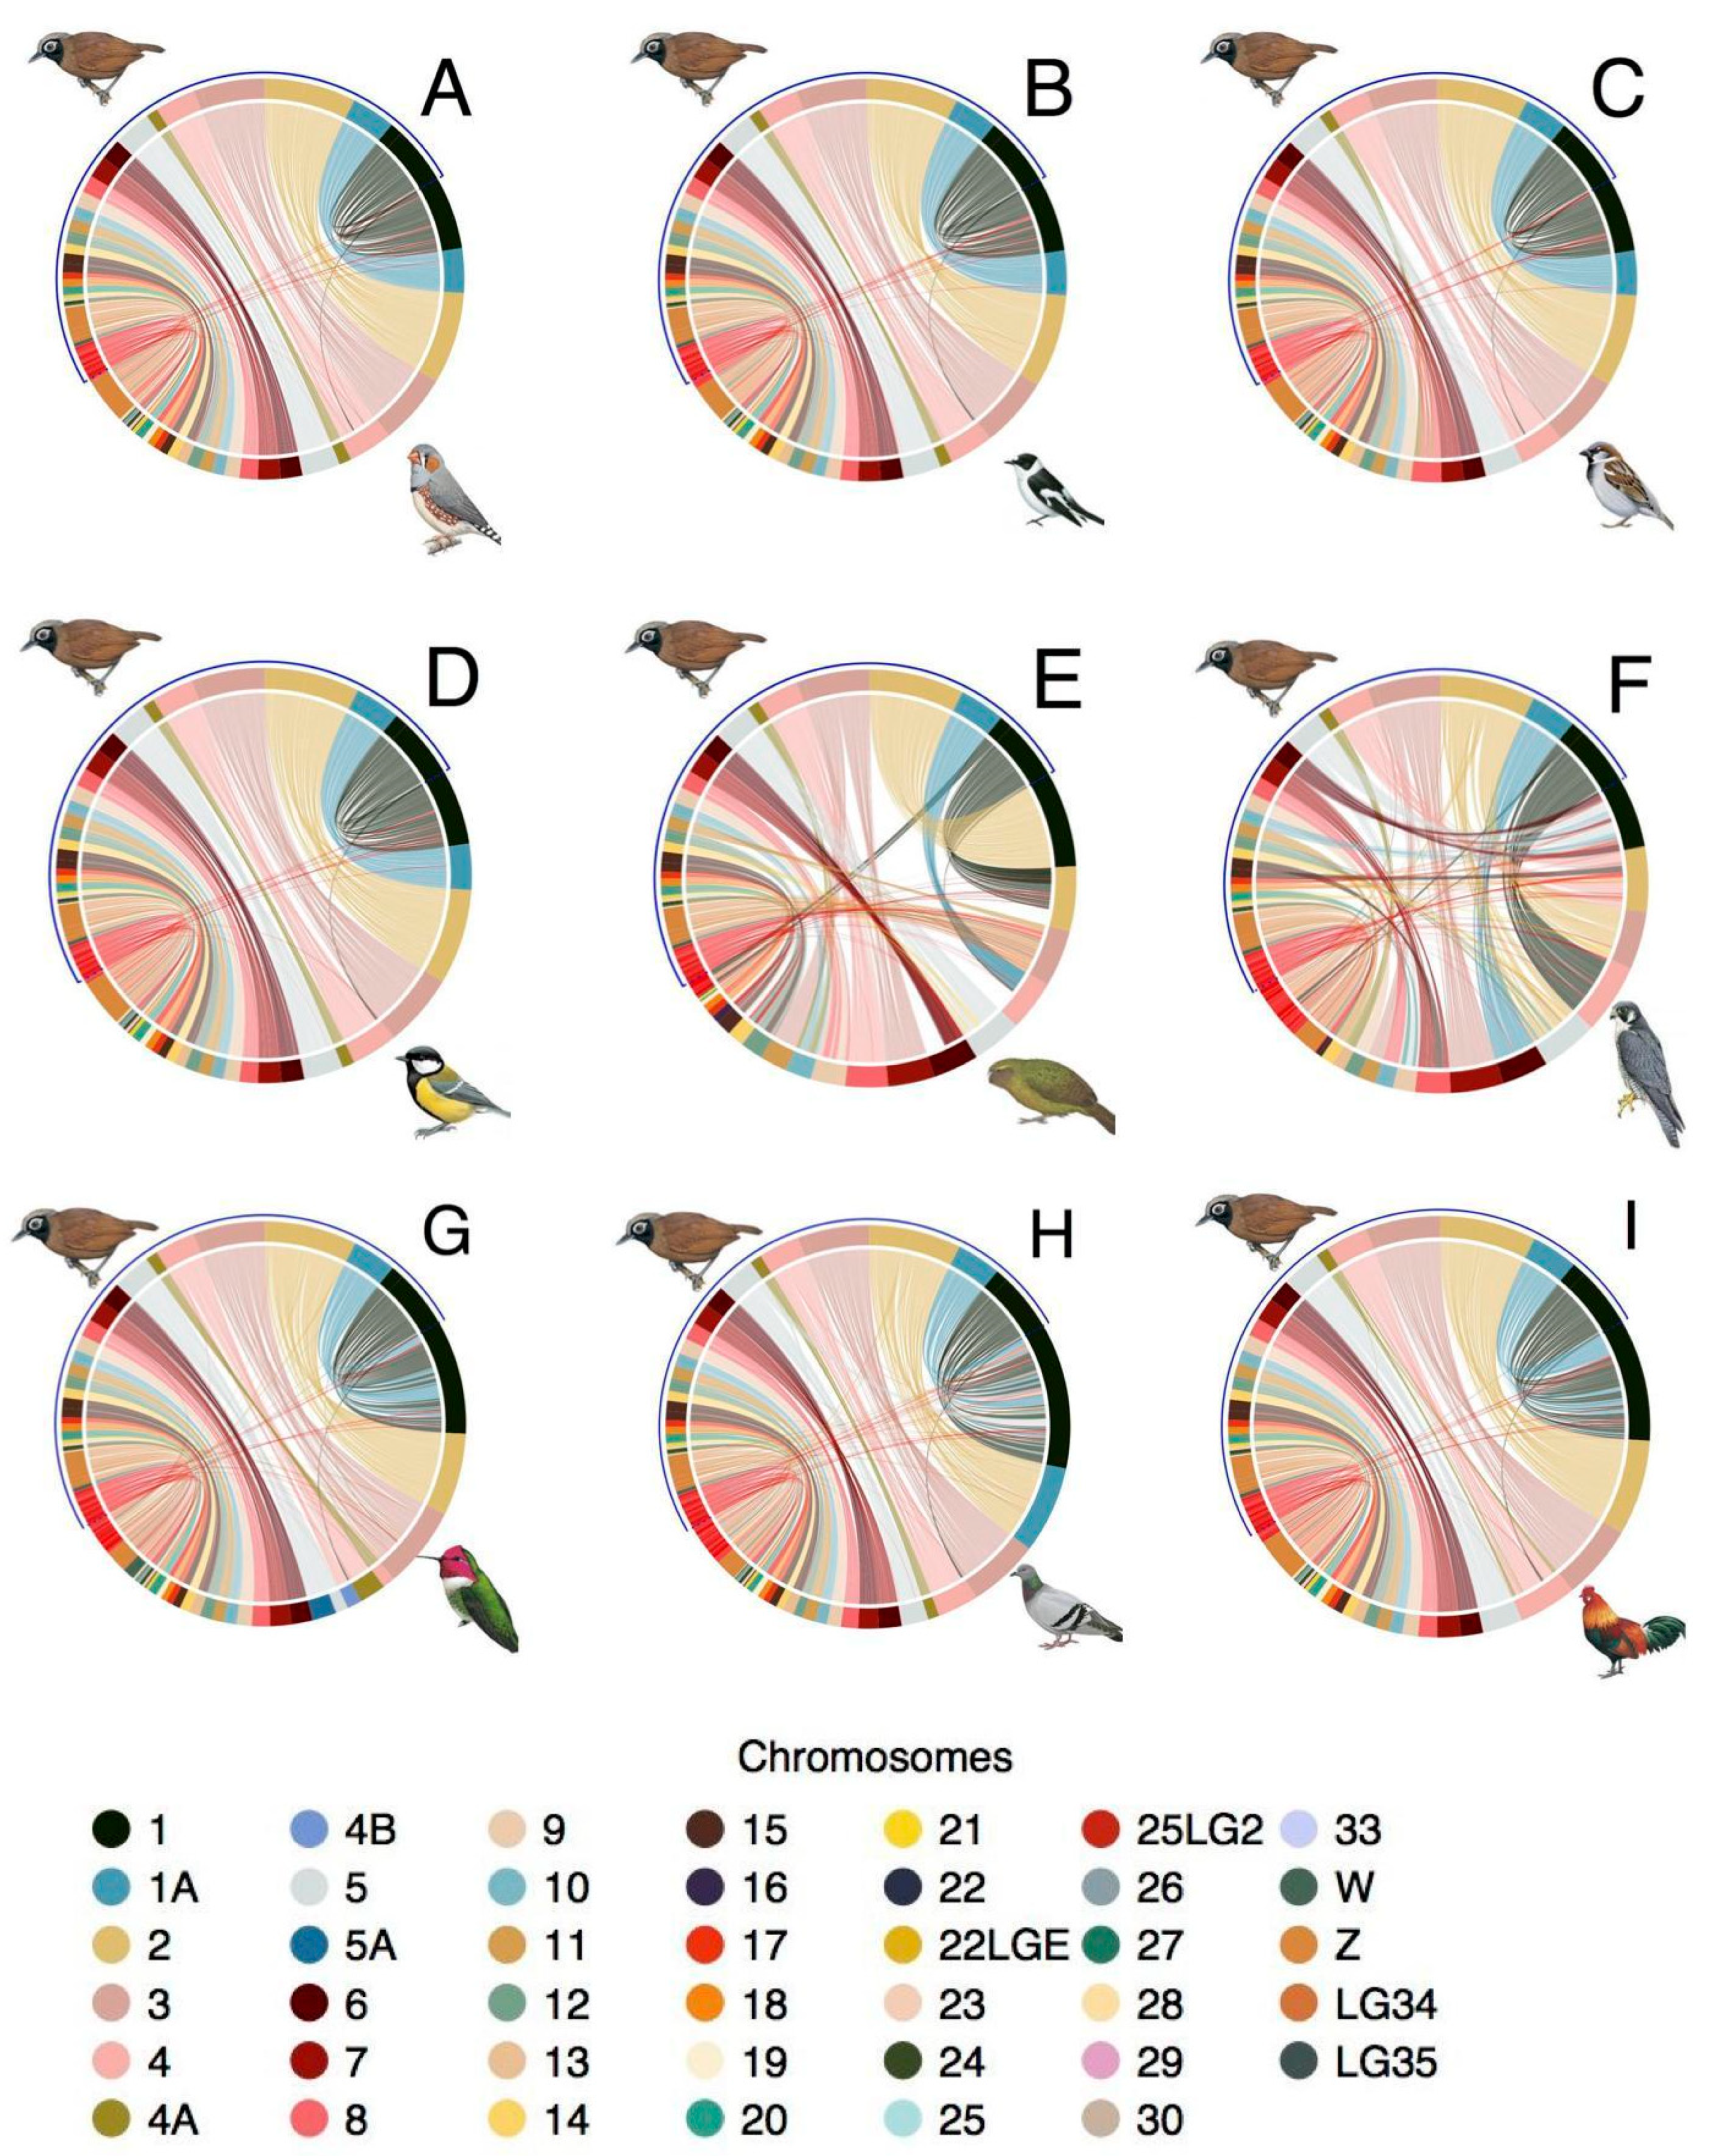
The genome size estimated by Supernova and flow cytometry were very similar: 1.36 Gb and 1.3 Gb [77], respectively. The total length of gaps within scaffolds was 12.2 Mb (Table 3). Based on the estimated genome size, 282.2 Mb (21%) were either not sequenced or were assembled as unidentified nucleotides (“N”). The length of gaps in scaffolds were shorter in R. melanosticta than three of the five long-read assembled genomes (Table 3). In contrast, the number of scaffolds in the R. melanosticta was higher than all but one long-read assembled genome (but see [76] for example of an alternative Gallus gallus genome not used here).
Our analysis of conserved genetic marker content showed that the R. melanosticta genome was relatively complete. After extracting UCE markers from the R. melanosticta genome, we found that 87% of 5060 UCEs were present in the genome. BUSCO analysis revealed that our R. melanosticta genome was relatively complete, with 89.2% (n = 4384) of BUSCOs detected as complete sequences, just 3.5% (n = 172) as fragmented sequences, and only 7.3% (n = 355) missing in the assembly (Figure 2). This number was very similar to that of the other evaluated species, with a lower proportion of fragmented genes, but slightly higher levels of missing genes. Of the 355 BUSCOs that were missing in R. melanosticta, 16.3% (n = 58) were also missing from C. brachyrhynchos, 15.2% (n = 54) from P. major, 17.5% (n = 62) from P. domesticus, 26.5% (n = 94) from T. guttata, 14.1% (n = 50) from M. vitellinus, 14.9% (n = 53) from A. chloris, 13.8% (n = 49) from N. notabilis, 25.4% (n = 90) from S. habroptilus, 12.7% (n = 45) from F. peregrinus, and 6.5% (n = 23) were missing in all six genomes.

3.4. Synteny

Our mapping of synteny recovered relatively consistent results among species: the chromosome placement of sequences within the R. melanosticta multireference genome was similar to the placement of homologous sequences throughout Aves (Figure 3). However, two species assemblies (S. habroptila and F. peregrinus) were structurally different (Figure 3E,F). Out of the two taxa, F. peregrinus had the most rearranged genome in relation to R. melanosticta. Chromosomes 5 and 6 in S. habroptila and R. melanosticta multireference genomes were highly syntenic. Four scaffolds of chromosome 1 in the R. melanosticta multireference genome consistently mapped to chromosome 4 in all assemblies but in F. peregrinus, where it was placed in chromosome 2 (Figure 1, yellow rectangle). This difference reflects the homology of chromosome 2 in F. peregrinus to chromosome 4 in other birds (Figure 3). One of the PCFs created by Ragout2 (2 scaffolds with a total of 520.2 Kb) was homologous to both chromosomes 5 and 1 of F. albicollis. This was the only case in which a PCF was ambiguously placed in the multireference assembly. As the PCF had more sequences homologous to chromosome 5 in the five reference genomes, we decided to represent it as part of chromosome 5 in the genome plots (highlighted in green in Figure 1). One of the scaffolds that were part of the translocation from chromosome 4 to 1 also had a distal structural variation detected by Longranger: a region of this scaffold is translocated to the PCF homologous to both chromosomes 1 and 5 described above (Figure 1).

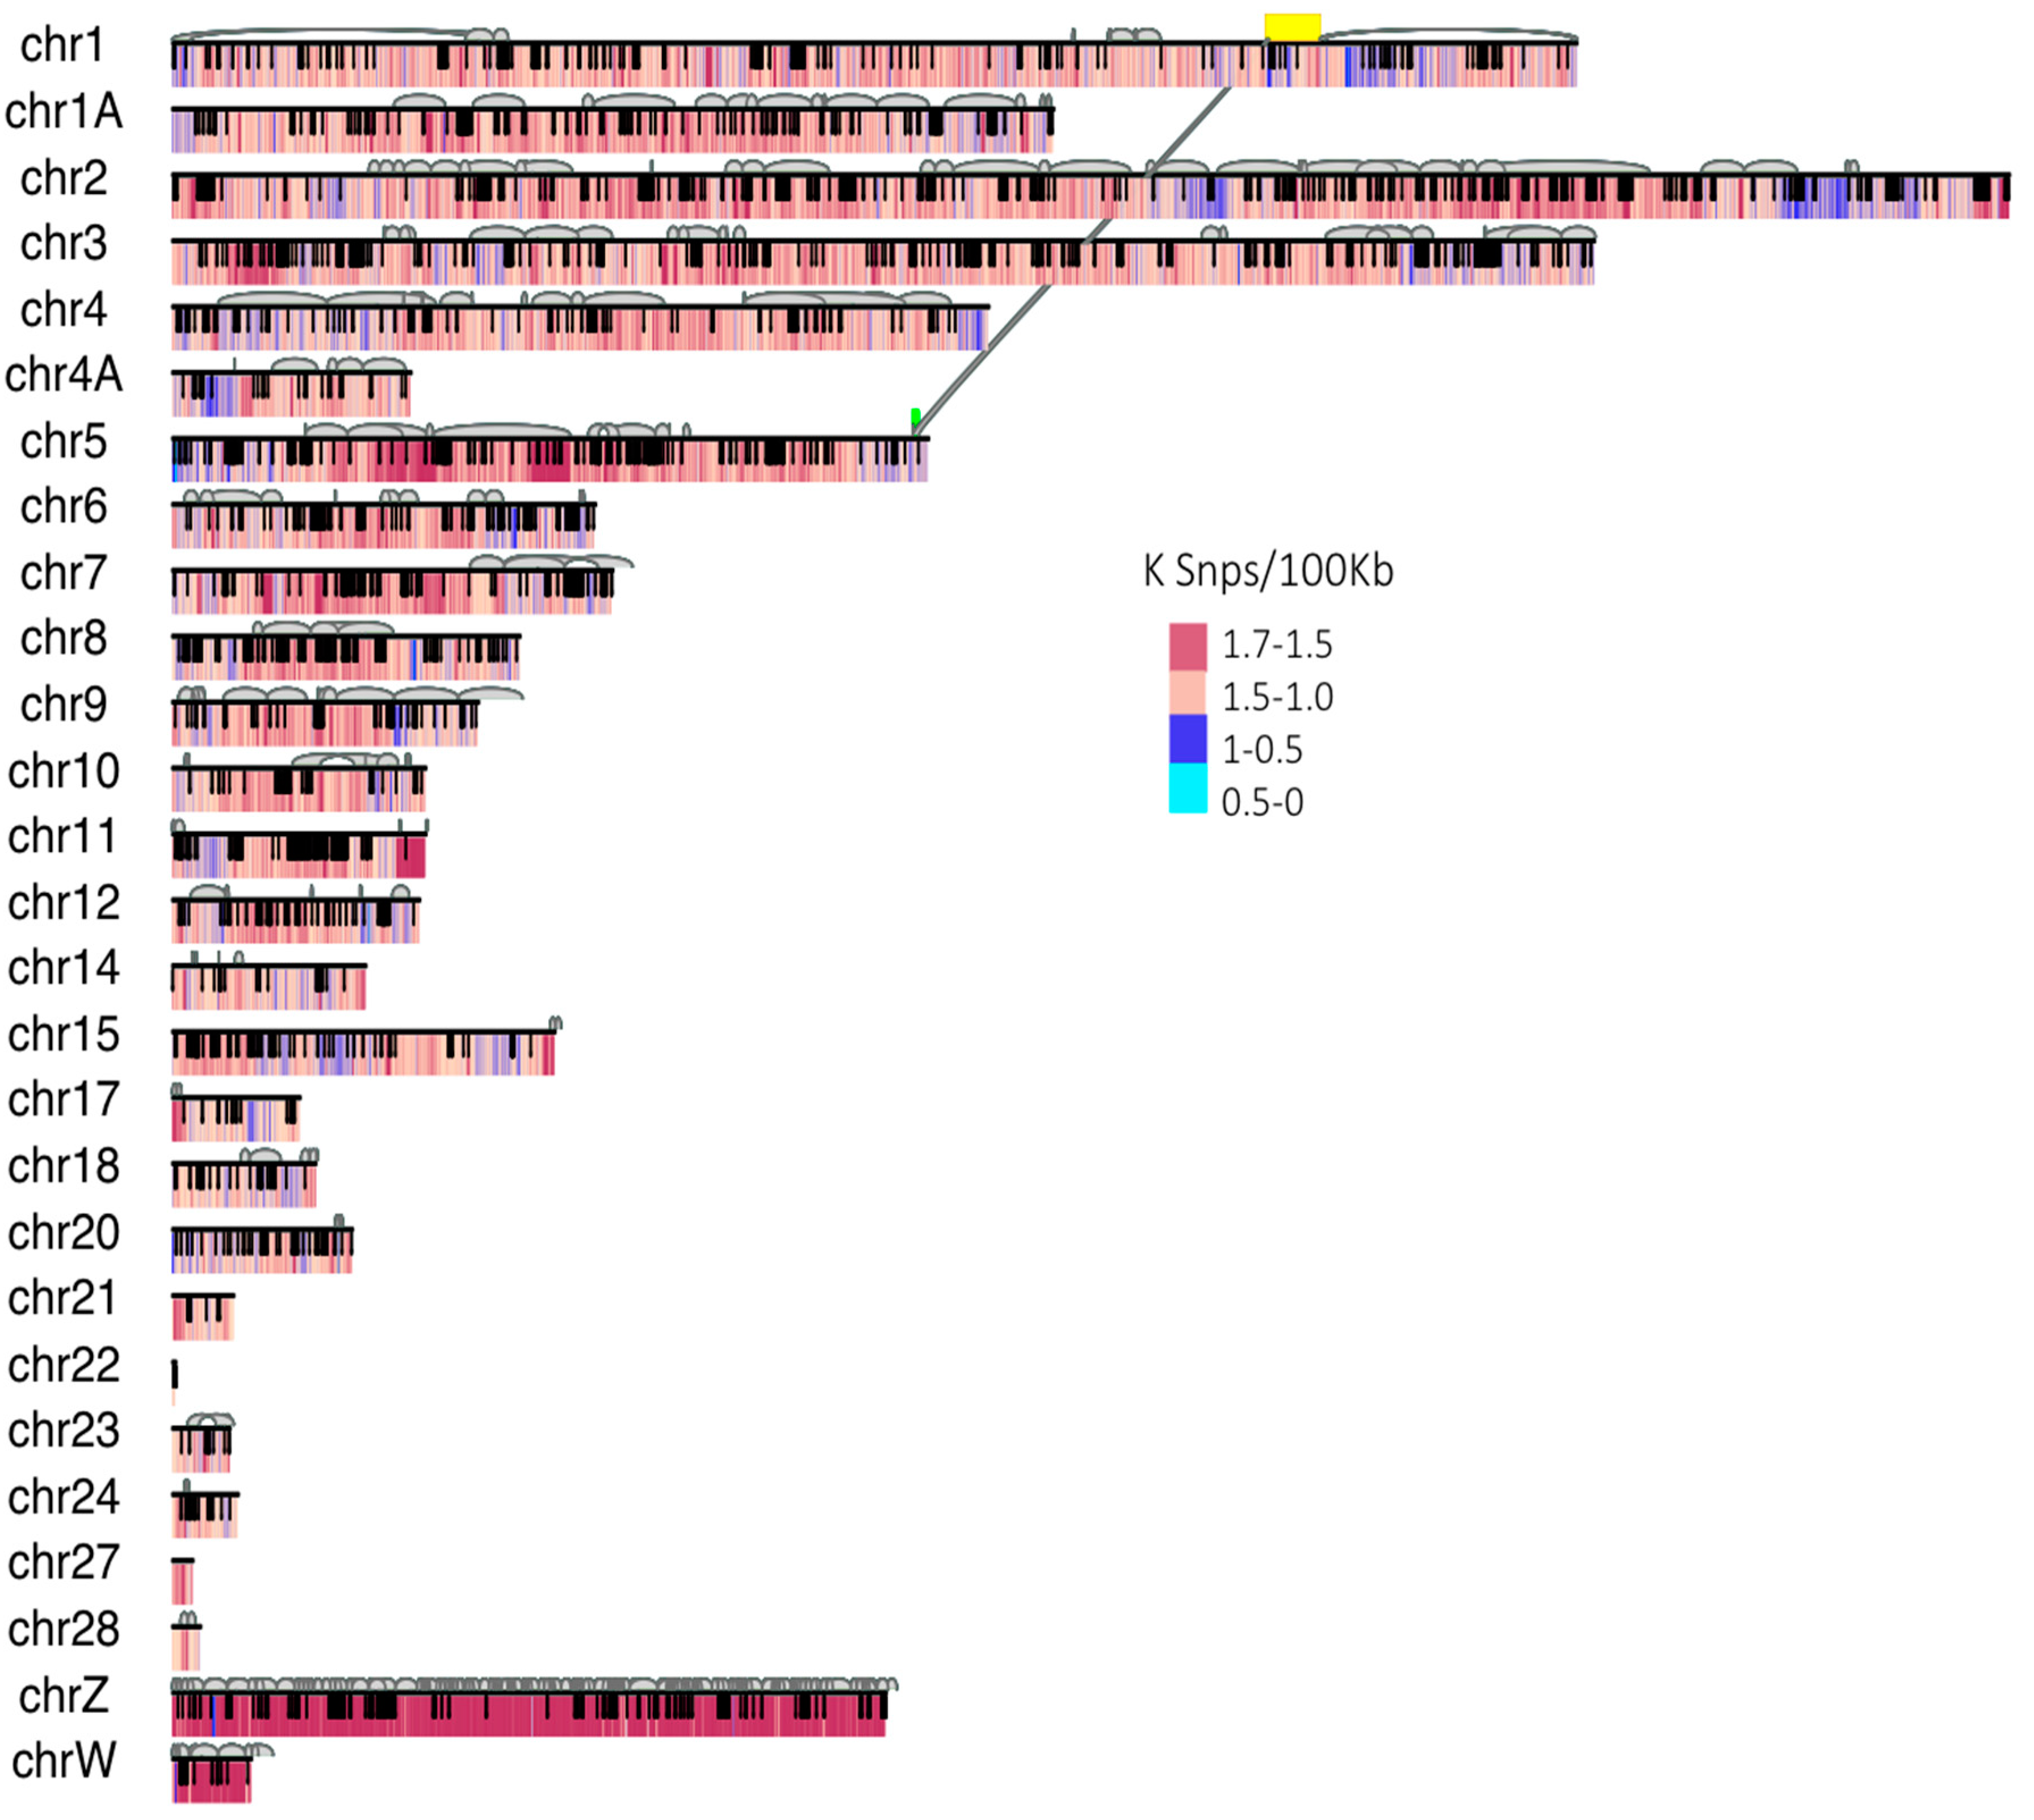
3.5. GBS Reference Mapping

Reference mapping of the GBS data resulted in 55,753 loci total, and 4870 orthologous loci that met our conservative criteria for data retention. Our concatenated matrix of retained loci contained a total of 605,952 bp. RAxML resulted in a topology consistent with previous studies, with 100% bootstrap support across all nodes. Assuming our root was correct based on previous studies, we specifically recovered Hypocnemus to be sister to Willisornis plus Phlegopsis, and these (Tribe Pyithyini) to be sister to Myrmotherula plus Thamnophilus (Tribe Thamnophilini) [48,92]. However, we represent our results as an unrooted network to avoid this assumption (Supplementary Figure S3).

4. Discussion

4.1. General Genome Structure, Contiguity and Content

We herein present a reference-based chromosome-level genome assembly for the obligate ant-following Rhegmatorhina melanosticta. This genome represents one of the few publicly available genomes of a suboscine (suborder: Tyranni), and the first of any species of the infraorder, Furnariides [48,92]. The proportion of the original assembly that was effectively placed in the final assembly (Ragout) is comparable to that of three other chromosome-level bird genomes assembled based on multiple references [41,93]. Our assembly of the R. melanosticta genome is both highly contiguous and relatively complete in terms of BUSCO scores (Figure 2). In terms of completeness, we showed that our genome is similar to those of other published assemblies (Figure 2) [4,7,94]. Although our genome was missing a slightly higher proportion of BUSCOs than most of the other genomes we evaluated, it also contained a lower number of fragmented BUSCOs, consistent with our assessment of high contiguity (i.e., high N50). BUSCO completeness measures correlate poorly with scaffold N50 making the two metrics good independent assessments of genome quality [80]. Additionally, we successfully mapped reduced representation genetic markers from both UCEs and GBS data, further demonstrating the high completeness of our assembly.
We found that the contiguity of short linked-read scaffolding has a comparable performance to that of long-read assemblies, albeit with more gap within sequences. The high scaffold number in R. melanosticta in relation to long-read assemblies likely reflects the concentration of repeat regions towards the scaffold breaks when using short-read sequencing [91], but mapping repeat regions was beyond the scope of this paper. The large number of scaffolds left unplaced to any given chromosome in the final assembly consisted mostly of short scaffolds (<1 Mb). These unplaced scaffolds were likely regions that are difficult to assemble and are therefore highly fragmented, such as highly repetitive genome regions [69]. The high occurrence of “short” scaffolds in the sex chromosomes, which have high densities of repetitive sequence in relation to autosomes, corroborate the likely high density of difficult-to-assemble repeat regions in these scaffolds (Supplementary Figure S4). Furthermore, the concentration of structural variants in these chromosomes (Figure 1, Supplementary Figure S2) in relation to autosomal chromosomes is likely due to the propensity of repeat regions to undergo insertions/deletions [95]. Additionally, some unplaced scaffolds likely correspond to whole microchromosomes, and perhaps even to pathogenic DNA [94]. Given that most bird genomes, including suboscines, have a 2n of 80 on average [76], the final R. melanosticta assembly is likely missing around 13 microchromosomes.

4.2. Analysis of Synteny

Our synteny plots reflect the relative stability of avian chromosome structure relative to other groups of organisms [62,64]. These results expand upon the high syntenic relationship found for the genomes of other passerines [67,96], as well as for non-passerine birds (e.g., Struthio camelus [93] and G. gallus [67]). It was expected that the level of synteny between F. peregrinus and S. habroptilus with the R. melanosticta genome would be lower than for other genomes; Falconiformes and Psitacifformes have highly rearranged genomes within Aves [64,93]. Regardless of their high level of rearrangement, the chromosome 1 fragment of the R. melanosticta genome that mapped to chromosome 4 in all birds was located in chromosome 2 of F. peregrinus, which is homologous to chromosome 4 in other birds. This pattern highlights the conserved nature of sequences among avian groups [67]. Given that the R. melanosticta chromosome assemblies were reference based, the synteny plots likely reflect mostly the synteny between the references. However, the syntenic relationship between R. melanosticta de facto chromosomes and the nine genomes used as reference were likely detected, as we have identified idiosyncratic R. melanosticta structure in the multireference genome. However, teasing these influences apart would only be possible with additional efforts in placing de novo assembled scaffolds, such as optical mapping or chromosome conformation capture. The translocation from chromosome 4 to 1 could represent an actual translocation from the ancestral chromosome 4 to both chromosomes 1 and 5 in R. melanosticta; the structural variant map created with LongRanger showed that a sequence fragment on the alternate haplotype of one of these scaffolds is translocated to a scaffold mapped to chromosome 5 or 1 of the multireference assembly (Figure 1). Alternately, the two scaffolds homologous to both chromosomes 5 and 1 could actually be in chromosome 1 in R. melanosticta. A third possibility is that these two difficult to place scaffolds are a whole microchromosome that split off from the ancestral chromosomes 1 and 5. Whichever the case, R. melanosticta harbors variation in placement of at least a part of the translocated sequence, which could help unravel the path through which the split and/or merging of these genomic regions took place. Sequencing other suboscine genomes as well as using different sequencing tools, such as PacBio long reads or Hi-C mapping will clarify the placement of these sequences in the R. melanosticta genomes and when this event happened since the split from oscine.
The translocations identified in our synteny plots likely underestimate the actual genomic translocations in the R. melanosticta genome in relation to other avian genomes, given that our chromosome level assemblies were contingent on reference sequences. However, we have demonstrated that using information of multiple genomes in conjunction to place scaffolds to chromosomes allows for the emergence of patterns intrinsic to the target genome: the multireference assembly placed a group of scaffolds that were mapped to chromosome 4 in single-reference assemblies on chromosome 1 of R. melanosticta. The occurrence of rearrangements in this genomic region was detected by Longranger independently and without the use of other avian genomes as reference in the distal translocation of sequences between scaffolds in the same region (Figure 1). This performance is likely possible due to the conservation of sequence adjacency information in the highly contiguous de novo assembled scaffolds, which is an important source of information for reference-based scaffold-to-chromosome placement [39,72].

4.3. Linked-Read Genome Applicability in Comparative Phylogenomics

We successfully extracted nearly all (87%) UCE loci from the genome, a number comparable to that of phylogenomic studies of birds that employed reduced representation genomic libraries with the same probeset [97,98,99,100]. This finding not only demonstrates the genome’s completeness but also its potential for future incorporation into the growing number of studies utilizing UCEs for phylogenomic research [18,97,99,101]. The use of allele information adds power to phylogenetic and demographic reconstructions based on target-capture libraries [102], but phasing procedures of short-read non-model genomes are prone to errors [103]. In addition to recovering a high number of UCE loci in the genome, the SNPs recovered with the aid of linked-read barcodes are phased with high accuracy into long phaseblocks.
As a more in-depth assessment of the genome’s utility for comparative phylogenomics, we additionally mapped GBS data and used the identified loci to reconstruct the phylogenetic relationships of a sample of antbirds. In doing so, the resulting RAxML phylogeny agreed with the well-accepted taxonomic relationships that have been recovered in multiple previous studies [42,48]. Therefore, we have demonstrated that our R. melanosticta genome is valuable for a range of potential future uses. These results also corroborate the idea that GBS data—typically considered most useful at population-genetic scales—can be highly informative even at relatively deep timescales [100,104,105].

5. Conclusions

Overall, we have demonstrated that linked-read technologies are valuable resources for generating high contiguity genomes, with relatively complete sequencing of putatively conserved genomic regions. Because of this high contiguity, we were able to phase SNPs in relatively long phaseblocks, a result that indicates significant informativeness of this genome for a range of studies. Similarly, the high completeness of our assembly relative to other publicly available genomes means that new data are available for incorporation into ongoing phylogenomic and population genomic work on avian evolution. We additionally showed that multireference-based assembly methods areuseful for assembling scaffolds and comparing genomic structure across the avian tree of life and found relatively stable chromosomal structure spanning at least 65 my of evolutionary history. Notably, we detected a single sequence transfer from chromosome 4 to chromosome 1 in R. melanosticta in relation to the other genomes we evaluated. Future work should determine whether this translocation is synapormorphic of Tyranni, Thamnophilidae, or another node in the R. melanosticta history. We demonstrated that genomic structure unique to the target taxon can be detected with the guidance of reference genomes in assembling scaffolds to chromosomes.

Supplementary Materials

The following are available online at https://0-www-mdpi-com.brum.beds.ac.uk/1424-2818/11/9/144/s1, Figure S1: the phylogeny used to inform the whole-genome alignment. The topology was extracted from [18]. Figure S2: number of structural variants (insertions/deletions, duplications, rearrangements) mapped to Rhegmathorina melanosticta chromosomes in relation to chromosome length. The red points represent the sex chromosomes. Figure S3: phylogenetic relationships for some birds in the family, Thamnophilidae. The topology was inferred using RAxML based on 4,870 GBS loci mapped to the R. melanosticta genome. The relationships are consistent with well-accepted phylogenetic hypotheses [34,40]. Figure S4: distribution of lengths of scaffolds that form each chromosome (thin lines) in the Rhegmathorina melanosticta genome. The red and green lines correspond to the W and Z chromosomes, respectively. The bold line corresponds to the length distribution of all scaffolds combined. The blue dashed line represents the scaffold N50 (3.2 Mb).

Author Contributions

L.A.C. and J.C. conceived of and designed the study. L.A.C. and L.J.M. designed and carried out all analyses and wrote the paper. All authors edited the manuscript for intellectual content.

Funding

Funding for this work was provided by the F.M. Chapman Fund, by the Linda Gormezano Fund (American Museum of Natural History) and by NSF 1146423 and NSF/NASA 1241066 (Dimensions US-Biota-São Paulo) to J.C. Additional support for L.A.C was provided by the Coordenação de Aperfeiçoamento de Pessoal de Nível Superior – Brasil (CAPES) – BEX 1191136.

Acknowledgments

We thank Sara Oppenheim, Apurva Narechania, and Sajesh Singh for assistance with bioinformatic data processing and analysis. We additionally thank Christopher Witt and Andrew Johnson (Museum of Southwestern Biology) for loaning genetic material. Three anonymous reviewers greatly improved the manuscript. All bird images were used pending authorization from the Handbook of the Birds of the World [106].

Conflicts of Interest

The authors declare no conflict of interest.

Data Availability

Assemblies will be made publically available on NCBI Genbank upon article acceptance.

References

  1. Ellegren, H. Genome sequencing and population genomics in non-model organisms. Trends Ecol. Evol. 2014, 29, 51–63. [Google Scholar] [CrossRef] [PubMed]
  2. Zhang, G. Genomics: Bird sequencing project takes off. Nature 2015, 522, 34. [Google Scholar] [CrossRef] [PubMed]
  3. Genome 10K Community of Scientists. Genome 10K: A proposal to obtain whole-genome sequence for 10,000 vertebrate species. J. Hered. 2009, 100, 659–674. [Google Scholar] [CrossRef] [PubMed]
  4. Koepfli, K.-P.; Paten, B.; the Genome 10K Community of Scientists; O’Brien, S.J. The Genome 10K Project: A way forward. Annu. Rev. Anim. Biosci. 2015, 3, 57–111. [Google Scholar] [CrossRef] [PubMed]
  5. Jarvis, E.D.; Mirarab, S.; Aberer, A.J.; Li, B.; Houde, P.; Li, C.; Ho, S.Y.W.; Faircloth, B.C.; Nabholz, B.; Howard, J.T.; et al. Phylogenomic analyses data of the avian phylogenomics project. Gigascience 2015, 4, 4. [Google Scholar] [CrossRef] [PubMed]
  6. Zhang, G.; Li, C.; Li, Q.; Li, B.; Larkin, D.M.; Lee, C.; Storz, J.F.; Antunes, A.; Greenwold, M.J.; Meredith, R.W.; et al. Comparative genomics reveals insights into avian genome evolution and adaptation. Science 2014, 346, 1311–1320. [Google Scholar] [CrossRef] [PubMed] [Green Version]
  7. Jarvis, E.D.; Mirarab, S.; Aberer, A.J.; Li, B.; Houde, P.; Li, C.; Ho, S.Y.W.; Faircloth, B.C.; Nabholz, B.; Howard, J.T.; et al. Whole-genome analyses resolve early branches in the tree of life of modern birds. Science 2014, 346, 1320–1331. [Google Scholar] [CrossRef] [PubMed] [Green Version]
  8. Prum, R.O.; Berv, J.S.; Dornburg, A.; Field, D.J.; Townsend, J.P.; Lemmon, E.M.; Lemmon, A.R. A comprehensive phylogeny of birds (Aves) using targeted next-generation DNA sequencing. Nature 2015, 526, 569–573. [Google Scholar] [CrossRef] [PubMed]
  9. McCormack, J.E.; Harvey, M.G.; Faircloth, B.C.; Crawford, N.G.; Glenn, T.C.; Brumfield, R.T. A phylogeny of birds based on over 1,500 loci collected by target enrichment and high-throughput sequencing. PLoS ONE 2013, 8, e54848. [Google Scholar] [CrossRef]
  10. Toews, D.P.L.; Taylor, S.A.; Vallender, R.; Brelsford, A.; Butcher, B.G.; Messer, P.W.; et al. Plumage Genes and Little Else Distinguish the Genomes of Hybridizing Warblers. Curr. Biol. 2016, 26, 2313–2318. [Google Scholar] [CrossRef] [Green Version]
  11. Harvey, M.G.; Aleixo, A.; Ribas, C.C.; Brumfield, R.T. Habitat Association Predicts Genetic Diversity and Population Divergence in Amazonian Birds. Am. Nat. 2017, 190, 631–648. [Google Scholar] [CrossRef] [PubMed] [Green Version]
  12. Smith, B.T.; Harvey, M.G.; Faircloth, B.C.; Glenn, T.C. Target capture and massively parallel sequencing of ultraconserved elements for comparative studies at shallow evolutionary time scales. Syst. Biol. 2013, 63, 83–95. Available online: https://0-academic-oup-com.brum.beds.ac.uk/sysbio/article-abstract/63/1/83/1689074 (accessed on 15 August 2019). [CrossRef] [PubMed]
  13. Raposo do Amaral, F.; Maldonado-Coelho, M.; Aleixo, A.; Luna, L.W.; Rêgo, P.S.D.; Araripe, J.; Souza, T.O.; Silva, W.A.G.; Thom, G. Recent chapters of Neotropical history overlooked in phylogeography: Shallow divergence explains phenotype genotype uncoupling in Antilophia manakins. Mol. Ecol. 2018, 27, 4108–4120. [Google Scholar] [CrossRef] [PubMed]
  14. Oswald, J.A.; Harvey, M.G.; Remsen, R.C.; Foxworth, D.U.; Dittmann, D.L.; Cardiff, S.W.; Brumfield, R.T. Evolutionary dynamics of hybridization introgression following the recent colonization of Glossy Ibis (Aves: Plegadis falcinellus) into the New World. Mol. Ecol. 2019, 28, 1675–1691. [Google Scholar] [CrossRef] [PubMed]
  15. Oswald, J.A.; Overcast, I.; Mauck, W.M.; Andersen, M.J.; Smith, B.T. Isolation with asymmetric gene flow during the nonsynchronous divergence of dry forest birds. Mol Ecol. 2017, 26, 1386–1400. [Google Scholar] [CrossRef] [PubMed]
  16. Nadachowska-Brzyska, K.; Li, C.; Smeds, L.; Zhang, G.; Ellegren, H. Temporal Dynamics of Avian Populations during Pleistocene Revealed by Whole-Genome Sequences. Curr. Biol. 2015, 25, 1375–1380. [Google Scholar] [CrossRef] [PubMed] [Green Version]
  17. Musher, L.J.; Ferreira, M.; Auerbach, A.L.; McKay, J.; Cracraft, J. Why is Amazonia a “source” of biodiversity? Climate-mediated dispersal and synchronous speciation across the Andes in an avian group (Tityrinae). Proc. R. Soc. B. 2019, 286, 20182343. [Google Scholar] [CrossRef] [PubMed]
  18. Oliveros, C.H.; Field, D.J.; Ksepka, D.T.; Barker, F.K.; Aleixo, A.; Andersen, M.J.; Alström, P.; Benz, B.W.; Braun, E.L.; Braun, M.J.; et al. Earth history and the passerine superradiation. Proc. Natl. Acad. Sci. USA 2019, 116, 7916–7925. [Google Scholar] [CrossRef] [Green Version]
  19. Nam, K.; Mugal, C.; Nabholz, B.; Schielzeth, H.; Wolf, J.B.W.; Backström, N.; Künstner, A.; Balakrishnan, C.N.; Heger, A.; Ponting, C.P.; et al. Molecular evolution of genes in avian genomes. Genome Biol. 2010, 11, R68. [Google Scholar] [CrossRef] [PubMed]
  20. Ellegren, H.; Smeds, L.; Burri, R.; Olason, P.I.; Backström, N.; Kawakami, T.; Künstner, A.; Mäkinen, H.; Nadachowska-Brzyska, K.; Qvarnström, A.; et al. The genomic landscape of species divergence in Ficedula flycatchers. Nature 2012, 491, 756–760. [Google Scholar] [CrossRef] [PubMed]
  21. Runemark, A.; Trier, C.N.; Eroukhmanoff, F.; Hermansen, J.S.; Matschiner, M.; Ravinet, M.; Elgvin, T.O.; Sætre, G.-P. Variation and constraints in hybrid genome formation. Nat. Ecol. Evol. 2018, 2, 549–556. [Google Scholar] [CrossRef] [PubMed]
  22. Irwin, D.E.; Milá, B.; Toews, D.P.L.; Brelsford, A.; Kenyon, H.L.; Porter, A.N.; Grossen, C.; Delmore, K.E.; Alcaide, M.; Irwin, J.H. A comparison of genomic islands of differentiation across three young avian species pairs. Mol. Ecol. 2018, 27, 4839–4855. [Google Scholar] [CrossRef] [PubMed]
  23. Alcaide, M.; Scordato, E.S.C.; Price, T.D.; Irwin, D.E. Genomic divergence in a ring species complex. Nature 2014, 511, 83–85. [Google Scholar] [CrossRef] [PubMed] [Green Version]
  24. Hron, T.; Pajer, P.; Pačes, J.; Bartůněk, P.; Elleder, D. Hidden genes in birds. Genome biol. 2015, 16, 164. [Google Scholar] [CrossRef] [PubMed]
  25. Botero-Castro, F.; Figuet, E.; Tilak, M.-K.; Nabholz, B.; Galtier, N. Avian Genomes Revisited: Hidden Genes Uncovered and the Rates versus Traits Paradox in Birds. Mol. Biol. Evol. 2017, 34, 3123–3131. [Google Scholar] [CrossRef] [PubMed]
  26. Tigano, A.; Sackton, T.B.; Friesen, V.L. Assembly and RNA-free annotation of highly heterozygous genomes: The case of the thick-billed murre (Uria lomvia). Mol. Ecol. Resour. 2018, 18, 79–90. [Google Scholar] [CrossRef] [PubMed]
  27. Sotero-Caio, C.G.; Platt, R.N.; Suh, A.; Ray, D.A. Evolution and Diversity of Transposable Elements in Vertebrate Genomes. Genome Biol. Evol. 2017, 9, 161–177. [Google Scholar] [CrossRef] [PubMed] [Green Version]
  28. Lien, S.; Koop, B.F.; Sandve, S.R.; Miller, J.R.; Kent, M.P.; Nome, T.; Hvidsten, T.R.; Leong, J.S.; Minkley, D.R.; Zimin, A.; et al. The Atlantic salmon genome provides insights into rediploidization. Nature 2016, 533, 200–205. [Google Scholar] [CrossRef] [Green Version]
  29. English, A.C.; Richards, S.; Han, Y.; Wang, M.; Vee, V.; Qu, J.; Qin, X.; Muzny, D.M.; Reid, J.G.; Worley, K.C.; et al. Mind the gap: Upgrading genomes with Pacific Biosciences RS long-read sequencing technology. PLoS ONE 2012, 7, e47768. [Google Scholar] [CrossRef]
  30. Lieberman-Aiden, E.; van Berkum, N.L.; Williams, L.; Imakaev, M.; Ragoczy, T.; Telling, A.; Amit, I.; Lajoie, B.R.; Sabo, P.J.; Dorschner, M.O.; et al. Comprehensive mapping of long-range interactions reveals folding principles of the human genome. Science 2009, 326, 289–293. [Google Scholar] [CrossRef]
  31. Korbel, J.O.; Urban, A.E.; Affourtit, J.P.; Godwin, B.; Grubert, F.; Simons, J.F.; Kim, P.M.; Palejev, D.; Carriero, N.J.; Du, L.; et al. Paired-end mapping reveals extensive structural variation in the human genome. Science 2007, 318, 420–426. [Google Scholar] [CrossRef]
  32. Myers, E.W.; Sutton, G.G.; Delcher, A.L.; Dew, I.M.; Fasulo, D.P.; Flanigan, M.J.; Kravitz, S.A.; Mobarry, C.M.; Reinert, K.H.J.; Remington, K.A.; et al. A whole-genome assembly of Drosophila. Science 2000, 287, 2196–2204. [Google Scholar] [CrossRef] [PubMed]
  33. Cheung, V.G.; Nowak, N.; Jang, W.; Kirsch, I.R.; Zhao, S.; Chen, X.N.; Furey, T.S.; Kim, U.J.; Kuo, W.L.; Olivier, M. Integration of cytogenetic landmarks into the draft sequence of the human genome. Nature 2001, 409, 953–958. [Google Scholar] [PubMed] [Green Version]
  34. Korlach, J.; Gedman, G.; Kingan, S.B.; Chin, C.-S.; Howard, J.T.; Audet, J.-N.; Cantin, L.; Jarvis, E.D. De novo PacBio long-read and phased avian genome assemblies correct and add to reference genes generated with intermediate and short reads. Gigascience 2017, 6, 1–16. [Google Scholar] [CrossRef] [Green Version]
  35. Ozerov, M.Y.; Ahmad, F.; Gross, R.; Pukk, L.; Kahar, S.; Kisand, V.; Vasemägi, A. Highly Continuous Genome Assembly of Eurasian Perch (Perca fluviatilis) Using Linked-Read Sequencing. G3: Genes Genomes Genet. 2018, 8, 3737–3743. [Google Scholar] [CrossRef] [PubMed]
  36. Weisenfeld, N.I.; Kumar, V.; Shah, P.; Church, D.M.; Jaffe, D.B. Direct determination of diploid genome sequences. Genome Res. 2017, 27, 757–767. [Google Scholar] [CrossRef] [Green Version]
  37. Sohn, J.; Nam, J.W. The present and future of de novo whole-genome assembly. Brief. Bioinform. 2016. Available online: https://0-academic-oup-com.brum.beds.ac.uk/bib/article-abstract/19/1/23/2339783 (accessed on 15 August 2019).
  38. Sedlazeck, F.J.; Lee, H.; Darby, C.A.; Schatz, M.C. Piercing the dark matter: Bioinformatics of long-range sequencing and mapping [Internet]. Nat. Rev. Genet. 2018, 329–346. [Google Scholar] [CrossRef] [PubMed]
  39. Kolmogorov, M.; Armstrong, J.; Raney, B.J.; Streeter, I.; Dunn, M.; Yang, F.; Odom, D.; Flicek, P.; Keane, T.M.; Thybert, D.; et al. Chromosome assembly of large and complex genomes using multiple references. Genome Res. 2018, 28, 1720–1732. [Google Scholar] [CrossRef] [Green Version]
  40. Tamazian, G.; Dobrynin, P.; Krasheninnikova, K.; Komissarov, A.; Koepfli, K.-P.; O’Brien, S.J. Chromosomer: A reference-based genome arrangement tool for producing draft chromosome sequences. Gigascience 2016, 5, 38. [Google Scholar] [CrossRef] [PubMed]
  41. Kim, J.; Larkin, D.M.; Cai, Q.; Asan Zhang, Y.; Ge, R.-L.; Auvil, L.; Capitanu, B.; Zhang, G.; Lewin, H.A.; Ma, J. Reference-assisted chromosome assembly. Proc. Natl. Acad. Sci. USA 2013, 110, 1785–1790. [Google Scholar] [CrossRef] [Green Version]
  42. Marcondes, R.S.; Brumfield, R.T. Fifty shades of brown: Macroevolution of plumage brightness in the Furnariida, a large clade of drab Neotropical passerines. Evolution 2019, 73, 704–719. [Google Scholar] [CrossRef]
  43. Seeholzer, G.F.; Claramunt, S.; Brumfield, R.T. Niche evolution and diversification in a Neotropical radiation of birds (Aves: Furnariidae). Evolution 2017, 71, 702–715. [Google Scholar] [CrossRef] [PubMed]
  44. Raikow, R.J. Why are there so many kinds of passerine birds? Syst. Zool. 1986, 35, 255–259. [Google Scholar] [CrossRef]
  45. Derryberry, E.P.; Claramunt, S.; Darryberry, G.; Chesser, R.T.; Cracraft, J.; Aleixo, A.; Péres-Emán, J.; Remnsen, J.V.; Brumfield, R.T. Lineage diversification and morphological evolution in a large-scale continental radiation: The Neotropical ovenbirds and woodcreepers (Aves: Furnariidae). Evolution. 2011. Available online: https://0-onlinelibrary-wiley-com.brum.beds.ac.uk/doi/abs/10.1111/j.1558-5646.2011.01374.x (accessed on 22 August 2019).
  46. Isler, M.L.; Isler, P.R.; Whitney, B.M. Species Limits in Antbirds (Thamnophilidae): The Warbling Antbird (Hypocnemis Cantator) Complex. Auk 2007, 124, 11–28. [Google Scholar] [CrossRef]
  47. Willis, E.O. Taxonomy and behavior of Pale-faced Antbirds. Auk 1968, 85, 253–264. [Google Scholar] [CrossRef]
  48. Moyle, R.G.; Chesser, R.T.; Brumfield, R.T.; Tello, J.G. Phylogeny and phylogenetic classification of the antbirds, ovenbirds, woodcreepers, and allies (Aves: Passeriformes: Infraorder Furnariides). Cladistics. 2009. Available online: https://0-onlinelibrary-wiley-com.brum.beds.ac.uk/doi/abs/10.1111/j.1096-0031.2009.00259.x (accessed on 22 August 2019).
  49. Willis, E.O. On the behavior of five species of Rhegmatorhina, ant-following antbirds of the Amazon basin. Wilson Bull. 1969, 81, 363–395. [Google Scholar]
  50. Chaves-Campos, J. Ant colony tracking in the obligate army ant-following antbird Phaenostictus mcleannani. J. Ornithol. 2011, 152, 497–504. [Google Scholar] [CrossRef]
  51. Aleixo, A.; Burlamaqui, T.C.T.; Schneider, M.P.C.; Gonçalves, E.C. Molecular systematics and plumage evolution in the monotypic obligate army-ant-following genus Skutchia (Thamnophilidae). Condor 2009, 111, 382–387. [Google Scholar] [CrossRef]
  52. Ribas, C.C.; Aleixo, A.; Gubili, C.; d’Horta, F.M. Biogeography and diversification of Rhegmatorhina (Aves: Thamnophilidae): Implications for the evolution of Amazonian landscapes during the Quaternary. J. Biogeography. 2018. Available online: https://0-onlinelibrary-wiley-com.brum.beds.ac.uk/doi/abs/10.1111/jbi.13169 (accessed on 22 August 2019).
  53. Isler, M.L.; Bravo, G.A.; Brumfield, R.T. Systematics of the obligate ant-following clade of antbirds (Aves: Passeriformes: Thamnophilidae). Wilson J. Ornithol. 2014, 126, 635–648. [Google Scholar] [CrossRef]
  54. Pulido-Santacruz, P.; Aleixo, A.; Weir, J.T. Morphologically cryptic Amazonian bird species pairs exhibit strong postzygotic reproductive isolation. Proc. Biol. Sci. 2018, 285. [Google Scholar] [CrossRef] [PubMed]
  55. Hackett, S.J. Phylogenetic and biogeographic relationships in the Neotropical genus Gymnopithys (Formicariidae). Wilson Bull. 1993, 105, 301–315. [Google Scholar]
  56. Silva, S.M.; Peterson, A.T.; Carneiro, L.; Burlamaqui, T.C.T.; Ribas, C.C.; Sousa-Neves, T.; Miranda, L.S.; Fernandes, A.F.; d’Horta, F.; Araújo-Silva, L.E.; et al. A dynamic continental moisture gradient drove Amazonian bird diversification. Sci. Adv. 2019, 5, eaat5752. [Google Scholar] [CrossRef] [PubMed] [Green Version]
  57. Ott, A.; Schnable, J.C.; Yeh, C.-T.; Wu, L.; Liu, C.; Hu, H.-C.; DAlgrad, C.L.; Sarkar, S.; Schnable, P.S. Linked read technology for assembling large complex and polyploid genomes. BMC Genom. 2018, 19, 651. [Google Scholar] [CrossRef] [PubMed]
  58. Zheng, G.X.Y.; Lau, B.T.; Schnall-Levin, M.; Jarosz, M.; Bell, J.M.; Hindson, C.M.; Kyriazopoulou-Panagiotopoulou, S.; Masquelier, D.A.; Merrill, L.; Terry, J.M. Haplotyping germline and cancer genomes with high-throughput linked-read sequencing. Nat. Biotechnol. 2016, 34, 303–311. [Google Scholar] [CrossRef] [PubMed]
  59. Marks, P.; Garcia, S.; Barrio, A.M.; Belhocine, K.; Bernate, J.; Bharadwaj, R.; Bjornson, K.; Catalanotti, C.; Delaney, J.; Fehr, A.; et al. Resolving the full spectrum of human genome variation using Linked-Reads. Genome Res. 2019, 29, 635–645. [Google Scholar] [CrossRef] [PubMed] [Green Version]
  60. McKenna, A.; Hanna, M.; Banks, E.; Sivachenko, A.; Cibulskis, K.; Kernytsky, A.; garimella, K.; Altshuler, D.; Gabriel, S.; Daly, M.; et al. The Genome Analysis Toolkit: A MapReduce framework for analyzing next-generation DNA sequencing data. Genome Res. 2010, 20, 1297–1303. [Google Scholar] [CrossRef] [PubMed] [Green Version]
  61. Altschul, S.F.; Gish, W.; Miller, W.; Myers, E.W.; Lipman, D.J. Basic local alignment search tool. J. Mol. Biol. 1990, 215, 403–410. [Google Scholar] [CrossRef]
  62. Ellegren, H. The Evolutionary Genomics of Birds. Annu. Rev. Ecol. Evol. Syst. 2013, 44, 239–259. [Google Scholar] [CrossRef]
  63. Sohn, J.-I.; Nam, K.; Hong, H.; Kim, J.-M.; Lim, D.; Lee, K.-T.; Do, Y.J.; Cho, C.Y.; Kim, N.; Chai, H.H.; et al. Whole genome and transcriptome maps of the entirely black native Korean chicken breed Yeonsan Ogye. Gigascience 2018, 7. [Google Scholar] [CrossRef] [Green Version]
  64. Damas, J.; O’Connor, R.E.; Griffin, D.K.; Larkin, D.M. Avian Chromosomal Evolution. In Avian Genomics in Ecology and Evolution: From the Lab into the Wild; Kraus, R.H.S., Ed.; Springer International Publishing: Cham, Switzerland, 2019; pp. 69–92. [Google Scholar]
  65. Laine, V.N.; Gossmann, T.I.; Schachtschneider, K.M.; Garroway, C.J.; Madsen, O.; Verhoeven, K.J.F.; de Jager, V.; Megens, H.J.; Warren, W.C.; Minx, P.; et al. Evolutionary signals of selection on cognition from the great tit genome and methylome. Nat. Commun. 2016, 7, 10474. [Google Scholar] [CrossRef]
  66. Elgvin, T.O.; Trier, C.N.; Tørresen, O.K.; Hagen, I.J.; Lien, S.; Nederbragt, A.J.; Ravinet, M.; Jensen, H.; Saetre, G.P. The genomic mosaicism of hybrid speciation. Sci. Adv. 2017, 3, e1602996. [Google Scholar] [CrossRef] [PubMed]
  67. Kawakami, T.; Smeds, L.; Backström, N.; Husby, A.; Qvarnström, A.; Mugal, C.F.; Olason, P.; Ellegren, H. A high-density linkage map enables a second-generation collared flycatcher genome assembly and reveals the patterns of avian recombination rate variation and chromosomal evolution. Mol. Ecol. 2014, 23, 4035–4058. [Google Scholar] [CrossRef] [PubMed]
  68. Camacho, C.; Coulouris, G.; Avagyan, V.; Ma, N.; Papadopoulos, J.; Bealer, K.; Madden, T.L. BLAST+: Architecture and applications. BMC Bioinform. 2009, 10, 421. [Google Scholar] [CrossRef] [PubMed]
  69. Smeds, L.; Warmuth, V.; Bolivar, P.; Uebbing, S.; Burri, R.; Suh, A.; NAter, A.; Bureš, S.; Garamszegi, L.Z.; Hogner, S.; et al. Evolutionary analysis of the female-specific avian W chromosome. Nat. Commun. 2015, 6, 7330. [Google Scholar] [CrossRef] [PubMed] [Green Version]
  70. Bellott, D.W.; Skaletsky, H.; Cho, T.-J.; Brown, L.; Locke, D.; Chen, N.; Galkina, S.; Pyntikova, T.; Koutseva, N.; Graves, T.; et al. Avian W and mammalian Y chromosomes convergently retained dosage-sensitive regulators. Nat. Genet. 2017, 49, 387–394. [Google Scholar] [CrossRef] [PubMed] [Green Version]
  71. Paten, B.; Earl, D.; Nguyen, N.; Diekhans, M.; Zerbino, D.; Haussler, D. Cactus: Algorithms for genome multiple sequence alignment. Genome Res. 2011, 21, 1512–1528. [Google Scholar] [CrossRef] [PubMed] [Green Version]
  72. Liu, D.; Hunt, M.; Tsai, I.J. Inferring synteny between genome assemblies: A systematic evaluation [Internet]. BMC Bioinform. 2018. [CrossRef] [PubMed]
  73. R Core Team. R: A language and environment for statistical computing [Internet]. Vienna, Austria. 2019. Available online: https://www.R.-project.org/ (accessed on 22 August 2019).
  74. Gu, Z.; Gu, L.; Eils, R.; Schlesner, M.; Brors, B. circlize Implements and enhances circular visualization in R. Bioinformatics 2014, 30, 2811–2812. [Google Scholar] [CrossRef] [PubMed]
  75. Gel, B.; Serra, E. karyoploteR: An R/Bioconductor package to plot customizable genomes displaying arbitrary data. Bioinformatics 2017, 33, 3088–3090. [Google Scholar] [CrossRef]
  76. Peona, V.; Weissensteiner, M.H.; Suh, A. How complete are “complete” genome assemblies?—An avian perspective. Mol. Ecol. Resour. 2018, 18, 1188–1195. [Google Scholar] [CrossRef]
  77. Wright, N.A.; Gregory, T.R.; Witt, C.C. Metabolic “engines” of flight drive genome size reduction in birds. Proc. Biol. Sci. 2014, 281, 20132780. [Google Scholar] [CrossRef] [PubMed]
  78. Dolezel, J.; Bartos, J.; Voglmayr, H.; Greilhuber, J. Nuclear DNA content and genome size of trout and human. Cytom. Part A J. Int. Soc. Anal. Cytol. 2003, 51, 127–128, author reply 129. [Google Scholar]
  79. Li, H. Seqtk: A fast and lightweight tool for processing FASTA or FASTQ sequences. Available online: https://github.com/lh3/seqtk (accessed on 22 August 2019).
  80. Simão, F.A.; Waterhouse, R.M.; Ioannidis, P.; Kriventseva, E.V.; Zdobnov, E.M. BUSCO: Assessing genome assembly and annotation completeness with single-copy orthologs. Bioinformatics 2015, 31, 3210–3212. [Google Scholar]
  81. Waterhouse, R.M.; Seppey, M.; Simão, F.A.; Manni, M.; Ioannidis, P.; Klioutchnikov, G.; Kriventseva, E.V.; Zdobnov, E.M. BUSCO applications from quality assessments to gene prediction and phylogenomics. Mol. Biol. Evol. 2017. [Google Scholar] [CrossRef] [PubMed]
  82. Waterhouse, R.M.; Zdobnov, E.M.; Kriventseva, E.V. Correlating traits of gene retention, sequence divergence, duplicability and essentiality in vertebrates, arthropods, and fungi. Genome Biol. Evol. 2011, 3, 75–86. [Google Scholar] [CrossRef] [PubMed]
  83. Waterhouse, R.M.; Tegenfeldt, F.; Li, J.; Zdobnov, E.M.; Kriventseva, E.V. OrthoDB: A hierarchical catalog of animal, fungal and bacterial orthologs. Nucleic Acids Res. 2013, 41, D358–D365. [Google Scholar] [CrossRef] [PubMed]
  84. Suh, A.; Paus, M.; Kiefmann, M.; Churakov, G.; Franke, F.A.; Brosius, J.; Kriegs, J.O.; Schmitz, J. Mesozoic retroposons reveal parrots as the closest living relatives of passerine birds. Nat. Commun. 2011, 2, 443. [Google Scholar] [CrossRef]
  85. Faircloth, B.C.; McCormack, J.E.; Crawford, N.G.; Harvey, M.G.; Brumfield, R.T.; Glenn, T.C. Ultraconserved elements anchor thousands of genetic markers spanning multiple evolutionary timescales. Syst. Biol. 2012, 61, 717–726. [Google Scholar] [CrossRef]
  86. Faircloth, B.C. PHYLUCE is a software package for the analysis of conserved genomic loci. Bioinformatics 2016, 32, 786–788. [Google Scholar] [CrossRef]
  87. Kent, W.J.; Sugnet, C.W.; Furey, T.S.; Roskin, K.M.; Pringle, T.H.; Zahler, A.M.; Haussler, D. The human genome browser at UCSC. Genome Res. 2002, 12, 996–1006. [Google Scholar] [CrossRef]
  88. Eaton, D.A.R.; Overcast, I. ipyrad: Interactive assembly and analysis of RADseq data sets. WWW document. Available online: http://ipyrad.readthedocs.io/ (accessed on 1 August 2016).
  89. Stamatakis, A. RAxML version 8: A tool for phylogenetic analysis and post-analysis of large phylogenies. Bioinformatics 2014, 30, 1312–1313. [Google Scholar] [CrossRef]
  90. Andrews, C.B.; Gregory, T.R. Genome size is inversely correlated with relative brain size in parrots and cockatoos. Genome 2009, 52, 261–267. [Google Scholar] [CrossRef]
  91. Weissensteiner, M.H.; Pang, A.W.C.; Bunikis, I.; Höijer, I.; Vinnere-Petterson, O.; Suh, A.; Wolf, J.B.W. Combination of short-read, long-read, and optical mapping assemblies reveals large-scale tandem repeat arrays with population genetic implications. Genome Res. 2017, 27, 697–708. [Google Scholar] [CrossRef] [PubMed] [Green Version]
  92. Dickinson, E.C.; Christidis, L. The Howard and Moore complete checklist of the birds of the World: Passerines; Aves Press: Eastbourne, UK, 2014. [Google Scholar]
  93. O’Connor, R.E.; Farré, M.; Joseph, S.; Damas, J.; Kiazim, L.; Jennings, R.; Bennett, S.; Slack, E.A.; Allanson, E.; Larkin, D.M.; et al. Chromosome-level assembly reveals extensive rearrangement in saker falcon and budgerigar, but not ostrich, genomes. Genome Biol. 2018, 19, 171. [Google Scholar]
  94. Laine, V.N.; Gossmann, T.I.; van Oers, K.; Visser, M.E.; Groenen, M.A.M. Exploring the unmapped DNA and RNA reads in a songbird genome. BMC Genom. 2019, 20, 19. [Google Scholar] [CrossRef] [PubMed]
  95. Li, W.; Freudenberg, J. Mappability and read length. Front. Genet. 2014, 5, 381. [Google Scholar] [CrossRef]
  96. Prost, S.; Armstrong, E.E.; Nylander, J.; Thomas, G.W.C.; Suh, A.; Petersen, B.; Dalen, L.; Benz, B.W.; Blom, M.P.K.; Palkopoulou, E.; et al. Comparative analyses identify genomic features potentially involved in the evolution of birds-of-paradise. Gigascience 2019, 8. [Google Scholar] [CrossRef]
  97. Andersen, M.J.; McCullough, J.M.; Mauck, W.M.I.I.I.; Smith, B.T.; Moyle, R.G. A phylogeny of kingfishers reveals an Indomalayan origin and elevated rates of diversification on oceanic islands. J. Biogeogr. 2018, 45, 269–281. [Google Scholar] [CrossRef]
  98. White, N.D.; Mitter, C.; Braun, M.J. Ultraconserved elements resolve the phylogeny of potoos (Aves: Nyctibiidae). J. Avian Biol. 2017, 48, 872–880. [Google Scholar] [CrossRef]
  99. Moyle, R.G.; Oliveros, C.H.; Andersen, M.J.; Hosner, P.A.; Benz, B.W.; Manthey, J.D.; Travers, S.L.; Brown, R.M.; Faircloth, B.C. Tectonic collision and uplift of Wallacea triggered the global songbird radiation. Nat. Commun. 2016, 7, 12709. [Google Scholar] [CrossRef] [PubMed]
  100. Manthey, J.D.; Campillo, L.C.; Burns, K.J.; Moyle, R.G. Comparison of Target-Capture and Restriction-Site Associated DNA Sequencing for Phylogenomics: A Test in Cardinalid Tanagers (Aves, Genus: Piranga). Syst. Biol. 2016, 65, 640–650. [Google Scholar] [CrossRef] [PubMed]
  101. Musher, L.J.; Cracraft, J. Phylogenomics and species delimitation of a complex radiation of Neotropical suboscine birds (Pachyramphus). Mol. Phylogenet. Evol. 2018, 118, 204–221. [Google Scholar] [CrossRef] [PubMed]
  102. Andermann, T.; Fernandes, A.M.; Olsson, U.; Töpel, M.; Pfeil, B.; Oxelman, B.; et al. Allele Phasing Greatly Improves the Phylogenetic Utility of Ultraconserved Elements. Syst. Biol. 2019, 68, 32–46. [Google Scholar]
  103. Bukowicki, M.; Franssen, S.U.; Schlötterer, C. High rates of phasing errors in highly polymorphic species with low levels of linkage disequilibrium. Mol. Ecol. Resour. 2016, 16, 874–882. [Google Scholar] [CrossRef] [PubMed] [Green Version]
  104. Cariou, M.; Duret, L.; Charlat, S. Is RAD-seq suitable for phylogenetic inference? An in silico assessment and optimization. Ecol. Evol. 2013, 3, 846–852. [Google Scholar] [CrossRef] [PubMed]
  105. Eaton, D.A.R.; Spriggs, E.L.; Park, B.; Donoghue, M.J. Misconceptions on Missing Data in RAD-seq Phylogenetics with a Deep-scale Example from Flowering Plants. Syst. Biol. 2017, 66, 399–412. [Google Scholar] [CrossRef] [PubMed]
  106. Del Hoyo, J.; Elliott, A.; Sargatal, J.; Christie, D.A.; de Juana, E. Handbook of the birds of the world alive; Lynx Edicions: Barcelona, Spain, 2014. [Google Scholar]
Figure 1. Chromosome ideogram. The black vertical lines represent UCE (Ultra Conserved Elements) placement in chromosome and the gray links represent large structural variants (insertions/deletions, inversions, duplications and rearrangements) over 30 Kb in size. The green rectangle represents two scaffolds that were homologous to Chr5 and Chr1 in multireference assembly, and the yellow rectangle represents scaffolds placed on Chr4 on single-reference assemblies.
Diversity 11 00144 g001
Figure 2. Benchmarking Universal Single-Copy Orthologs version 3 (BUSCO) results for R. melanosticta plus eight related (Eufalconimorphae) non-model genomes. The phylogenetic relationships are based on previous work [8,18]. Bars represent the proportion of complete (blue), fragmented (pink), and missing BUSCOs (gold) for each genome.
Diversity 11 00144 g002
Figure 3. Synteny plots between single-reference-based genome assemblies (lower-half of the circle, reference taxa represented by bottom right figures: Taeniopygia guttata (A); Ficedula albicollis (B); Passer domesticus (C); Parus major (D); Strigops habroptila (E); Falco peregrinus (F); Calypte anna (G); Columba livia (H); Gallus gallus (I)) and multiple-reference-based genome assembly (top-half circle highlighted by blue line, represented by top left figure of Rhegmatorhina melanosticta). The red segments at the end of the single-reference and beginning of the multiple-reference genomes correspond to unplaced scaffolds.
Diversity 11 00144 g003
Table 1. List of genomes used as reference to Rhegmatorhina melanosticta genome assembly.
OrderSpeciesN50 scaf (Mb)N50 ContigCoverageBioProjectAccessionSize (Gb)Scaffolds
GalliformesGallus gallus90.11639,813248.3×PRJNA412424GCA_002798355.11.021822
ColumbiformesColumba livia24.5427,69760×PRJNA347893GCA_001887795.11.0291
ApodiformesCalypte anna74.114,522,32754×PRJNA489139GCA_003957555.11.06159
FalconiformesFalco peregrinus26.7833,994137.6PRJNA347893GCA_001887755.11.1172
PsittaciformesStrigops habroptila83.29,454,10076.1PRJNA489135GCA_004027225.11.17100
PasseriformesTaeniopygia guttata70.4311,998,82788.2PRJNA489098GCA_003957565.11.06134
PasseriformesFicedula albicollis6.54410,96460×PRJNA208061GCA_000247815.21.1221836
PasseriformesParus major71.37148,69395×PRJNA312399GCA_001522545.31.021675
PasseriformesPasser domesticus6.3751,426130×PRJNA255814GCA_001700915.11.042571
PasseriformesRhegmatorhina melanosticta3.3136,76038×PRJNA561634Pending1.03165
Table 2. Comparison of assemblies of R. melanosticta based on multiple references (first column: Ragout [39], references marked by an asterisk) and single reference genome assembly (Chromosomer [30]) corresponding to column names. Mapped refers to number of scaffolds mapped to genome (Ragout) or the sum of mapped and unlocalized (mapped to chromosome but with final position undefined) scaffolds in Chromosomer. The references are listed from furthest to closest in phylogenetic distance (passerines are listed alphabetically as they are equidistant to suboscine).
RagoutChickenRock PigeonAnna’s HummingbirdPeregrineFalconKakapo *Collard Flycatcher *Great Tit *House Sparrow *Zebra Finch *
Mapped595662577622676691667691677695
Unplaced1205313893392448243820
Chromosomes27342933323031383031
Gaps inserted (Mb)42.80.180.120.150.160.180.160.170.160.16
Table 3. Comparison of the Rhegmatorhina melanosticta linked-read de novo assembly with PacBio long-read bird assemblies. Expected genome size is based on chromosome density from flow cytometry (from [76,77,90]). Missing (Mb) is an estimate of unsequenced genome (expected assembly size subtracted from the assembly size [76]). Gaps is the total number of “N”s in the assembly. The percentage of missing sequence is the sum of unsequenced genome and gap length relative to expected genome size. Corvus cornix GenBank accession number: GCA_002023255.2 [91].
TaxonScaffoldsExpected Size (Gb)Assembly Size (Gb)Missing (Mb)Gaps (Mb)% Missing
Calypte anna1591.141.0680.316.18.5
Corvus cornix1451.191.051449.612.9
Gallus gallus18211.251.0219919.219.9
Rhegmatorhina melanosticta7151.31.0327012.221
Strigops habroptilus991.281.17115.527.611.2
Taeniopygia guttata1341.221.061922.313.6

