Article

Genetic Data Suggest Multiple Introductions of the Lionfish (Pterois miles) into the Mediterranean Sea

by
Andreas C. Dimitriou
1,*,
Niki Chartosia
1,
Jason M. Hall-Spencer
2,3,
Periklis Kleitou
2,4,
Carlos Jimenez
5,
Charalampos Antoniou
4,
Louis Hadjioannou
5,
Demetris Kletou
4 and
Spyros Sfenthourakis
1
1
Department of Biological Sciences, University of Cyprus, Panepistimiou Str. 1, Aglantzia, 2109 Nicosia, Cyprus
2
School of Biological and Marine Sciences, University of Plymouth, Plymouth PL4 8AA, UK
3
Shimoda Marine Research Center, University of Tsukuba, Shizuoka 415-0025, Japan
4
Marine and Environmental Research (MER) Lab Ltd., Cyprus. 202 Amathountos Avenue, Marina Gardens, 4533 Limassol, Cyprus
5
Enalia Physis Environmental Research Centre, Acropoleos 2, Aglantzia, 2101 Nicosia, Cyprus
*
Author to whom correspondence should be addressed.
Submission received: 7 June 2019 / Revised: 20 August 2019 / Accepted: 23 August 2019 / Published: 27 August 2019
(This article belongs to the Special Issue Biological Invasions 2020 Horizon)

Abstract

:
Widespread reports over the last six years confirm the establishment of lionfish (Pterois miles) populations in the eastern Mediterranean. Accumulated knowledge on lionfish invasions in the western Atlantic Ocean has shown that it is a successful invader and can have negative impacts on native species, indirect ecological repercussions and economic effects on local human societies. Here we analysed genetic sequences of lionfish from Cyprus as well as data from the whole distribution of the species, targeting the mtDNA markers cytochrome c oxidase subunit 1 (COI) and the control region (CR). Our results reflect a pattern of repeated introductions into the Mediterranean from the northern Red Sea and a secondary spread of this species west to Rhodes and Sicily. Presented results agree with previously published studies highlighting the genetic similarity with individuals from the northern Red Sea. Nevertheless, some individuals from Cyprus, in addition to those coming via the Suez Canal, were genetically similar to fish from the Indian Ocean, indicating genetic homogeneity among populations of P. miles across its current distribution, possibly facilitated by the ornamental fish trade and/or transport through ballast water.

1. Introduction

Invasive species are one of the main threats to biodiversity and natural resources, as they can cause severe changes in marine ecosystems [1,2,3]. The negative impacts often include alterations in the structure of marine communities and ecosystem services, with significant economic cost and even impacts on human health [4,5,6]. Monitoring, understanding and predicting the impacts of marine invasions has attracted much scientific interest [7,8]. The Mediterranean Sea is a biodiversity hotspot, as it currently hosts circa 17,000 known species, including more than 600 established alien spp., although its volume and surface are less than 1% of the world’s oceans [3,9,10].
Climate change is considered to be one of the main factors that facilitated the establishment of thermophilic species that manage to reach the Mediterranean through the Suez Canal [11,12]. The Suez Canal is the main source of origin of alien species in the Mediterranean Sea; 13 out of the first 14 species that invaded at the beginning of the past century and 64% of the total number of species currently found in the Mediterranean are Lessepsian migrants (reached the Mediterranean Sea through the Suez canal from the Red Sea [9,13,14]).
The lionfish, Pterois miles (Bennett, 1828) is one of the most successful marine invaders, exhibiting a set of behavioral and life-history traits that enables it to proliferate and establish alien populations [15,16]. The native distribution of P. miles includes the Indian Ocean, the Red Sea and some parts of Indonesia [17]. It has now spread throughout the Caribbean, the western Atlantic Ocean and recently into the Mediterranean Sea. More than 150 published studies in the last five years have focused on the western Atlantic region and documented impacts of the invasion of congeneric Pterois miles and P. volitans on local biodiversity, ecosystem services and the economy [3,16,18]. The presence of lionfish off the southeast coast of the USA was recorded for the first time in 1985 [19]. Less than 20 years later lionfish abundance was comparable to that of very common native species (e.g., Mycteroperca phenax (Jordan and Swain, 1884 [20])). Currently, lionfish presence has expanded, reaching the southeast coast of Brazil [21]. Based on genetic data, the spread of lionfish in the Caribbean and in the Mediterranean has been attributed to human activities such as the ornamental fish trade and the opening/widening of the Suez Canal, respectively [22,23,24,25,26]. Founder effects, bottlenecks, genetic drift and rapid population expansions are the main factors that determined the genetic profile of P. volitans in the Atlantic Ocean [27]. The close evolutionary relation of the congeneric species P. volitans and P. miles that invaded the western Atlantic Ocean and the Mediterranean, respectively, is highlighted by their ability to hybridize [28]. We still need to evaluate the effects of the lionfish presence in the Mediterranean, including interactions with native taxa such as groupers and moray eels that are also present at its native distribution range [29,30].
P. miles was first recorded in the Mediterranean Sea in 1991, off Israel [31]. More than two decades later, in 2012, two individuals of the species were captured off the coast of Lebanon [32], while the records from Cyprus started in 2013 [29]. Invasion through the Suez Canal is indicated by genetic data [24]. Abundance patterns at the onset of the species establishment around Cyprus’ coastline exhibited a gradient of decreasing density from the southeastern part of the island, where it is now very common, to the southwestern part, where it is less abundant [33,34].
A recent study by Bariche et al. (2017) [24] that included individuals from Cyprus found low genetic diversity and the authors asserted that a few founder individuals may have been responsible for the invasion. Stern et al. (2018) [25] suggested there may have been more than one invasion of lionfish into the Levantine Sea. It is still unknown under which conditions this invasion took place, including whether it is ongoing with steady gene flow from the Red Sea to the Mediterranean. For this purpose, this study incorporates, for the first time, data from the whole range of the species’ distribution.
Here we investigated the genetic diversity patterns of individuals sampled from Cyprus, enriching our dataset with sequences from other regions of the species’ entire distribution in order to elucidate the invasion and establishment history of lionfish in the Mediterranean.

2. Materials and Methods

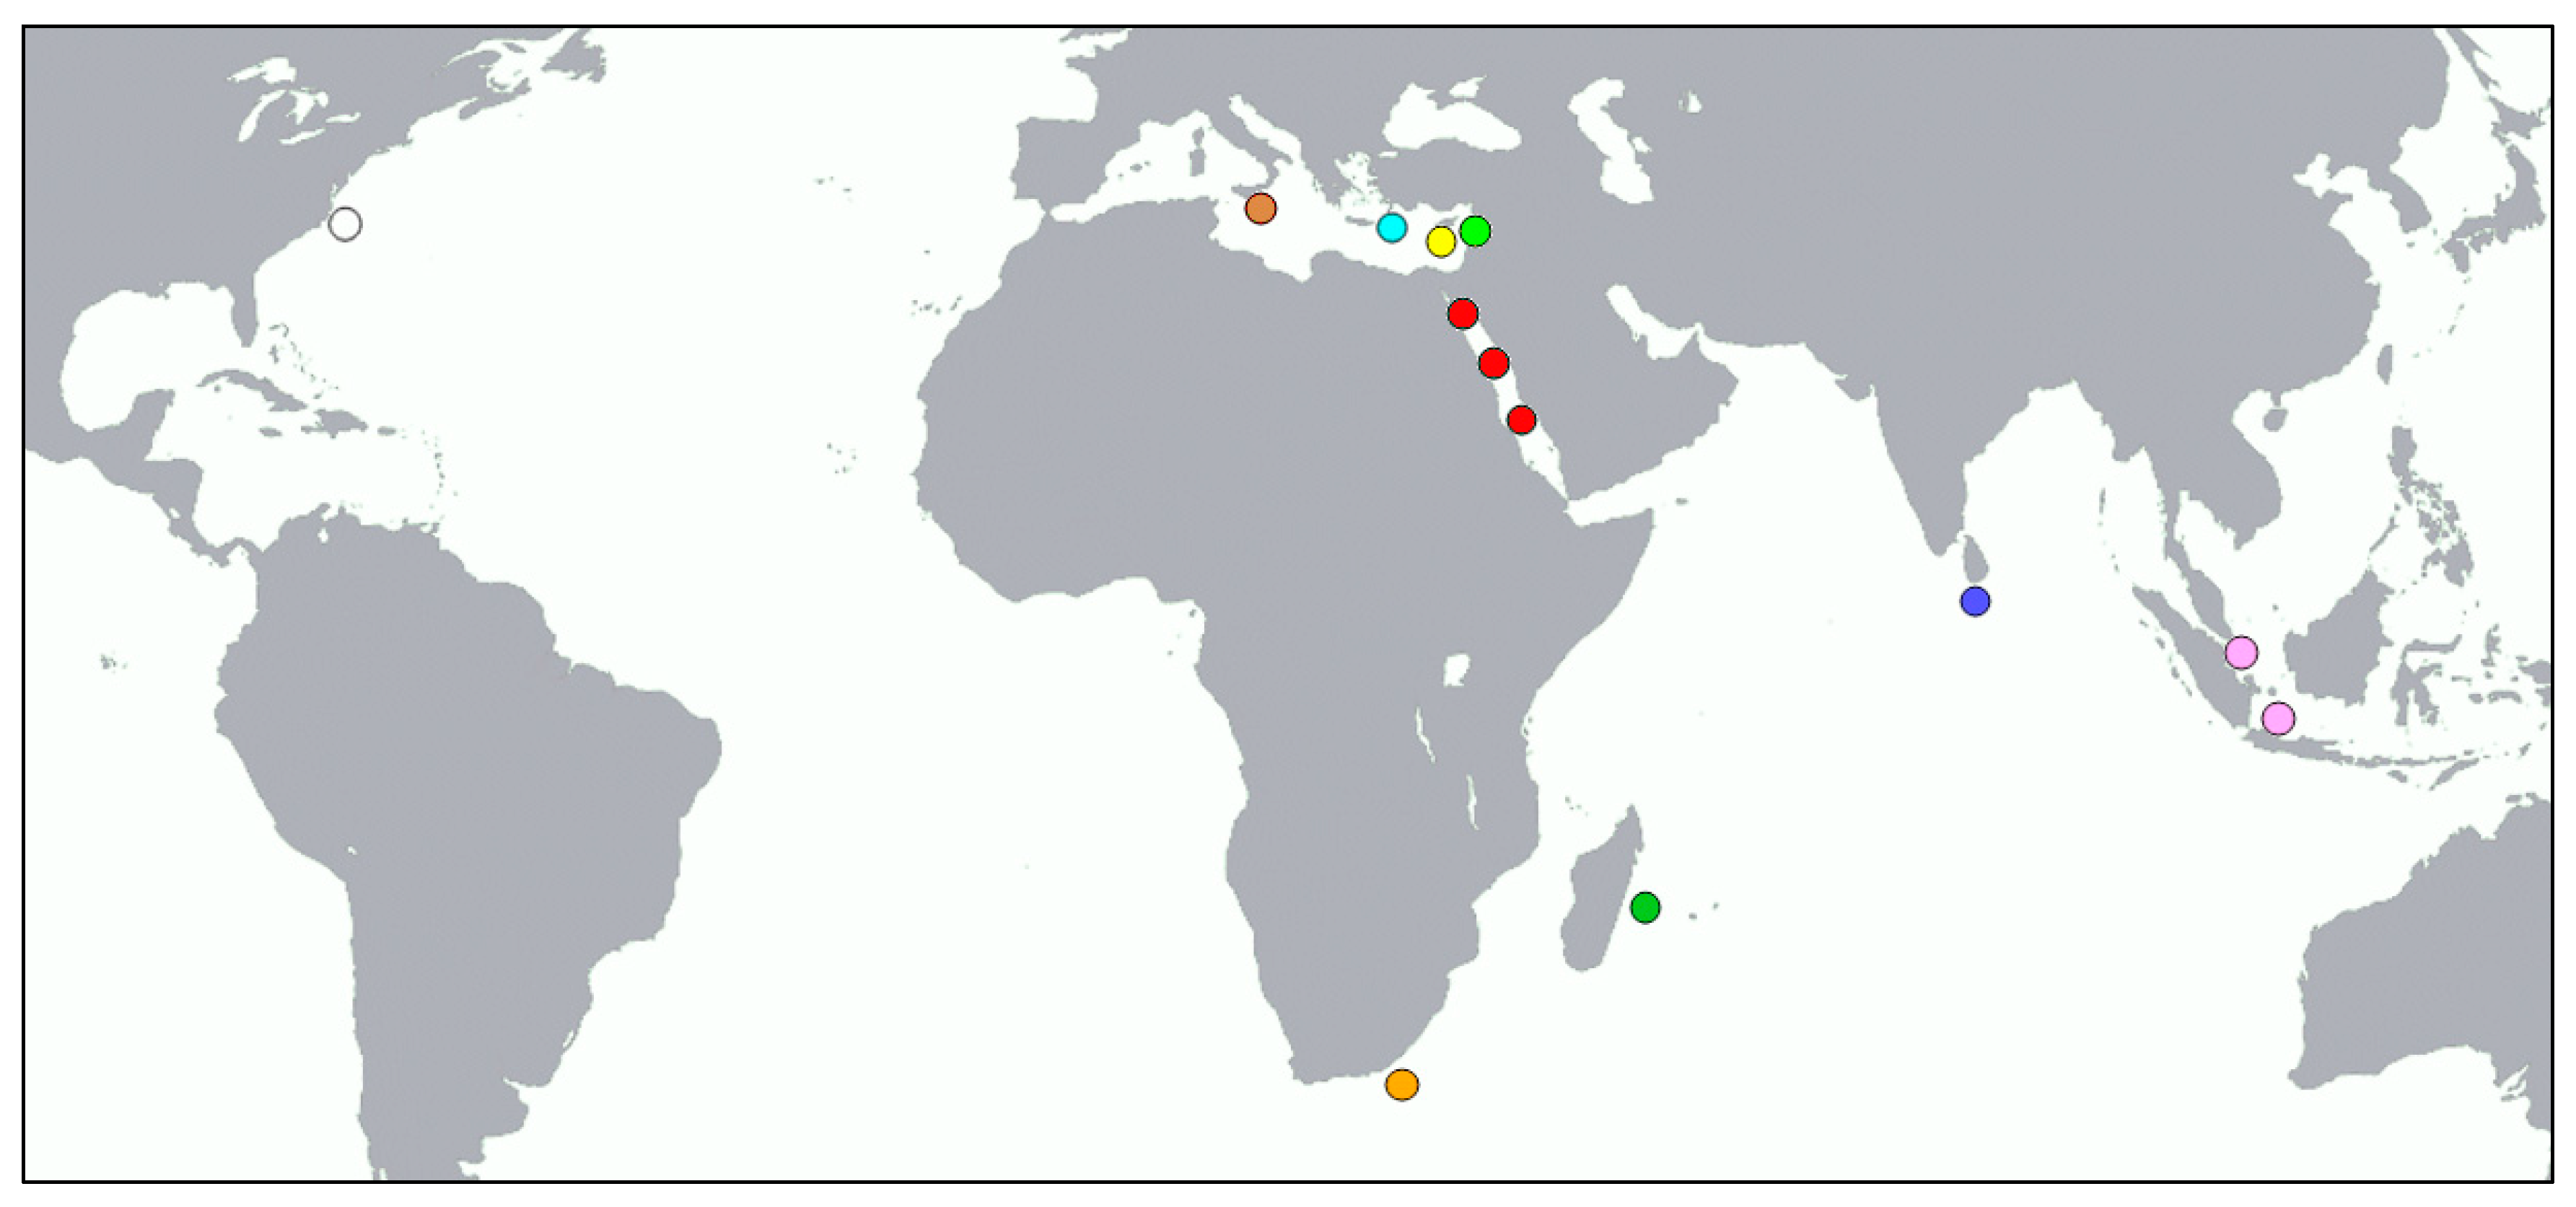
2.1. Sampling—DNA Extraction

The examined material was collected in the framework of the research program RELIONMED-LIFE (preventing a lionfish invasion in the mediterranean through early response and targeted removal) during scuba diving expeditions organized by the Marine and Environmental Research (MER) Lab Ltd. and the Enalia Physis Environmental Research Centre between September and October 2018 along the Cypriot coast. Immediately after collection, dorsal fins were taken from the samples and were placed in separate tubes containing 96% alcohol. All samples were stored at −20 °C until further laboratory analyses.
The great majority of the samples were collected from the southeastern coasts of the island where the population density was highest, but individuals from sites along the southern coasts of the island were also included in our analyses. In total, 56 individuals from 4 sampling sites were collected from Cyprus (Table S1).
Small pieces of fins were used for total genomic DNA extraction with DNeasy Blood and Tissue Kit (Qiagen, Hilden, Germany) following the manufacturer’s instructions. The final concentration and purity (A260/A280nm absorption rate) of DNA extractions were determined with NanoDrop 2000/200c (Thermo Fisher Scientific Inc., Waltham, MA, USA). In all cases the final DNA concentration was >100 ng/μL and the purity ratio >1.7.

2.2. Amplification and Sequencing

Cytochrome c oxidase subunit 1 (COI) gene and the control region (CR) were targeted following common PCR procedures for the amplification of the two regions using the primer pairs FISH-BCL/FISHCOIHBC [35,36] and universal CR-A/CR-E [37]. These mitochondrial loci were selected taking into account: (1) The availability of data already deposited in NCBI Genbank with which we can enrich our dataset and identify genetic similarities with populations/sources of introduction and (2) that the higher mutation rate of mtDNA compared to nDNA is more likely to provide useful information for tracking the invasion history of the species in the Mediterranean. Targeted loci were amplified in a Veriti thermocycler (Applied Biosystems, Foster City, CA, USA) with an initial denaturation step of 10 min at 94 °C, followed by 39 cycles of 1 min at 94 °C, 1 min at 52 °C and 1 min at 72 °C, with a final extension of 72 °C that lasted for 10 min. The final reaction volume in all cases was 20 μL, 0.1 of which was Kapa Taq DNA polymerase (5 U μL−1), 0.2 μL Kapa Taq DNA polymerase (5 U μL−1), 1.2 μL 25 mM MgCl2, 2 μL Kapa PCR buffer A, 0.6 μL 10mM dNTPs (Kapa, Sigma-Aldrich, St. Louis, MO, USA) 0.6 μL of each primer (10 μM) and > 20 ng DNA template. PCR products were purified with Qiaquick Purification Kit (Qiagen) following the manufacturer’s protocol. Purified products were sent to Macrogen (Amsterdam, the Netherlands) for sequencing on both strands.

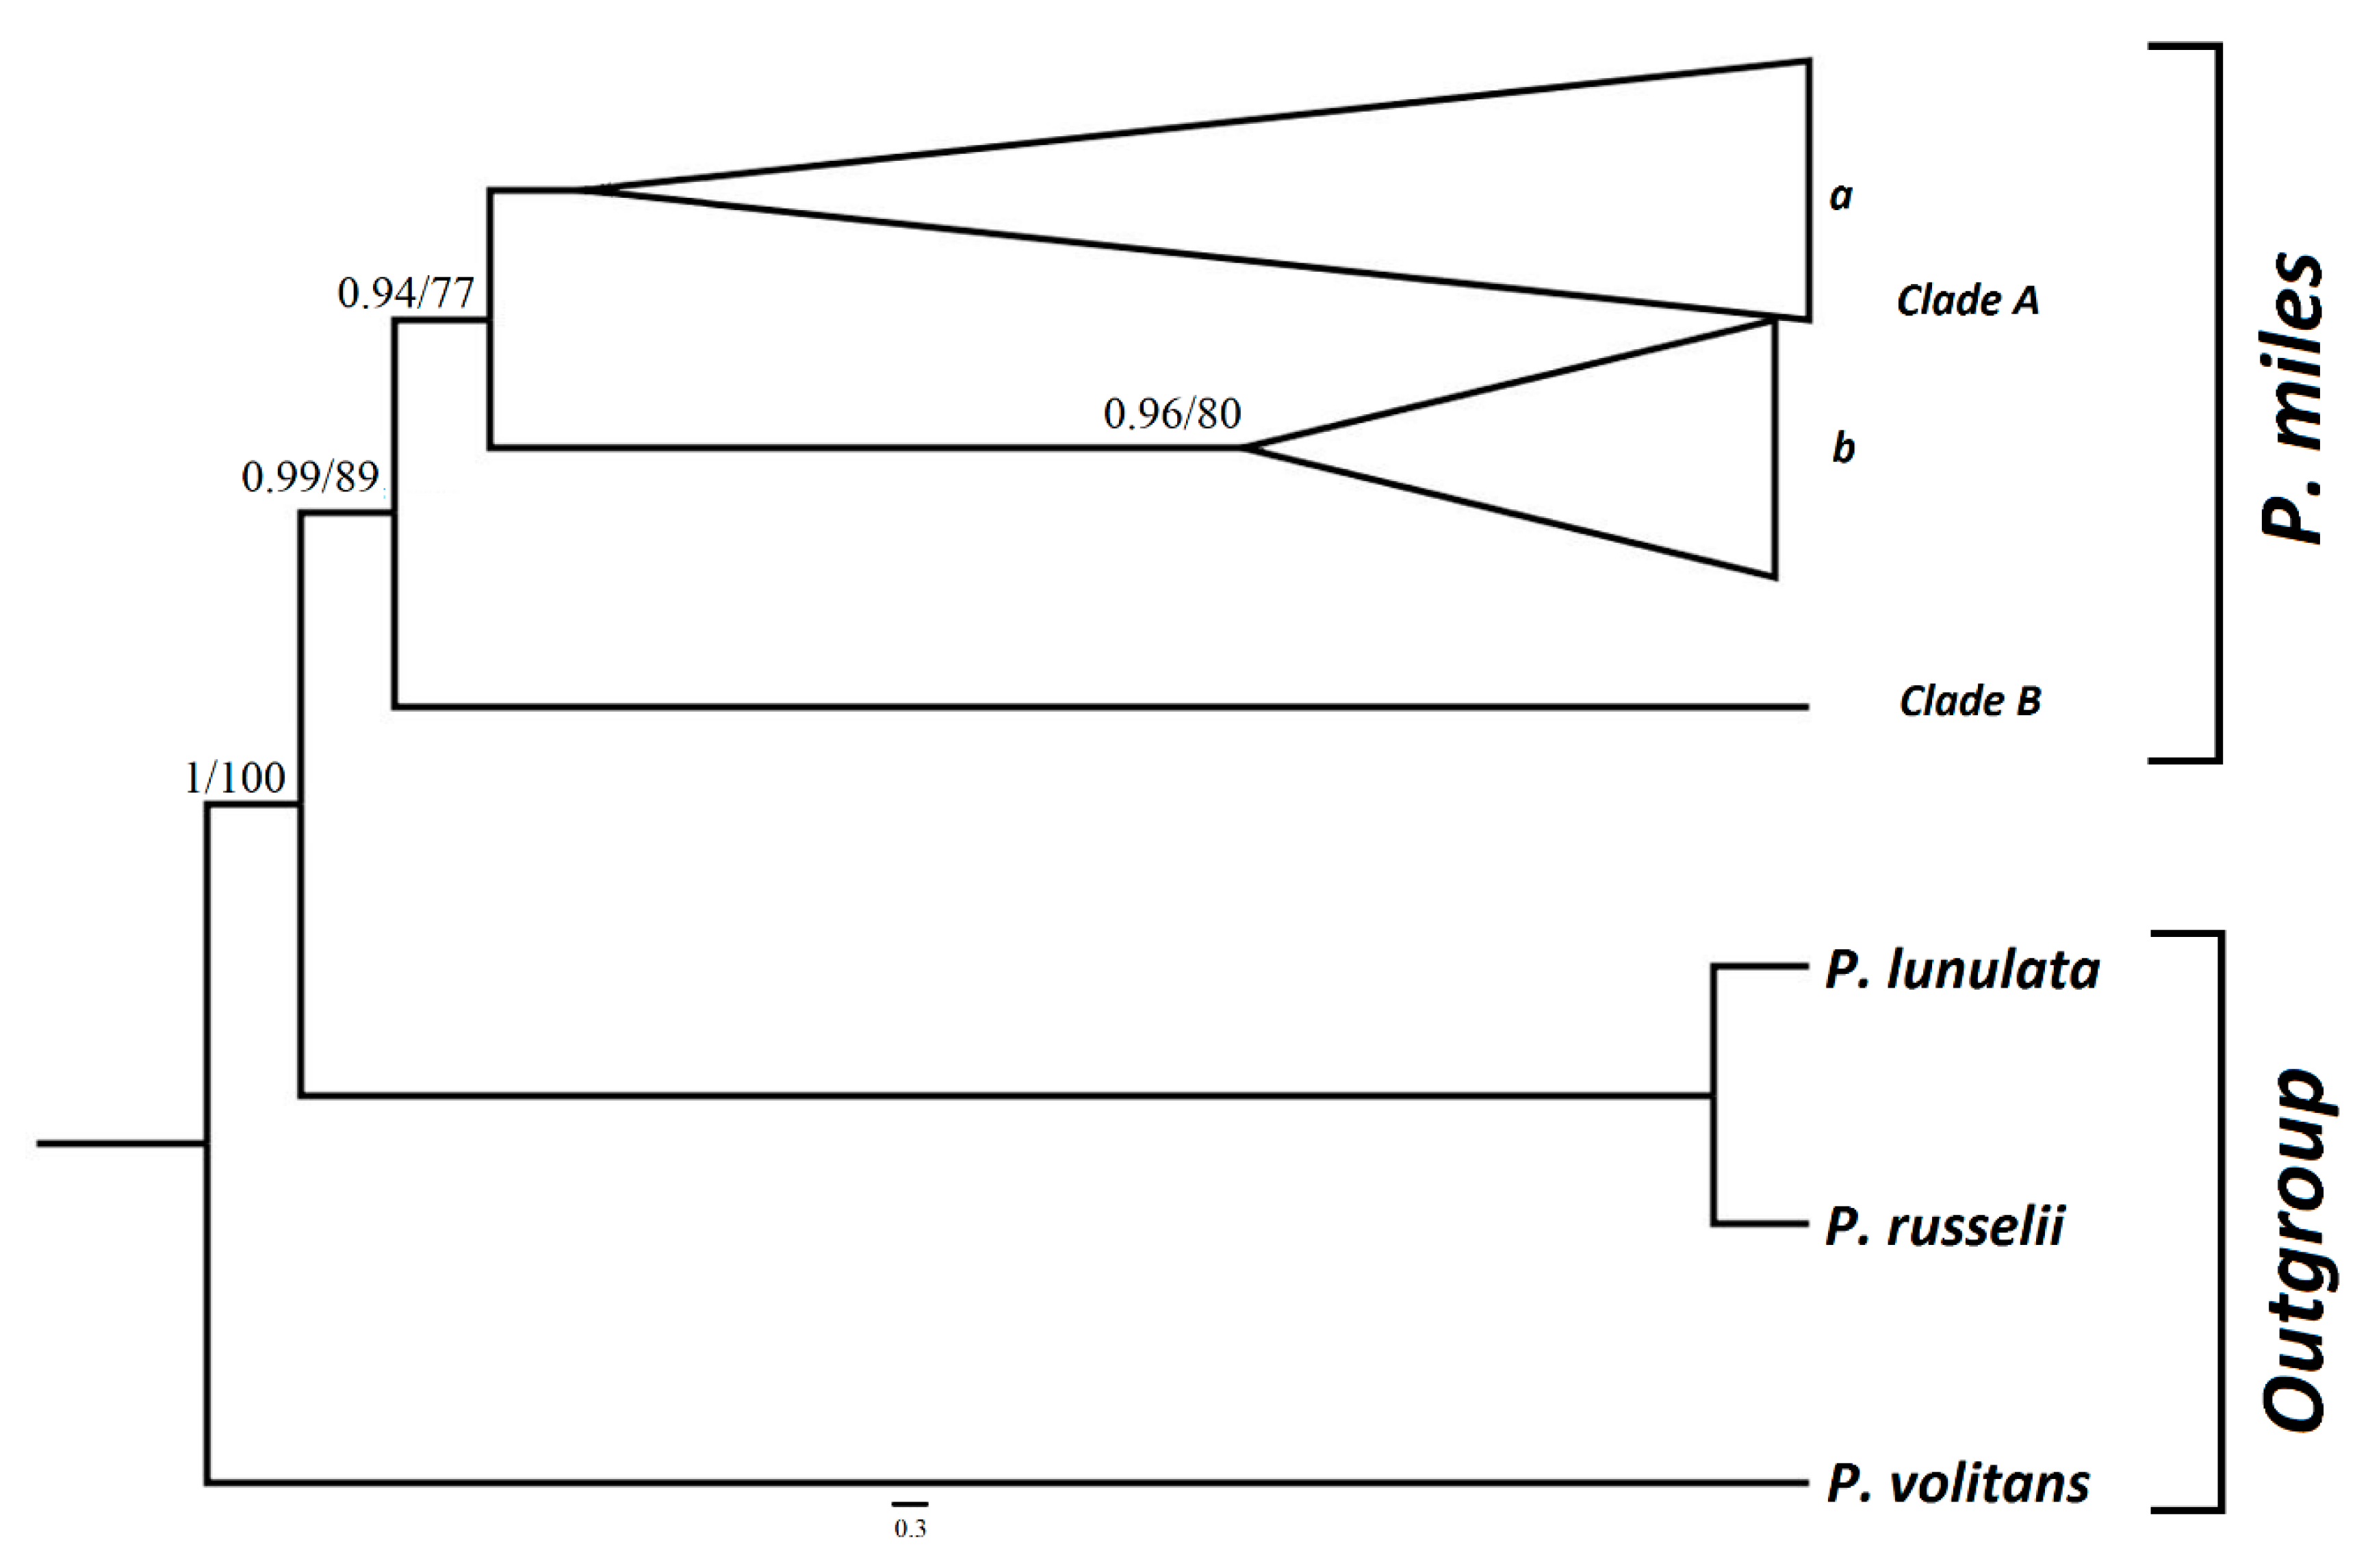
2.3. Data Elaboration and Phylogenetic Analyses

Sequencing results were reviewed and low quality ends were trimmed. The final dataset was enriched with available NCBI Genbank mtDNA sequences (Table S1). Available sequences of P. miles individuals from Genbank, representing the whole range of the species’ distribution, were also included (Figure 1). Additional sequences of the closely related species Pterois volitans, P. russelii and P. lunulata were also taken from the same database and included in the dataset as outgroups. Our final dataset included molecular data from 129 individuals (Table S1).
Multiple sequence alignments were performed with MAFFT v.7 [38]. Genetic divergence, as p-distance, which is the proportion of nucleotide sites at which two sequences being compared are different, within and between geographical groups of specimens and species were calculated using MEGA v.6.0 [39]. Likelihood scores for the selection of the best-fit nucleotide substitution model were calculated with jModelTest v.2.1.1 [40] using the following settings: Three substitution schemes, base frequencies estimation, gamma shape (four categories) and invariable sites estimation. Models including both gamma distribution and invariable sites were neglected [41]. The combined information from both sequenced loci were fed to MrBayes v.3.2.6 [42] and RAxML v.8.1.21 [43], where Bayesian inference (BI) and maximum likelihood (ML) phylogenetic analyses were implemented. In this way we tried to ascertain any possible phylogenetic signal provided by our data.
BI analysis was conducted with four independent runs and eight chains per run for 107 generations with a sampling frequency of 100. Hence, the analysis was based on 105 sampled trees from each run. Convergence among runs was monitored in MrBayes through the average standard deviation of split frequencies and by inspection of generation versus log probability of the data plot viewed in TRACER v.1.5.0 [44]. Finally, the 50% majority rule tree was constructed relying on 75,004 trees, since the 25% of sampled trees were discarded in the burn-in phase.

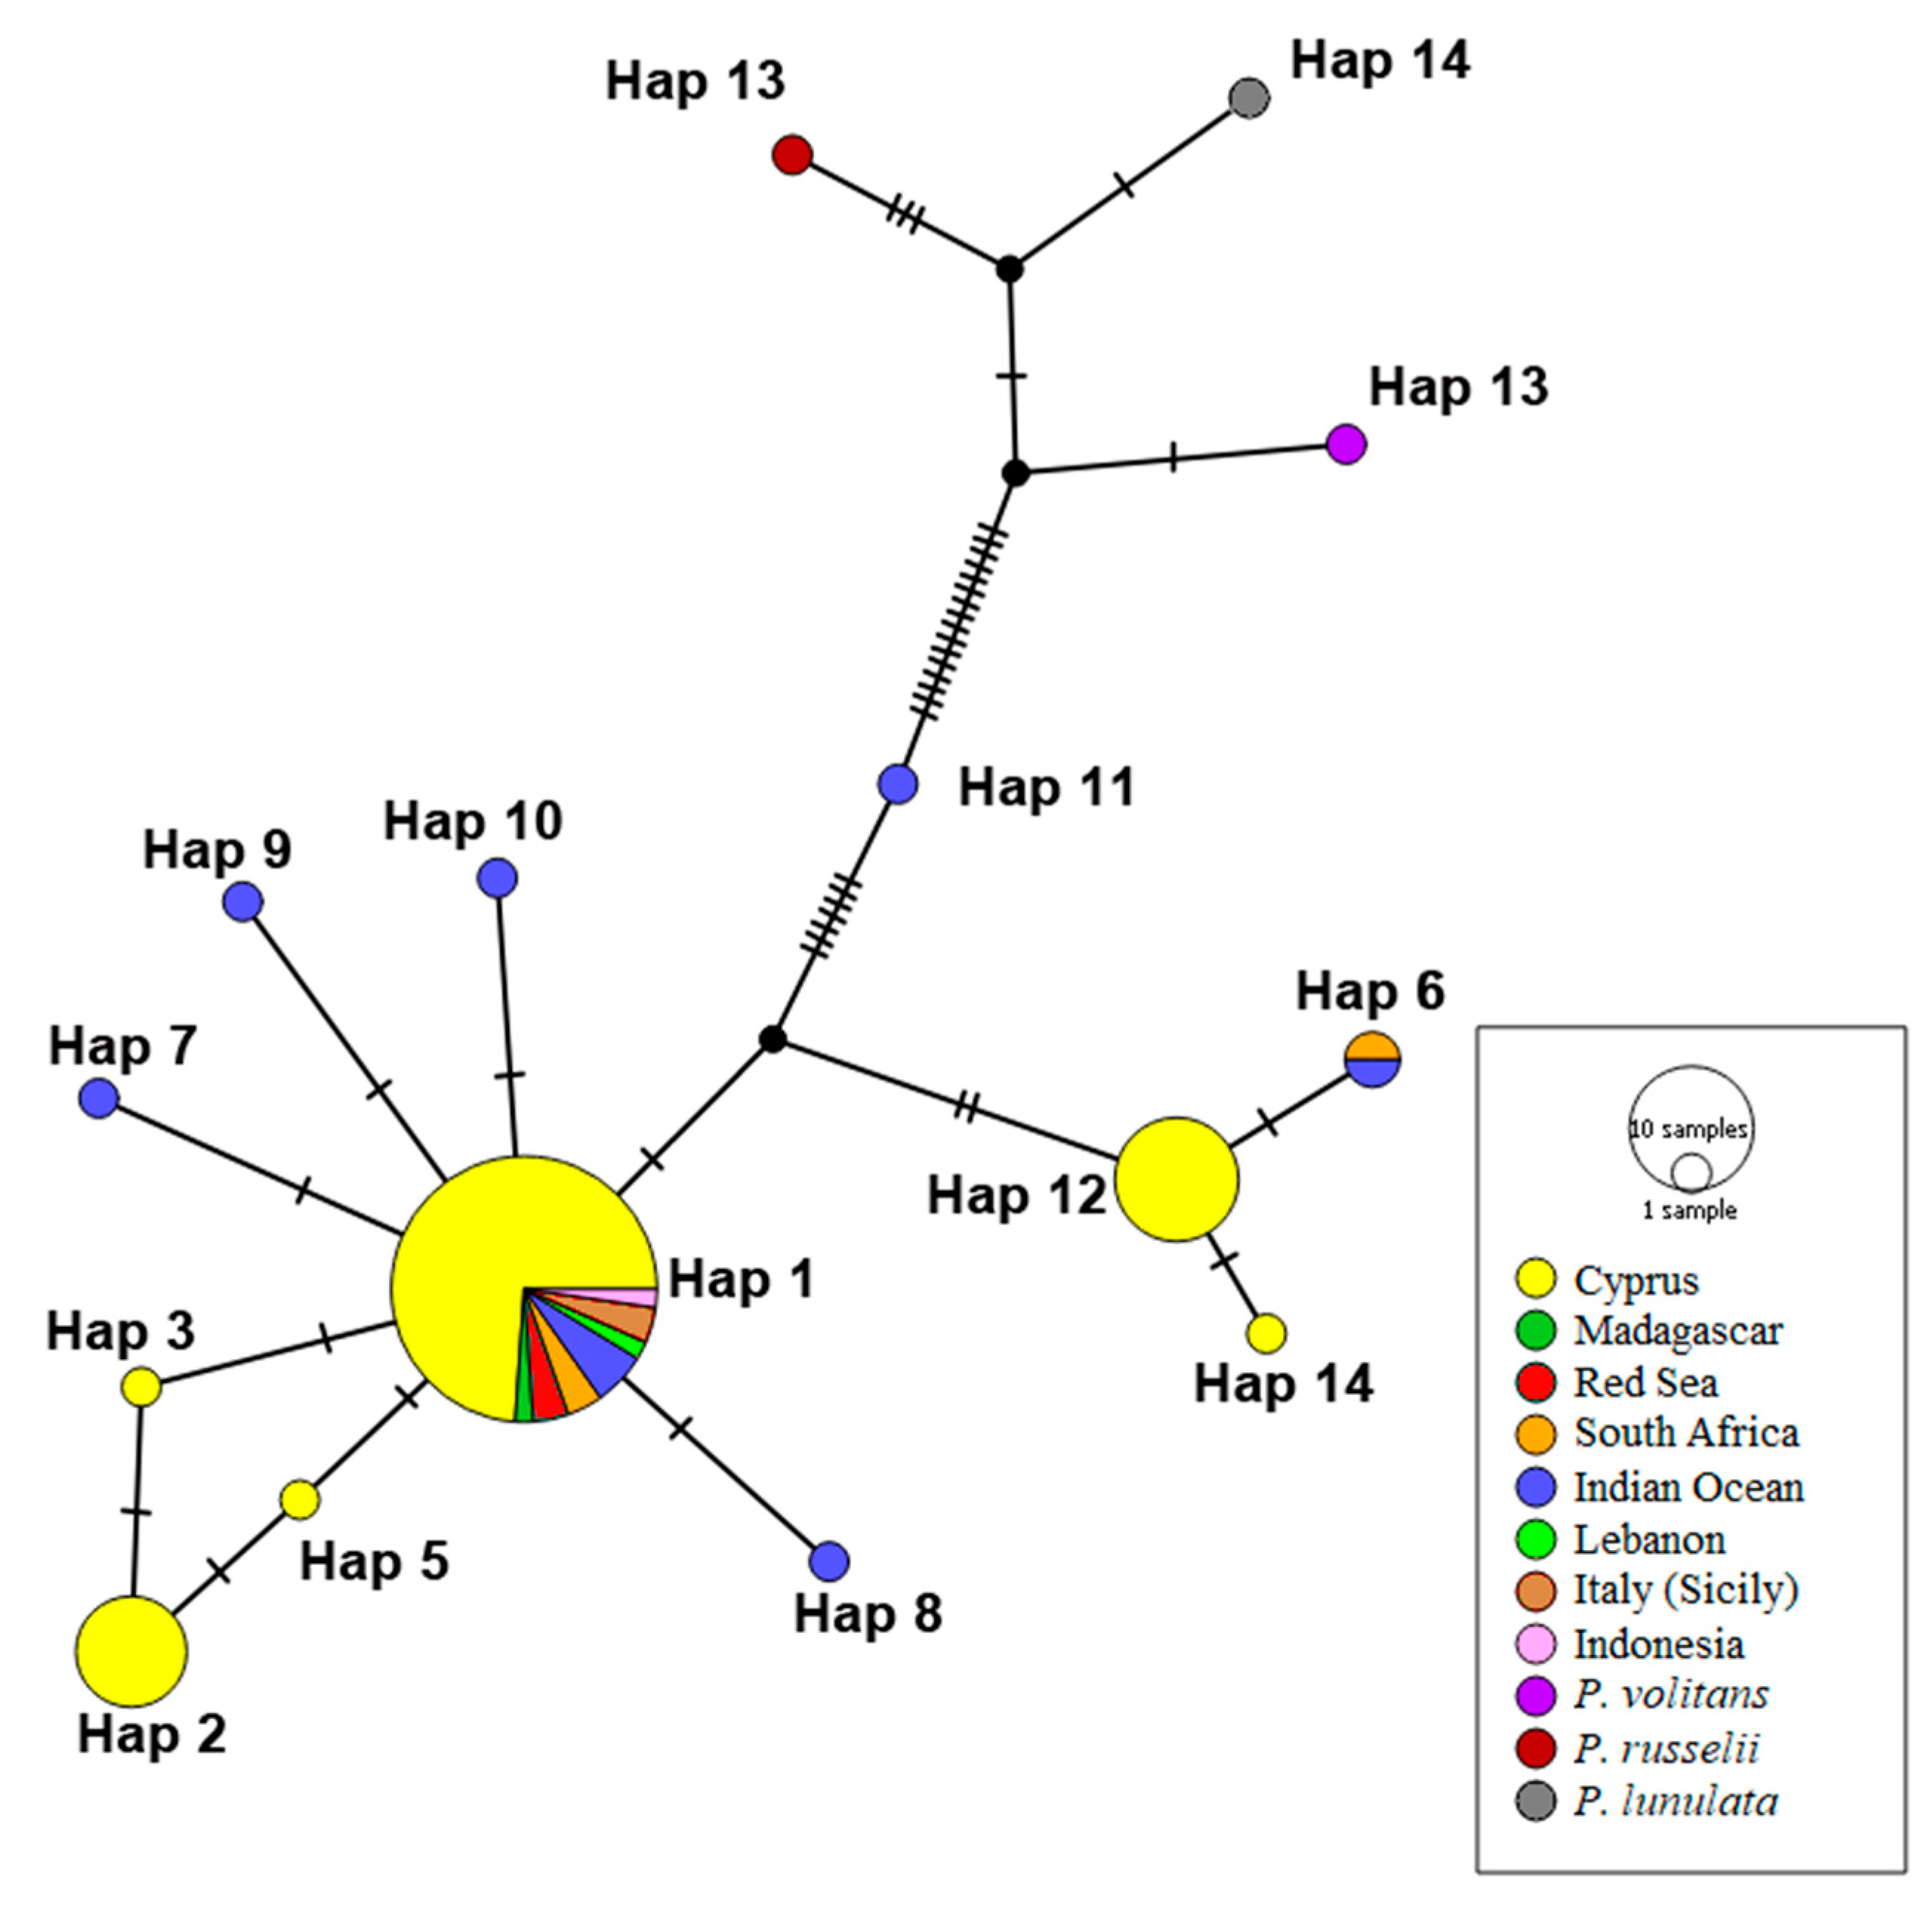
2.4. Geographic Population Structure—Haplotype Networks Construction

Analyses of molecular variance (AMOVA) and FST values were estimated using Arlequin v3.5.2.2 [45]. Prior to analysis, available sequences were assigned to different local groups according to their geographic origin. Furthermore, three regional groups were formed in order to make comparisons between larger geographic regions. In particular, the Mediterranean group included individuals from Cyprus, Lebanon, Rhodes and Sicily; the Indian Ocean group included individuals from Madagascar, South Africa, Sri Lanka and Indonesia; and the Red Sea regional group included individuals from the local Red Sea and Gulf of Aqaba groups. Two different datasets representing each targeted genetic locus were created. Different haplotype networks for each gene were constructed using PopART v.1.7 [46]. The haplotypes detected by the software were distinguished according to their origin using traits block. Median-joining network haplotype networks [47], presenting pies proportional in size to the frequency of each haplotype and with different colors indicating the origin of each haplotype, were constructed.

3. Results

Sequences from 56 individuals of P. miles sampled along Cypriot coasts were obtained and deposited in NCBI Genbank (Accession codes MN150185 - MN150294). Possible contamination from Numts (mitochondrial sequences of nuclear origin) for both targeted genes was eliminated by the unambiguous alignment of retrieved sequences and the high similarity with already published GenBank sequences. Furthermore, in the case of the COI gene, no gaps or internal stop codons were detected after translation [48].
Individuals from very distant and geographically separate areas revealed extremely low genetic diversity among examined P. miles samples. The final alignment, including data retrieved from NCBI Genbank, of the concatenated dataset of both sequenced genes consisted of 968 bp coming from 129 individuals. More specifically, out of 612 bp examined for COI including/excluding outgroup, 517/593 were conserved, 41/19 were variable and 31/6 parsimony informative. For CR, out of 356 inspected sites, 96/105 were conserved, 261/251 were variable and 244/242 parsimony informative.
Calculated mean genetic distances for COI between geographic groups were extremely low, varying from 0.00% to 0.58% The range of variation for CR is 0.00% to 2.88%. For both genes within geographic group genetic divergence was in many cases higher than between groups. In the case of individuals from the Mediterranean region in particular, the highest genetic divergence was identified within the Cyprus populations, reaching up to 0.26 and 1.06 for COI and CR, respectively. The highest values of genetic distance for CR were found between USA and the Indian Ocean and for COI between South Africa and the Indian Ocean groups (Table 1 and Table 2).
The best substitution model selected for the concatenated dataset under Akaike Information Criterion (AIC) [49] was GTR + I with –In = 1131.2262 for COI and HKY + G with –In = 925.0418 for CR. Separate phylogenetic analyses for each gene were also conducted. These analyses resulted in gene trees exhibiting polytomies, unresolved phylogenetic relationships and low statistical support values. Hence, they are not presented herein. Nevertheless, concatenated, partitioned dataset analyses separated available P. miles sequences into two distinct clades (Figure 2). Clade A is separated in two different sub-clades from which one is statistically supported. In subclade A(b), some individuals from Cyprus are grouped with samples from South Africa and the Indian Ocean (Figure 2 and Figure S1). Nevertheless, the majority of samples from these regions formed a second unsupported sub-clade. Even though it is grouped with the rest of P. miles specimens included in our analyses, a single individual from the Indian Ocean forms a separate clade, Clade B, of which it is the only representative. Details about the representatives of clades and subclades are given in Table S1.
Statistically significant AMOVA and FST values were calculated only in the case of CR gene. The great majority of variation (81.53%) was attributed to within population differentiation (Table 3). The same results were also indicated by the relatively high genetic distances within geographic groups in both genes (Table 1 and Table 2). Slightly different FST values between the Mediterranean–Red Sea and Mediterranean–Indian Ocean regional groups support the genetic similarity of the invasive population in both regions (Table 4).
In total, six and three different haplotypes were identified for COI and CR genes, respectively, from samples collected along Cypriot coasts. Sicily and Rhodes appear to share the same haplotype, which is the most common haplotype found in Cyprus. The common “Mediterranean haplotype” is also found in the Red Sea as well as in very distant places such as Indonesia and South Africa (Figure 3 and Figure 4). Unique haplotypes were found in Cyprus and the diversity of haplotypes from the Red Sea and the Indian Ocean, where the lionfish is native, was high.

4. Discussion

The increasing number of reports of lionfish around the coasts of Cyprus show that the species is already established in the Mediterranean and is becoming more and more common [33,34]. While the ecological impacts of the invasion in the Atlantic Ocean have proved to be severe, we still do not know the magnitude of impacts in the Mediterranean [50]. In the case of the west Atlantic Ocean, lionfish are thought to have been released or escaped from marine aquaria [26,51,52]. While lionfish is not a common aquarium species in Cyprus, it is very common in neighbouring countries such as Lebanon (Bariche M, pers. comm.). As a result, the introduction of the species to the Mediterranean Sea through aquarium releases is also a possibility.
Our data for both examined genes are in line with the results of previous studies, as the same haplotypes are found in the Mediterranean and the neighboring Red Sea/Gulf of Aqaba. It is worth noticing that Italy, Rhodes and Lebanon share a common haplotype which in both genes is the most common in Cyprus. This fact strengthens the hypothesis that the first populations established in the eastern part of the Mediterranean were the source for the populations that are currently expanding westwards, reaching Rhodes and Sicily. On the other hand, the presence of six different, some of them unique, COI haplotypes in Cyprus may indicate ongoing gene flow between the northern Red Sea and the Levantine Basin. Beyond the presence of different haplotypes for COI and CR, a pattern of repeated introductions is also indicated by the fact that the species was reported for the first time in 1991 and then, after a long gap of 20 years, in 2012. The occasional presence of the species indicates its ability to reach the Mediterranean Sea and, at the same time, an initial failure to become established. Furthermore, the same pattern was documented in other invasive species of the same origin, such as the bluespotted cornetfish Fistularia commersonii [24,25,53]. In line with previously published genetic data from the Mediterranean Sea, the genetic similarity with individuals from the Red Sea is highlighted and also, at the same time, the low genetic diversity among Mediterranean populations [24,25]. Therefore, published studies support the idea that the lionfish, as many other species, invaded the Mediterranean Sea through the Suez Canal [8,11,54].
Nevertheless, as revealed by our phylogenetic analyses and haplotype networks, some of the individuals captured in Cyprus are genetically closer to individuals from the Indian Ocean and South Africa than to each other. This might be due either to underrepresentation of Red Sea populations or to a contribution of long-distance dispersal via the aquarium trade and/or ballast waters.
The presence of a dominant haplotype in the Cyprus population could be associated with a founder effect and rapid population expansion. However, the same level of genetic similarity with populations from the Red Sea and the broad geographic range of the Indian Ocean, as shown by the estimated FST values, indicate the possibility of alternative pathways of the species’ introduction in the Mediterranean Sea. Moreover, the attribution of total variance by AMOVA analysis to within-population differentiation (Table 3) along with the calculated genetic distance values (Table 1 and Table 2), reflect the recent invasion of P. miles in the Mediterranean; hence, a limited time available for evolutionary divergence. Given the short period after the lionfish invasion, within the Mediterranean Sea population divergence is more likely to be the result of multiple introductions than of random genetic drift after a unique introduction event.
Dispersal to new areas is more effective when individuals are in the pelagic larval phase (14–17 days old) when they can disperse up to circa 900 km from the spawning area, taking advantage of the presence of local currents [16,55]. Nevertheless, if currents facilitated the transport of larvae from the Red Sea to the Mediterranean, then genetic divergence should correlate with geographical distance, as predicted by a ‘stepping stone’ model [56]. Our results do not show any correlation of geographic and genetic distances, as haplotypes from the Mediterranean are found also in remote regions, while the unique Mediterranean haplotypes have not been found in the Red Sea by this or previous studies [25]. Taking into account the possibility of introduction from very distant areas, P. volitans may also arrive and hybridize with P. miles in the Mediterranean [28]. This would alter the dynamics of the invasive population and hence the impact of the invasion on the native ecosystem. The introduction of new species into the Mediterranean through shipping ballast water is well documented, as circa 22% of all alien species currently present were introduced through this pathway [9]. The risk of lionfish larval transfer from the western Atlantic Ocean to the eastern Pacific Ocean through the Panama Canal was highlighted by MacIsaac et al. [57]. The present study verifies the genetic similarity of the Mediterranean lionfish populations with individuals from the Red Sea and at the same time points out the possibility of introduction from very distant areas following various pathways. These findings urge the competent authorities towards the direction of targeted measures. Biosecurity measures focusing on ornamental fish trade, ballast water treatment and the Suez Canal, which is one of the main paths that invasive species follow to reach the Mediterranean basin, are a clear priority to prevent continued introduction of lionfish and other invasive species. The latter is becoming an urgent need after the recent widening and deepening of the canal since the effects of these actions have not been evaluated yet.
Overall, no geographical pattern of genetic divergence among the lionfish populations studied was detected. It seems that the species is taking advantage of a variety of human activities and is expanding its distribution in the Mediterranean basin; this may have serious impacts on native species, ecosystems and the economy.

Supplementary Materials

The following are available online at https://0-www-mdpi-com.brum.beds.ac.uk/1424-2818/11/9/149/s1, Figure S1: BI phylogram based on concatenated data set including both targeted genes (CR and COI), Table S1: Species, locality of origin, available sequence data from targeted genes, and codes/ Genbank accession numbers of individuals used in the analyses., Table S2: Frequency and Accession numbers of CR haplotypes, Table S3: Frequency and Accession numbers of COI haplotypes.

Author Contributions

Conceptualization: A.C.D. and S.S.; Formal Analysis: A.C.D.; Investigation: A.C.D.; Resources: S.S., P.K., C.J., D.K., C.A., L.H.; Writing—Original Draft Preparation: A.C.D. and S.S.; Writing—Review and Editing: A.C.D., C.J., N.C., J.M.H.-S., P.K., D.K., C.A., L.H., S.S.; Supervision: S.S.; Project Administration: N.C., S.S.; J.M.H.-S., C.J.; D.K.; Funding Acquisition: S.S., J.M.H.-S., D.K., L.H.

Funding

This research was funded by LIFE financial instrument of the European Union www.ec.europa.eu/life, grant number LIFE16 NAT/CY/000832. The present work was conducted in the framework of the project RELIONMED- preventing a lionfish invasion in the Mediterranean through early response and targeted removal.

Acknowledgments

Authors are grateful to all three anonymous reviewers whose remarks improved the quality of our work.

Conflicts of Interest

The authors declare no conflict of interest.

References

  1. Mack, R.N.; Simberloff, D.; Mark Lonsdale, W.; Evans, H.; Clout, M.; Bazzaz, F.A. Biotic invasions, causes, epidemiology, global consequences and control. Ecol. Appl. 2000, 10, 689–710. [Google Scholar] [CrossRef]
  2. Bax, N.; Williamson, A.; Aguero, M.; Gonzalez, E.; Geeves, W. Marine invasive alien species: A threat to global biodiversity. Mar. Policy 2003, 27, 313–323. [Google Scholar] [CrossRef]
  3. Katsanevakis, S.; Wallentinus, I.; Zenetos, A.; Leppäkoski, E.; Çinar, M.E.; Oztürk, B.; Grabowski, M.; Golani, D.; Cardoso, A.C. Impacts of invasive alien marine species on ecosystem services and biodiversity: A pan-European review. Aquat. Invasions 2014, 9, 391–423. [Google Scholar] [CrossRef]
  4. Lovell, S.J.; Stone, S.F.; Fernandez, L. The economic impacts of aquatic invasive species: A review of the literature. Agric. Resour. Econ. 2006, 35, 195–208. [Google Scholar] [CrossRef]
  5. Molnar, J.L.; Gamboa, R.L.; Revenga, C.; Spalding, M.D. Assessing the global threat of invasive species to marine biodiversity. Front. Ecol. Environ. 2008, 6, 458–492. [Google Scholar] [CrossRef]
  6. Vilà, M.; Basnou, C.; Pyšek, P.; Josefsson, M.; Genovesi, P.; Gollasch, S.; Nentwig, W.; Olenin, S.; Roques, A.; Roy, D.; et al. How well do we understand the impacts of alien species on ecosystem services? A pan-European, cross-taxa assessment. Front. Ecol. Environ. 2010, 8, 135–144. [Google Scholar] [CrossRef] [Green Version]
  7. Azzurro, E.; Bariche, M. Local knowledge and awareness on the incipient lionfish invasion in the eastern Mediterranean Sea. Mar. Freshw. Res. 2017, 68, 1950–1954. [Google Scholar] [CrossRef] [Green Version]
  8. Galil, B. Eyes wide shut: Managing bio-invasions in Mediterranean marine protected areas. In Management of Marine Protected Areas: A Network Perspective; Goriup, P.D., Ed.; Wiley: New York, NY, USA, 2017; pp. 187–206. [Google Scholar] [CrossRef]
  9. Coll, M.; Piroddi, C.; Steenbeek, J.; Kaschner, K.; Lasram, F.B.R.; Aguzzi, J.; Ballesteros, E.; Bianchi, C.N.; Corbera, J.; Dailianis, T.; et al. The Biodiversity of the Mediterranean Sea: Estimates, Patterns and Threats. PLoS ONE 2010, 5, e11842. [Google Scholar] [CrossRef]
  10. Zenetos, A.; Çinar, M.E.; Crocetta, F.; Golani, D.; Rosso, A.; Servello, G.; Shenkar, N.; Turon, X.; Verlaque, M. Uncertainties and validation of alien species catalogues: The Mediterranean as an example. Estuar. Coast. Shelf. Sci. 2017, 191, 171–187. [Google Scholar] [CrossRef]
  11. Por, F.D. One hundred years of the Suez Canal—A century of Lessepsian migration: Retrospects and viewpoints. Syst. Zool. 1971, 20, 138–195. [Google Scholar] [CrossRef]
  12. Galil, B.S.; Boero, F.; Campbell, M.L.; Carlton, J.T.; Cook, E.; Fraschetti, S.; Gollasch, S.; Hewitt, C.L.; Jelmert, A.; Macpherson, E.; et al. ‘Double trouble’: The expansion of the Suez Canal and marine bioinvasions in the Mediterranean Sea. Biol. Invasions 2015, 17, 973–976. [Google Scholar] [CrossRef]
  13. Galil, B.S. Taking stock: Inventory of alien species in the Mediterranean Sea. Biol. Invasions 2009, 11, 359–372. [Google Scholar] [CrossRef]
  14. Galil, B.S.; Marchini, A.; Occhipinti-Ambrogi, A. East is east and West is west? Management of marine bioinvasions in the Mediterranean Sea. Estuar. Coast. Shelf. Sci. 2016, 201, 7–16. [Google Scholar] [CrossRef]
  15. García-Berthou, E. The characteristics of invasive fishes: What has been learned so far? J. Fish. Biol. 2007, 71, 33–55. [Google Scholar] [CrossRef]
  16. Côté, I.M.; Smith, N.S. The lionfish Pterois sp. invasion: Has the worst-case scenario come to pass? J. Fish. Biol. 2018, 92, 660–689. [Google Scholar] [CrossRef]
  17. Schultz, E. Pterois volitans and Pterois miles: Two Valid Species. Copeia 1986, 3, 686–690. [Google Scholar] [CrossRef]
  18. Albins, M.A.; Hixon, M.A. Worst case scenario: Potential long-term effects of invasive predatory lionfish (Pterois volitans) on Atlantic and Caribbean coral-reef communities. Environ. Biol. Fishes 2013, 96, 1151–1157. [Google Scholar] [CrossRef]
  19. Schofield, P.J. Geographic extent and chronology of the invasion of non-native lionfish (Pterois volitans [Linnaeus 1758] and P. miles [Bennett 1828]) in the western North Atlantic and Caribbean Sea. Aquat. Invasions 2009, 4, 473–479. [Google Scholar] [CrossRef]
  20. Whitfield, P.E.; Hare, J.A.; David, A.W.; Harter, S.L.; Muñoz, R.C.; Addison, C.M. Abundance estimates of the Indo-Pacific lionfish Pterois volitans/miles complex in the western North Atlantic. Biol. Invasions 2007, 9, 53–64. [Google Scholar] [CrossRef]
  21. Ferreira, C.E.L.; Luiz, O.J.; Floeter, S.R.; Lucena, M.B.; Barbosa, M.C.; Rocha, C.R.; Rocha, L.A. First record of invasive lionfish (Pterois volitans) for the Brazilian Coast. PLoS ONE 2015, 10, e0123002. [Google Scholar] [CrossRef]
  22. Hamner, R.M.; Freshwater, D.W.; Whitfield, P.E. Mitochondrial cytochrome b analysis reveals two invasive lionfish species with strong founder effects in the western Atlantic. J. Fish Biol. 2007, 71, 214–222. [Google Scholar] [CrossRef]
  23. Johnston, M.W.; Purkis, S.J. Spatial analysis of the invasion of lionfish in the western Atlantic and Caribbean. Mar. Pollut. Bull. 2011, 62, 1218–1226. [Google Scholar] [CrossRef]
  24. Bariche, M.; Kleitou, P.; Kalogirou, S.; Bernardi, G. Genetics reveal the identity and origin of the lionfish invasion in the Mediterranean Sea. Sci. Rep. 2017, 7, 6782. [Google Scholar] [CrossRef] [Green Version]
  25. Stern, N.; Jimenez, C.; Huseyinoglu, M.F.; Andreou, V.; Hadijioannou, L.; Petrou, A.; Öztürk, B.; Golani, D.; Rothman, S.B. Constructing the genetic population demography of the invasive lionfish Pterois miles in the Levant Basin, Eastern Mediterranean. Mitochondrial DNA Part A 2018, 30, 249–255. [Google Scholar] [CrossRef]
  26. Selwyn, J.D.; Johnson, J.E.; Downey-Wall, A.M.; Bynum, A.M.; Hamner, R.M.; Hogan, J.D.; Bird, C.E. Simulations indicate that scores of lionfish (Pterois volitans) colonized the Atlantic Ocean. Peer J. 2017, 5, e3996. [Google Scholar] [CrossRef]
  27. Johnson, J.; Bird, C.E.; Johnston, M.A.; Fogg, A.Q.; Hogan, J.D. Regional genetic structure and genetic founder effects in the invasive lionfish: Comparing the Gulf of Mexico, Caribbean and North Atlantic. Mar. Biol. 2016, 163, 216. [Google Scholar] [CrossRef]
  28. Wilcox, C.L.; Motomura, H.; Matsunuma, M.; Bowen, B.W. Phylogeography of lionfishes (Pterois) indicate taxonomic over splitting and hybrid origin of the invasive Pterois Volitans. J. Hered. 2017, 109, 162–175. [Google Scholar] [CrossRef]
  29. Bos, A.R.; Grubich, J.R.; Sanad, A.M. Growth, site fidelity and grouper interactions of the Red Sea lionfish Pterois miles (Scorpaenidae) in its native habitat. Mar. Biol. 2018, 165, 175. [Google Scholar] [CrossRef]
  30. Bos, A.R.; Sanad, A.M.; Elsayed, K. Gymnothorax spp.(Muraenidae) as natural predators of the lionfish Pterois miles in its native biogeographical range. Environ. Biol. Fishes 2017, 100, 745–748. [Google Scholar] [CrossRef]
  31. Golani, D.; Sonin, O. New records of the Red Sea fishes, Pterois miles (Scorpaenidae) and Pteragogus pelycus (Labridae) from the eastern Mediterranean Sea. Jpn. J. Ichthyol. 1992, 39, 167–169. [Google Scholar] [CrossRef]
  32. Bariche, M.; Torres, M.; Azzurro, E. The presence of the invasive Lionfish Pterois miles in the Mediterranean Sea. Mediterr. Mar. Sci. 2013, 14, 292–294. [Google Scholar] [CrossRef]
  33. Jimenez, C.; Petrou, A.; Andreou, V.; Hadjioannou, L.; Wolf, W.; Koutsoloukas, N.; Abu Alhaija, R. Veni, vidi, vici: The successful establishment of the lionfish Pterois miles in Cyprus (Levantine Sea). Rapp. Comm. Int. Mer Mediterr. 2016, 41, 417. [Google Scholar]
  34. Kletou, D.; Hall-Spencer, J.M.; Kleitou, P. A lionfish (Pterois miles) invasion has begun in the Mediterranean Sea. Mar. Biodivers. Rec. 2016, 9, 46. [Google Scholar] [CrossRef]
  35. Baldwin, C.C.; Mounts, J.H.; Smith, D.G.; Weigt, L.A. Genetic identification and color descriptions of early life-history stages of Belizean Phaeoptyx and Astrapogon (Teleostei: Apogonidae) with comments on identification of adult Phaeoptyx. Zootaxa 2009, 26, 1–22. [Google Scholar]
  36. Handy, S.M.; Deeds, J.R.; Ivanova, N.V.; Hebert, P.D.; Hanner, R.H.; Ormos, A.; Weigt, L.A.; Moore, M.M.; Yancy, H.F. A single-laboratory validated method for the generation of DNA barcodes for the identification of fish for regulatory compliance. J. AOAC Int. 2011, 94, 201–210. [Google Scholar]
  37. Lee, W.J.; Conroy, J.; Howell, W.H.; Kocher, T.D. Structure and evolution of teleost mitochondrial control regions. J. Mol. Evol. 1995, 41, 54–66. [Google Scholar] [CrossRef]
  38. Katoh, K.; Misawa, K.; Kuma, K.; Miyata, T. MAFFT: A novel method for rapid multiple sequence alignment based on fast Fourier transform. Nucleic Acids Res. 2002, 30, 3059–3066. [Google Scholar] [CrossRef]
  39. Tamura, K.; Stecher, G.; Peterson, D.; Filipski, A.; Kumar, S. MEGA6: Molecular evolutionary genetics analysis version 6.0. Mol. Biol. Evol. 2013, 30, 2725–2729. [Google Scholar] [CrossRef]
  40. Darriba, D.; Taboada, G.L.; Doallo, R.; Posada, D. JModelTest 2: More models, new heuristics and parallel computing. Nat. Methods 2012, 9, 772. [Google Scholar] [CrossRef]
  41. Yang, Z. Computational Molecular Evolution; Oxford University Press: Oxford, UK, 2006. [Google Scholar]
  42. Ronquist, F.; Teslenko, M.; Van Der Mark, P.; Ayres, D.L.; Darling, A.; Höhna, S.; Larget, B.; Liu, L.; Suchard, M.A.; Huelsenbeck, J.P. Mrbayes 3.2: Efficient bayesian phylogenetic inference and model choice across a large model space. Syst. Biol. 2012, 61, 539–542. [Google Scholar] [CrossRef]
  43. Stamatakis, A. RAxML version 8: A tool for phylogenetic analysis and post-analysis of large phylogenies. Bioinformatics 2014, 30, 1312–1313. [Google Scholar] [CrossRef]
  44. Rambaut, A.; Drummond, A.J. Tracer 1.5.0; University of Edinburgh: Edinburgh, UK, 2007; Available online: http://beast.Bio.Ed.Ac.uk/Tracer (accessed on 1 June 2019).
  45. Excoffier, L.; Lischer, H.E.L. Arlequin suite ver 3.5: A new series of programs to perform population genetics analyses under Linux and Windows. Mol. Ecol. Resour. 2010, 10, 564–567. [Google Scholar] [CrossRef]
  46. Leigh, J.W.; Bryant, D. PopART: Full-feature software for haplotype network construction. Methods Ecol. Evol. 2015, 6, 1110–1116. [Google Scholar] [CrossRef]
  47. Bandelt, H.; Forster, P.; Röhl, A. Median-joining networks for inferring intraspecific phylogenies. Mol. Biol. Evol. 1999, 16, 37–48. [Google Scholar] [CrossRef]
  48. Lopez, J.V.; Yuhki, N.; Masuda, R.; Modi, W.; O’Brien, S.J. Numt, a recent transfer and tandem amplification of mitochondrial DNA to the nuclear genome of the domestic cat. J. Molec. Evol. 1994, 39, 174–190. [Google Scholar] [CrossRef]
  49. Akaike, H. New look at statistical-model identification. IEEE Trans. Automat. Contr. 1974, 19, 716–723. [Google Scholar] [CrossRef]
  50. Ahrenholz, D.W.; Morris, J.A. Larval duration of the lionfish, Pterois volitans along the Bahamian Archipelago. Environ. Biol. Fishes 2010, 88, 305–309. [Google Scholar] [CrossRef]
  51. Whitfield, P.E.; Gardner, T.; Vives, S.P.; Gilligan, M.R.; Courtenay, W.R., Jr.; Ray, G.C.; Hare, J.A. Biological invasion of the Indo-Pacific lionfish (Pterois volitans) along the Atlantic coast of North America. Mar. Ecol. Prog. Ser. 2002, 235, 289–297. [Google Scholar] [CrossRef]
  52. Semmens, B.X.; Buhle, E.R.; Salomon, A.K.; Pattengill-Semmens, C.V. A hotspot of non-native marine fishes: evidence for the aquarium trade as an invasion pathway. Mar. Ecol. Prog. Ser. 2004, 266, 239–244. [Google Scholar] [CrossRef] [Green Version]
  53. Bariche, M.; Kazanjian, G.; Azzurro, E.A. A lag of 25 years: Evidence from an old capture of Fistularia commersonii Ruppell, 1838 from Lebanon (Mediterranean Sea). J. Appl. Ichthyol. 2014, 30, 535–536. [Google Scholar] [CrossRef]
  54. Zenetos, A.; Gofas, S.; Verlaque, M.; Cinar, M.E.; García-Raso, J.E.; Bianchi, C.N.; Morri, C.; Azzurro, E.; Bilecenoglu, M.; Froglia, C.; et al. Alien species in the Mediterranean Sea by. A contribution to the application of European Union’s Marine Strategy Framework Directive (MSFD). Part 2. Introduction trends and pathways. Mediterr. Mar. Sci. 2012, 13, 328–352. [Google Scholar] [CrossRef]
  55. Kitchens, L.L.; Paris, C.B.; Vaz, A.C.; Ditty, J.G.; Cornic, M.; Cowan, J.H.; Rooker, J.R. Occurrence of invasive lionfish (Pterois volitans) larvae in the northern Gulf of Mexico: Characterization of dispersal pathways and spawning areas. Biol. Invasions 2017, 19, 1971–1979. [Google Scholar] [CrossRef]
  56. Shefer, S.; Abelson, A.; Mokady, O.; Geffen, E.L. Red to Mediterranean Sea bioinvasion: Natural drift through the Suez Canal, or anthropogenic transport? Mol. Ecol. 2004, 13, 2333–2343. [Google Scholar] [CrossRef]
  57. MacIsaac, H.J.; De Roy, E.M.; Leung, B.; Grgicak-Mannion, A.; Ruiz, G.M. Possible ballast water transfer of Lionfish to the eastern Pacific Ocean. PLoS ONE 2016, 11, e0165584. [Google Scholar] [CrossRef]
Figure 1. Localities of Pterois miles specimens included in our analyses. Colors correspond to Figures 3 and 4.
Diversity 11 00149 g001
Figure 2. Fifty percent majority-rule consensus tree of the Bayesian inference (BI) analysis resulted from the concatenated dataset of the mtDNA control region (CR) and cytochrome c oxidase subunit 1 (COI). Only BI posterior probabilities >0.9 and maximum likelihood (ML) bootstrap values >75 are shown. At the statistically well-supported subclade A(b) are grouped some of the individuals from Cyprus, South Africa and the Indian Ocean. Individuals from the same regions are also included in subclade A(a).
Diversity 11 00149 g002
Figure 3. Median-joining haplotype network for CR sequences. Different colors correspond to geographic origin and circle size is proportional to the number of individuals with the same haplotype. Hatch marks along edges represent the number of mutations between nodes. Accession numbers for individuals representing each haplotype are given in Table S2.
Diversity 11 00149 g003
Figure 4. Median-joining haplotype network for COΙ sequences. Different colors correspond to geographic origin and circle size is proportional to the number of individuals with the same haplotype. Hatch marks along edges represent the number of mutations between nodes. Accession numbers for individuals representing each haplotype are given in Table S3.
Diversity 11 00149 g004
Table 1. Percentage sequence divergence (p-distance) among taxa and/or geographical groups for the COI gene. Values at the diagonal are within group distances.
Group1234567891011
1Cyprus0.26
2Lebanon0.16n/c
3Italy (Sicily)0.160.000.00
4Gulf of Aqaba0.240.080.080.16
5Indian ocean0.530.380.380.400.74
6South Africa0.360.280.280.360.580.55
7Madagascar0.150.000.000.080.380.27n/c
8Indonesia0.160.000.000.090.380.290.00n/c
9P. russelii4.864.664.554.855.064.824.774.70n/c
10P. volitans4.674.494.384.694.964.664.584.530.99n/c
11P. lunulata4.384.284.284.374.534.284.284.280.930.56n/c
Table 2. Percentage sequence divergence (p-distance) among taxa and/or geographical groups for the CR gene. Values at the diagonal are within group distances.
Group123456789
1Cyprus1.06
2Lebanon0.73n/c
3Red Sea2.671.612.01
4Rhodes0.730.001.61n/c
5Gulf of Aqaba2.781.782.041.782.13
6Indian Ocean2.771.962.211.962.422.32
7Indonesia0.960.000.770.001.031.73n/c
8USA1.541.042.051.041.972.880.98n/c
9P. volitans8.729.4214.869.4214.7514.7210.8410.84n/c
Table 3. Results from AMOVA analysis for the CR gene.
Source of VariationdfSum of Squares% of VariationFSTp-Value
Among populations25.03218.470.185>0.001
Within populations10238.54981.53
Total10443.581100
Table 4. Pairwise FST values between regional groups. Above the diagonal with a + are indicated the statistically well-supported estimations (p value < 0.01).
Group123
1. Mediterranean ++
2. Indian Ocean0.23
3. Red Sea0.20>0.01

