Influence of Forest Structure and Composition on Summer Habitat Use of Wildlife in an Upland Hardwood Forest


1
Department of Forestry and Environmental Resources, 2800 Faucette Drive Campus Box 8008, North Carolina State University, Raleigh, NC 27695, USA
2
Department of Forestry, Center for Ecology, 1205 Lincoln Drive—MC 4411, Southern Illinois University, Carbondale, IL 62901, USA
3
Cooperative Wildlife Research Laboratory, Southern Illinois University, Carbondale, IL 62901, USA
*
Author to whom correspondence should be addressed.
Diversity 2019, 11(9), 160; https://0-doi-org.brum.beds.ac.uk/10.3390/d11090160
Submission received: 26 July 2019
/
Revised: 25 August 2019
/
Accepted: 7 September 2019
/
Published: 8 September 2019
(This article belongs to the Section Animal Diversity)
Abstract
:Oak-hickory (Quercus-Carya spp.) forest types are widespread across the midwestern United States, but changes in forest disturbance regimes are resulting in little to no oak recruitment and a compositional shift to shade-tolerant, mesophytic species, such as American beech (Fagus grandifolia) and sugar maple (Acer saccharum). We conducted camera trap surveys in a mature upland hardwood forest of southern Illinois, USA during May to August 2015–2016 to document mammal summer habitat use in relation to forest structure and composition to further understand how regional shifts in forests may affect mammal communities. With nearly 4000 camera days of effort, we modeled occupancy patterns for white-tailed deer (Odocoileus virginianus), raccoon (Procyon lotor), and eastern gray squirrel (Sciurus canadensis). Forest composition models outcompeted forest structure models for white-tailed deer, where we observed a statistically significant negative relationship between white-tailed deer habitat use and beech dominance. Further, we found a strong, positive association between deer and oak dominance. Model selection indicated little support for within-stand forest structure or composition characteristics influencing habitat use for raccoons. Eastern gray squirrel occurrence was best described by forest composition, revealing a positive relationship with beech–maple importance values. Our predictive models indicated that the impact of forest changes underway will have varying impacts on wildlife species. We can expect changes in habitat use patterns to be more pronounced with time barring revised forest management practices, and these changes are likely to be most influential at the landscape-scale. We conclude that a patchwork mosaic of forest conditions will likely best support a diverse and abundant mammal community across the region.
1. Introduction
Throughout many hardwood forests in the eastern United States, oaks (Quercus spp.) have been a prominent genus for millennia [1,2] but are currently facing a decline in dominance across this region [2,3,4,5]. Oak-dominated hardwood ecosystems were historically maintained in mid-successional conditions through periodic natural and anthropogenic disturbances from forest fire, livestock grazing, disease and pest outbreak, and even-aged commercial timber harvesting [5,6]. Decreased disturbance over the 20th century, however, has encouraged the growth of shade-tolerant mesic species, such as maple (Acer spp.) and beech (Fagus spp.) [4,6,7]. Over time, these species have filled the mid-story canopy and are becoming more abundant in the overstory as they fill in gaps following the death of mature oak species [4,8]. Thus, this transition is affecting both the species composition and structure of forests across the region.
Shifts from mid- to late-successional forest composition and structure will likely have an impact on plant–animal interactions due to the role of oak as a keystone and foundation species in ecosystems [9,10,11,12]. Oak species have a disproportionally large influence on ecosystem communities primarily due to their mast production, which during dormant conditions in hardwood forests are consumed by over 100 documented wildlife species. [13,14]. Further, acorn production can influence foraging behavior [15,16], distribution and home range sizes of white-tailed deer (Odocoileus virginianus) [17], and wildlife community dynamics [18]. Oak physiognomy (e.g., leaf and bark structure) also serves a critical role in harboring vital arthropod communities, which provide necessary food resources for bird and mammal communities [12,19].
While much is known about the dependence of wildlife on oak forest habitat, there remains a paucity of empirical information to evaluate the implications of shifts in forest composition and structure [11,12]. Understanding how changes in 21st-century forest management regimes may impact white-tailed deer habitat use, among other species, is of notable importance to state and regional economies [20], and such an investigation will provide timely baseline information regarding wildlife management in Midwestern forests. The objective of this study was to investigate how changes in forest conditions influenced within-home range summer habitat use by a suite of common mammal species in a southern Illinois, USA, upland hardwood stand. We hypothesized that changes in composition rather than structure would most affect species habitat use, given the keystone importance of oak’s food resources across the region. To test this, we developed several site-occupancy models [21], where a subset of models described the forest composition hypothesis and others described forest structure. We predicted deer would have a positive relationship with mature oak–hickory dominance. White-tailed deer often show a strong preference for oak browse [22], and deer in the Central Hardwood Region have exhibited a preference for acorns more than other available food resources [23,24]. Similarly, given eastern gray squirrels’ (Sciurus canadensis) preference for oak catkins during spring and early summer, we expected there to be a positive association with oak–hickory dominance. Given the increased diversity and abundance of insect and bird communities in oak-dominated stands [12,19], we again predicted that raccoon (Procyon lotor) habitat use would be higher in these conditions given that insects make up a dominant proportion of their diet and their tendency to be avian nest predators [25]. That is, for all species, we predicted composition would better describe habitat use patterns than forest structure.
2. Materials and Methods
2.1. Study Area
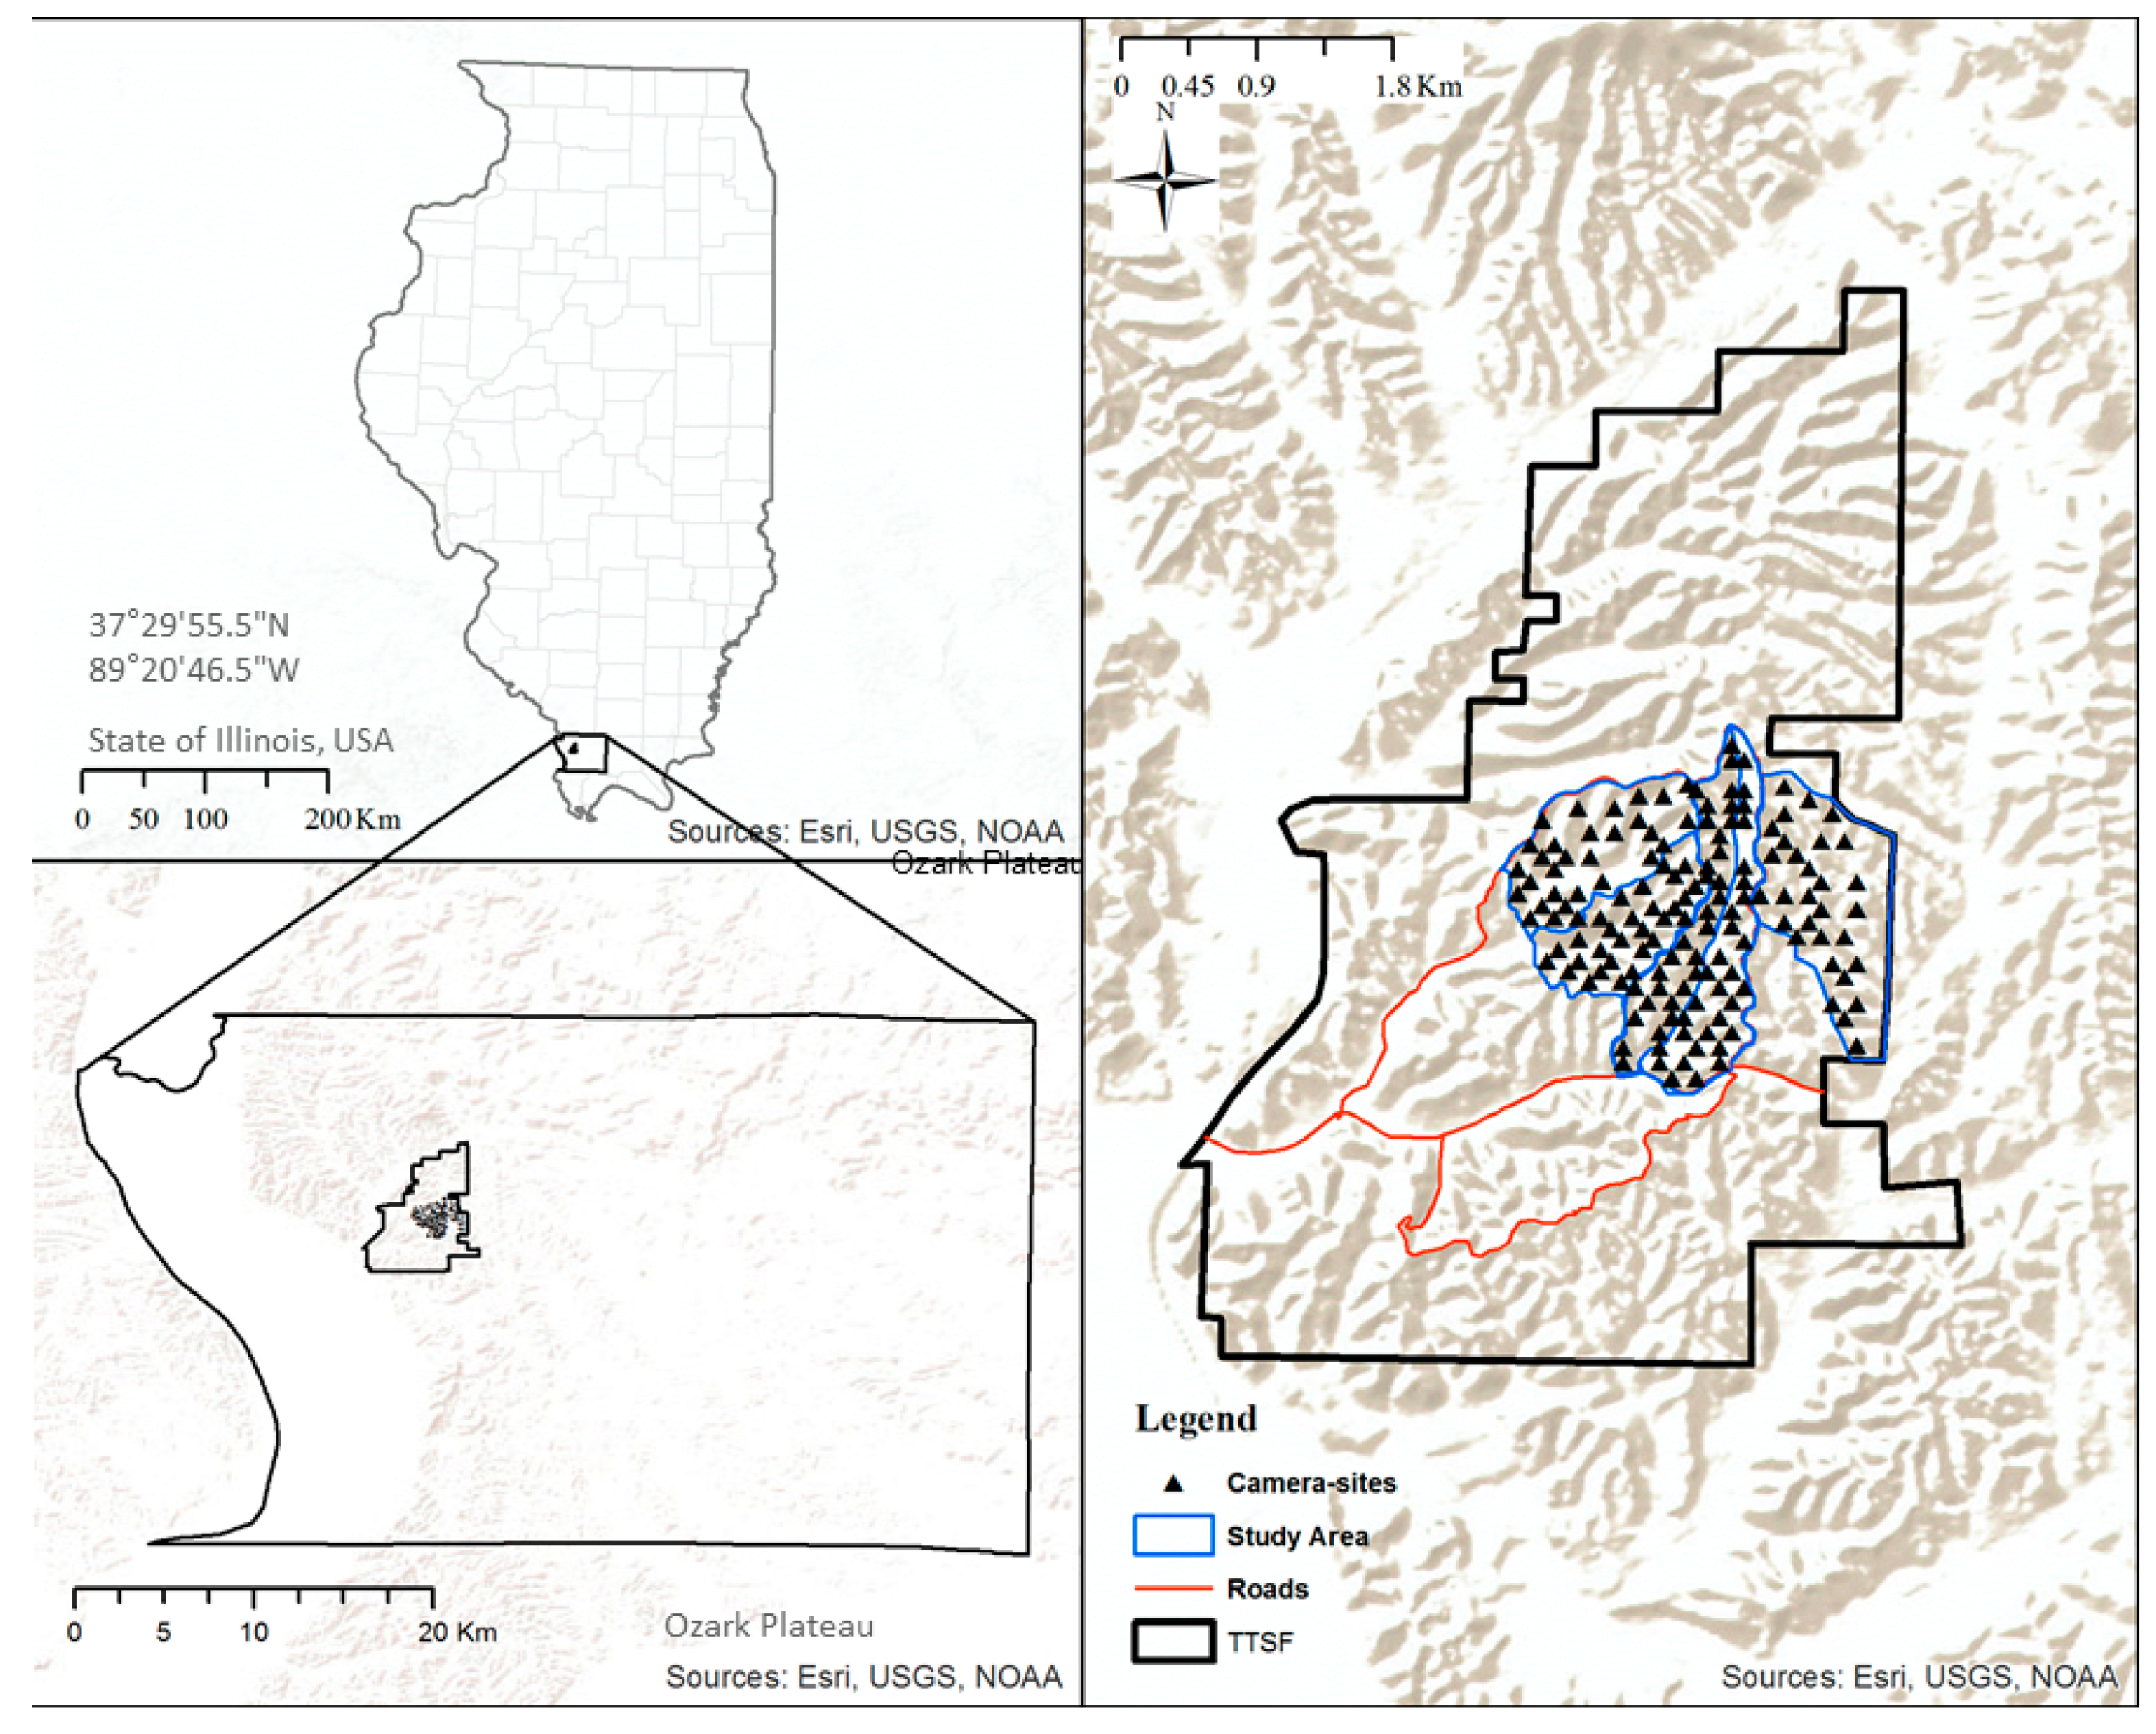
This study was conducted at the Trail of Tears State Forest (TTSF; 37 22′ N, 89 22′ W), in Union County, Illinois, USA (Figure 1). Situated in the easternmost section of the Ozark Plateau and consisting of 2088 ha, the TTSF is one of the largest blocks of contiguous forest in the lower midwestern United States. The topography of the TTSF primarily comprises long and flat, narrow forested ridge tops and steep slopes (10–42%) leading to ravine bottoms. Elevation ranges from 140 m to 213 m above sea level. Overstory forest cover is a mosaic of mature oak-dominated patches with components of hickory (Carya spp.) and sweetgum (Liquidambar styraciflua) while mid-story and understory are dominated by sugar maple (Acer saccharium) and American beech (Fagus grandifolia) on upland sites, and mature mixed hardwoods at lower elevations including a significant component of yellow poplar (Liriodendron tulipifera). During spring and summer, the mean sum of weekly precipitation is 0.75 ± 0.03 (SE) cm (range 0–3.3 cm) and weekly temperature averages 30 ± 0.05 (SE) °C.
2.2. Site Selection
Using ArcGIS software (version 10.3), we established 150 random sampling points (herein, camera-sites) within the TTSF using the Create Random Points tool from the Data Management Toolbox in ArcMap 10.3. The study area we used is part of an extensive, long term project by the Illinois Department of Natural Resources designed to investigate oak–hardwood stand dynamics in this region with several concurrent research investigations underway. Camera-sites had a minimum spacing of 60 m, a mean distance to forest edge of 925 ± 33 (SE) m, and a mean distance to a water source of 206 ± 11 (SE) m. The proximity of neighboring cameras was chosen to capture the microsite variation across the TTSF and to identify specific resources selected within an individual’s home range (4th order selection) [26]. While it is likely that an individual’s home range will span across many camera sites (i.e., sampling units), resulting in the possibility that an individual may be detected using multiple camera sites, this does not necessarily violate independent assumptions from the analysis approach (detailed below) that we used [27], given we were interested in species-level estimation rather than individual-level inference.
2.3. Remote Camera Surveys
During May to August 2015 (n = 50 sites sampled) and 2016 (n = 100 additional sites sampled) for a total of 129 days, we deployed one remotely-triggered camera [herein, camera trap; Cuddeback E2 (20.0 megapixel), Attack IR (5.0 megapixel), or Ambush Black Flash (5.0 megapixel), Non Typical, Inc., Park Falls, WI] at each camera-site equipped with passive infrared sensors and infrared or white flash that were triggered when motion or changes in surface temperature were detected [28]. At each camera-site, we mounted camera traps to trees approximately 40 to 50 cm above ground using steel mounts and nylon strapping. No bait or lure was used at the camera-sites [29]. Cameras were set to be active 24-h each day with 30-s delays between photographs. Cameras recorded one image per trigger, and each photo recorded the date, time, and geographic coordinates of the event. Upon retrieval, we identified species present in each photo. We used a threshold of 60 min to temporally distinguish independence of unique photographic events of the same species [30]. The continuous time data from camera surveys were binned into discrete, 7-day occasions for use in occupancy models (described below) to maintain mean occupancy estimates away from the boundaries (i.e., 0 and 1).
2.4. Habitat Characteristics
We sampled forest composition and structure characteristics at all camera sites using standard measurements during May to August 2015 and 2016 to inform models describing our hypotheses (Table 1) [31,32,33]. At each site, we measured all woody overstory stems ≥7.6 cm diameter at breast height (dbh) within a variable-radius plot [10 Basal Area Factor (BAF)] to determine species-specific density and basal area. From these density and basal area estimates, we calculated species-specific importance values. Forest importance values are a measure of dominance and are calculated by averaging the summation of a given species’ abundance and basal area. We chose this metric because it captured both abundance and basal area with a single value, thereby reducing the number of covariates needed in the model, and that it represents the dominance of a given species at a site, which we believed to be a strong indicator of site conditions. To estimate woody understory, we established four 1.6 m fixed-radius plots (area = 8 m2) at each site that were located 7.65 m from the plot center in each cardinal direction. Within the four plots, we tallied all woody stems taller than 30.5 cm with diameter up to 2.5 cm to calculate species-specific seedling stem density. Additionally, we counted the number of woody stems at least 1 m in height and with a diameter of 2.5 to 7.6 cm to calculate species-specific sapling density. Ground vegetation cover was recorded using ocular estimation of vegetation cover in two 1 m2 plots located 5 m from plot center in opposite directions. Ground cover included graminoid, herbaceous, and woody vegetation (<1 m tall). We also estimated volume of coarse woody debris (CWD) (m3 ha−1) within an 8 m fixed-radius plot by measuring tree length and dbh at the midpoint of a downed tree, and classifying each downed tree into a decay stage based on bark, wood staining, tree branching formation, and primary surface substrate [34]. Trees classified in decay stage 5 (most decayed) were not included in analyses as the majority of the tree at this decay stage is sunken into the ground and almost fully decomposed [34].
Six additional covariates were used to describe camera site-level variation that we hypothesized were contributors to variation in detection probability across our study area, each of which fell into one of the following categories: Temporal or Environmental (Table 1). Note that although we had an explicit hypothesis regarding the observation process, it was primarily to account for variation not directly related to our main hypotheses of forest structure and composition. In addition to testing these hypotheses individually, we also specified a model that was an additive linear combination of the two hypotheses (denoted as “Temporal + Environmental” in Table 1). These covariates included month and year to control for annual population changes and for intra-annual variation in movement rates which might affect detection rates, whether a given species was previously detected at the camera-site, the average temperature and precipitation rates at the camera site during each survey period, and the topographic slope measured at the camera site. We summarized camera-site average daily temperature (European Centre for Medium-Range Weather Forecasts Interim Full Daily Surface Temperature, 2 m above-ground) [35] and precipitation (National Centers for Environmental Prediction: North American Regional Reanalysis-Precipitation Rate at Surface) [36] during each survey period.
2.5. Occupancy Modeling
To evaluate which habitat variables and hypotheses best supported the probability of camera-site use, we used single-season, species-specific occupancy models [21] to account for an imperfect observation process (detection probability; p) in estimates of the latent state variable, occupancy (), among the mammal community. Given the finite area of interest, and that we were interested in mammal occurrence at specific sites, the metric that best describes these conditions is the ‘proportion of units occupied’, rather than ‘probability of occupancy’, which the latter assumes the sampled locations are a random sample from a large population and thus is the probability that a sampling unit in the large (presumably infinite) population is occupied [27]. Using a 2-step process, we first modeled covariates that we predicted would influence species-specific detectability (p) while keeping occupancy constant. Once we identified the model that best explained species-specific detection probabilities (p), we then compared support for 4 a priori occupancy candidate models that incorporated covariates describing variation in forest composition and structure to test our stated hypotheses. These models are comprised of forest characteristics described in Table 1 and were specified to describe compositional and structural differences between the two primary forest associations in the study area (oak–hickory and maple–beech). For example, one occupancy model describing compositional differences included beech dominance and maple dominance in the linear predictor (“Maple + Beech”). We conducted all analyses in Program R [37] using packages unmarked [38] and AICcmodavg [39].
We ranked models based on their Akaike’s information criterion (AIC) values and model weights () [27,40]. We considered all occupancy models composing 0.90 cumulative (i.e., the 90% confidence set) for interpretation, and detection models ≤2 AIC of the best model. We included a ‘null’ model (i.e., a linear model containing only an intercept) to serve as a comparison against models describing our hypotheses. We model-averaged estimates of detection and occupancy for each species. To avoid numerical problems within the maximum likelihood surface in unmarked, we standardized continuous covariates so that means were centered on zero and divided by the covariate sample standard deviation. When scaling a covariate with the observed data’s standard deviation, we then interpreted model coefficients as the expected change in occupancy for 1 unit change in the scaled covariate, or 1 standard deviation change in the covariate from the original value [41]. Statistical significance of marginal covariate effects were evaluated by whether the 95% confidence interval (CI) of a parameter included 0. If the 95% CI did not include 0, then it was considered to a be statistically significant effect. If the 95% bounded 0, but the majority of the 95% CI was either positive or negative, a strong covariate effect was indicated and we concluded the effect to be less precise but supported. We used parametric bootstrapping with 1000 samples to generate a Pearson’s Chi-squared statistic to evaluate the goodness-of-fit of the single-season occupancy models [42].
3. Results
3.1. Habitat Characteristics
Thirty-one tree species were recorded during vegetation sampling. Across all camera sites, overstory basal area was estimated at 24 ± 0.5 (SE) m2 ha−1 with a mean density of 406 ± 23 (SE) stems ha−1 (Table 2). White oak (Quercus alba) comprised the greatest amount of basal area (29%), with black oak (Quercus velutina) following second (13%). Overstory stem density consisted of nearly 25% sugar maple, but only 8% of the basal area, with American beech (19%) and white oak (15%) as the second and third densest. The species-specific importance values resulting from relative basal area and density showed that white oak, sugar maple, and American beech were the three most dominant overstory species. Twenty-five and 78 camera-sites had importance values 50% of beech–maple or oak–hickory, respectively.
Understory density was estimated at 947 ± 67 (SE) stems ha−1, with American beech accounting for over 50% of the stems, followed by sugar maple (18%), pawpaw (Asimina triloba; 8%), and ironwood (Ostrya virginiana; 4%). Mean coarse woody debris volume per camera-site was 2656 ± 492 (SE) m3 ha−1 and overall ground cover was estimated at 34% ± 1.3 (SE), with 76% of ground cover recorded as woody vegetation and 24% herbaceous.
3.2. Survey Effort and Wildlife Detections
Of the 150 camera traps deployed, 10 cameras malfunctioned, and the remaining 140 cameras recorded 440 photographs of endothermic animals over 3927 camera-days of survey effort, with a mean survey length of 28 days. After accounting for temporal independence, there were 320 photographs used in subsequent analyses, which were 30% white-tailed deer, 29% eastern gray squirrel and raccoon, respectively, 5% coyotes (Canis latrans), 4% nine-banded armadillos (Dasypus novemcinctus), 2% bobcats (Lynx rufus), and 1% Virginia opossums (Didelphis virginiana). The three most recorded species (white-tailed deer, eastern gray squirrel, and raccoon) had sufficient detection histories for occupancy analyses. Models for the remaining four species (bobcats, coyotes, nine-banded armadillos, and Virginia opossums) did not provide coverage due to sparse detection histories and thus were not considered further.
3.3. Detection
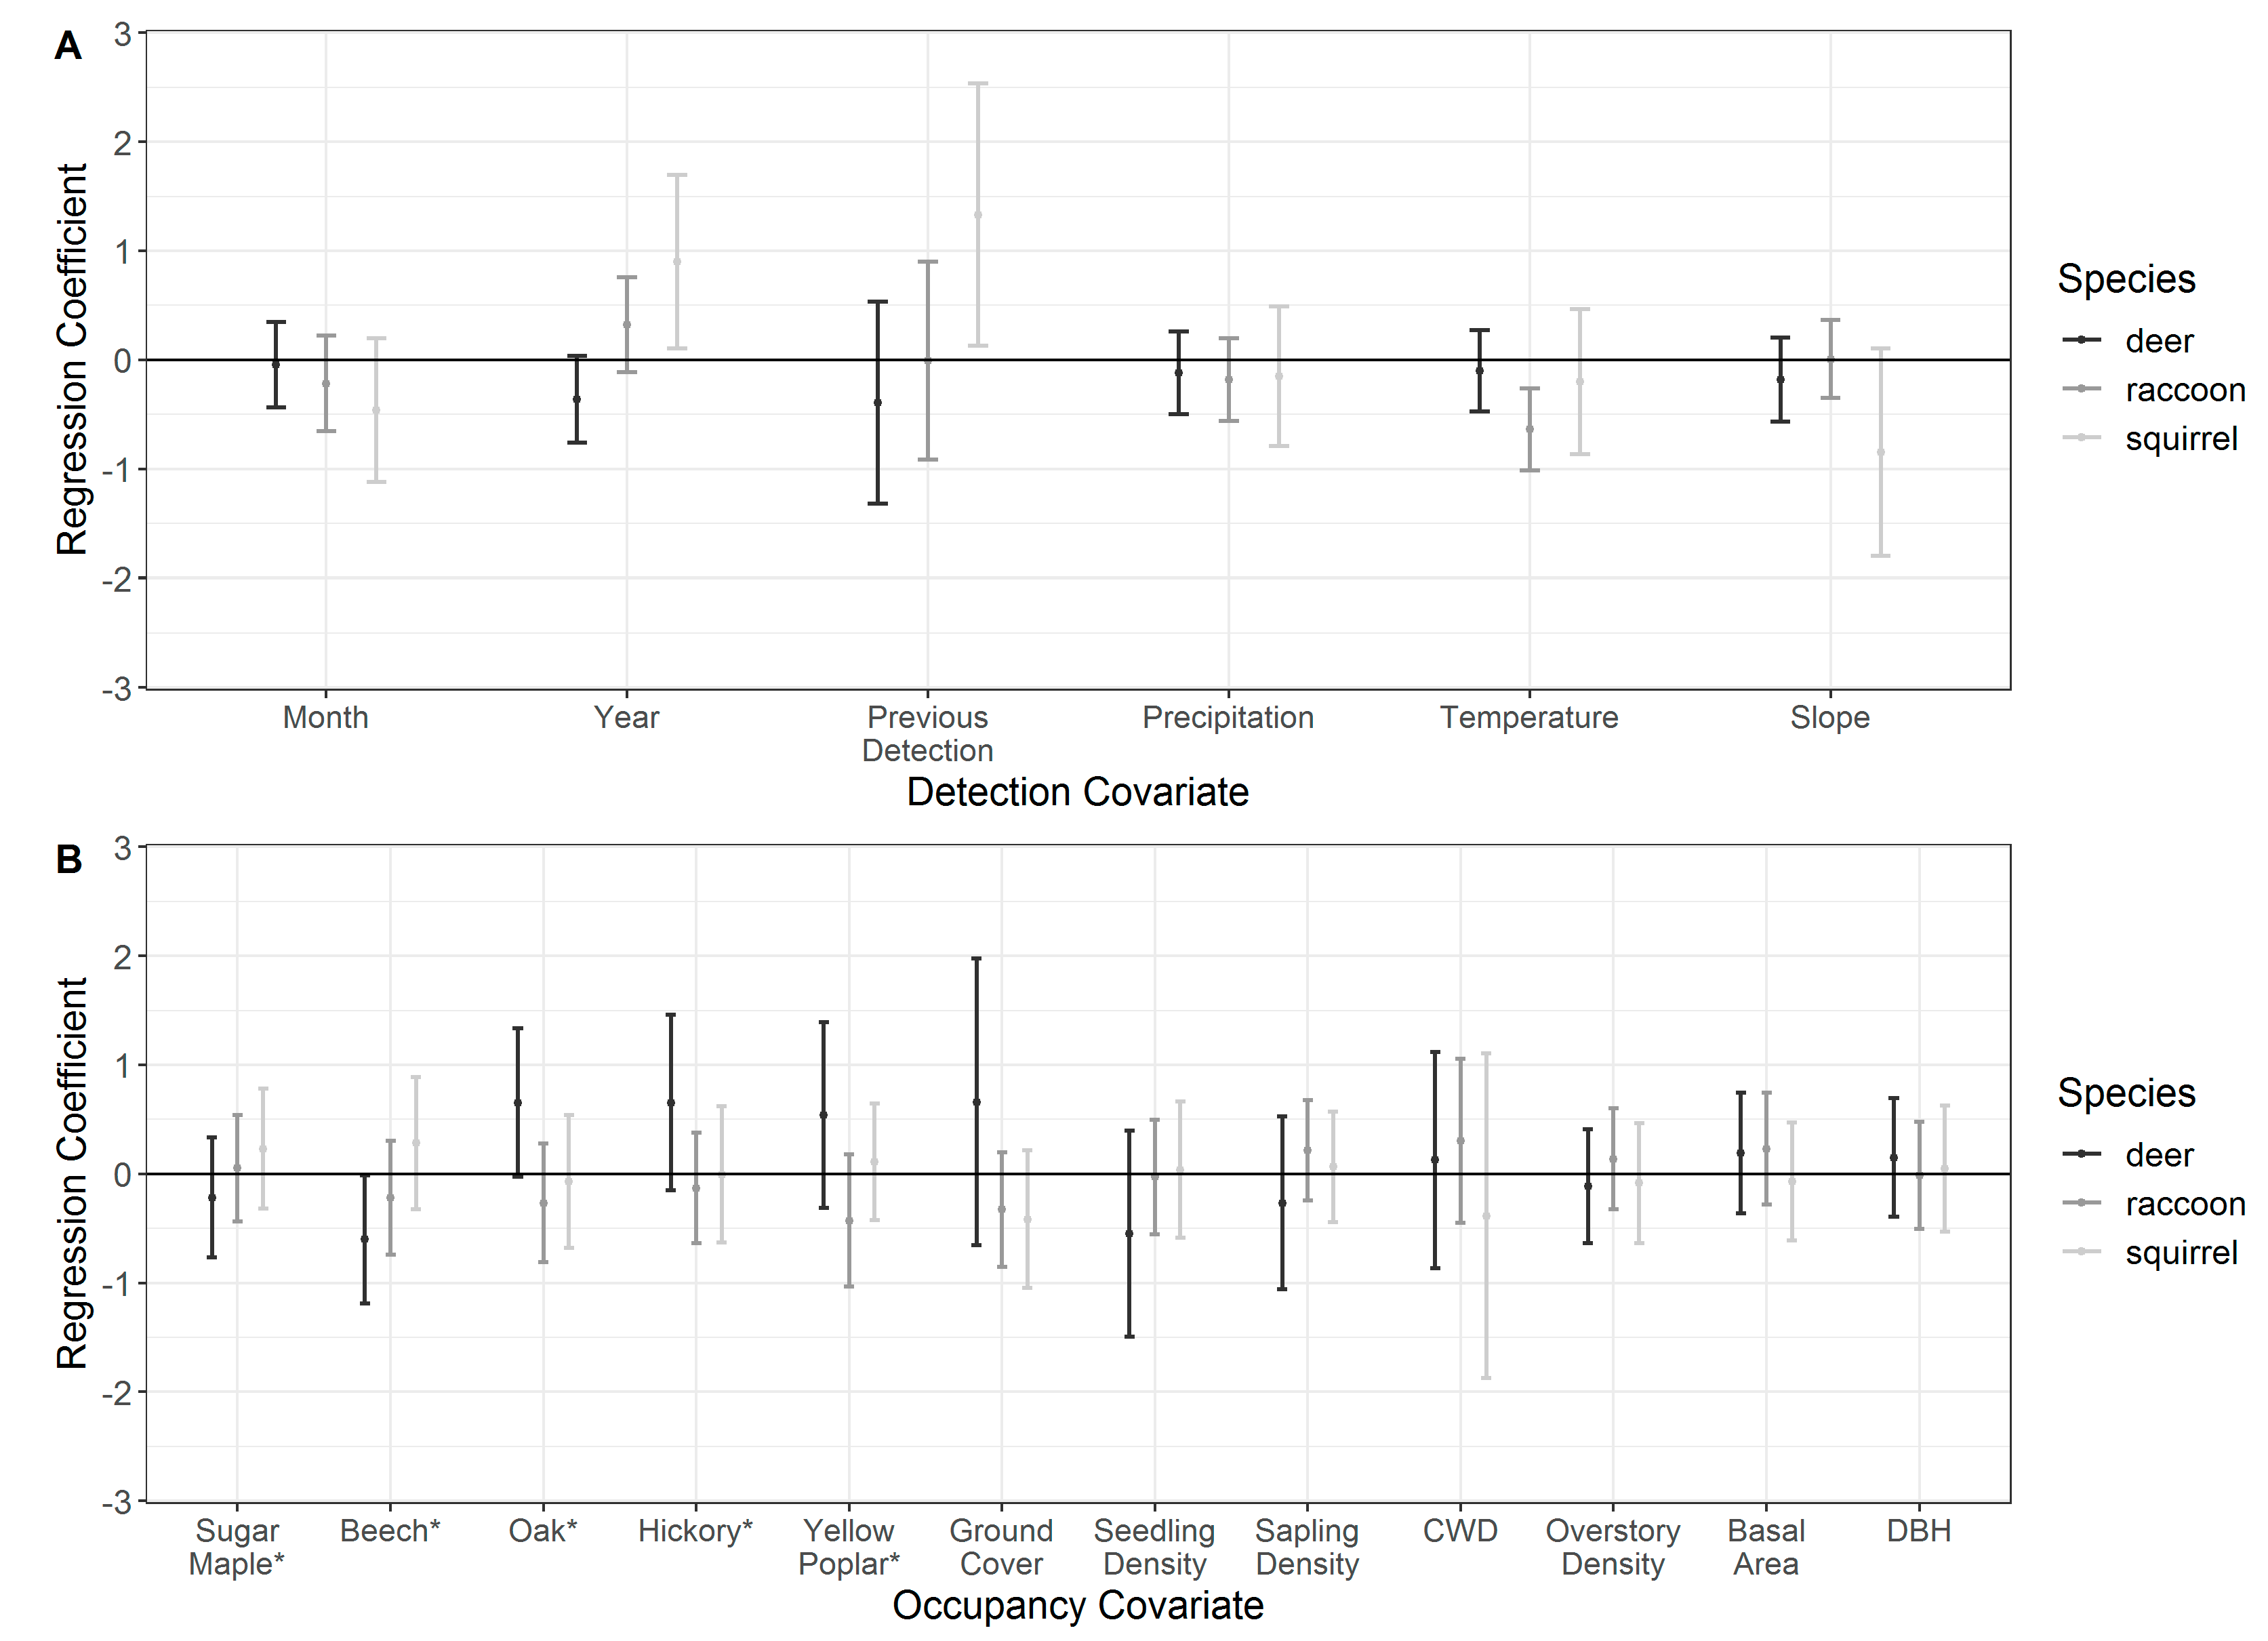
Model-averaged mean estimates of detection probability () were similar among species (white-tailed deer: ; raccoon: ; gray squirrel: ). White-tailed deer detection probability was best explained by the null model (intercept-only), but some support existed for the temporal model (; Table 3). Model selection for raccoon indicated detection probability was best explained by environmental covariates (Figure 2A; Table 3; Table S1). The temporal model was the most parsimonious detection model for gray squirrels, in which detection probability was positively associated with previous detections at a site and year of survey (Figure 2A; Table 3; Table S1).
3.4. Occupancy
Naïve (i.e., percentage of sites where a species was detected) and model-averaged estimates of occupancy varied by species, where white-tailed deer were detected at 29% of the camera-sites, raccoon at 39%, and gray squirrel at 13%. Model-averaged occupancy estimates for white-tailed deer were , raccoon , and gray squirrel . Overall, there tended to be more support for forest composition rather than forest structure driving summer habitat use across all species modeled.
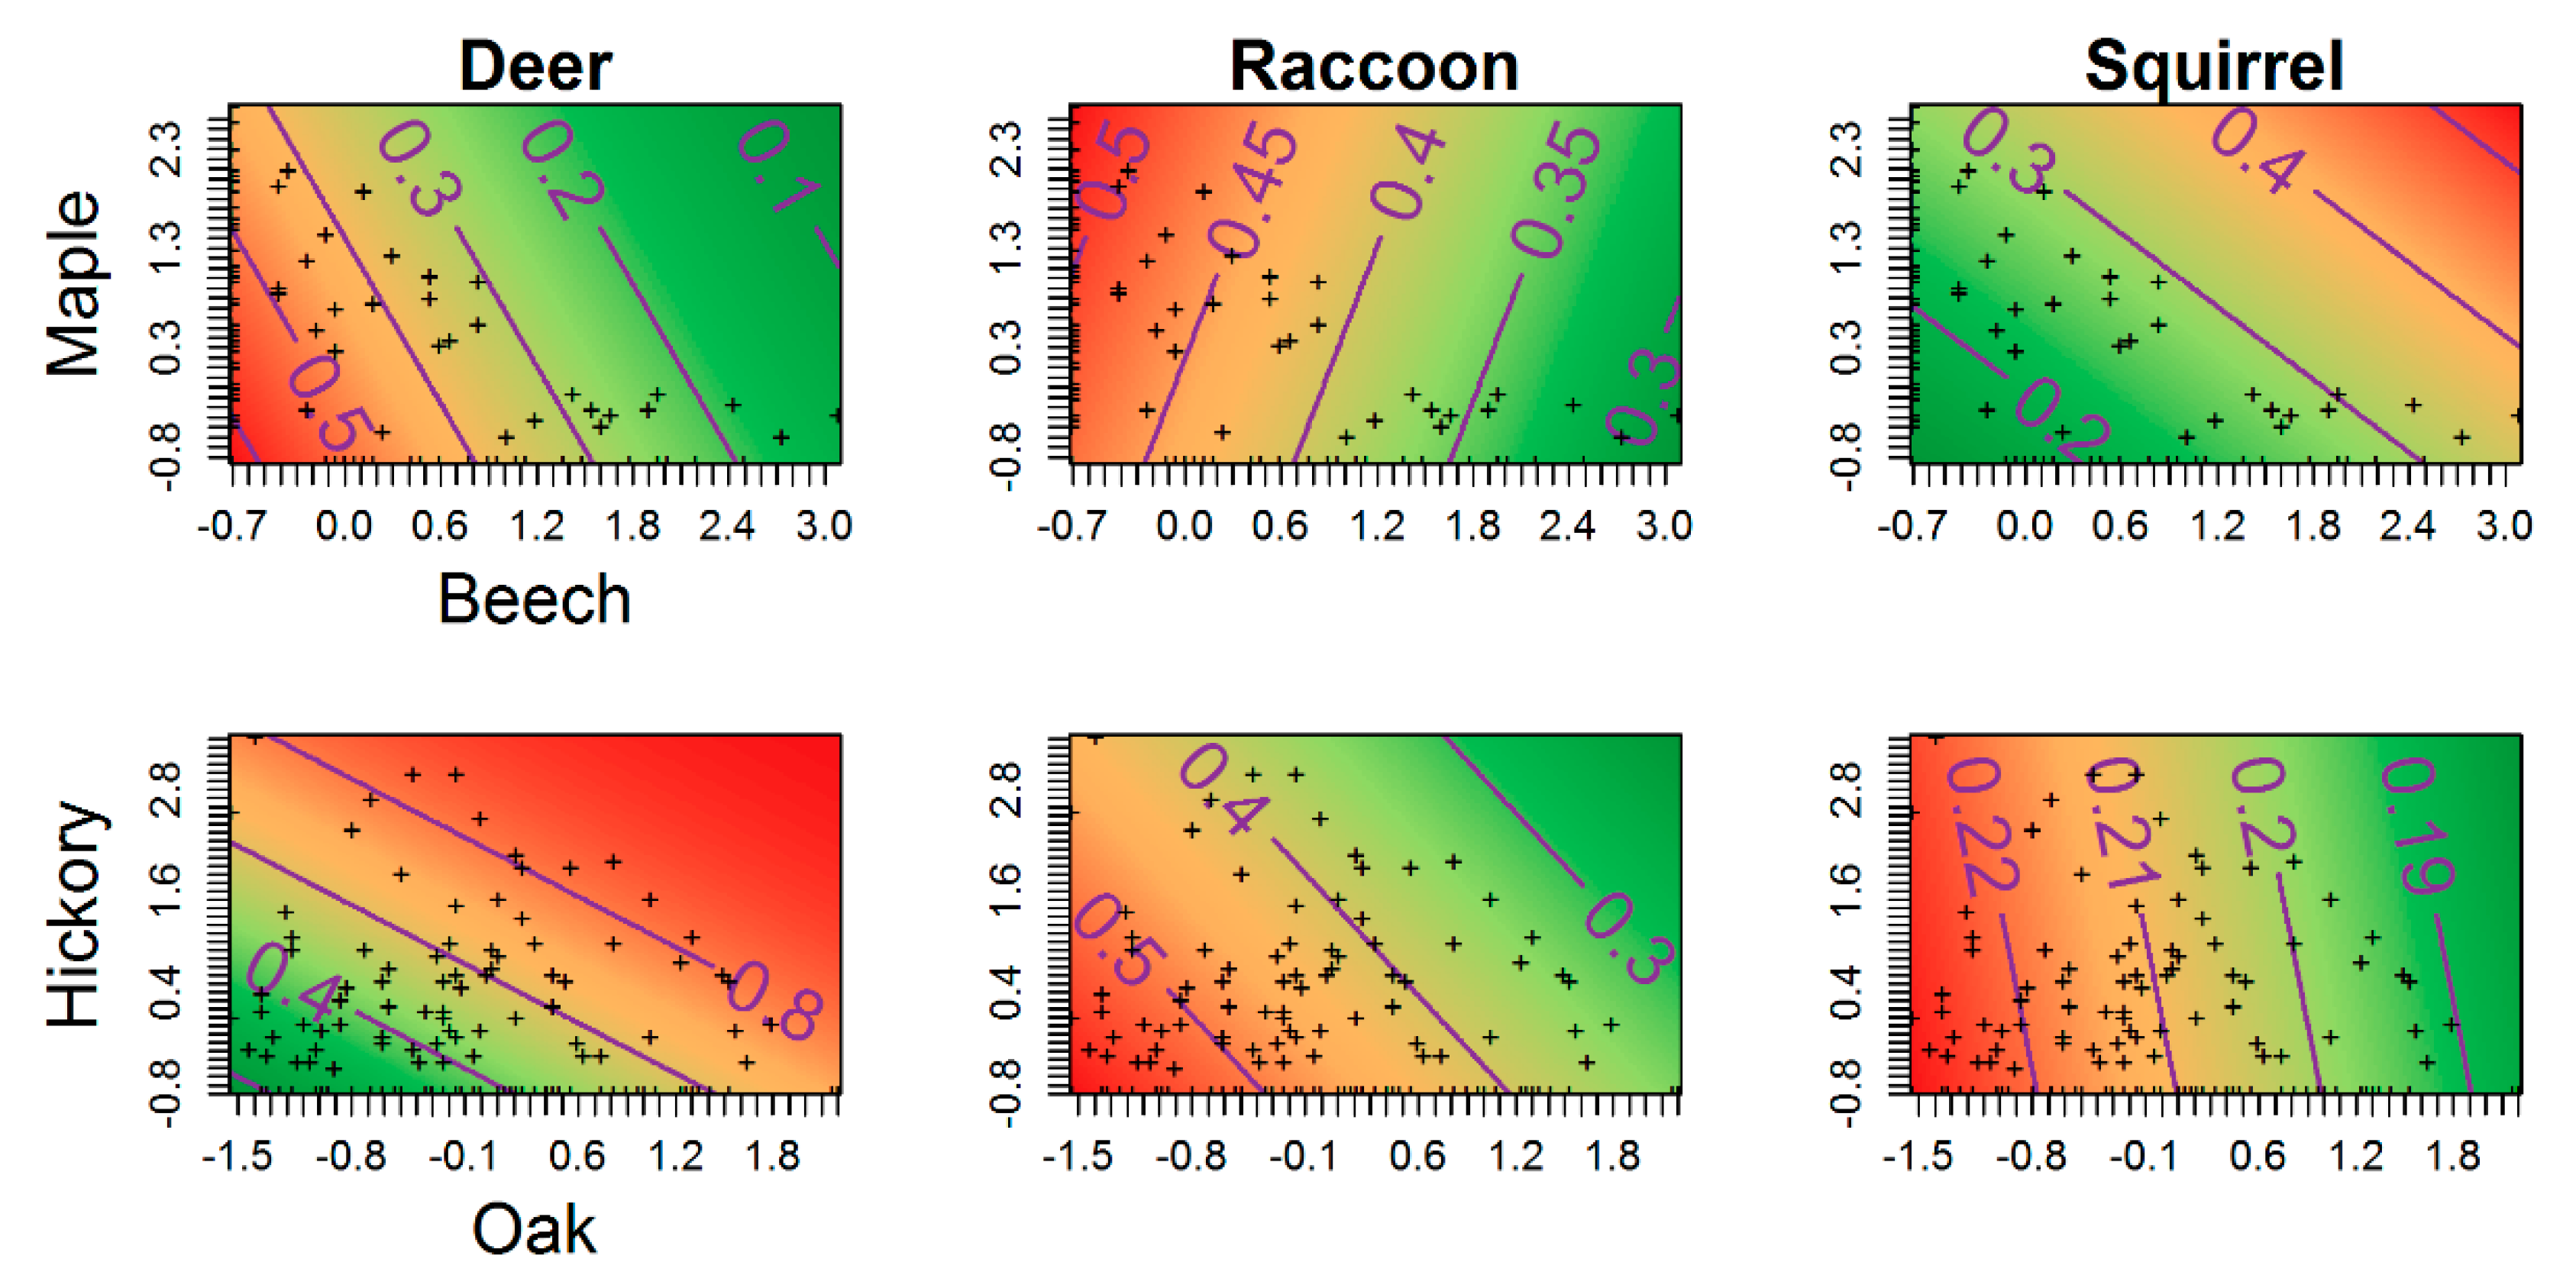
Model selection for white-tailed deer occupancy probability indicated forest composition better explained deer habitat use than forest structure (Table 4). Further, we found notable support for the preference of oak–hickory conditions, with a positive but imprecise relationship between deer occurrence and oak dominance at a site [; Figure 2B; Table S2]. Conversely, deer occupancy probabilities were lowest at sites dominated by maple–beech forest types, where a strong negative effect of beech dominance was found [; Figure 2B; Table S2]. Joint trends were apparent in oak–hickory vs. beech–maple associations as well, where our models predicted highest occupancy probabilities at sites most representative of mature oak–hickory stands (Figure 3). In general, there was little support for forest structure driving deer habitat use (Table 4).
For raccoon, a combination of the null model receiving the most support and the parameter estimates centered on zero indicate no effect of forest structure and composition characteristics on raccoon occupancy probability (Table 4). Gray squirrel model selection indicated substantial support for both forest composition and structure hypotheses over the null model (Table 4). Despite support over the null model, all parameter estimates for squirrel occupancy well-overlapped zero indicating weak and imprecise relationships. Interestingly, we found negative but imprecise associations between gray squirrel occurrence and ground vegetation cover, suggesting possible avoidance of sites with dense undergrowth conditions.
4. Discussion
Forest structure of the TTSF resembled sites in the Central Hardwood Region that have had little to no management over the past 40 years: mature oak-dominated overstory with a beech–maple midstory and a lack of oak regeneration [43,44]. We found that the composition of microsites within these stands better predicted deer occupancy probability than forest structure. Specifically, we found strong negative effects of American beech dominance on white-tailed deer habitat use, and positive but imprecise relationships with oak dominance, suggesting successional transitions underway may have implications for deer habitat use across the region. Our research provides insight into the implications of transitioning forests in southern Illinois and potentially surrounding areas with similar conditions on deer habitat use.
Our camera trap survey results were comparable to other regional camera trap surveys, where 9 to 28 species were detected, suggesting sufficient survey effort [31,45,46]. Detectability probabilities in our study were also comparable to similar regional and international mammal occupancy studies. O’Connell et al. [47] found white-tailed deer and raccoon null detection probabilities to be 0.16 and 0.38, respectively. Likewise, detection probabilities ranged from 0.11 to 0.51 across tropical mammals [48]. Other sampling approaches, such as GPS collars [49,50] coupled with resource selection functions [51] or even transect-based distance sampling to estimate densities [52] associated with differing forest conditions, would have likely been comparable alternatives to camera trapping, but of course the former options can be cost and labor intensive sampling approaches, especially when research objectives span beyond single species.
We found strong effects of forest composition on deer habitat use, and strong associations with understory structure, where deer habitat use was highest at sites with a mature oak–hickory overstory, little-to-no midstory growth, and dense understory vegetation. Further, deer occupancy was negatively related to beech and maple importance values, suggesting some preference for oak–hickory forest types. Since it is unlikely a result of spatial avoidance of potential predators, our results may indicate higher food quality and/or availability at sites dominated by oak and hickory species [19,27]. Given the seasonality of our study, food availability in this region was primarily limited to green leafy material, such as forbs, grasses, and green leaves, from tree species and fungi [15]. Late successional species, such as American beech—particularly when dominating the midstory—tend to cast the deepest shade which can lead to scant ground cover, while mid-successional oak and hickory species allow greater light penetration and presumably higher forage quality and availability [53]. As the successional transition continues, the differences in spring and summer ground cover among forest associations will likely exacerbate, potentially magnifying differences in deer summer habitat use patterns.
Model selection indicated little support for the forest structure or composition hypotheses as predictors of summer habitat use of raccoons. Despite a lack of strong associations in our study, others have found support for raccoon habitat use and different forest types. Pedlar et al. [54] found raccoon habitat use to be positively associated with sugar maple abundance. Similar results were found in a comparison study of oak–hickory forest types and beech–maple forest types, where Gysel [55] found that raccoons displayed higher use of beech–maple sites due to the significantly higher number of tree cavities available at these sites. This suggests that a more pronounced response by raccoons to the successional transition underway is likely, but our study area may be too early in the transition period for there to be detectable differences in raccoon habitat use patterns.
Our findings that gray squirrel had nil associations with beech–maple and oak–hickory dominance was contrary to our predictions. This, however, suggest that food type and availability may not be a limiting resource during our study. A seasonal diet study of gray squirrels in the Midwestern USA found oak catkins, hickory flowers, and remnant caches of the previous year’s acorn crop to be the principal food items consumed in late spring (April-May), while soft mast, such as mulberries (Morus spp.), and hard mast, such as hickory nuts and black walnuts, were the most consumed items during the summer period [56]. The preference for oak–hickory food resources in previous studies but higher habitat-use probabilities in beech–maple conditions in our study may suggest forest structure is also a contributor to their summer patterns. Oak and hickories can be important food resources for gray squirrels, but they often do not provide the same quantity of nesting sites (i.e., tree cavities) as beech primarily due to differences in tree morphology [55,57].
We found a negative but imprecise relationship between gray squirrel habitat use and ground vegetation cover. Previously, gray squirrel habitat use has been positively associated with understory density [58,59], with some literature suggesting it may be to mitigate competition with fox squirrels (Sciurus niger) through spatial avoidance. We, however, did not detect fox squirrels in our study area, which may contribute to why we found negative relationships, as have others in the region [60]. Additionally, despite providing cover, structure for traversing, and feeding opportunities [61], we found a negative relationship between CWD volume and gray squirrels. The positive association with maple–beech sites may minimize the importance of CWD to gray squirrels, given that beech trees are more prone to decay, resulting in standing snags with many cavities, providing nesting and feeding opportunities elsewhere. These findings suggest gray squirrels are responding well to successional shifts, but given their dependence on oaks and hickories for food resources during the dormant season, it is unlikely this species will use areas composed completely of late-successional, mesophytic species.
Regional cooperation and collective effort from multiple agencies are often needed to meet multiple-use objectives, such as sustaining a range of wildlife taxa and functional groups, while simultaneously maintaining a shifting mosaic of forest age, structure, and composition for production and diversity [62]. State- or federally-owned forested lands that are mandated to provide recreation and timber production are ideal for maintaining diverse forest conditions. Importantly, active forest management tends to provide often absent stages of forest development, such as early-successional forest habitat, ultimately providing a breadth of wildlife habitat [63]. Nonetheless, management strategies can be limited by public demands for continuous canopy cover and low-intensity silvicultural options, leading to homogenous conditions across large geographic space and affecting wildlife distribution and habitat use patterns [64]. Research that creates a link between wildlife abundance and diversity and forest management practices has the potential to show the importance of actively managing forested patches, and emphasizing public education efforts to elucidate this relationship should be included in land management strategies [65]. For example, in oak-dominated systems management actions that are known perpetuate oak dominance, such as prescribed fire, thinning, or overstory removal, may also improve wildlife habitat for some species and should be further explored [66]. Future research should work to provide year-round comparisons of habitat use among forest stands differing in composition, which may offer additional insight into the implications of shifting forest composition across the region [67].
5. Conclusions
Forests in the eastern United States are changing in composition and structure due primarily to historically different management and societal values in the late 20th to early 21st century [65]. Several studies have raised concerns regarding the impending successional shift underway, and its impacts on wildlife communities [11,12] and our study supports these concerns. The relationships observed in this study will likely strengthen over time with continued increased abundance of maple and beech in the Central Hardwood Region. This may be particularly important for deer across the region, and efforts should be made to monitor these effects. Under current management regimes commonly practiced in this area, e.g., fire suppression and favoring of partial, uneven-aged cutting schemes, on both private and public lands, these late-successional species are favored and appear to create unsuitable conditions for a variety of wildlife taxa. Creating a patchwork of differing forest composition and structure through active management will likely maintain components needed for year-round patch use by the mammal community and can aid wildlife adaptation to an increasingly anthropogenic landscape.
Supplementary Materials
The following are available online at https://0-www-mdpi-com.brum.beds.ac.uk/1424-2818/11/9/160/s1, Table S1: Model-averaged estimates of covariate coefficients (β), standard errors (SE), and 95% confidence intervals from detection probability (p) models for white-tailed deer, raccoon, and eastern gray squirrel during May to August 2015–2016 in the Trail of Tears State Forest, Union County, Illinois, USA., Table S2: Model-averaged estimates of covariate coefficients (β), standard errors (SE), and 95% confidence intervals from occupancy models for white-tailed deer, raccoon, and eastern gray squirrel during May to August 2015–2016 in the Trail of Tears State Forest, Union County, Illinois, USA.
Author Contributions
Conceptualization, E.J.H. and C.K.N.; methodology, B.S.P.; software, B.S.P.; validation, B.S.P., E.J.H., and C.K.N.; formal analysis, B.S.P.; investigation, B.S.P.; resources, E.J.H. and C.K.N.; data curation, B.S.P.; writing—original draft preparation, B.S.P.; writing—review and editing, B.S.P., E.J.H., and C.K.N.; visualization, B.S.P.; supervision, B.S.P., E.J.H., and C.K.N.; project administration, B.S.P., E.J.H, and C.K.N.; funding acquisition, E.J.H. and C.K.N.
Funding
This work was funded by the McIntire-Stennis Formula Grant through the National Institute of Food and Agriculture (http://nifa.usda.gov). The funders had no role in study design, data collection, and analysis, decision to publish, nor preparation of the manuscript.
Acknowledgments
We would like to thank the Illinois Department of Natural Resources, the Cooperative Wildlife Laboratory, and the Department of Forestry within the College of Agricultural Sciences at the Southern Illinois University for supporting this research. Additional thanks to Anna Boruszewski, Joyce Romerio, and Sean Crouch for field and lab assistance.
Conflicts of Interest
The authors declare no conflict of interest.
References
- Johnson, P.S.; Shifley, S.R.; Rogers, R. The Ecology and Silviculture of Oaks; CABI: Boston, MA, USA, 2009. [Google Scholar]
- Abrams, M.D. Fire and the Development of Oak Forests—In Eastern North-America, Oak Distribution Reflects a Variety of Ecological Paths and Disturbance Conditions. Bioscience 1992, 42, 346–353. [Google Scholar] [CrossRef]
- Lorimer, C.G. Development of the Red Maple Understory in Northeastern Oak Forests. Forest Sci. 1984, 30, 3–22. [Google Scholar]
- Ozier, T.B.; Groninger, J.W.; Ruffner, C.M. Community composition and structural changes in a managed Illinois Ozark Hills Forest. Am. Midl. Nat. 2006, 155, 253–269. [Google Scholar] [CrossRef]
- Abrams, M.D. Where has all the white oak gone? Bioscience 2003, 53, 927–939. [Google Scholar] [CrossRef]
- McEwan, R.W.; Dyer, J.M.; Pederson, N. Multiple interacting ecosystem drivers: Toward an encompassing hypothesis of oak forest dynamics across eastern North America. Ecography 2011, 34, 244–256. [Google Scholar] [CrossRef]
- Van de Gevel, S.; Ozier, T.B.; Ruffner, C.M.; Groninger, J.W. Relating past land-use, topography, and forest dynamics in the Illinois Ozark Hills. US Serv. T R Nc 2003, 234, 246. [Google Scholar]
- Holzmueller, E.J.; Gibson, D.J.; Suchecki, P.F. Accelerated succession following an intense wind storm in an oak-dominated forest. Forest Ecol. Manag. 2012, 279, 141–146. [Google Scholar] [CrossRef]
- Fralish, J.S. The keystone role of oak and hickory in the central hardwood forest. In Upland Oak Ecology Symposium: History, Current Conditions, and Sustainability; Department of Agriculture, Forest Service, Southern Research Station: Asheville, NC, USA, 2004; p. 311. [Google Scholar]
- Ellison, A.M.; Bank, M.S.; Clinton, B.D.; Colburn, E.A.; Elliott, K.; Ford, C.R.; Foster, D.R.; Kloeppel, B.D.; Knoepp, J.D.; Lovett, G.M.; et al. Loss of foundation species: Consequences for the structure and dynamics of forested ecosystems. Front. Ecol. Environ. 2005, 3, 479–486. [Google Scholar] [CrossRef]
- McShea, W.J.; Healy, W.M.; Devers, P.; Fearer, T.; Koch, F.H.; Stauffer, D.; Waldon, J. Forestry matters: Decline of oaks will impact wildlife in hardwood forests. J. Wild. Manag. 2007, 71, 1717–1728. [Google Scholar] [CrossRef]
- Rodewald, A.D. Decline of oak forests and implications for forest wildlife conservation. Nat. Area J. 2003, 23, 368–371. [Google Scholar]
- Martin, A.C.; Zim, H.S.; Nelson, A.L. American Wildlife and Plants: A guide to Wildlife Food Habits; McGraw-Hill Book Company, Inc.: New York, NY, USA, 1951; p. 500. [Google Scholar]
- Van Dersal, W.R. Utilization of oaks by birds and mammals. J. Wild. Manag. 1940, 4, 404–428. [Google Scholar] [CrossRef]
- Johnson, A.S.; Hale, P.E.; Ford, W.M.; Wentworth, J.M.; French, J.R.; Anderson, O.F.; Pullen, G.B. White-Tailed Deer Foraging in Relation to Successional Stage, Overstory Type and Management of Southern Appalachian Forests. Am. Midl. Nat. 1995, 133, 18–35. [Google Scholar] [CrossRef]
- Feldhamer, G. Acorns and White-Tailed Deer: Interrelationships in Forest Ecosystems. In Oak Forest Ecosystems: Ecology and Management for Wildlife; McShea, W.J., Healy, W.M., Eds.; John Hopkins University Press: Baltimore, MD, USA, 2002; pp. 215–223. [Google Scholar]
- McShea, W.J.; Schwede, G. Variable Acorn Crops—Responses of White-Tailed Deer and Other Mast Consumers. J. Mammal. 1993, 74, 999–1006. [Google Scholar] [CrossRef]
- Ostfeld, R.S. Ecological Webs Involving Acorns and Mice. In Oak Forest Ecosystems: Ecology and Management for Wildlife; McShea, W.J., Healy, W.M., Eds.; Johns Hopkins University Press: Baltimore, MD, USA, 2002; pp. 196–214. [Google Scholar]
- Rodewald, A.D.; Abrams, M.D. Floristics and avian community structure: Implications for regional changes in eastern forest composition. For. Sci. 2002, 48, 267–272. [Google Scholar]
- Grado, S.C.; Hunt, K.M.; Whiteside, M.W. Economic impacts of white-tailed deer hunting in Mississippi. Proc. South. Assoc. Fish Wildlife Agencies 2007, 61, 59–67. [Google Scholar]
- MacKenzie, D.I.; Nichols, J.D.; Lachman, G.B.; Droege, S.; Royle, J.A.; Langtimm, C.A. Estimating site occupancy rates when detection probabilities are less than one. Ecology 2002, 83, 2248–2255. [Google Scholar] [CrossRef]
- Ford, W.M.; Johnson, A.S.; Hale, P.E.; Wentworth, J.M. Availability and use of spring and summer woody browse by deer in clearcut and uncut forests of the southern Appalachians. South. J. Appl. Forest. 1993, 17, 116–119. [Google Scholar] [CrossRef]
- Korschgen, L.J. Foods of Missouri deer, with some management implications. J. Wild. Manag. 1962, 26, 164–172. [Google Scholar] [CrossRef]
- Korschgen, L.J.; Porath, W.R.; Torgerson, O. Spring and summer foods of deer in the Missouri Ozarks. J. Wild. Manag. 1980, 89–97. [Google Scholar] [CrossRef]
- Yeager, L.E.; Elder, W.H. Pre-and post-hunting season foods of raccoons on an Illinois goose refuge. J. Wild. Manag. 1945, 9, 48–56. [Google Scholar] [CrossRef]
- Johnson, D.H. The Comparison of Usage and Availability Measurements for Evaluating Resource Preference. Ecology 1980, 61, 65–71. [Google Scholar] [CrossRef]
- MacKenzie, D.I.; Nichols, J.D.; Royle, J.A.; Pollock, K.H.; Bailey, L.L.; Hines, J.E. Occupancy Estimation and Modeling: Inferring Patterns and Dynamics of Species Occurrence; Academic Press: Cambridge, MA, USA, 2006. [Google Scholar]
- Welbourne, D.J.; Claridge, A.W.; Paull, D.J.; Lambert, A. How do passive infrared triggered camera traps operate and why does it matter? Breaking down common misconceptions. Remot. Sens. in Ecol. Conservat. 2016, 2, 77–83. [Google Scholar] [CrossRef] [Green Version]
- Meek, P.D.; Ballard, G.; Claridge, A.; Kays, R.; Moseby, K.; O’Brien, T.; O’Connell, A.; Sanderson, J.; Swann, D.E.; Tobler, M.; et al. Recommended guiding principles for reporting on camera trapping research. Biodivers. Conserv. 2014, 23, 2321–2343. [Google Scholar] [CrossRef]
- Cusack, J.J.; Dickman, A.J.; Rowcliffe, J.M.; Carbone, C.; Macdonald, D.W.; Coulson, T. Random versus Game Trail-Based Camera Trap Placement Strategy for Monitoring Terrestrial Mammal Communities. PLoS ONE 2015, 10, e0126373. [Google Scholar] [CrossRef] [PubMed]
- Lesmeister, D.B.; Nielsen, C.K.; Schauber, E.M.; Hellgren, E.C. Spatial and Temporal Structure of a Mesocarnivore Guild in Midwestern North America. Wildlife Monogr. 2015, 191, 1–61. [Google Scholar] [CrossRef]
- VerCauteren, K.; Hygnstrom, S.E. Managing white-tailed deer: Midwest North America. In Biology and Management of White-Tailed Deer; Hewitt, D.G., Ed.; CRC Press: Boca Raton, FL, USA, 2011; pp. 501–535. [Google Scholar]
- McShea, W.J.; Healy, W.M. Oak Forest Ecosystems: Ecology and Management for Wildlife; Johns Hopkins University Press: Baltimore, MD, USA, 2002; p. xiii. 432p. [Google Scholar]
- Jenkins, M.A.; Webster, C.R.; Parker, G.R.; Spetich, M.A. Coarse woody debris in managed Central Hardwood Forests of Indiana, USA. For. Sci. 2004, 50, 781–792. [Google Scholar]
- Dee, D.P.; Uppala, S.; Simmons, A.; Berrisford, P.; Poli, P.; Kobayashi, S.; Andrae, U.; Balmaseda, M.; Balsamo, G.; Bauer, D.P. The ERA-Interim reanalysis: Configuration and performance of the data assimilation system. Quar. J. Royal Meteorol. Soc. 2011, 137, 553–597. [Google Scholar] [CrossRef]
- Mesinger, F.; DiMego, G.; Kalnay, E.; Mitchell, K.; Shafran, P.C.; Ebisuzaki, W.; Jović, D.; Woollen, J.; Rogers, E.; Berbery, E.H. North American regional reanalysis. Bull. Am. Meteorol. Soc. 2006, 87, 343–360. [Google Scholar] [CrossRef]
- R Core Team. R: A Language and Environment for Statistical Computing; R Foundation for Statistical Computing: Vienna, Austria, 2015. [Google Scholar]
- Fiske, I.J.; Chandler, R.B. Unmarked: An R Package for Fitting Hierarchical Models of Wildlife Occurrence and Abundance. J. Stat. Softw. 2011, 43, 1–23. [Google Scholar] [CrossRef]
- Mazerolle, M.J. AICcmodavg: Model Selection and Multimodel Inference Based on (Q) AIC (c). Available online: https://cran.r-project.org/package=AICcmodavg (accessed on 5 January 2015).
- Burnham, K.P.; Anderson, D.R. Model Selection and Multimodel Inference: A Practical Information-Theoretic Approach, 2nd ed.; Springer: New York, NY, USA, 2002; p. xxvi. 488p. [Google Scholar]
- Kéry, M.; Royle, J.A. Applied Hierarchical Modeling in Ecology: Analysis of Distribution, Abundance and Species Richness in R and BUGS. Volume 1, Prelude and Static Models; Academic Press & Elsevier: Cambridge, MA, USA, 2016; Volume 1, p. 808. [Google Scholar]
- MacKenzie, D.I.; Bailey, L.L. Assessing the fit of site-occupancy models. J. Agric. Biol. Environ. Stat. 2004, 9, 300–318. [Google Scholar] [CrossRef]
- Holzmueller, E.J.; Groninger, J.W.; Ruffner, C.M.; Ozier, T.B. Composition of Oak Stands in the Illinois Ozark Hills 2 Decades following Light Harvesting and No Cutting. North. J. Appl. For. 2011, 28, 50–53. [Google Scholar] [CrossRef] [Green Version]
- Fei, S.; Kong, N.; Steiner, K.C.; Moser, W.K.; Steiner, E.B. Change in oak abundance in the eastern United States from 1980 to 2008. For. Ecol. Manag. 2011, 262, 1370–1377. [Google Scholar] [CrossRef]
- Cove, M.V.; Jones, B.M.; Bossert, A.J.; Clever, D.R., Jr.; Dunwoody, R.K.; White, B.C.; Jackson, V.L. Use of camera traps to examine the mesopredator release hypothesis in a fragmented Midwestern landscape. Am. Mid. Nat. 2012, 168, 456–465. [Google Scholar] [CrossRef]
- Pease, B.S.; Nielsen, C.K.; Holzmueller, E.J. Single-camera trap survey designs miss detections: Impacts on estimates of occupancy and community metrics. PLoS ONE 2016, 11, e0166689. [Google Scholar] [CrossRef] [PubMed]
- O’Connell, A.F.; Talancy, N.W.; Bailey, L.L.; Sauer, J.R.; Cook, R.; Gilbert, A.T. Estimating site occupancy and detection probability parameters for meso- and large mammals in a coastal ecosystem. J. Wild. Manag. 2006, 70, 1625–1633. [Google Scholar] [CrossRef]
- Rovero, F.; Martin, E.; Rosa, M.; Ahumada, J.A.; Spitale, D. Estimating Species Richness and Modelling Habitat Preferences of Tropical Forest Mammals from Camera Trap Data. PLoS ONE 2014, 9, e103300. [Google Scholar] [CrossRef] [PubMed]
- Webb, S.L.; Gee, K.L.; Strickland, B.K.; Demarais, S.; DeYoung, R.W. Measuring fine-scale white-tailed deer movements and environmental influences using GPS collars. Int. J. Ecol. 2010, 2010, 459610. [Google Scholar] [CrossRef]
- Bowman, J.L.; Kochanny, C.O.; Demarais, S.; Leopold, B.D. Evaluation of a GPS collar for white-tailed deer. Wild. Soc. Bull. 2000, 141–145. [Google Scholar]
- Boyce, M.S.; McDonald, L.L. Relating populations to habitats using resource selection functions. Trends Ecol. Evol. 1999, 14, 268–272. [Google Scholar] [CrossRef]
- LaRue, M.A.; Nielsen, C.K.; Grund, M.D. Using distance sampling to estimate densities of white-tailed deer in south-central Minnesota. Prairie Nat. 2007, 39, 57–68. [Google Scholar]
- Canham, C.D.; Finzi, A.C.; Pacala, S.W.; Burbank, D.H. Causes and Consequences of Resource Heterogeneity in Forests—Interspecific Variation in Light Transmission by Canopy Trees. Can. J. For. Res. 1994, 24, 337–349. [Google Scholar] [CrossRef]
- Pedlar, J.H.; Fahrig, L.; Merriam, H.G. Raccoon habitat use at 2 spatial scales. J. Wild. Manag. 1997, 61, 102–112. [Google Scholar] [CrossRef]
- Gysel, L.W. An ecological study of tree cavities and ground burrows in forest stands. J. Wild. Manag. 1961, 25, 12–20. [Google Scholar] [CrossRef]
- Korschgen, L.J. Foods of fox and gray squirrels in Missouri. J. Wild. Manag. 1981, 45, 260–266. [Google Scholar] [CrossRef]
- Brown, L.G.; Yeager, L.E. Fox Squirrels and Gray Squirrels in Illinois; Illinois Natural History Survey Bulletin: Urbana, IL, USA, 1945; Volume 23, pp. 449–533. [Google Scholar]
- Taylor, G.J. Present Status and Habitat Survey of the Delmarva Fox Squirrel (Sciurus niger cinereus) with a Discussion of Reasons for its Decline; University of Maryland: College Park, MD, USA, 1973. [Google Scholar]
- Nixon, C.M.; Havera, S.P.; Greenberg, R.E. Distribution and Abundance of the Gray Squirrel in Illinois; Department of Registration and Education, Natural History Survey Division: Urbana, IL, USA, 1978; number 105; pp. 1–56. [Google Scholar]
- Brown, B.W.; Batzli, G.O. Habitat selection by fox and gray squirrels: A multivariate analysis. J. Wild. Manag. 1984, 48, 616–621. [Google Scholar] [CrossRef]
- Loeb, S.C. The role of coarse woody debris in the ecology of southeastern mammals. In Biodiversity and coarse woody debris in southern forests: Effects on biodiversity. In Proceedings of the Workshop on Coarse Woody Debris in Southern Forests, Athens, GA, USA, 18–20 October; 1993; pp. 108–118. [Google Scholar]
- Petit, L.J.; Petit, D.R.; Martin, T.E. Landscape-Level Management of Migratory Birds—Looking Past the Trees to See the Forest. Wild. Soc. Bull. 1995, 23, 420–429. [Google Scholar]
- Askins, R.A. Sustaining biological diversity in early successional communities: The challenge of managing unpopular habitats. Wild. Soc. Bull. 2001, 29, 407–412. [Google Scholar]
- Shinder, B.; Steel, B.; List, P. Public judgements of adaptive management: A response from forest communities. J. For. 1996, 94, 4–12. [Google Scholar]
- Pease, B.S. Summer Habitat Use by a Mammal Community of an Oak-Dominated Ecosystem in the Central Hardwood Region; Southern Illinois University at Carbondale: Carbondale, IL, USA, 2017. [Google Scholar]
- Lashley, M.A.; Harper, C.A.; Bates, G.E.; Keyser, P.D. Forage Availability for White-Tailed Deer Following Silvicultural Treatments in Hardwood Forests. J. Wild. Manag. 2011, 75, 1467–1476. [Google Scholar] [CrossRef]
- Beier, P.; McCullough, D.R. Factors influencing white-tailed deer activity patterns and habitat use. Wild. Monogr. 1990, 3–51. [Google Scholar]
Figure 1.
Study Area and remote camera distribution in the Trail of Tears State Forest, Illinois, USA. Top left: Overview of Illinois highlighting the location of Union County. Bottom left: Union County in the Ozark Plateau with the Trail of Tears State Forest outlined. Right: Study area at the Trail of Tears State Forest showing remote camera distribution across the study area.

Figure 2.
Model-averaged estimates of regression coefficients for detection covariates (A) and occupancy covariates (B) for white-tailed deer, raccoon, and eastern gray squirrel during May to August 2015–2016 in the Trail of Tears State Forest, Union County, Illinois, USA. Error bars denote 95% confidence intervals. The coefficient was considered to have a statistically significant influence on the parameter of interest if 95% confidence intervals did not overlap a regression coefficient value of 0. Asterisks (*) indicate the variable represents species-specific importance values.

Figure 3.
Two-dimensional predictions of the joint relationships of occupancy probability with sugar maple and American beech (top row) and oak and hickory (bottom row) for white-tailed deer, raccoon, and eastern gray squirrel (represented in each column) during May to August 2015–2016 in the Trail of Tears State Forest, Union County, Illinois, USA. Covariate values are along the x- and y-axis and are mean-centered on zero with range representing +/− one standard deviation. Predicted occupancy probabilities are along the z-axis (contours). Plus signs denote the observed covariate values in the data set.


Table 1.
Covariates used in single-season occupancy models for white-tailed deer, raccoon, and eastern gray squirrel from observation data recorded with remote camera surveys during May to August 2015–2016 in the Trail of Tears State Forest, Union County, Illinois, USA. Each variable is categorized according to our main hypotheses, including covariates affecting the observation process to account for variation not directly related to our main hypotheses.
| Hypothesis | Process | Covariate | Description |
|---|---|---|---|
| Forest composition | Occupancy | Maple importance | Site-specific importance value 1 for sugar maple (Acer saccharum) |
| Forest composition | Occupancy | Beech importance | Site-specific importance value for American beech (Fagus grandifolia) |
| Forest composition | Occupancy | Oak importance | Site-specific importance value for oak species (Quercus spp.) |
| Forest composition | Occupancy | Hickory importance | Site-specific importance value for hickory species (Carya spp.) |
| Forest composition | Occupancy | Yellow poplar importance | Site-specific importance value for yellow poplar (Liriodendron tulipifera) |
| Forest structure | Occupancy | Ground cover | Percentage ground (<1 m) vegetation cover |
| Forest structure | Occupancy | Seedling density | The number of seedlings per m−1 (woody stems up to 2.5 cm in diameter and at least 30.5 cm in height) |
| Forest structure | Occupancy | Sapling density | The number of woody stems per m−1 with a diameter of 2.5 to 7.6 cm |
| Forest structure | Occupancy | Coarse woody debris (CWD) | Site-specific volume of dead and downed trees, calculated using tree length and diameter at midpoint 2 |
| Forest structure | Occupancy | Overstory density | The number of trees >1 m in height and with a diameter of ≥7.6 cm per m−1 |
| Forest structure | Occupancy | Basal area | Tree area in square meters of the cross-section at breast height, presented as m2 ha−1 |
| Forest structure | Occupancy | Mean DBH | Site-specific mean diameter at breast height (dbh) |
| Temporal | Detection | Month | Month of camera survey |
| Temporal | Detection | Year | Year of camera survey |
| Temporal | Detection | Previous detection | A categorical indicator of whether a given mammal species was previously detected at a given site |
| Environmental | Detection | Precipitation | NCEP NARR 3 precipitation rate at the surface, averaged over a 1-week survey period |
| Environmental | Detection | Temperature | ECMWF 4 Interim Full Daily Surface Temperature (2 m above-ground), averaged over a 1-week survey period |
| Environmental | Detection | Topographic slope | Topographic slope at a camera-site; included to account for variation in slopes (10%–42%) across camera-sites as a potential factor in varying detection probabilities |
1 Importance value is calculated as the site-specific average of the relative density and relative basal area. 2 Volume = π * diameter at midpoint * length of tree bole. 3 National Centers for Environmental Prediction North American Regional Reanalysis. 4 European Centre for Medium-Range Weather Forecasts.
Table 2.
Basal area, density, and importance values of the most frequently occurring overstory (>7.6 cm dbh) and understory (2.5 cm < dbh < 7.6 cm) tree species recorded during May to August 2015–2016 in the Trail of Tears State Forest, Union County, Illinois, USA.
Table 2.
Basal area, density, and importance values of the most frequently occurring overstory (>7.6 cm dbh) and understory (2.5 cm < dbh < 7.6 cm) tree species recorded during May to August 2015–2016 in the Trail of Tears State Forest, Union County, Illinois, USA.
| Overstory | Understory | |||||||
|---|---|---|---|---|---|---|---|---|
| Importance Value 1 | Basal Area (m2 ha−1) | Density (Stems ha−1) | Density (Stems ha−1) | |||||
| Species | MEAN | SE | MEAN | SE | MEAN | SE | MEAN | SE |
| Overall | - | - | 24 | 0.5 | 406 | 23 | 947 | 67 |
| White oak (Quercus alba) | 26 | 1.7 | 7 | 0.5 | 61 | 6 | 2 | 2 |
| Sugar maple (Acer saccharum) | 16 | 1.5 | 2 | 0.2 | 95 | 12 | 171 | 24 |
| American beech (Fagus grandifolia) | 12 | 1.4 | 2 | 0.2 | 79 | 13 | 554 | 47 |
| Black oak (Quercus velutina) | 9 | 1.1 | 3 | 0.3 | 15 | 2 | 0 | 0 |
| Yellow poplar (Liriodendron tulipifera) | 7 | 1.1 | 2 | 0.3 | 20 | 6 | 8 | 4 |
| N. red oak (Quercus rubra) | 6 | 0.8 | 2 | 0.3 | 13 | 2 | 0 | 0 |
| Mockernut hickory (Carya tomentosa) | 5 | 0.8 | 1 | 0.2 | 29 | 7 | 10 | 5 |
| Sweetgum (Liquidambar styraciflua) | 3 | 0.6 | 1 | 0.2 | 14 | 4 | 8 | 5 |
| Bitternut hickory (Carya cordiformis) | 2 | 0.6 | 1 | 0.1 | 13 | 4 | 0 | 0 |
1 Importance value is calculated as the site-specific average of the relative density and relative basal area.
Table 3.
Model selection of the observation process (p) for white-tailed deer, raccoon, and eastern gray squirrel during May to August 2015–2016 in the Trail of Tears State Forest, Union County, Illinois, USA. To estimate p for each species, we held occupancy constant and fit encounter history data from three 1-week surveys at 140 remote camera-sites to the candidate model set. Bold font indicates the model with the lowest AIC value.
| Species | ||||
|---|---|---|---|---|
| Model Name | AIC a | ΔAIC b | Ω c | K d |
| White-tailed deer | ||||
| Null | 296.95 | 0.00 | 0.64 | 2 |
| Temporal | 298.69 | 1.74 | 0.27 | 5 |
| Environmental | 301.41 | 4.47 | 0.07 | 5 |
| Temporal + Environmental | 303.51 | 6.57 | 0.02 | 8 |
| Raccoon | ||||
| Null | 319.97 | 7.73 | 0.02 | 2 |
| Temporal | 318.13 | 6.16 | 0.04 | 5 |
| Environmental | 311.97 | 0.00 | 0.82 | 5 |
| Temporal + Environmental | 315.64 | 3.66 | 0.13 | 8 |
| Eastern gray squirrel | ||||
| Null | 173.13 | 7.36 | 0.02 | 2 |
| Temporal | 165.76 | 0.00 | 0.76 | 5 |
| Environmental | 174.46 | 8.70 | 0.01 | 5 |
| Temporal + Environmental | 168.37 | 2.61 | 0.21 | 8 |
a Akaiki information criterion; b Difference of AIC points in the current model from the top model; c Model weight, interpreted as model probability; d Number of model parameters.
Table 4.
Complete occupancy results for eastern gray squirrel, raccoon, and white-tailed deer during May to August 2015–2016 in the Trail of Tears State Forest, Union County, Illinois, USA. We fit encounter history data from three 1-week surveys at 140 remote camera-sites to the candidate model set. For all models, the detection model was the most supported model from detectability modeling process for each species (Table 3). Bold font indicates the model with the lowest Akaike’s information criterion (AIC) value.
| Species | |||||
|---|---|---|---|---|---|
| Hypothesis | Model Name | AIC a | ΔAIC b | ω c | K d |
| White-tailed deer | |||||
| Null | Null | 296.95 | 0.73 | 0.30 | 2 |
| Composition | Beech + Maple | 297.77 | 1.56 | 0.20 | 5 |
| Composition | Oak + Hickory | 296.21 | 0.00 | 0.43 | 5 |
| Structure | Understory | 300.49 | 4.28 | 0.05 | 6 |
| Structure | Overstory | 301.79 | 5.58 | 0.03 | 5 |
| Raccoon | |||||
| Null | Null | 311.97 | 0.00 | 0.62 | 5 |
| Composition | Beech + Maple | 315.16 | 3.18 | 0.13 | 8 |
| Composition | Oak + Hickory | 315.02 | 3.05 | 0.14 | 8 |
| Structure | Understory | 316.64 | 4.66 | 0.06 | 9 |
| Structure | Overstory | 316.66 | 4.69 | 0.06 | 8 |
| Eastern gray squirrel | |||||
| Null | Null | 174.46 | 4.09 | 0.05 | 5 |
| Composition | Beech + Maple | 170.37 | 0.00 | 0.35 | 8 |
| Composition | Oak + Hickory | 171.50 | 1.12 | 0.20 | 8 |
| Structure | Understory | 171.27 | 0.90 | 0.22 | 9 |
| Structure | Overstory | 171.55 | 1.18 | 0.19 | 8 |
a Akaiki Information Criterion; b Difference of AIC points in the current model from the top model; c Model weight, interpreted as model probability; d Number of model parameters.
© 2019 by the authors. Licensee MDPI, Basel, Switzerland. This article is an open access article distributed under the terms and conditions of the Creative Commons Attribution (CC BY) license (http://creativecommons.org/licenses/by/4.0/).
Share and Cite
MDPI and ACS Style
Pease, B.S.; Holzmueller, E.J.; Nielsen, C.K. Influence of Forest Structure and Composition on Summer Habitat Use of Wildlife in an Upland Hardwood Forest. Diversity 2019, 11, 160. https://0-doi-org.brum.beds.ac.uk/10.3390/d11090160
AMA Style
Pease BS, Holzmueller EJ, Nielsen CK. Influence of Forest Structure and Composition on Summer Habitat Use of Wildlife in an Upland Hardwood Forest. Diversity. 2019; 11(9):160. https://0-doi-org.brum.beds.ac.uk/10.3390/d11090160
Chicago/Turabian StylePease, Brent S., Eric J. Holzmueller, and Clayton K. Nielsen. 2019. "Influence of Forest Structure and Composition on Summer Habitat Use of Wildlife in an Upland Hardwood Forest" Diversity 11, no. 9: 160. https://0-doi-org.brum.beds.ac.uk/10.3390/d11090160
Note that from the first issue of 2016, this journal uses article numbers instead of page numbers. See further details here.