Article

The Influential Role of the Habitat on the Diversity Patterns of Free-Living Aquatic Nematode Assemblages in the Cuban Archipelago

by
Maickel Armenteros
1,2,*,
José Andrés Pérez-García
2,
Diana Marzo-Pérez
2 and
Patricia Rodríguez-García
2
1
Instituto de Ciencias del Mar y Limnología, Universidad Nacional Autónoma de México, Circuito Exterior S/N, Coyoacán 04510, Ciudad de Mexico, Mexico
2
Centro de Investigaciones Marinas, Universidad de La Habana, Calle 16 # 114, Playa 11300, Habana, Cuba
*
Author to whom correspondence should be addressed.
Submission received: 25 July 2019 / Revised: 5 September 2019 / Accepted: 11 September 2019 / Published: 16 September 2019
(This article belongs to the Special Issue Meiofauna Biodiversity and Ecology)

Abstract

:
Free living nematodes are the most abundant and diverse metazoans in aquatic sediments. We used a framework of habitat types to reveal quantitative patterns in species richness (SR), β-diversity, and biological traits (BT). Meiofauna was quantitatively collected from 60 sites within nine habitat types and 24,736 nematodes were identified to species level. We reported a regional richness of 410 ± 12 species for the Cuban archipelago; however, caves and deep waters need to be sampled more intensively. Relationships between SR and abundance supported the dynamic equilibrium model with habitats ordered across gradients of resource availability and physical disturbance. Seagrass meadows were the most specious and freshwater/anchihaline caves the least diverse habitats. Differences in β-diversity likely were due to habitat heterogeneity and limitations for dispersal. The assemblage composition was unique in some habitats likely reflecting the effects of habitat filtering. However, coastal habitats shared many species reflecting high connectivity and dispersal capability of nematodes due to hydrodynamics. The BTs “life strategy”, “trophic group”, and “tail shape” reflected ecological adaptations; but “amphidial fovea” and “cuticle”, likely reflected phylogenetic signatures from families/genera living in different habitats. Habitat type played an influential role in the diversity patterns of aquatic nematodes from taxonomic and functional points of view.

1. Introduction

The study of the habitat, the place where organisms live [1], is a tenet of community ecology. The pioneer studies [2,3] highlighted the importance of habitat type as template for ecological strategies. More recently, the habitat type has been reintroduced as a main organizing principle to study communities [4]. In theory, the habitat type may act as a selective force driving the community assemblage, but mediated by other processes such as dispersal, speciation, and drift [5]. A critical step in the endeavor of linking habitat type with community ecology is the definition of the habitat itself. For instance, aquatic habitats are often defined a priori on the basis of overarching abiotic structures/variables such as confined spaces (e.g., caves) or extreme abiotic conditions (e.g., trenches). But, the delineation of habitat types based uniquely on abiotic factors has been termed as environmental filter and it has often failed to explain the community assembly and dynamics since biological interactions may also play a key role [6]. Habitat types are sometimes defined from an operational point of view (e.g., reef versus seagrass bed) that does not always match with the spatial and temporal scales at which organisms perceive the environment (e.g., a reef contains several microhabitats) [7]. Further, the very continuity of the environment in aquatic ecosystems make the test of the habitat type as a main driver of community assemblage challenging. Despite previous shortcomings, the diversity and distribution patterns of marine communities can be successfully approached from a habitat perspective giving generality and predictive power. The habitat type has been used as a successful predictor in studies of marine benthos, e.g., [8,9,10], and may be linked to one of the most important components of the diversity: β-diversity (i.e., variation in the identities of species among sites [11]).
Free living nematodes are the most abundant and diverse metazoan assemblages in aquatic sediments and the most studied taxon within the meiobenthos [12,13]. However, several knowledge gaps remain in the ecology of nematode assemblages. Three of the most important gaps are: (a) the incomplete knowledge about the species richness of the group, for instance, the known fraction of marine nematode species is about 12% of the estimated total of species [14]; (b) the ecological processes driving the β-diversity patterns of nematode assemblages are known mostly from temperate ecosystems (e.g., [15], and references therein), and even from deep-sea ecosystems, e.g., [16,17,18], but patterns across tropical habitats and their ecological drivers are substantially understudied; and (c) the link between nematode biological traits and ecosystem functioning based on evolutionary adaptations. In particular, the problem is to identify the traits and environmental factors that are most responsible for the most striking and important patterns in the field [19].
Gradients in physical disturbance and resource availability constitute environmental axes of importance to define habitats relevant for nematode assemblages [15]. Latter authors proposed a conceptual model between nematode abundance and species richness/diversity in relation to habitat types. The general model was originally proposed by Huston [20] and termed as the Dynamic Equilibrium Model (DEM). In some extension, DEM built on previous theories relating diversity to frequency of disturbance (Intermediate Disturbance Hypothesis, [21]) and energy availability (Species–Energy Theory, [22]). However, DEM as analyzed in [16] did not include tropical habitats (e.g., coral degradation zones, seagrass meadows). Actually, most of the recent surveys on diversity patterns of nematode assemblage structure have included polar, temperate or deep-sea habitats. Comparatively less research has been done in tropical ecosystems resulting in a gap of knowledge about diversity patterns (but see studies [23,24] in Kenya, and [25,26] in the Maldives). Recently, some other understudied tropical habitats have recently been surveyed at the species level, such as volcanic sands [27], mangrove sediments [28], and rivers [29].
Diversity may be studied using descriptive, functional and/or phylogenetic approaches. From a descriptive point of view, diversity may be effectively measured by the species richness (SR) and complementarity [30]. For hyperdiverse assemblages (e.g., nematodes), the use of non-parametric estimators (e.g., Chao 1) besides observed SR may bring higher accuracy in the assessment of the richness [31]. The measurement and interpretation of complementarity between assemblages (or samples) has been the subject of much debate. The partition of the β-diversity in α- and γ-components, using additive or multiplicative relationships, is a feasible approach to disentangling the effects of scale or other nested units of analysis. However, the alternative use of the concept of β-diversity, measured as Bray–Curtis dissimilarity index, constitutes a simple and effective approach to assess how similar two sets of species are [11]. In addition to the approach to diversity, which constitutes the basis for further hypotheses about processes, a functional approach may be applied using the biological traits of organisms.
A biological trait is any morphological, physiological or phenological feature measurable at the individual level [32]. The biological trait analysis (BTA) gives generality and predictability in ecological studies [19] because the spatio-temporal distribution of organisms and their functional role in ecosystems depend on their traits rather than on their taxonomical affiliation [33,34]. The BTA was brought into the marine realm by Bremner et al. [35,36] focusing on epibenthic invertebrates. Later, BTA was successfully applied to the ecology of nematode assemblages [37,38,39]. However, studies on tropical assemblages are scarce (but see [40,41]). Currently, there is a need for empirical studies exploring the BTA across a variety of taxa in order to increase the predictability of assemblage patterns and/or reveal their roles in ecosystem functioning [33].
Studies on free-living nematodes in the Cuban archipelago are rather scarce. Andrassy’s pioneering work [42] described several new species of nematodes from a variety of habitats from freshwater caves to intertidal sandy beaches. It constituted the first taxonomic list of free-living nematodes from Cuba. However, the poor description of sampling methods and habitat types prevented the quantitative analysis of his data. López-Canovas and Pastor de Ward [43] published a taxonomic list of nematodes living in seagrass meadows of the northcentral part of the island, but no information about location of the sampling points or quantitative data. Thus, only the most recent studies in several habitats from the Cuban archipelago during the last 10 years are available for quantitative studies.
In this contribution, we addressed the above-mentioned knowledge gaps using a framework of tropical aquatic habitats to reveal patterns in species richness, β-diversity, and biological traits. We propose two objectives: (1) to describe the patterns of species richness and β-diversity of nematode assemblages across nine aquatic habitats; and (2) to explore the distribution of five biological traits in relationship with the habitat type.

2. Materials and Methods

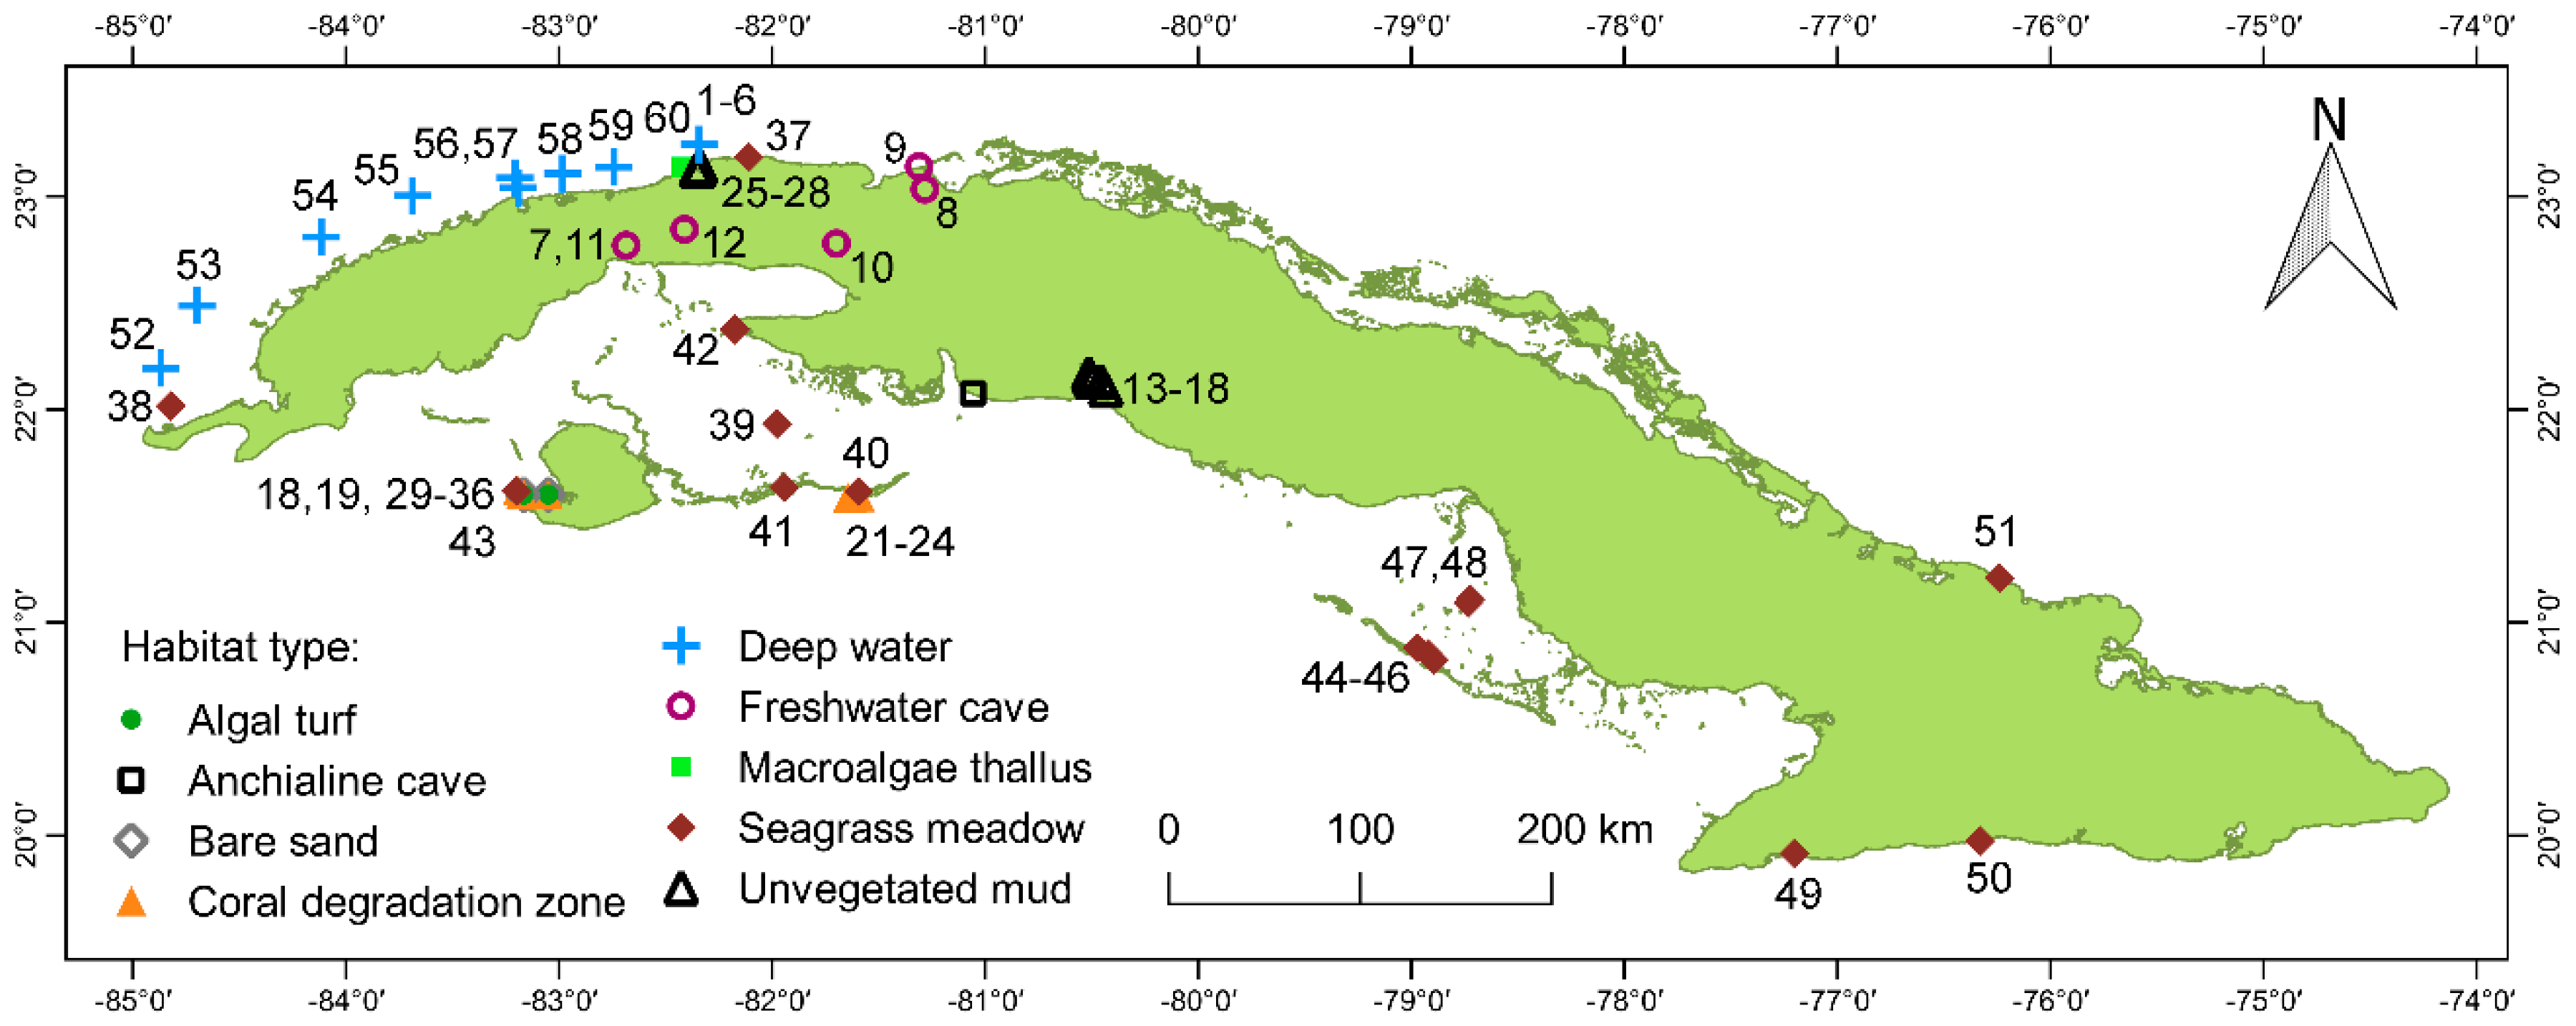
2.1. Study Sites and Habitats

Nematodes were collected from 60 sites around the Cuban archipelago (Figure 1, Supplementary Table S1). The sites were classified according to nine habitat types and they were always submerged (i.e., not influenced by tides). The selection of habitat types was based on the perceived importance in terms of diversity for Caribbean aquatic ecosystems, although some important habitats (e.g., mangroves, beaches) could not be covered. The descriptions of the habitats were based on the original publications and/or personal observations and we have highlighted those abiotic variables that may directly affect nematode assemblages (e.g., grain size, physical disturbance, and organic content). These variables in general match with environmental axes (e.g., productivity, disturbance) defined by other authors, e.g., [7,15].
Freshwater cave (FC, five sites) referred to ponds within caves, permanently in darkness, with very fine sediment (mostly silt/clay), hypoxic environment (dissolved oxygen 1.0–3.5 mg O2 L−1), negligible physical disturbance, and an oligotrophic environment due to absence of primary production and limited input of allochthonous organic matter through terrestrial runoff.
Anchihaline cave (AC, one site) was a limestone cave connected with the ocean through subterranean passages. The cave was opened to the sky through a portion of the collapsed roof (i.e., cenote). Bottom water at ~60 m deep had full marine salinity and surface waters had freshwater from rainfall and runoff. The bottom is permanently in darkness, with very fine sediment (mostly silt/clay), negligible physical disturbance, an oligotrophic environment due to absence of primary production, but allochthonous sources of organic matter existed through terrestrial runoff and potentially subterranean currents from the adjacent sea.
Bare sand (BS, two sites) sites were located between the lagoon and the reef crest, there was a fringe of ∼10 m wide unvegetated coralline sand deposited on rocky substrate. The vertical thickness of the sand layer fluctuated between 4 and 12 cm. The water was well oxygenated, and depth varied between 2 and 3 m. The percentage of organic carbon in the sand was ~5% and productivity was assumed as high due to primary production by microphytobenthos (e.g., diatoms). Sites were subjected to high hydrodynamic disturbance by currents and wave action.
Unvegetated mud (UM, 10 sites) referred to subtidal bottoms devoid of vegetation, located in semi-enclosed bays (Cienfuegos and Havana), with depths of 5–12 m, and an estuarine regime due to river discharges, rainfall and terrestrial runoff. Bottoms mostly with fine sediment (silt/clay) and high accumulation of organic matter as detritus because of eutrophication are subjected to seasonal hypoxia/anoxia, and industrial and urban pollution.
Algal turf (AT, two sites) sites were located immediately shoreward of the reef crest (mostly consisting of elkhorn coral (Acropora palmata) and fire coral (Millepora complanata)), comprised of a hard bottom covered by seaweeds, and depths ranging from 0.5 to 3 m. There was an intense hydrodynamic regime because of wave turbulence created in the vicinity of the reef crest. Dense turfs of filamentous algae were abundant and mixed, with the most common genera being Galaxaura, Jania, Lobophora, Padina, Sargassum, and Stypopodium.
Macroalgae thallus (MT, six sites) samples actually came from a single site within a polygon of 100 m × 100 m, but the proximate substrates were different macroalgae species living on rocky bottoms at 9–21 m depth. Six species with different degrees of structural complexity were collected: Amphiroa sp. 1, Bryothamnion sp. 1, Bryothamnion sp. 2, Dictyopteris sp. 1, Halimeda sp. 1, and Lobophora sp. 1. There was some sediment deposited within the macroalgae thallus. The site was subjected to strong hydrodynamic regime by currents and wave action.
Seagrass meadow (SM, 17 sites) sites were subtidal bottoms with muddy/sandy sediments covered in variable degree by marine seagrasses, mostly by turtle seagrass Thalassia testudinum. Seagrass canopy provides protection from physical disturbance by hydrodynamic forces. The content of organic matter was high (5–10%) because of the intense primary production (seagrasses, epiphytic microalgae, and macroalgae) and the accumulation of detritus in sediments.
Coral degradation zone (CDZ, eight sites) is a biotope within coral reefs where the coral fragments and rubble accumulate and degrade to coralline sand at depths of 2–6 m. Dead coral fragments were covered by biofilm (observable at naked eye), likely reflecting a high level of food availability due to the productivity of the microphytobenthos; but there was minimum accumulation of organic matter due to the intense hydrodynamic regime by currents and wave action.
Deep water (DW, nine sites) sites refer to the bottom along the shelf slope around 1500 m depth, where hydrodynamic regime is supposed intense because of the steep slope and presence of large areas of hard substrate devoid of sediments, with very fine grain size (silt/clay), and an oligotrophic environment due to lack of primary production and reduced input of organic particles from the water column.

2.2. Collection and Processing of Samples

This survey summarizes the results of several papers published or in preparation during a period of about 10 years. Therefore, the techniques for the collection and processing of the nematodes varied and specific details can be found in the published papers and in the Supplementary Table S1. Hereafter, we synthetized the most important features of the sampling. Collection in shallow soft-bottoms (i.e., FC, AC, BS, UM, and SM) was done using hand-held plastic cores (2.6 cm inner diameter); usually 3–10 sampling units were collected in an area smaller than 50 m × 50 m. In AT, 20 thalli ((six macroalgae species × four replicates) minus four missing replicates) were carefully collected into nylon bags; strictly speaking, the nematode assemblages were epiphytes. We kept the different macroalgae species separate as sites although they were sampled in the same location. The CDZ were sampled by hand collection of dead coral rubble within a quadrat of 10 cm × 10 cm. The dead coral fragments were carefully placed within plastic jars underwater. In deep waters, 27 sediment samples from the shelf slope (~1500 m depth) were collected from nine sites and three replicates/site using a multicorer (single deployment) with PVC cores of 11 cm diameter. The three cores collected from a single deployment were in rigor pseudoreplicates; but, the bias on the diversity estimates should be small, if any. This is because: (i) we combined the three cores to obtain a more robust estimate; and (ii) meiofauna (and nematodes) vary at spatial scales smaller than 1 m, therefore the three cores (separated by ~1 m) could effectively sample the variability in the distribution (and hence the diversity).
Samples were processed using mesh size of 45 µm as lowest limit of meiofauna. Meiofauna retained in sieves was washed and preserved in formalin (4%) or ethanol (70%). Nematodes were sorted out of the sediment by the flotation technique in high-density sucrose solution [44]. For CDZ and MT, the epilithic and epiphytic nematodes were detached from respective substrates by gentle washing with filtered tap water. Nematodes were mounted in permanent preparations using the general technique in [45]. The identification of nematodes to species level was made using the original descriptions of the species and faunal synopses [46,47,48]. However, many species could not be assigned with reasonable confidence to known species and thus they were named as sp. The nomenclature followed the online database World Record of Marine Species (https://www.marinespecies.org).

2.3. Biological Traits

We gathered information about five biological traits for all of the identified species. The data are presented in the Supplementary Table S2.
The life strategy, or c–p scale [49,50,51], an analog of K/r-strategists, was analyzed based on a scale from c–p = 1 (good colonizers) to c–p = 5 (good persisters). For some genera, c–p values were not available and information from other genera in the same family were used.
The trophic group was defined based on the Wieser’s scheme that takes into account the morphology of the buccal cavity [52]: selective deposit feeders (i.e., detritivores), non-selective deposit feeders, epigrowth feeders, and omnivores/predators. The deposit feeders lack buccal armature, and the differentiation between selective and non-selective is based on the size of the buccal cavity. The epigrowth feeders have sclerotized structures as teeth and denticles. Omnivores/predators bear mandibles or spear-shape structures in a large buccal cavity.
The amphidial fovea shape has been recently proposed in [25] as a meaningful biological trait with eight groups. We have used here only seven of them since blister-like was included as circular type: circular, spiral, slit-like, pocket, elongated/rounded loop, indistinct, and longitudinal slit.
The cuticle morphology has been proposed also in [26] as: smooth, punctated/annulated with or without lateral differentiation, punctated/annulated with longitudinal structures for the whole body length, wide body annules and longitudinal ridges, desmens, and covered by ectosymbiotic bacteria.
The tail shape was classified into four types [53]: rounded/blunt, clavate/conico-cylindrical, conical, and elongated/filiform.

2.4. Data Analysis

We pooled the data from sampling units coming from the same site (except for MT) to obtain robust estimates of diversity and to minimize the effects of the sampling bias (e.g., different sizes of the sampler). A matrix of nematode species × sites was compiled using the abundance (i.e., counts) as values. The software EstimateS 9.1.0 [54] was used for the analysis of the species richness (SR) using curves of accumulation of species versus individuals and for the calculation of confidence intervals based on permutations. The non-parametric estimator Chao 1 was calculated for the estimation of the SR taking into account the fraction of non-seen species [55]. The comparison of SR at the same level of abundance (i.e., rarefaction technique) was made with the number of expected species (ES(n)) in the software PRIMER 6.1.15 [56]. A correlation between SR and abundance was made using the Spearman rank correlation coefficient. The similarity patterns across the samples were explored with numerical ordinations by non-metric multidimensional scaling (NMDS) in the software PRIMER 6.1.15. Data were transformed as square root to downweigh the influence of the most abundant species. The Bray–Curtis similarity index was used as measure of resemblance. Statistical differences among habitat types in the assemblage composition were tested using a permutational analysis of variance (PERMANOVA) in the software PERMANOVA 1.0.5 [57]. Note that PERMANOVA tests for differences in the central position (i.e., centroid or multivariate mean); we used the same setting as that for NMDS and an unrestricted permutation of raw data. The β-diversity 1 was calculated as the mean distance of the sites to the centroid of the habitat groups (i.e., multivariate dispersion) using the routine PERMDISP in latter software. Thus, β-diversity 1 measured the variation among sites within the same habitat. The criterion for interpreting significant differences in β-diversity 1 was the lack of overlapping of the standard error associated to the mean. We also calculated the β-diversity 2 to measure the variation in the assemblage structure among habitats as the mean (± standard deviation) of Bray–Curtis dissimilarity values. We applied the SIMPER procedure in order to identify the species responsible of the compositional differences among habitats using the PRIMER 6.1.15. Formal pairwise comparisons among the nine habitats yield 36 lists of species (i.e., habitat 1 versus 2, 1 versus 3, etc.) contributing to the pairwise dissimilarity, which is an unmanageable number of lists. Therefore, we presented those species that contribute up to 50% of cumulative similarity within habitats. We considered that the selected species were typical of a particular habitat type since they occurred at most (or all) of their sites. The comparison in a table of the presence/absence of species indicates those species that most contribute to the β-diversity patterns across the nine habitats.

3. Results

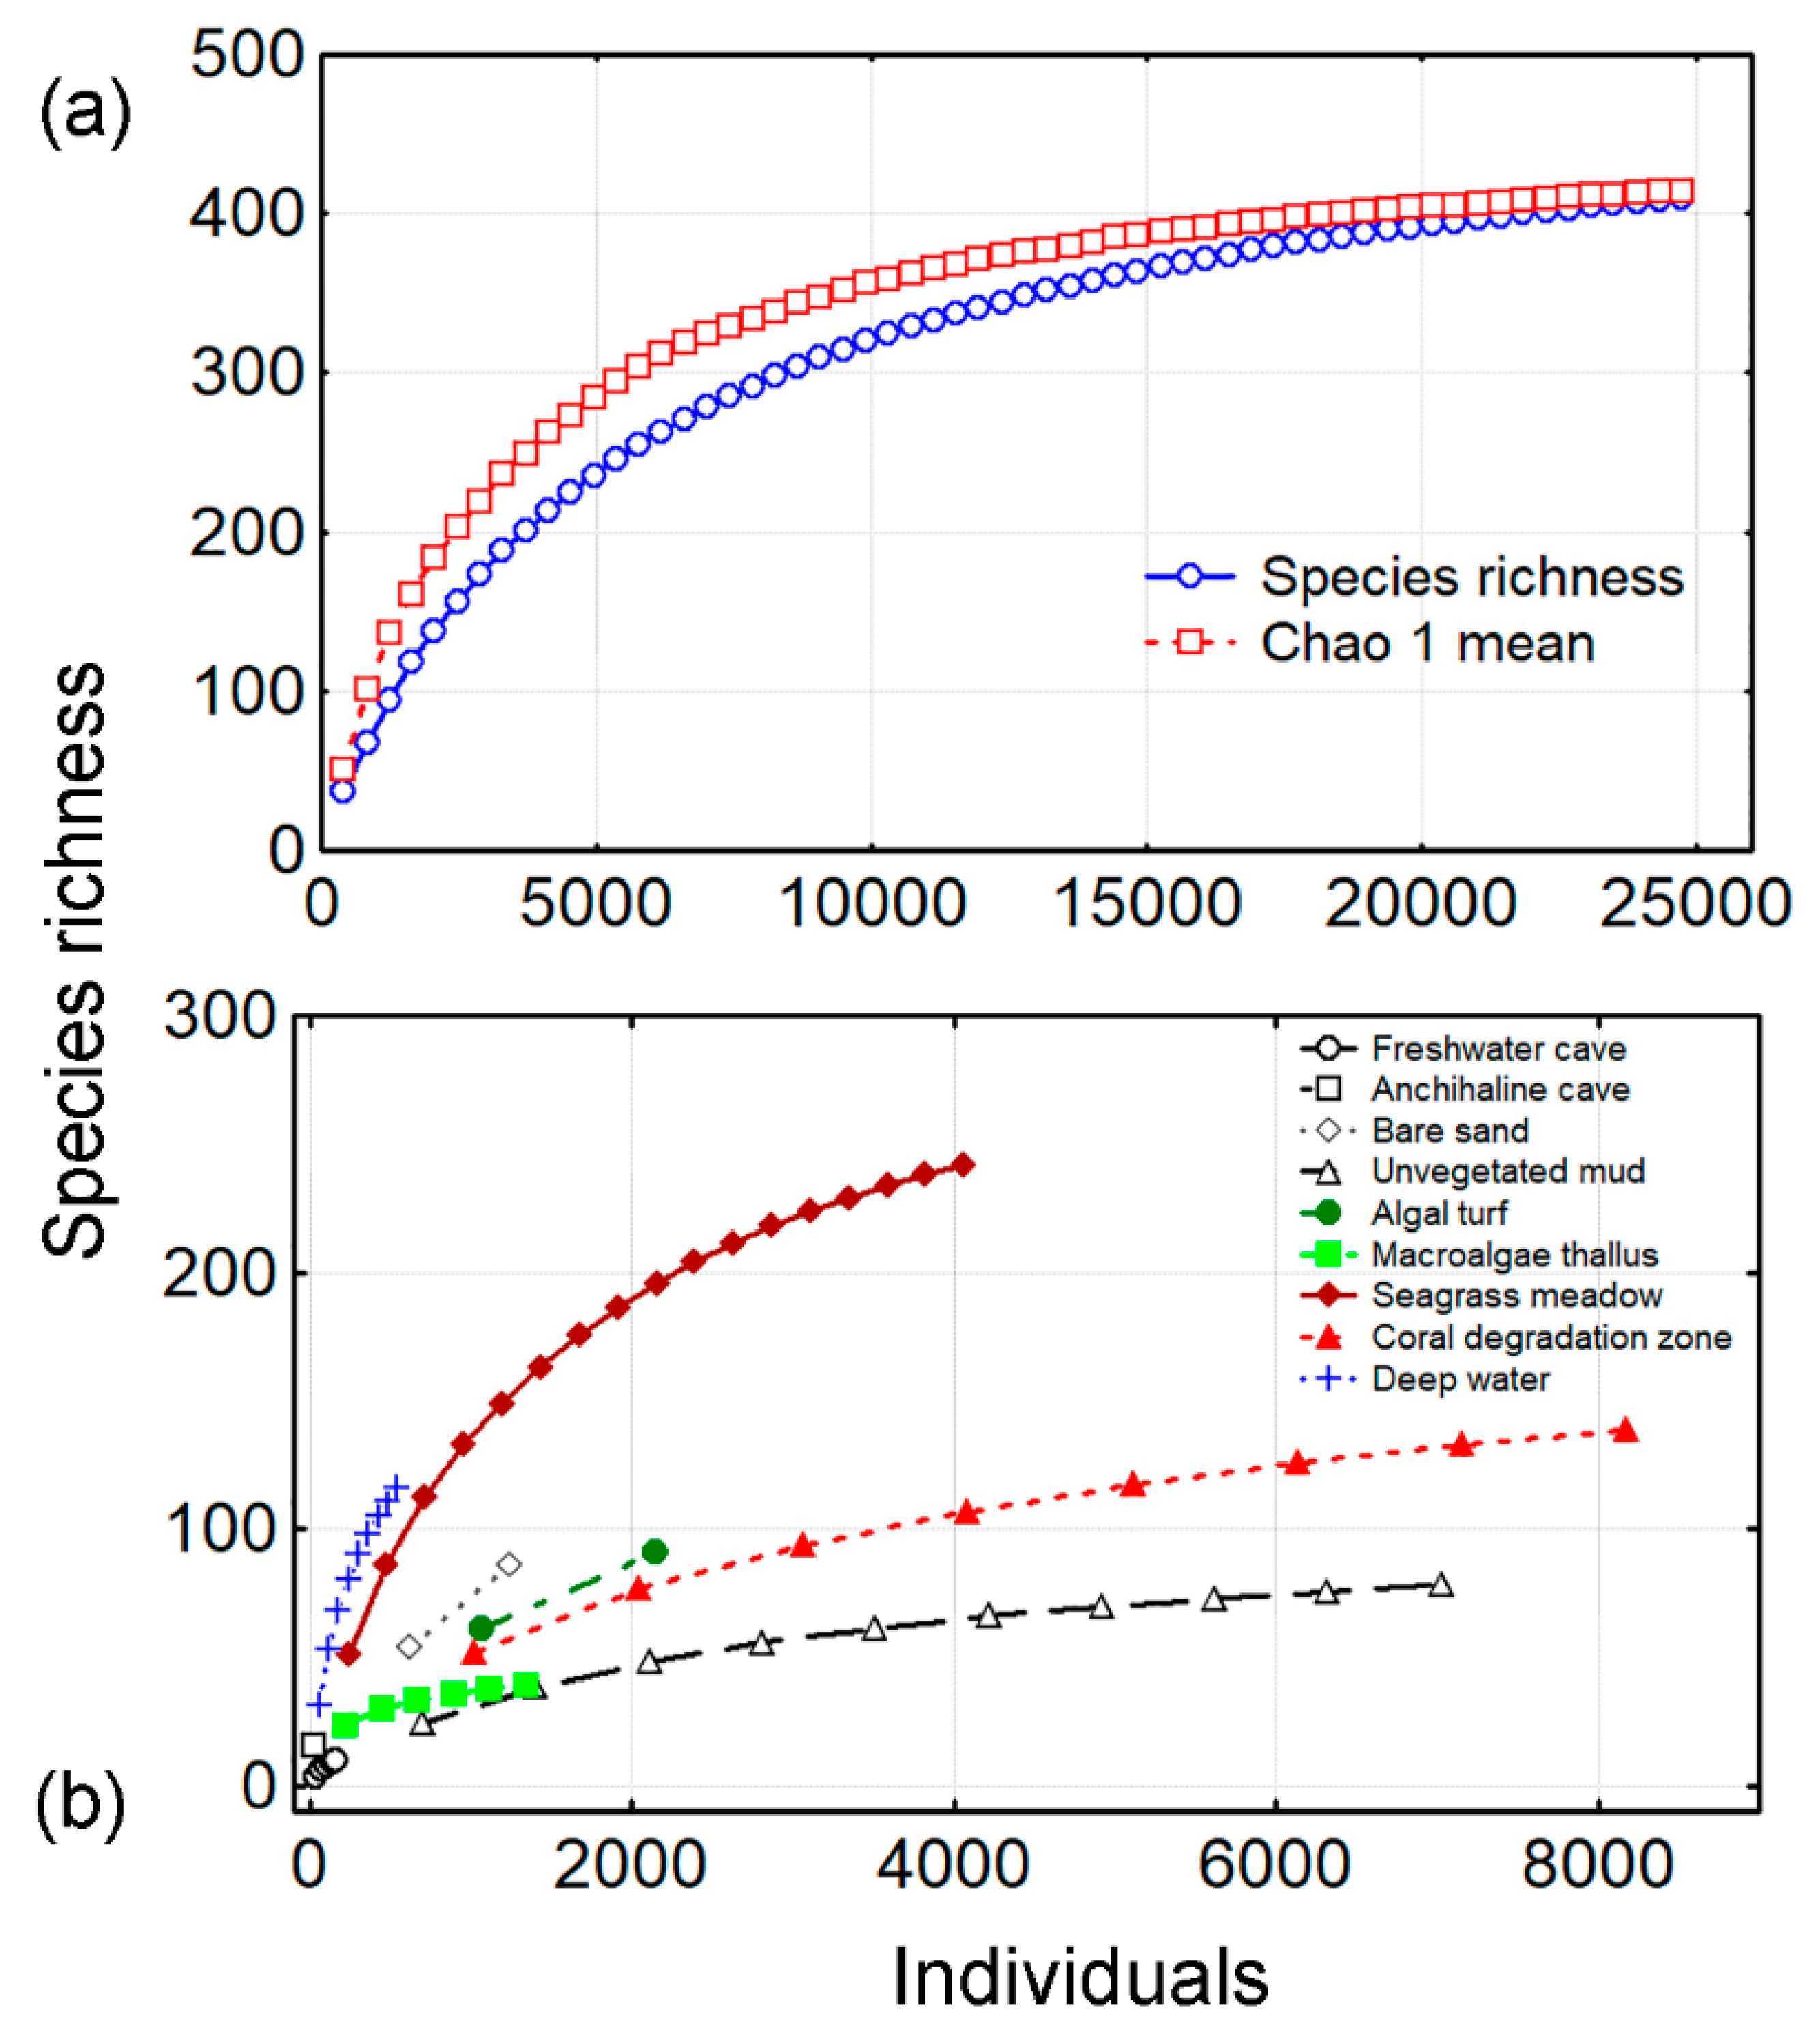
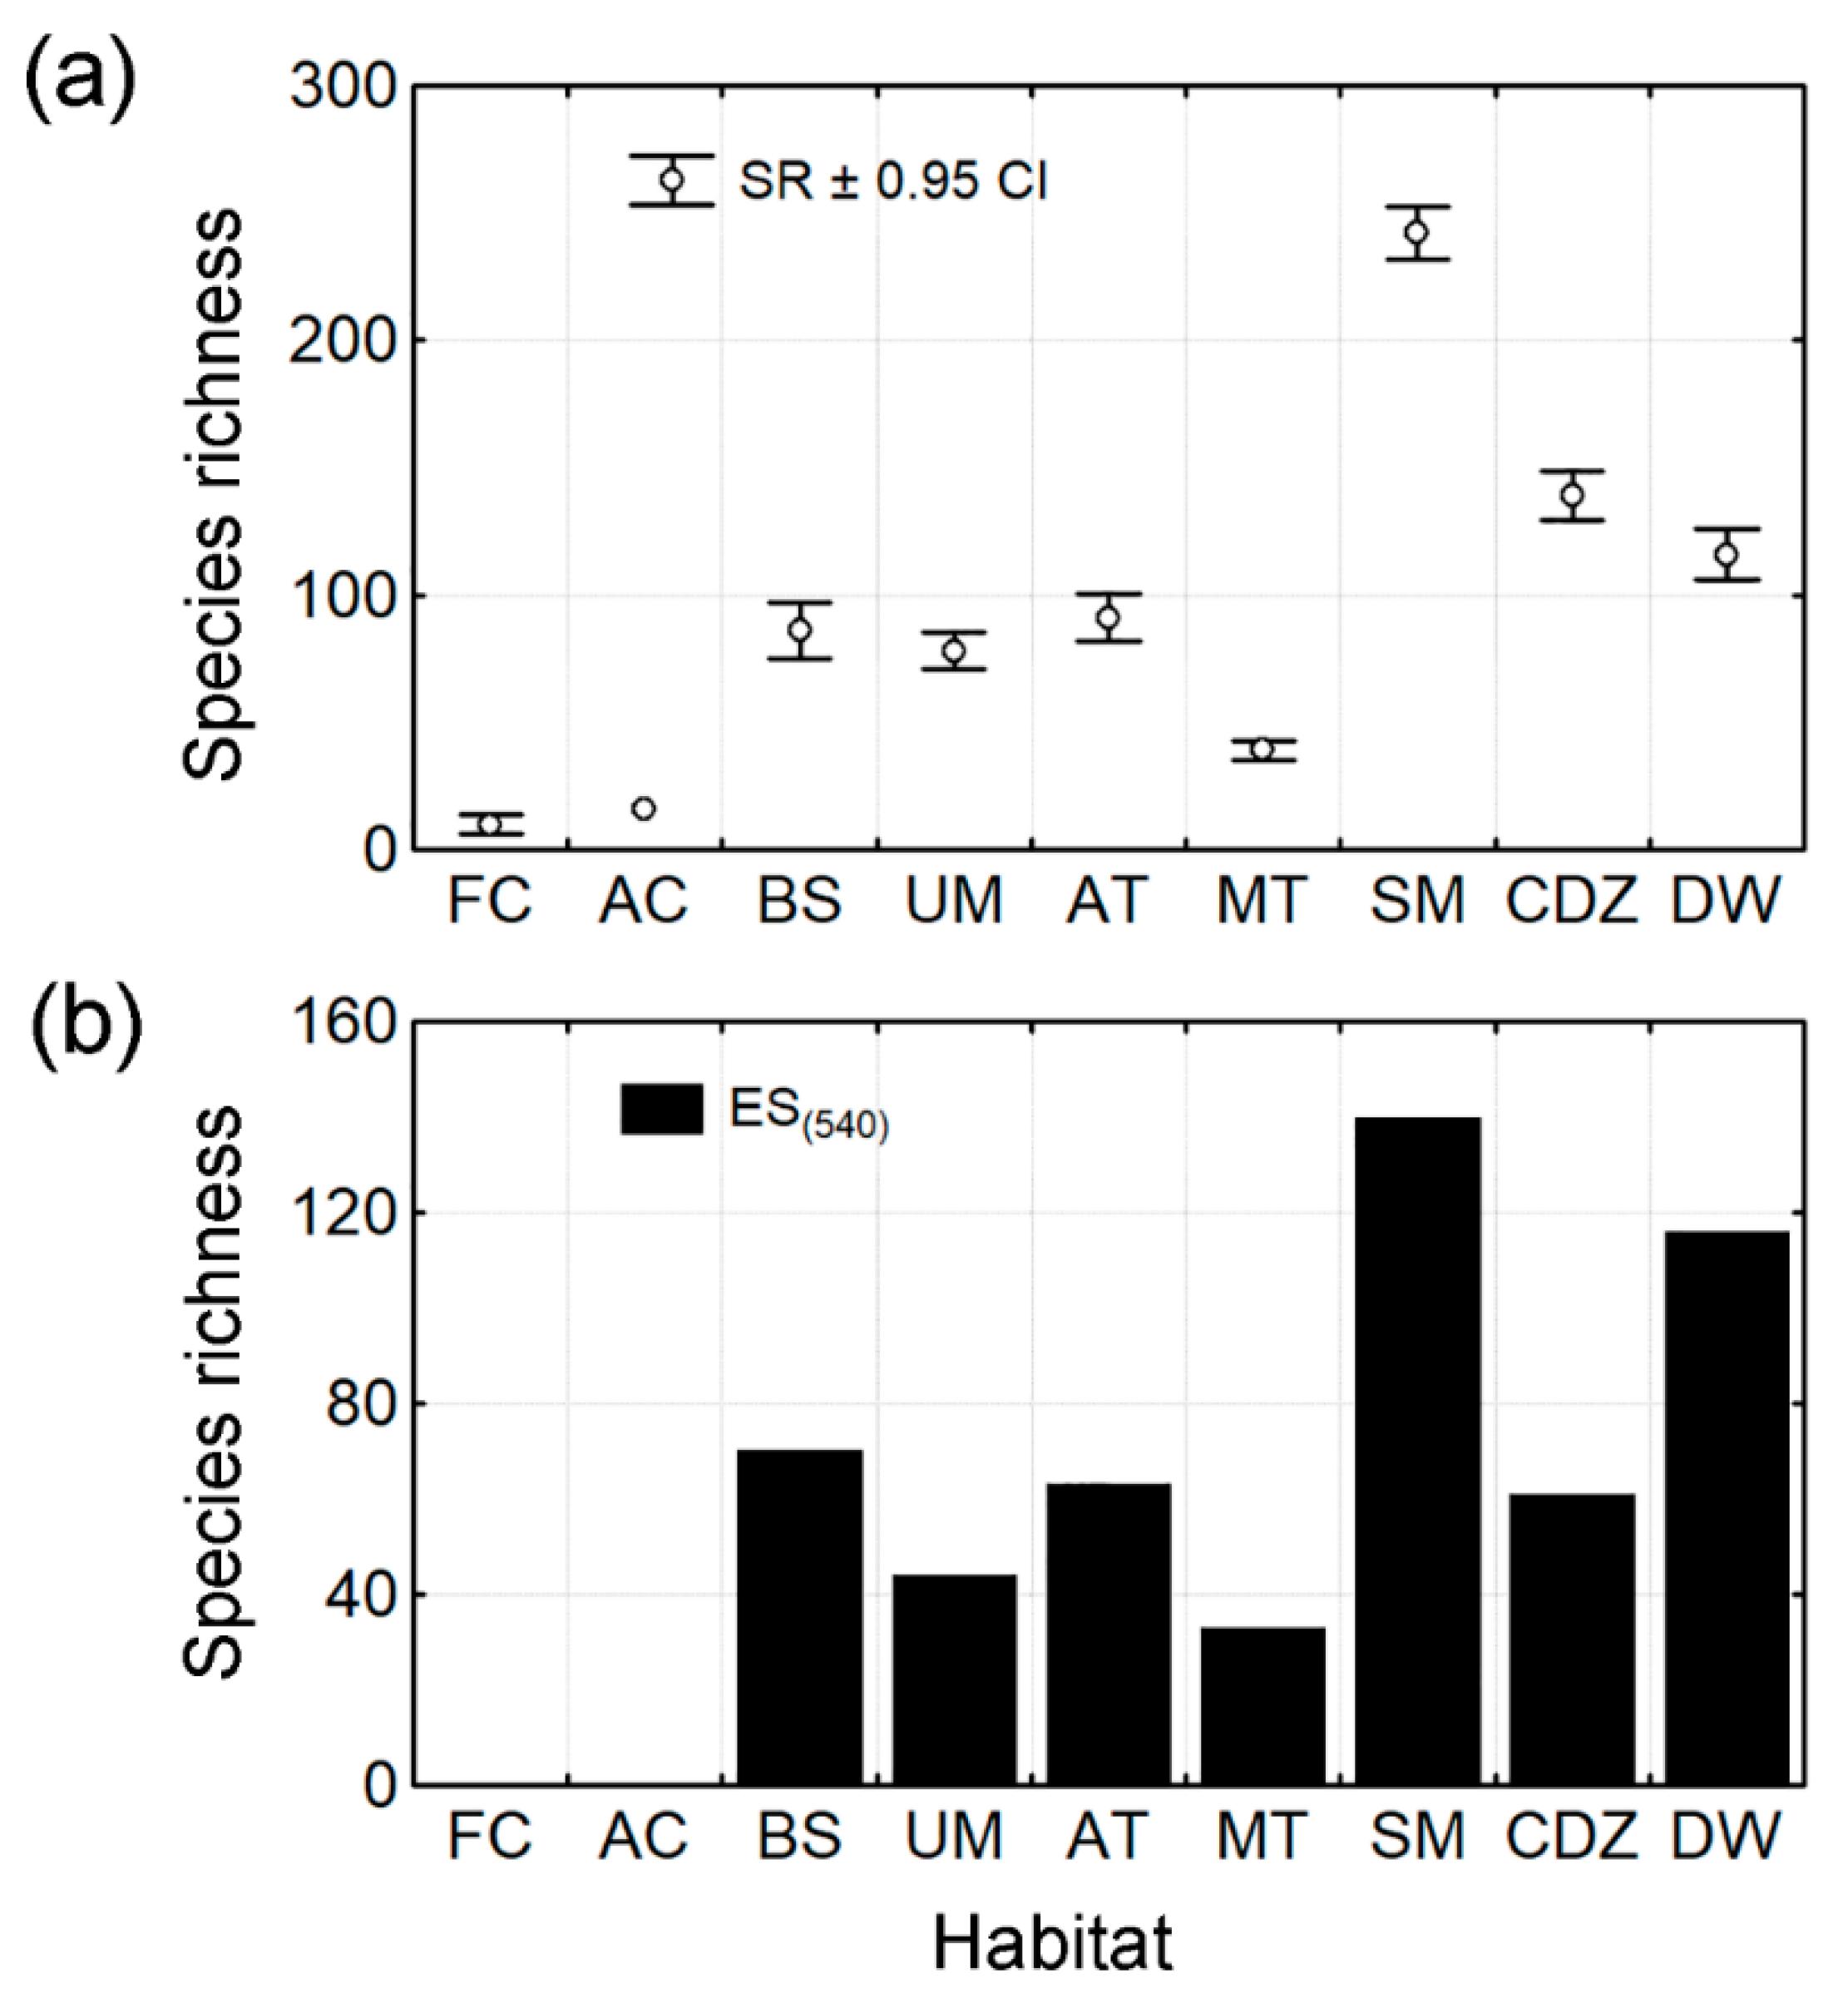
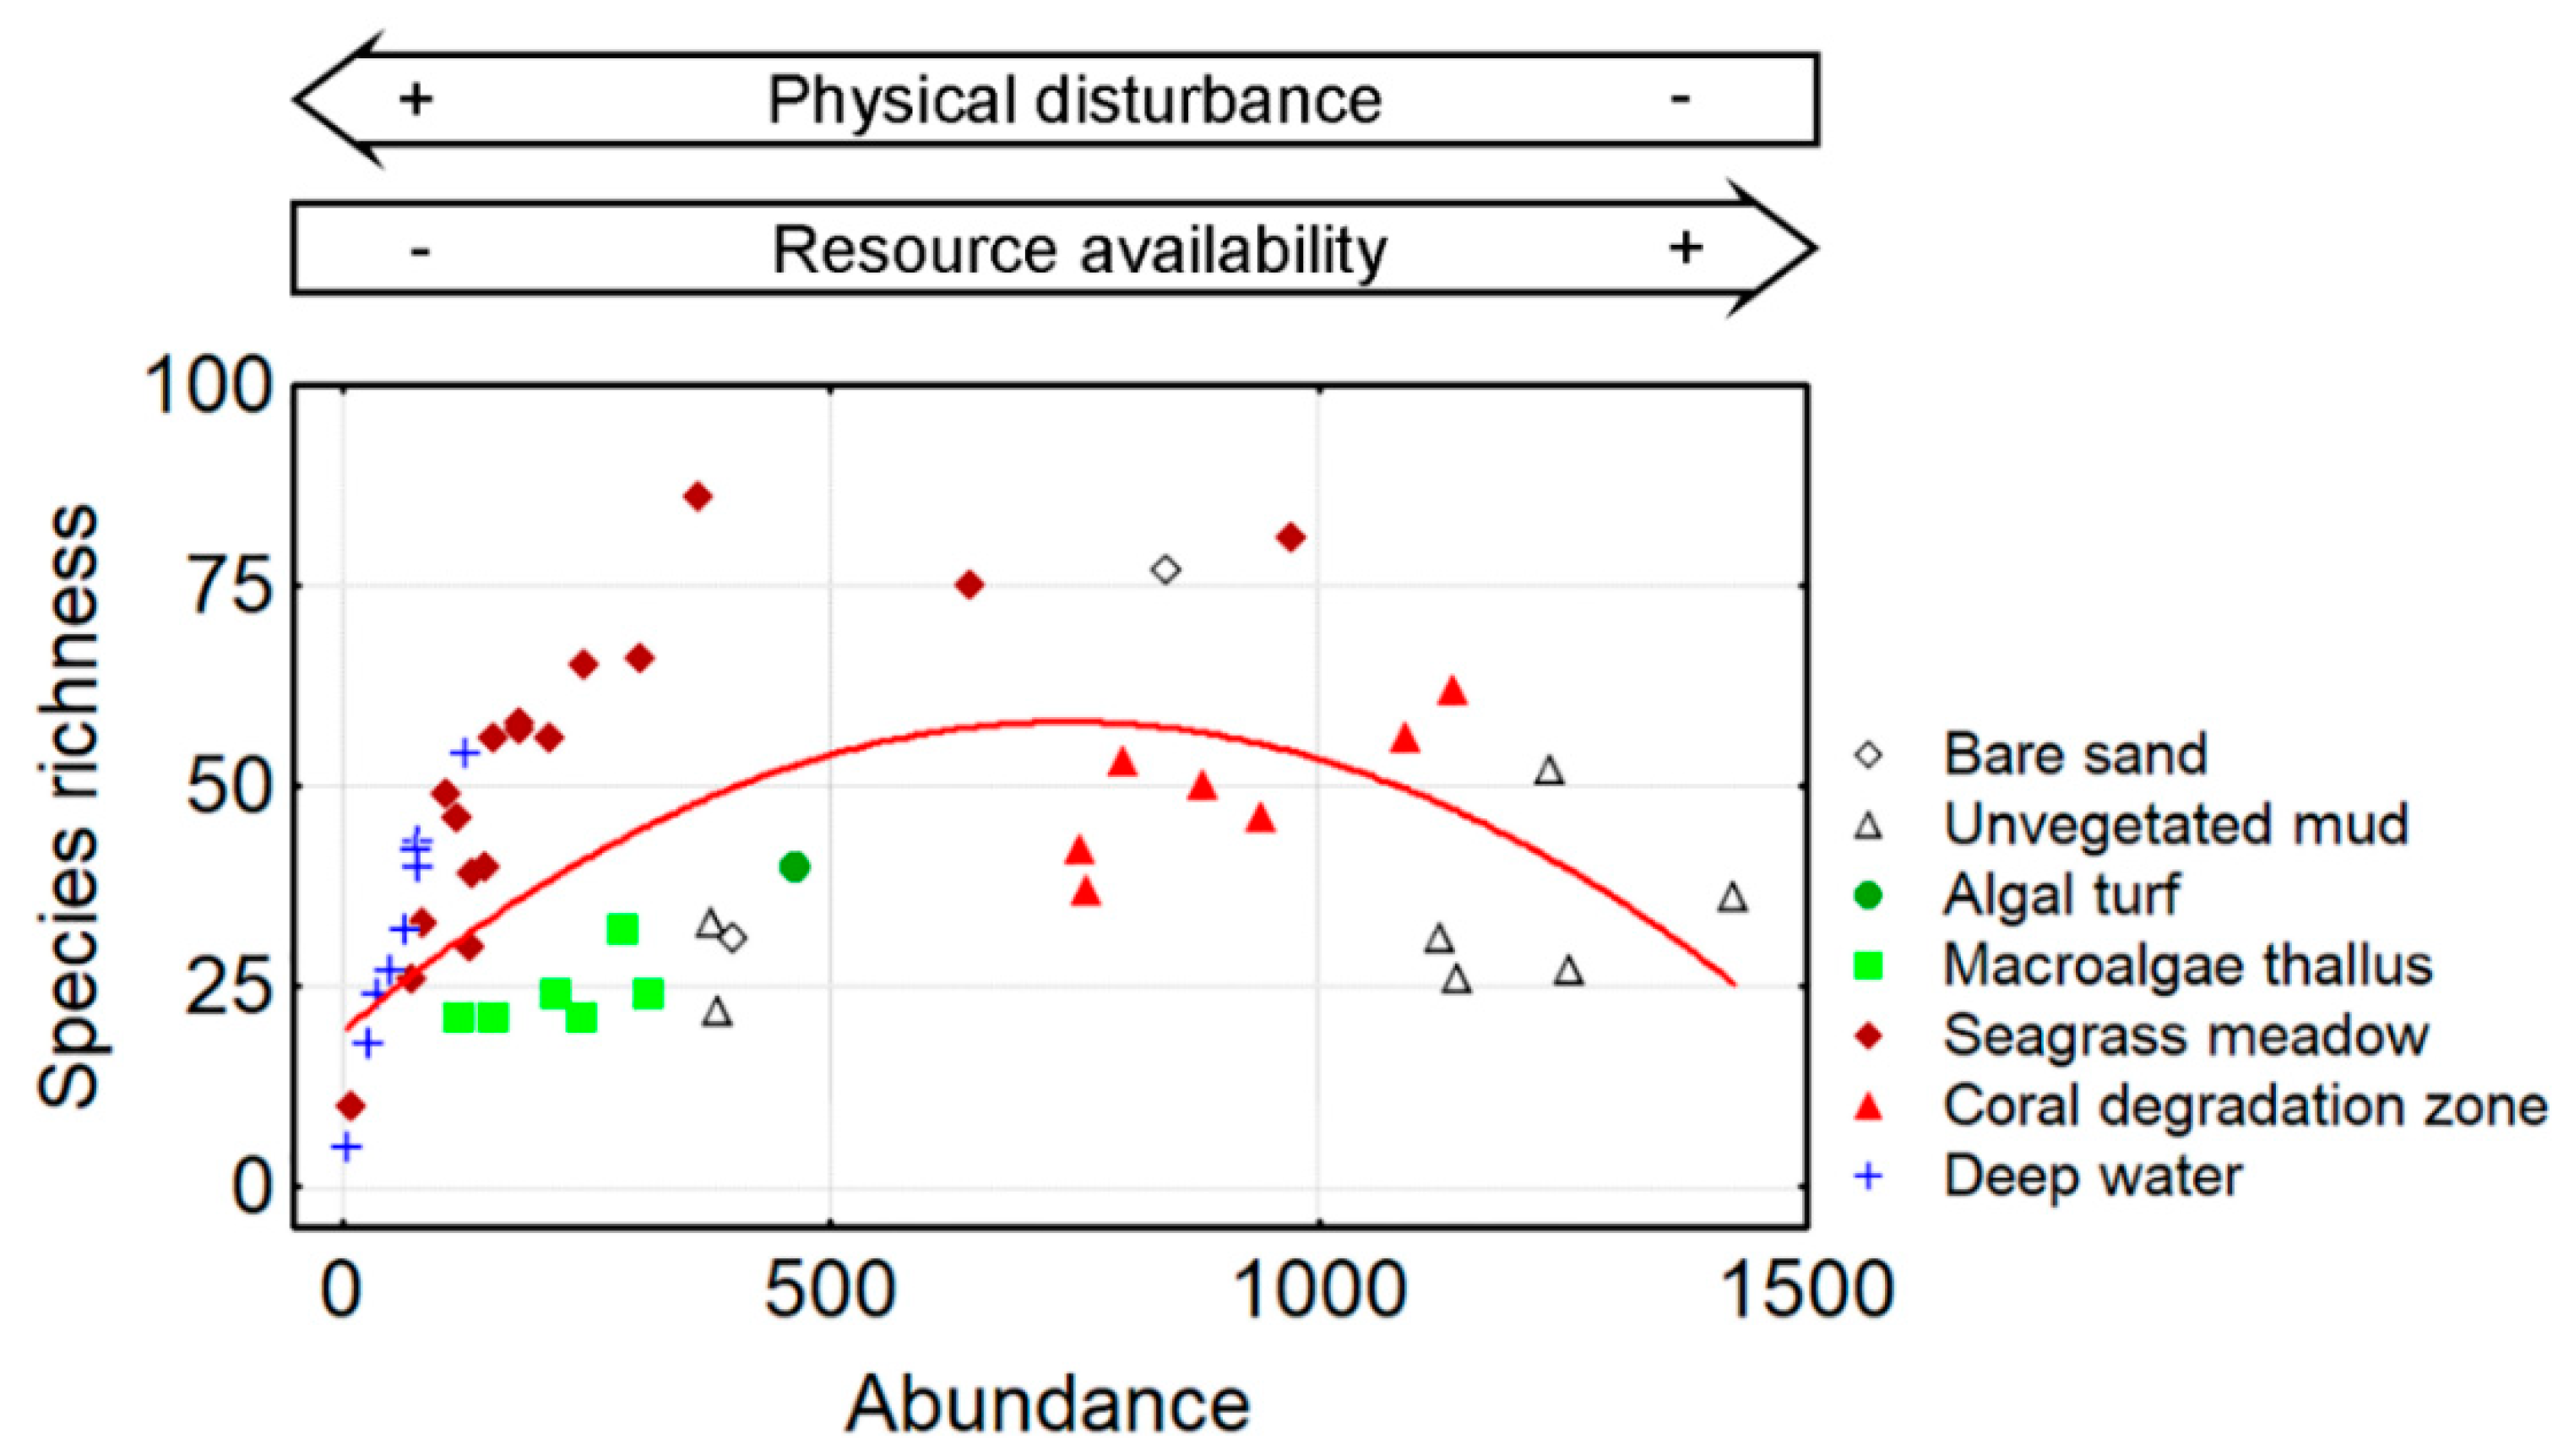
3.1. Species Richness
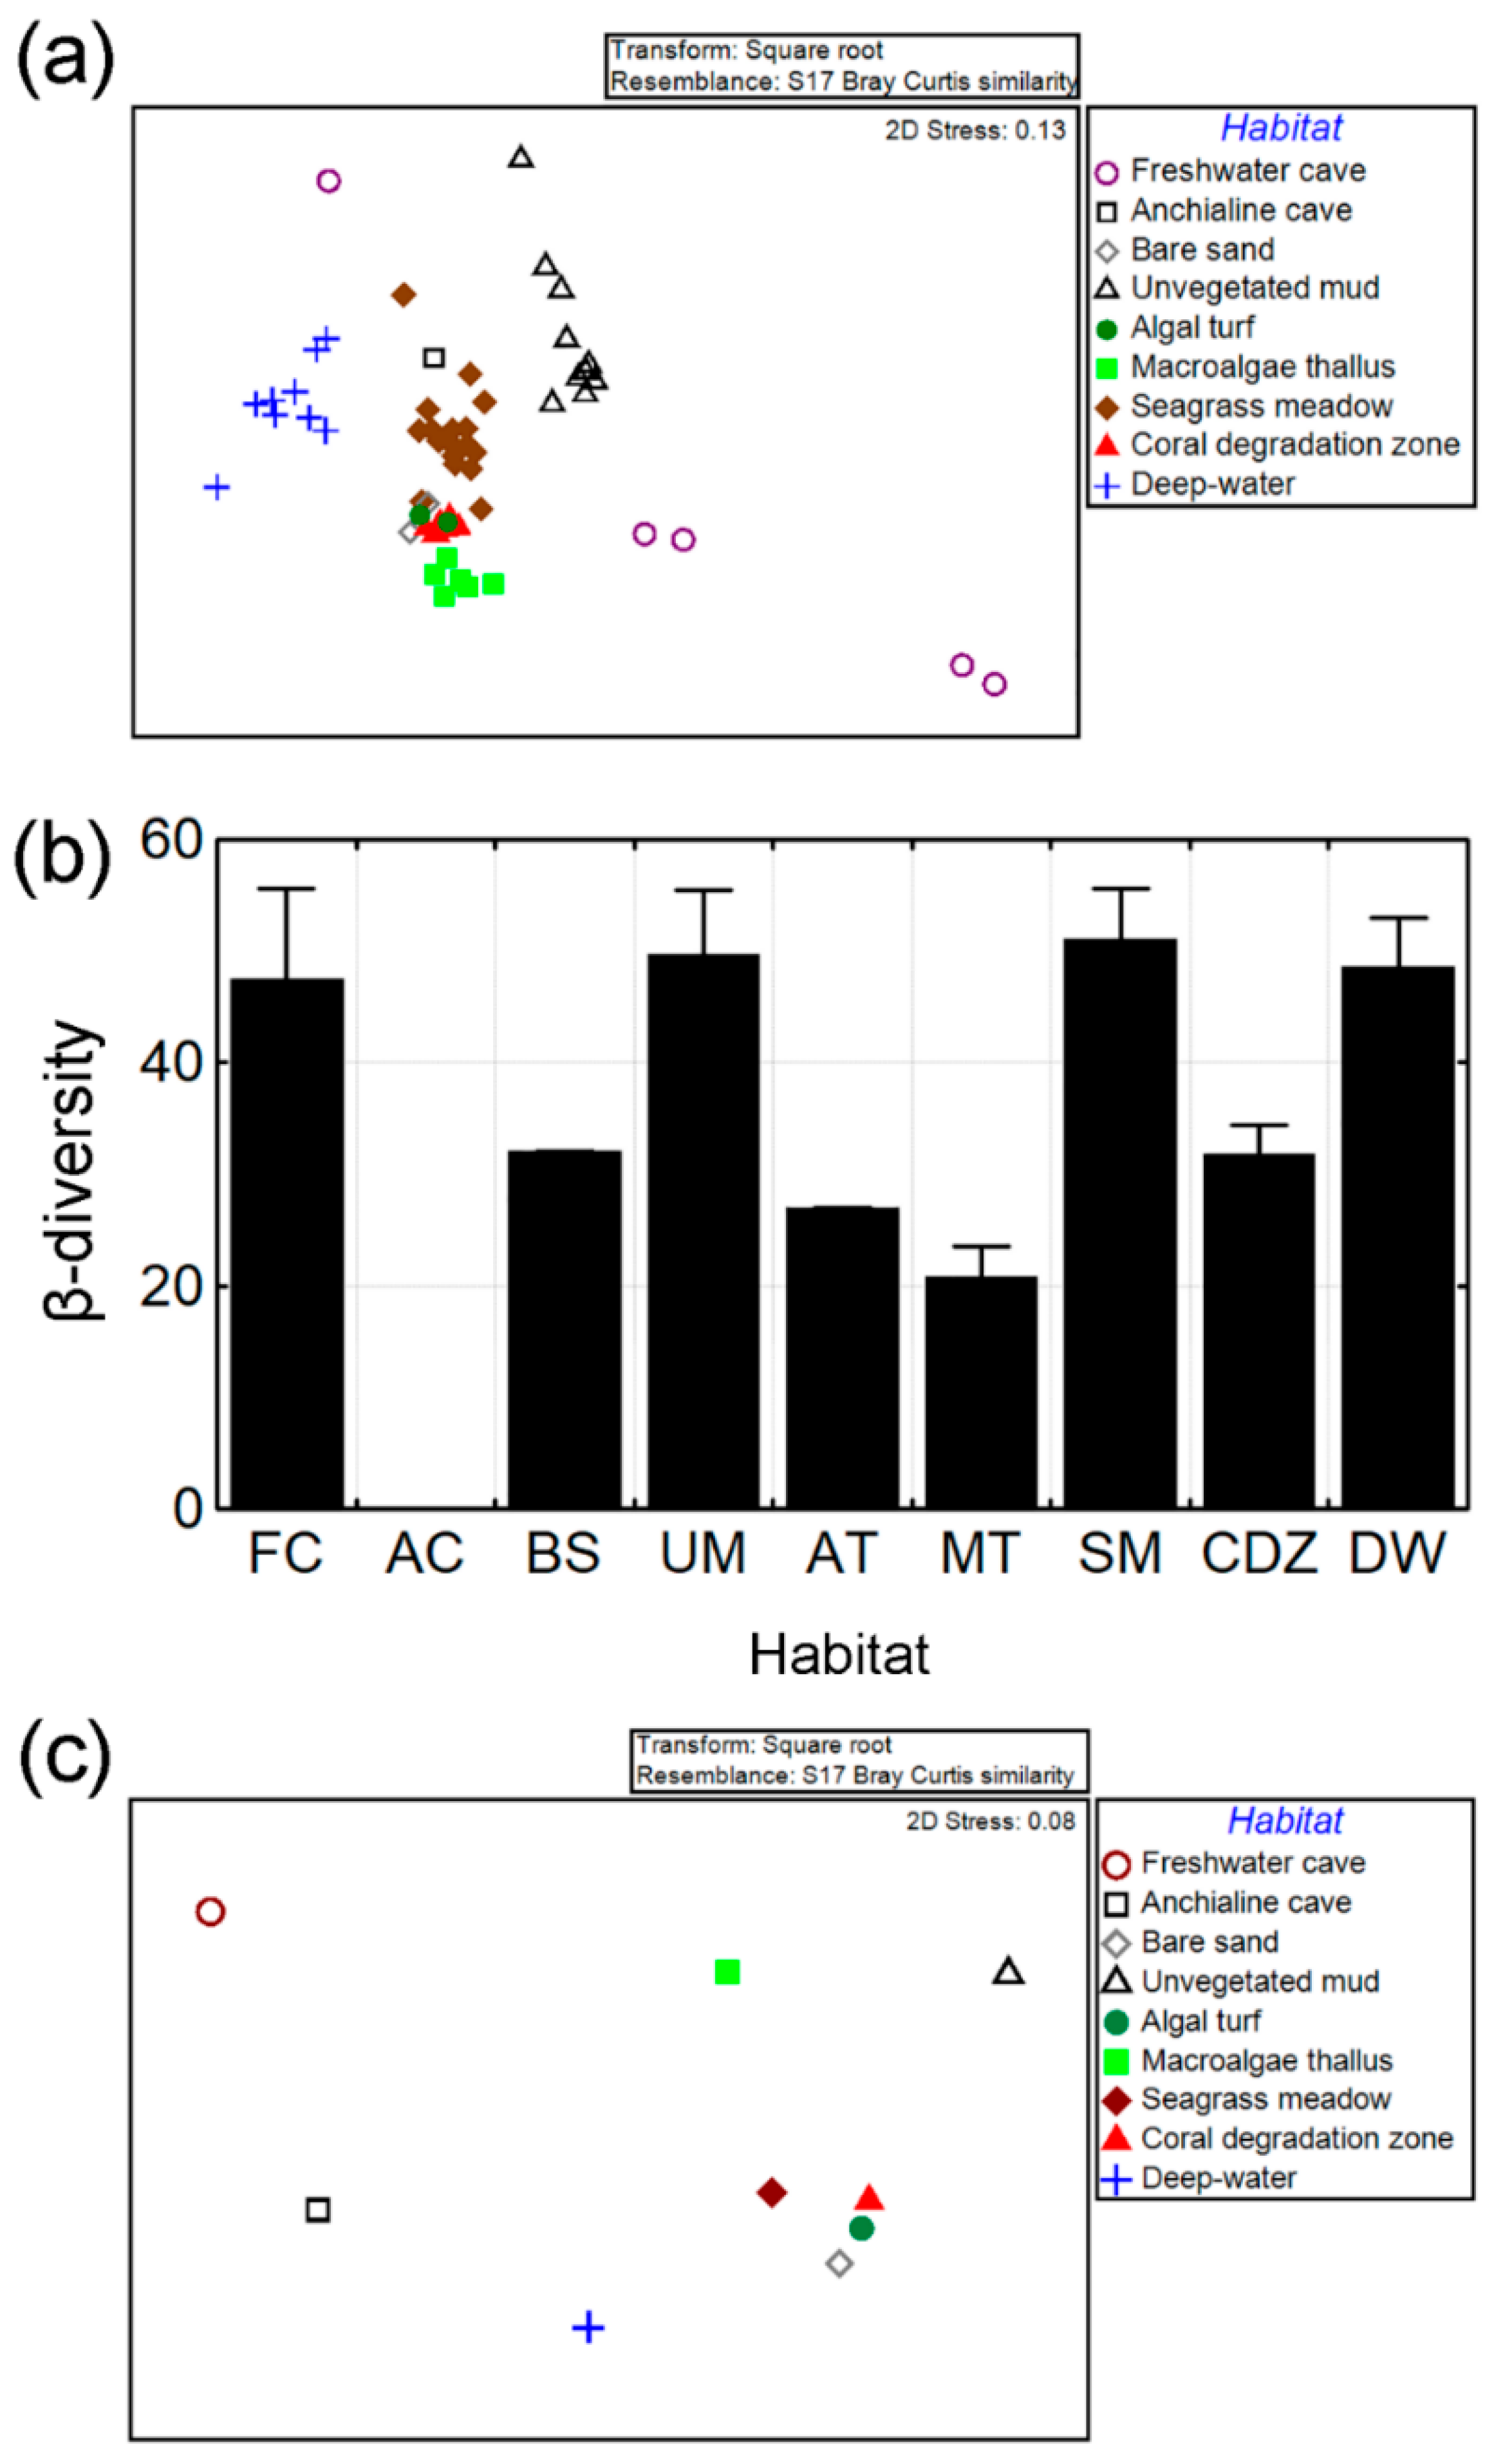
A total of 24,736 nematodes were identified yielding 410 species belonging to 216 genera, 46 families, eight orders, and two classes. The accumulation curve of observed SR versus individuals had a non-asymptotic shape indicating that the number of species would increase with further sampling effort (Figure 2a). The observed SR for the Cuban archipelago (i.e., regional SR) was 410 ± 12 species. The non-parametric estimator Chao 1 indicated roughly the same number of species (415 ± 7 species).
The accumulation curves of SR per habitat did not show any asymptote. Even habitats heavily sampled such as UM and CDZ (>7000 identified individuals) had a slight tendency to increase (Figure 2b). The SM were also well sampled (>3000 individuals) but the steep shape of the curve indicated a potentially higher SR. DW habitats contained a high SR, but were still underestimated because of the almost linear shape of the curves. The two cave habitats were undersampled suggesting that SR estimates should be interpreted with caution.
The observed SR was different among habitats as indicated by the lack of overlap of 0.95 confidence intervals (Figure 3a). SM had the highest SR, followed by CDZ and DW habitats. A group of three marine habitats had intermediate SR of about 100 species (BS, UM, and AT). MT had lower SR, and the lowest richness occurred in the caves (both freshwater and anchihaline). The SR and abundance were positively correlated across the sites (RS = 0.64, p < 0.001, n = 60).
Sample size strongly affects the estimates of SR; therefore, we computed the expected number of species (ES) for a same level of abundance. We removed freshwater and anchihaline caves from the ES calculation because they had too few individuals for an informative estimate (168 and 31 individuals, respectively). The ES was then computed based on the lowest abundance: 540 individuals in DW. ES(540) reaffirmed that SM had the largest SR, followed by DW (Figure 3b). Three habitats had similar values of ES(540): BS, AT, and CDZ. UM had a lower number of species and the lowest richness occurred in MT.

3.2. β-Diversity

The multivariate structure of the assemblages was clearly different among habitats as indicated by a numerical ordination (Figure 4a) and PERMANOVA test (Pseudo-F = 6, p = 0.01, d.f.(total) = 59, d.f.(effect) = 8). Most of the samples were clustered by habitat type, which explained 45% of the total variance in the multivariate data. Some habitats had a different assemblage structure composition as indicated by separate groups of samples (e.g., DW, UM, and SM). Other habitats had remarkable similarity among sites but had some overlapping between them (e.g., CDZ, AT, and BS). FC showed a large variability in assemblage composition as indicated by the dispersal of the samples in the plot. This variation between habitats but also within habitats (i.e., among sites coded as a same habitat type) suggests further exploration of quantitative values of β-diversity.
The β-diversity 1 varied across the nine habitats (Figure 4b). There were four habitats with higher β-diversity (FC, UM, SM, and DW). The other five habitats had lower β-diversity.
The ordination of the nine habitats (all sites pooled) based on assemblage structure indicated that five habitats had a very different assemblage composition (Figure 4c): FC, AC, MT, UM, and DW. Four coastal marine habitats were relatively similar to each other: BS, AT, SM, and CDZ. The β-diversity 2 was very high (mean ± SD): 97% ± 14%.
There were several species typical of a particular habitat type (Table 1). FC had a unique set of species belonging to typical freshwater genera (Aphanolaimus, Ironus). Species in AC were marine and occurred in other habitats as well (e.g., SM and CDZ). UM had a unique set of species belonging to two known hypoxia-tolerant genera (Sabatieria and Terschellingia). Other species were widely distributed across the shallow coastal habitats: Desmodora pontica, Euchromadora vulgaris, and Zalonema ditlevseni. SM had a diverse set of species, some of them characterized by large body size such as Cheironchus, Halichoanolaimus, Mesacanthion, and Viscosia. Members of Comesomatidae (Dorylaimopsis, Setosabatieria), a family typically composed by detritivores, were characteristic of this habitat. Several genera of Chromadoridae were found typically on MT (Chromadora, Chromadorella, and Euchromadora). The set of species inhabiting DW was unique and included several genera typical of the deep-sea such as Acantholaimus, Bolbolaimus, Cervonema, and Metadasynemella.

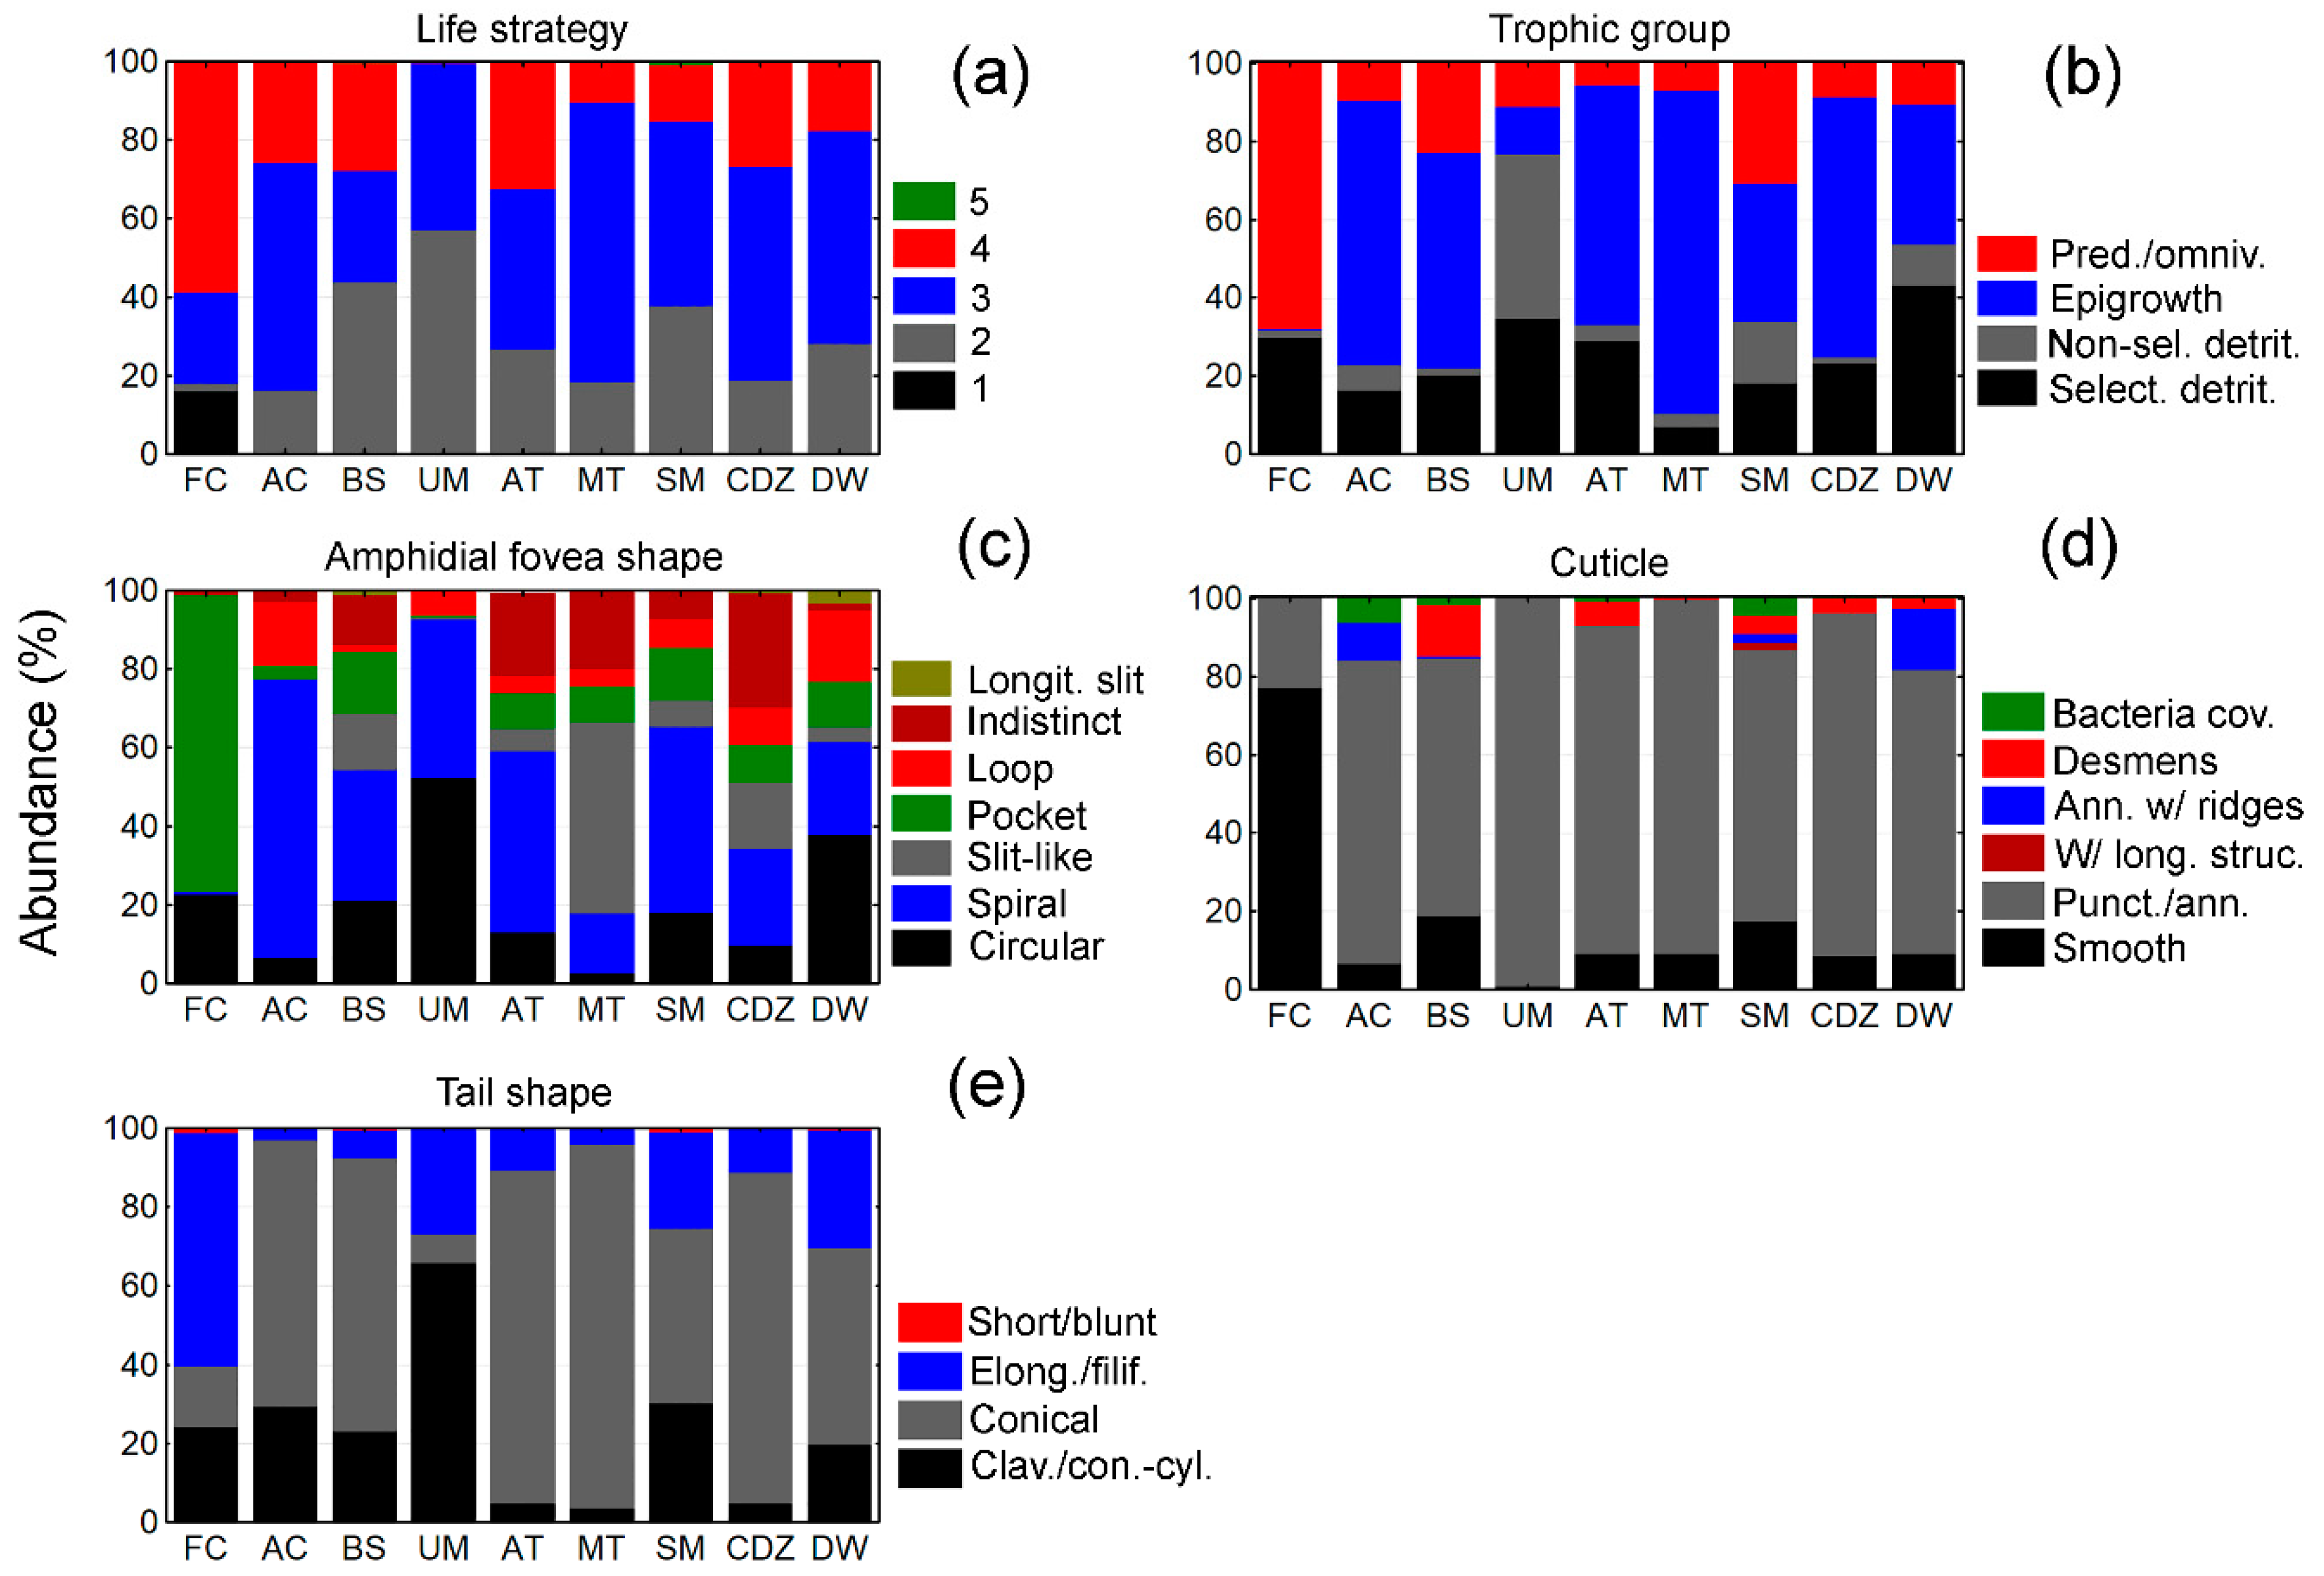
3.3. Biological Traits

The assemblage structure by life strategy (or colonizer/persister scale) varied between freshwater and marine habitats (Figure 5a). FC had higher contribution of extreme colonizer (c–p 1 = 16%) and persister species (c–p 4 = 59%) when compared with the marine habitats (c–p 1 = 0% and c–p 4 = 15%). Marine habitats also had differences among them, with UM having only intermediate colonizer species (c–p 2 = 57% and c–p 3 = 43%). The other seven marine habitats shared a similar life strategy structure with dominance of c–p 3 (52%) followed by c–p 2 (29%) and c–p 4 (18%).
The structure by trophic group was different among habitat types (Figure 5b). FC when compared with marine habitats had higher abundance of predators/omnivores (68% vs. 17%) and lower of epigrowth feeders (1% vs. 43%). UM had higher contribution of non-selective deposit feeders (42%) when compared with the other eight habitats (8%). Non-sedimentary habitats (i.e., AT, MT, and CDZ) had larger contribution of epigrowth feeders (72%) when compared with sedimentary habitats (28%).
The structure by amphidial fovea shape displayed differences among habitats (Figure 5c). FC had larger contribution of pocket fovea (76%) when compared with marine habitats (10%) and no species with spiral fovea.
The trait structure by cuticle type showed large differences in the contribution to assemblage structure (Figure 5d). Nematodes with smooth cuticle were dominant in freshwater (77%) when compared with marine habitats (10%). The marine habitats had a clear dominance of punctated/annulated cuticle (81%) when compared with freshwater (23%). UM had only nematodes with punctated/annulated cuticle type.
Tail shape assemblage structure varied among habitats (Figure 5e). FC had a larger contribution of elongated/filiforme tail shape (59%) when compared with marine habitats (20%). Nematodes with clavated/conical-cylindrical tail shape were more abundant in UM (66%) than in the other eight habitats (19%).

4. Discussion

The accumulation curves, for both observed SR and Chao 1, were close to an asymptote indicating that the regional richness (approximately 410 species) was reasonably well estimated. These figures should be interpreted as the minimum richness [31] and set a first SR estimate of aquatic nematodes for the Cuban archipelago. The relatively low number of unseen species (the difference between Chao 1 and observed SR being five species) could be due to a taxonomic bias. In other words, many species with one or two individuals (mostly juveniles or females) were removed from the matrix because of the uncertainty of the identification. Two solutions to this taxonomic issue are to increase the sampling effort looking for individuals in adult stages and to apply DNA barcoding for the species identification [58,59].
The accumulation curves per habitat showed a radically different scenario, with most of the curves lacking an asymptotic shape. In general, the increase of the sampled area clearly had a strong positive effect on the SR as indicated by the steep shape of the curves [60]. Even for well-sampled habitats such as coral degradation zones and unvegetated muds, the shape of the curves indicated the existence of undiscovered species. Seagrass meadow and deep-water habitats looked to be a promissory sources of undiscovered species since their curves were steep. The sample size of 300 individuals suggested in [61] as sufficient to describe the diversity in seagrass meadows at local scale seemed reasonable. However, at larger spatial scales, a substantially higher number of individuals (likely >4000) is needed to estimate the true species richness.
The low number of collected individuals in the deep-waters seemed to be the main limitation for a more accurate estimate of species richness. Low number of nematodes would be a bias due to the use of 45 µm mesh size that misses small-sized nematodes which are proportionally more abundant in the deep sea [62]. However, other studies in deep sea habitats of the Gulf of Mexico, using 45 µm mesh, have reported a consistently higher number of individuals than in our study [63]. The most plausible explanation for the low abundance of nematodes in the DW samples was the combination of: (i) oligotrophic environment in the water column causing a reduced input of organic carbon to sediments via sedimentation; and (ii) strong hydrodynamic regime given by the Cuban countercurrent flowing along the northwestern shelf slope [64].
Based on the Dynamic Equilibrium Model (DEM), Moens et al. [15] related two environmental axes (i.e., resource availability and physical disturbance) with habitat types and hence with SR and abundance of nematode assemblages. The model reasonably fitted well to our data of SR and abundance for the marine habitats (Figure 6). However, we could not directly measure abiotic variables related to these drivers (e.g., biopolymeric carbon, current speed). This issue limits the strength of our evidence to test the DEM model. The depth can be a good correlate of food availability in sediments, splitting coastal and deep waters habitats [62]. However, in shallow coastal habitats depth is a poor predictor of food availability or hydrodynamic regime because other local factors (e.g., turbidity, shoreline topography) may also have a significant influence on productivity and hydrodynamics.
A word of caution in the interpretation of values of abundance is needed because of the lack of standardization of counts into density/concentration values. The disparate structure of the sampled habitats, e.g., coral rubble, algal turf, macroalgae thallus, and sediments, prevented such standardization. Therefore, the values of abundance obtained in our study may be indicative of relative differences between habitats, but may not constitute a reference framework for the absolute abundance in the habitats.
The unimodal curve of SR versus abundance suggested that the most specious habitats were those subjected to intermediate levels of resource availability (e.g., seagrass meadow and coral degradation zone). The sampled deep-waters were located on the shelf slope (~1500 m depth) and likely subjected to oligotrophic conditions in sediments and intense hydrodynamic regime. This habitat harbored a diverse but relatively scarce nematofauna with genera typical from the deep sea and reported from other oceanic basins [65]. Macroalgae thallus were also subjected to an intense hydrodynamic regime but larger resource availability is likely as biofilm and particulate organic matter accumulate on the thalli.
Coastal habitats (seagrass meadow, bare sand, algal turf, and coral degradation zone) were subjected to a moderately high level of physical disturbance by wave and current actions. The suite of species typical of these habitats had adaptations to physical disturbance such as ornamented cuticle, conical tails, and small body size. The most specious habitat was seagrass meadow, likely reflecting a large resource availability (e.g., interstitial space and food) and good protection from physical disturbance. The relatively larger body size of nematodes in seagrass meadows [66] indicated more available energy that supported in turn higher biomass [22]. Seagrass meadows are highly productive habitats, not only because of the seagrass primary production, but also because of the associated epiphytic microalgae [67]. The taxonomic and functional structure of nematode assemblages have been positively correlated with food availability in seagrass meadows [68,69,70]. The seagrass vegetation also enhances the nematode assemblages by increasing refuge from predators [71] and reducing the resuspension by currents [72]. The other coastal habitats with intermediate levels of richness (bare sand, algal turf, and coral degradation zone) likely were influenced by the biofilm produced by microphytobenthos as a main source of food for nematodes. Recent characterization of the biofilm growing on the Acropora palmata coral rubble indicated an associated rich microbial community of algae, sponges, virus, bacteria, and other microorganisms [73] that potentially provides food for epigrowth feeder nematodes.
The unvegetated muds were located in semi-enclosed bays with organically enriched sediments because of the augmented primary production by phytoplankton and microphytobenthos due to human-driven eutrophication. The accumulation and oxidation of organic matter in the bottoms caused seasonal hypoxia enhanced by a reduced hydrodynamic regime by weak tidal currents and salinity-driven stratification of the water column [74,75]. In these harsh conditions, only tolerant and opportunistic species (e.g., Terschellingia longicaudata and Sabatieria pulchra) were able to survive.
We removed the caves from the DEM model because extreme oligotrophy and physical isolation likely constituted the major drivers of the nematode assemblages. Several studies have indicated that food availability is the most important driver for nematode assemblages in caves (e.g., [76], and references therein). Stagnation of waters usually create hypoxia in the caves’ sediments adding additional stress. Isolation of the cave systems also limits the immigration of species promoting a low SR as well [76].
We analyzed the β-diversity at two different scales: β-diversity 1 measured the variation within habitats (i.e., among sites in a same habitat type), and β-diversity 2 measured the variation among habitats. Differences in β-diversity 1 likely were due to the small-scale habitat heterogeneity that promotes a larger number of different niches, a finer partition and specialization in the use of resources by the species (reducing the interspecific competition), and thus more distinctive assemblages [77]. Limitations to the dispersal imposed by geographical distances between sites and/or physical barriers also promoted the β-diversity 1, evidenced by the higher value in freshwater caves.
The β-diversity 2 was very high, indicating that habitat types harbored distinctive nematode assemblages, and highlighting its important role as an assembly factor. This pattern emerged despite the considerable small-scale variability displayed by nematode assemblages as a response of microhabitat heterogeneity and/or species interactions [15]. In addition to the combined effects of resource availability and physical disturbance (i.e., habitat filtering sensu latu), the connectivity among habitats was likely very important as an assembly process given by the dispersal of organisms [5]. The uniqueness of nematode assemblages in some habitats (e.g., caves, macroalgae thallus, and deep water) was likely caused by the limited dispersal capacity of nematodes [78]. Actually, the largest dissimilarity in nematode assemblage structure occurred in freshwater caves stressing the important role of dispersal and vicariance on the stygobiont meiofauna [79]. However, habitats that usually were located close to each other in the shallow waters (i.e., the coral reef complex: seagrass meadow, bare sand, coral degradation zone, and algal turf) had higher similarity in the assemblage structure when compared with other habitats more separated geographically (e.g., unvegetated bottoms or deep waters). This connectivity of coastal habitats, also termed as a mosaic, has been highlighted in [80] and it is relevant for ecosystem functioning and fisheries.
Macroalgae thalli likely acted as keystone structures providing resources (mainly biofilm) and substrate to nematodes. These keystone structures are linked to habitat heterogeneity, which in turn may promote the species richness and β-diversity [81]. However, macroalgae thalli were subjected to an intense hydrodynamic regime that likely limited the amount of epiphytic nematodes and overcame the role of the fractal complexity of the thalli [82]. Latter authors concluded that neither complexity nor deposited sediment influenced the epiphytic nematode assemblages. Apparently, the most similar habitat to the macroalgae thallus was the algal turf, but the latter had highly similar structure to the other coastal habitats (e.g., bare sand and seagrass meadow) likely reflecting the role of the passive dispersal of nematodes by bottom currents and the spatial nearness among these habitats.
The link between functional diversity and biological traits is complex and depends on the particular ecosystem and taxon under study [83]. For aquatic nematodes, only the life strategy (or c–p scale) takes into account physiological and developmental features. The other four traits analyzed here were based purely on morphological features (i.e., buccal cavity, cuticle, amphidial fovea, and tail). Life strategy, trophic group, and tail shape percentages meaningfully distributed across the habitats likely reflecting ecological adaptations of nematode species to the environment.
Freshwater caves harbored more nematodes with extreme c–p strategies (i.e., extreme colonizers and extreme persisters) due to the impoverished sediments that demanded fast colonization on ephemeral food patches or very low physiological rate to cope with the oligotrophic conditions. Dominance of predators/omnivores likely also reflected the oligotrophy of the cave sediments and the necessity to feed on detritus and also on other meiofauna [84]. In other cave systems with some accumulation of detritus and guano, the most dominant groups were bacterivores, followed by omnivores and predators [85]. The anchialine cave had a trophic group composition dominated by epigrowth feeders followed by selective detritivores. This likely reflected an important role of the immigration of nematode species from adjacent coral reef environments such as Paradesmodora immersa, Pomponema sp., and Zalonema ditlevseni. Other studies in submarine caves have reported different findings with the dominance of either non-selective deposit feeders or omnivores/predators [85,86].
Trophic groups in the marine habitats gave further indication about the food sources used by the nematodes, although many species behave as opportunistic feeders which may change feeding strategies in response to available food [87]. Sedimentary environments where detritus constitutes the main source of food (unvegetated mud and deep-water) had dominance of deposit feeding nematodes. Dominance of deposit feeders and pollution-tolerant genera (e.g., Sabatieria, Terschellingia) in unvegetated muds suggested that organic accumulation further fostered hypoxia in this habitat type [40,74]. The other coastal habitats supported a larger proportion of epigrowth feeders able to feed on biofilm growing on sand grains, macroalgae thallus or coral rubble.
Amphidial fovea shape varied without a clear pattern across the habitats. Semprucci et al. [26] have indicated some relationships between fovea shape and sediment type and hydrodynamic stress. Nematodes may be attracted or repelled by compounds released by cyanobacterial biofilms [88], but whether particular types of amphidial fovea play an adaptive role in the behavior of aquatic nematodes is yet to be tested. Our study covered a large range of environmental conditions across the nine habitats, so this lack of pattern in amphidial fovea composition likely pointed to weak, if any, ecological relationships. Further studies about the usefulness of this trait are needed in order to refine the classification by fovea type or discard the trait as a predictor of ecological conditions.
Cuticle showed a dominance of punctated/annulated types likely reflecting a phylogenetic signature instead of ecological adaptations to the environment. Enoplids and dorylaimids, mostly with smooth cuticle, dominated in freshwater caves, although one species (Ironus ignavus) contributed to most of the abundance as usually occurs in freshwater systems [89]. Six orders of chromadorids dominated in the studied marine habitats: Chromadorida, Desmodorida, Monhysterida, Plectida, Araeolaimida, and Desmoscolecida. Most of these orders included nematodes with punctated/annulated cuticle. An important fraction of nematodes from deep water sediments had a cuticle with wide body annules and longitudinal ridges that is explained by the relative dominance of the family Ceramonematidae. This fact pointed to a phylogenetic signature given by a particular family inhabiting deep-waters and bearing a cuticle with wide body annules and longitudinal ridges, but without obvious ecological link between habitat setting and cuticle type.
Tail shape may bring ecological information useful for the interpretation of trait composition patterns [53]. The elongated/filiforme tail shape was well-represented in fine sediments (freshwater cave, unvegetated mud, and deep water). These nematodes act as burrowing species pushing the sediment particles to create their space within the sediment; in these conditions, elongated/filiform tail may enhance locomotion. For the other habitats where particle size is larger (bare sand) or substrate is non-sedimentary, the interstitial strategy should be more important and conical tails seem to have higher adaptive value.
In summary, we reported a regional richness of 410 ± 12 species of nematodes for the Cuban archipelago; however, some habitats need to be sampled more intensively (e.g., caves and deep waters). Our data supported the dynamic equilibrium model with habitats reasonably ordered across gradients of resource availability and physical disturbance according to their SR and abundance. Seagrass meadow was the most specious habitat, and freshwater and anchihaline caves the least diverse. Differences in β-diversity likely were due to habitat heterogeneity (e.g., in seagrass meadows) and limitations for nematode dispersal (e.g., in caves). The nematode assemblage composition was unique in some habitats reflecting the effects of habitat filtering (e.g., deep waters, macroalgae thallus). However, coastal shallow habitats shared many species indicating a high connectivity due to geographic proximity and dispersal by bottom currents. The biological traits “life strategy”, “trophic group”, and “tail shape” reflected ecological adaptations to environmental setting. Instead, “amphidial fovea” and “cuticle” likely reflected phylogenetic signatures from families/genera living in different habitats. Habitat type played an influential role in the diversity patterns of aquatic nematodes from taxonomic and functional points of view.

Supplementary Materials

The following are available online at https://0-www-mdpi-com.brum.beds.ac.uk/1424-2818/11/9/166/s1, Table S1: List of the sites and associated information, Table S2: List of biological traits of nematodes.

Author Contributions

Conceptualization, M.A; methodology, M.A., and J.A.P.-G; formal analysis, M.A.; data curation, J.A.P.-G., D.M.-P., and P.R.-G.; writing—original draft preparation, M.A.; writing—review and editing, M.A., J.A.P.-G., D.M.-P., and P.R.-G.; funding acquisition, M.A.

Funding

This research was partially funded by THE OCEAN FOUNDATION, grant PROYECTO TRES GOLFOS; CARLSBERG FOUNDATION, grants 2013_01_0779, and 2013_01_0501; THE GULF OF MEXICO RESEARCH INITIATIVE through its consortia The Center for the Integrated Modeling and Analysis of the Gulf Ecosystem (C-IMAGE).

Acknowledgments

We deeply appreciate the contribution of past and current students that contributed with the identification of nematodes during almost 10 years: Adriana Parages, Alejandro Pérez, Ariadna Rojas, Arturo del Pino, Claudia Hernández, Gabriela Alvarez, Susset González, Yarima Díaz, and Yimay Sosa. We thank the staff of the Centro de Investigaciones Marinas, Universidad de La Habana, for the support during the expeditions and field trips. Acknowledgements to Katrine Worsaae, Alejandro Martínez-García and Brett C. González for the cave sampling and support of field work. We thank Adrián Martínez for the help with the map of the study sites and Fernando Bretos, Amy Apprill, and Steven A. Murawski for their help in the field working and funding. We thank the comments/criticisms by two anonymous reviewers which improved an earlier version of the manuscript.

Conflicts of Interest

The authors declare no conflict of interest. The funders had no role in the design of the study; in the collection, analyses, or interpretation of data; in the writing of the manuscript, or in the decision to publish the results.

References

  1. Begon, M.; Townsend, C.R.; Harper, J.L. Ecology: From Individuals to Ecosystems; Blackwell Publishing: Hoboken, NJ, USA, 2006. [Google Scholar]
  2. Southwood, T.R.E. Habitat, the templet for ecological studies? J. Anim. Ecol. 1977, 46, 337–365. [Google Scholar] [CrossRef]
  3. Southwood, T.R.E. Tactics, strategies and templets. Oikos 1988, 52, 3–18. [Google Scholar] [CrossRef]
  4. Ferraro, S.P. Ecological periodic tables: In principle and practice. Oikos 2013, 122, 1541–1553. [Google Scholar] [CrossRef]
  5. Vellend, M. Conceptual synthesis in community ecology. Q. Rev. Biol. 2010, 85, 183–206. [Google Scholar] [CrossRef] [PubMed]
  6. Kraft, N.J.B.; Adler, P.B.; Godoy, O.; James, E.C.; Fuller, S.; Levine, J.M. Community assembly, coexistence and the environmental filtering metaphor. Funct. Ecol. 2015, 29, 592–599. [Google Scholar] [CrossRef]
  7. Townsend, C.R.; Hildrew, A.G. Species traits in relation to a habitat templet for river systems. Freshw. Biol. 1994, 31, 265–275. [Google Scholar] [CrossRef]
  8. Hewitt, J.E.; Thrush, S.F.; Dayton, P.D. Habitat variation, species diversity and ecological functioning in a marine system. J. Exp. Mar. Biol. Ecol. 2008, 366, 116–122. [Google Scholar] [CrossRef]
  9. Ferraro, S.P.; Cole, F.A. Ecological periodic tables for benthic macrofaunal usage of estuarine habitats in the US Pacific Northwest. Estuar. Coast. Shelf Sci. 2011, 94, 36–47. [Google Scholar] [CrossRef]
  10. Ferraro, S.P.; Cole, F.A. Ecological periodic tables for benthic macrofaunal usage of estuarine habitats: Insights from a case study in Tillamook Bay, Oregon, USA. Estuar. Coast. Shelf Sci. 2012, 102–103, 70–83. [Google Scholar] [CrossRef]
  11. Anderson, M.J.; Crist, T.O.; Chase, J.M.; Vellend, M.; Inouye, B.D.; Freestone, A.L.; Sanders, N.J.; Cornell, H.V.; Comita, L.S.; Davies, K.F.; et al. Navigating the multiple meanings of b diversity: A roadmap for the practicing ecologist. Ecol. Lett. 2011, 14, 19–28. [Google Scholar] [CrossRef]
  12. Heip, C.; Vincx, M.; Vranken, G. The ecology of marine nematodes. Oceanogr. Mar. Biol. Annu. Rev. 1985, 23, 399–489. [Google Scholar]
  13. Abebe, E.; Andrássy, I.; Traunspurger, W. Freshwater Nematodes: Ecology and Taxonomy; Abebe, E., Andrássy, I., Traunspurger, W., Eds.; CABI Publishing: Oxfordshire, UK, 2006; p. 253. [Google Scholar]
  14. Appeltans, W.; Ahyong, S.T.; Anderson, G.; Angel, M.V.; Artois, T.; Bailly, N.; Bamber, R.; Barber, A.; Bartsch, I.; Berta, A.; et al. The magnitude of global marine species diversity. Curr. Biol. 2012, 22, 1–14. [Google Scholar] [CrossRef]
  15. Moens, T.; Braeckman, U.; Derycke, S.; Fonseca, G.; Gallucci, F.; Gingold, R.; Guilini, K.; Ingels, J.; Leduc, D.; Vanaverbeke, J.; et al. Ecology of free-living marine nematodes. Hand. Zool. 2013, 2, 109–152. [Google Scholar]
  16. Danovaro, R.; Carugati, L.; Corinaldesi, C.; Gambi, C.; Guilini, K.; Pusceddu, A.; Vanreusel, A. Multiple spatial scale analyses provide new clues on patterns and drivers of deep-sea nematode diversity. Deep Sea Res. II 2013, 92, 97–106. [Google Scholar] [CrossRef]
  17. Rosli, N.; Leduc, D.; Rowden, A.A.; Probert, P.K.; Clark, M.R. Regional and sediment depth differences in nematode community structure greater than between habitats on the New Zealand margin: Implications for vulnerability to anthropogenic disturbance. Prog. Oceanogr. 2018, 160, 26–52. [Google Scholar] [CrossRef]
  18. Pusceddu, A.; Gambi, C.; Zeppilli, D.; Bianchelli, S.; Danovaro, R. Organic matter composition, metazoan meiofauna and nematode biodiversity in Mediterranean deep-sea sediments. Deep Sea Res. II 2009, 56, 755–762. [Google Scholar] [CrossRef]
  19. McGill, B.J.; Enquist, B.J.; Weiher, E.; Westoby, M. Rebuilding community ecology from functional traits. Trends Ecol. Evol. 2006, 21, 178–185. [Google Scholar] [CrossRef] [PubMed]
  20. Huston, M. Biological Diversity: The Coexistence of Species on Changing Landscapes; Cambridge University Press: Cambridge, UK, 1994; p. 681. [Google Scholar]
  21. Connell, J.H. Diversity in tropical rain forests and coral reefs. Science 1978, 199, 1302–1310. [Google Scholar] [CrossRef]
  22. Wright, D.H. Species-energy theory: An extension of species-area theory. Oikos 1983, 41, 496–506. [Google Scholar] [CrossRef]
  23. Raes, M.; De Troch, M.; Ndaro, S.G.M.; Muthumbi, A.; Guilini, K.; Vanreusel, A. The structuring role of microhabitat type in coral degradation zones: A case study with marine nematodes from Kenya and Zanzibar. Coral Reefs 2007, 26, 113–126. [Google Scholar] [CrossRef]
  24. Raes, M.; Decraemer, W.; Vanreusel, A. Walking with worms: Coral-associated epifaunal nematodes. J. Biogeogr. 2008, 35, 2207–2222. [Google Scholar] [CrossRef]
  25. Semprucci, F.; Colantoni, P.; Sbrocca, C.; Baldelli, G.; Balsamo, M. Spatial patterns of distribution of meiofaunal and nematode assemblages in the Huvadhoo lagoon (Maldives, Indian Ocean). J. Mar. Biol. Assoc. UK 2014, 94, 1377–1385. [Google Scholar] [CrossRef]
  26. Semprucci, F.; Cesaroni, L.; Guidi, L.; Balsamo, M. Do the morphological and functional traits of free-living marine nematodes mirror taxonomical diversity? Mar. Environ. Res. 2018, 135, 114–122. [Google Scholar] [CrossRef] [PubMed]
  27. Santos, T.M.T.; Venekey, V. Meiofauna and free-living nematodes in volcanic sands of a remote South Atlantic, oceanic island (Trindade, Brazil). J. Mar. Biol. Assoc. UK 2017. [Google Scholar] [CrossRef]
  28. Prasath, D.; Balasubramaniam, J.; Jayarat, K.A. Diversity and distribution of the free-living marine nematodes in the mangrove sediments of the Andaman Islands. Indian J. Geo Mar. Sci. 2018, 47, 2217–2224. [Google Scholar]
  29. Thai, T.T.; Lam, N.L.Q.; Yen, N.T.M.; Vanreusel, A.; Quang, N.X. Biodiversity and distribution patterns of free-living nematode communities in Ba Lai River, Ben Tree Province. Vietnam J. Sci. Technol. 2018, 56, 224–235. [Google Scholar] [CrossRef]
  30. Colwell, R.K.; Coddington, J.A. Estimating terrestrial biodiversity through extrapolation. Philos. Trans. R. Soc. Lond. B Biol. Sci. 1994, 345, 101–118. [Google Scholar] [PubMed] [Green Version]
  31. Gotelli, N.J.; Colwell, R.K. Estimating species richness. In Biological Diversity. Frontiers in Measurement and Assessment; Magurran, A.E., McGill, B.J., Eds.; Oxford University Press: Oxford, UK, 2011; pp. 39–54. [Google Scholar]
  32. Violle, C.; Navas, M.L.; Vile, D.; Kazakou, E.; Fortunel, C.; Hummel, I.; Garnier, E. Let the concept of trait be functional! Oikos 2007, 116, 882–892. [Google Scholar] [CrossRef]
  33. Kiørboe, T.; Visser, A.; Andersen, K.H. A trait-based approach to ocean ecology. ICES J. Mar. Sci. 2018, 75, 1849–1863. [Google Scholar] [CrossRef]
  34. Van der Plas, F. Biodiversity and ecosystem functioning in naturally assembled communities. Biol. Rev. 2019, 94, 1220–1245. [Google Scholar] [CrossRef]
  35. Bremner, J.; Rogers, S.I.; Frid, C.L.J. Assessing functional diversity in marine benthic ecosystems: A comparison of approaches. Mar. Ecol. Prog. Ser. 2003, 254, 11–25. [Google Scholar] [CrossRef]
  36. Bremner, J.; Rogers, S.I.; Frid, C.L.J. Methods for describing ecological functioning of marine benthic assemblages using biological traits analysis (BTA). Ecol. Ind. 2006, 6, 609–622. [Google Scholar] [CrossRef]
  37. Schratzberger, M.; Warr, K.; Rogers, S.I. Functional diversity of nematode communities in the southwestern North Sea. Mar. Environ. Res. 2007, 63, 368–389. [Google Scholar] [CrossRef] [PubMed] [Green Version]
  38. Alves, A.S.; Veríssimo, H.; Costa, M.J.; Marques, J.C. Taxonomic resolution and Biological Traits Analysis (BTA) approaches in estuarine free-living nematodes. Estuar. Coast. Shelf Sci. 2014, 138, 69–78. [Google Scholar] [CrossRef] [Green Version]
  39. Liu, X.; Liu, Q.; Zhang, Y.; Hua, E.; Zhang, Z. Effects of Yellow Sea Cold Water Mass on marine nematodes based on biological trait analysis. Mar. Environ. Res. 2018, 141, 167–185. [Google Scholar] [CrossRef] [PubMed]
  40. Armenteros, M.; Ruiz-Abierno, A.; Fernández-Garcés, R.; Pérez-García, J.A.; Díaz-Asencio, L.; Vincx, M.; Decraemer, W. Biodiversity patterns of free-living marine nematodes in a tropical bay: Cienfuegos, Caribbean Sea. Estuar. Coast. Shelf Sci. 2009, 85, 179–189. [Google Scholar] [CrossRef] [Green Version]
  41. Pérez-García, J.A.; Marzo-Pérez, D.; Armenteros, M. Spatial scale influences diversity patterns of free-living nematode assemblages in coral degradation zones from the Caribbean Sea. Mar. Biodivers. 2019, 49, 1831–1842. [Google Scholar] [CrossRef]
  42. Andrássy, I. Nematoden aus strand- und höhlenbiotopen von Kuba. Acta Zool. Acad. Sci. Hung. 1973, 19, 233–270. [Google Scholar]
  43. López-Cánovas, C.I.; Pastor De Ward, C. Lista de los nemátodos de la clase Adenophorea (Subclase Chromadoria y Enoplia) de los pastos marinos del archipiélago Sabana-Camagüey, Cuba. Poeyana 2006, 494, 38–42. [Google Scholar]
  44. Armenteros, M.; Pérez-García, J.A.; Pérez-Angulo, A.; Williams, J.P. Efficiency of extraction of meiofauna from sandy and muddy marine sediments. Rev. Investig. Marian. Univ. Habana 2008, 29, 113–118. [Google Scholar]
  45. De Grisse, A.T. Redescription ou modification de quelques techniques utilises dans l’ étude des nématodes phytoparasitaires. Meded. Rijksfac. Landbouwwet. Gent 1969, 34, 351–369. [Google Scholar]
  46. Platt, H.M.; Warwick, R.M. Free-Living Marine Nematodes. Part I. British Enoplids; The Linnean Society of London and The Estuarine and Brackish-Water Sciences Association: Cambridge, UK, 1983; Volume 28. [Google Scholar]
  47. Platt, H.M.; Warwick, R.M. Free-Living Marine Nematodes. Part II. British Chromadorids; The Linnean Society of London and The Estuarine and Brackish-water Sciences Association: Leiden, The Netherlands, 1988; Volume 38. [Google Scholar]
  48. Warwick, R.M.; Platt, H.M.; Somerfield, P.J. Free-Living Marine Nematodes. Part III. Monhysterids; The Linnean Society of London and The Estuarine and Coastal Sciences Association: Shrewsbury, UK, 1998; Volume 53. [Google Scholar]
  49. Bongers, T.; Alkemade, R.; Yeates, G.W. Interpretation of disturbance-induced maturity decrease in marine nematode assemblages by means of the Maturity Index. Mar. Ecol. Prog. Ser. 1991, 76, 135–142. [Google Scholar] [CrossRef]
  50. Bongers, T.; Bongers, M. Functional diversity of nematodes. Appl. Soil Ecol. 1998, 10, 239–251. [Google Scholar] [CrossRef]
  51. Bongers, T.; De Goede, R.G.M.; Korthals, G.W.; Yeates, G.W. Proposed changes of c–p classification for nematodes. Russ. J. Nematol. 1995, 3, 61–62. [Google Scholar]
  52. Wieser, W. Die Bezichung swischen Mundhöhlengestalt, Ernährungsweise und Vorkommen bei freilebenden marinen Nematoden. Ark. Zool. 1953, 4, 439–484. [Google Scholar]
  53. Thistle, D.; Lambshead, P.J.D.; Sherman, K.M. Nematode tail-shape groups respond to environmental differences in the deep sea. Vie Milieu 1995, 45, 107–115. [Google Scholar]
  54. Colwell, R.K. EstimateS: Statistical Estimation of Species Richness and Shared Species from Samples. Version 9. Available online: http://purl.oclc.org/estimates (accessed on 26 December 2018).
  55. Chao, A.; Chazdon, R.L.; Colwell, R.K.; Shen, T.J. Abundance-based similarity indices and their estimation when there are unseen species in samples. Biometrics 2006, 62, 361–371. [Google Scholar] [CrossRef] [PubMed]
  56. Clarke, K.R.; Gorley, R.N. Primer V6: User Manual/Tutorial; Primer-E, Ltd: Plymouth, UK, 2006. [Google Scholar]
  57. Anderson, M.J.; Gorley, R.N.; Clarke, K.R. PERMANOVA+ for PRIMER: Guide to Software and Statistical Methods; Primer-E, Ltd: Plymouth, UK, 2008. [Google Scholar]
  58. Armenteros, M.; Rojas-Corzo, A.; Ruiz-Abierno, A.; Derycke, S.; Backeljau, T.; Decraemer, W. Systematics and DNA barcoding of free-living marine nematodes with emphasis on tropical desmodorids using nuclear SSU rDNA and mitochondrial COI sequences. Nematology 2014, 16, 979–989. [Google Scholar] [CrossRef]
  59. Macheriotou, L.; Guilini, K.; Bezerra, T.N.C.; Tytgat, B.; Nguyen, D.T.; Nguyen, T.X.P.; Noppe, F.; Armenteros, M.; Boufahja, F.; Rigaux, A.; et al. Metabarcoding free-living marine nematodes using curated 18S and CO1 reference sequence databases for species-level taxonomic assignments. Ecol. Evol. 2019, 9, 1211–1226. [Google Scholar] [CrossRef] [PubMed]
  60. Steinmann, K.; Eggenberg, S.; Wohlgemuth, T.; Linder, H.P.; Zimmermann, N.E. Niches and noise—Disentangling habitat diversity and area effect on species diversity. Ecol. Complex. 2011, 8, 313–319. [Google Scholar] [CrossRef]
  61. Liao, J.X.; Yeh, H.M.; Mok, H.K. Meiofaunal communities in a tropical seagrass bed and adjacent unvegetated sediments with note on sufficient sample size for determining local diversity indices. Zool. Stud. 2015, 54, 14. [Google Scholar] [CrossRef]
  62. Udalov, A.A.; Azovsky, A.I.; Mokievsky, V.O. Depth-related pattern in nematode size: What does the depth itself really mean? Prog. Oceanogr. 2005, 67, 1–23. [Google Scholar] [CrossRef]
  63. Sharma, J.; Baguley, J.; Montagna, P.A.; Rowe, G.T. Assessment of Longitudinal Gradients in Nematode Communities in the Deep Northern Gulf of Mexico and Concordance with Benthic Taxa. Int. J. Oceanogr. 2012, 2012, 15. [Google Scholar] [CrossRef]
  64. Brooks, G.R.; Larson, R.A.; Schwing, P.T.; Diercks, A.R.; Armenteros, M.; Diaz-Asencio, M.; Martínez-Suárez, A.; Sanchez-Cabeza, J.A.; Ruiz-Fernandez, A.C.; Herguera, J.C.; et al. Gulf of Mexico (GoM) bottom sediments and depositional processes: A baseline for future oil spills. In Scenarios and Responses to Future Deep Oil Spills; Murawski, S.A., Ainsworth, C.H., Gilbert, S., Hollander, D.J., Paris, C.B., Schlüter, M., Wetzel, D.L., Eds.; Springer Nature: Basel, Switzerland, 2020; pp. 75–95. [Google Scholar]
  65. Vanreusel, A.; Fonseca, G.; Danovaro, R.; da Silva, M.C.; Esteves, A.M.; Ferrero, T.; Gad, G.; Galtsova, V.; Gambi, M.C.; Fonsêca-Genevois, V.G.; et al. The contribution of deep-sea macrohabitat heterogeneity to global nematode diversity. Mar. Ecol. 2010, 31, 6–20. [Google Scholar] [CrossRef] [Green Version]
  66. Armenteros, M.; Ruiz-Abierno, A. Body size distribution of free-living marine nematodes from a Caribbean coral reef. Nematology 2015, 17, 1153–1164. [Google Scholar] [CrossRef]
  67. Hemminga, M.A.; Duarte, C.M. Seagrass Ecology; Cambridge University Press: Cambridge, UK, 1999; p. 299. [Google Scholar]
  68. Danovaro, R.; Gambi, C. Biodiversity and trophic structure of nematode assemblages in seagrass systems: Evidence for a coupling with changes in food availability. Mar. Biol. 2002, 141, 667–677. [Google Scholar]
  69. Fisher, R. Spatial and temporal variations in nematode assemblages in tropical seagrass sediments. Hydrobiologia 2003, 493, 43–63. [Google Scholar] [CrossRef]
  70. Fisher, R.; Sheaves, M.J. Community structure and spatial variability of marine nematodes in tropical Australian pioneer seagrass meadows. Hydrobiologia 2003, 495, 143–158. [Google Scholar] [CrossRef]
  71. Canion, C.R.; Heck, K.L., Jr. Effect of habitat complexity on predation success: Re-evaluating the current paradigm in seagrass beds. Mar. Ecol. Prog. Ser. 2009, 393, 37–46. [Google Scholar] [CrossRef]
  72. Walters, K.; Bell, S.S. Diel patterns of active vertical migration in seagrass meiofauna. Mar. Ecol. Prog. Ser. 1986, 34, 95–103. [Google Scholar] [CrossRef]
  73. Sánchez-Quinto, A.; Falcón, L.I. Metagenome of Acropora palmata coral rubble: Potential metabolic pathways and diversity in the reef ecosystem. PLoS ONE 2019, 14, e0220117. [Google Scholar] [CrossRef] [PubMed]
  74. Armenteros, M.; Pérez-Angulo, A.; Regadera, R.; Beltrán, J.; Vincx, M.; Decraemer, W. Effects of heavy and chronic pollution on macro- and meiobenthos of Havana Bay, Cuba. Rev. Investig. Marina. Univ. Habana 2009, 30, 203–214. [Google Scholar]
  75. Díaz-Asencio, L.; Helguera, Y.; Fernández-Garcés, R.; Gómez-Batista, M.; Rosell, G.; Hernández, Y.; Pulido, A.; Armenteros, M. Two-year temporal response of benthic macrofauna and sediments to hypoxia in a tropical semi-enclosed bay (Cienfuegos, Cuba). Rev. Biol. Trop. 2016, 64, 177–188. [Google Scholar] [CrossRef] [PubMed] [Green Version]
  76. Du Preez, G.; Majdi, N.; Swart, A.; Traunspurger, W.; Fourie, H. Nematodes in caves: A historical perspective on their occurrence, distribution and ecological relevance. Nematology 2017, 19, 627–644. [Google Scholar] [CrossRef]
  77. Hewitt, J.E.; Thrush, S.F.; Halliday, J.; Duffy, C. The importance of small-scale habitat structure for maintaining beta diversity. Ecology 2005, 86, 1619–1626. [Google Scholar] [CrossRef]
  78. Derycke, S.; Backeljau, T.; Moens, T. Dispersal and gene flow in free-living marine nematodes. Front. Zool. 2013, 10, 12. [Google Scholar] [CrossRef] [PubMed]
  79. Culver, D.C.; Pipan, T.; Schneider, K. Vicariance, dispersal and scale in the aquatic subterranean fauna of karst regions. Freshw. Biol. 2009, 54, 918–929. [Google Scholar] [CrossRef]
  80. Kritzer, J.P.; Delucia, M.B.; Greene, E.; Shumway, C.; Topolski, M.F.; Thomas-Blate, J.; Chiarella, L.A.; Davy, K.B.; Smith, K.P. The importance of benthic habitats for coastal fisheries. BioScience 2016, 66, 274–284. [Google Scholar] [CrossRef]
  81. Tews, J.; Brose, U.; Grimm, V.; Tielbörger, K.; Wichmann, M.C.; Schwager, M.; Jeltsch, F. Animal species diversity driven by habitat heterogeneity/diversity: The importance of keystone structures. J. Biogeogr. 2004, 31, 79–92. [Google Scholar] [CrossRef]
  82. Pérez-García, J.A.; Ruiz-Abierno, A.; Armenteros, M. Does morphology of host marine macroalgae drive the ecological structure of epiphytic meiofauna? J. Mar. Biol. Oceanogr. 2015, 4, 7. [Google Scholar] [CrossRef]
  83. Petchey, O.L.; Gaston, K.J. Functional diversity: Back to basics and looking forward. Ecol. Lett. 2006, 9, 741–758. [Google Scholar] [CrossRef]
  84. Pérez-García, J.A.; Díaz-Delgado, Y.; García-Machado, E.; Martínez-García, A.; Gonzalez, B.C.; Worsaae, K.; Armenteros, M. Nematode diversity of freshwater and anchialine caves of Western Cuba. Proc. Biol. Soc. Wash. 2018, 131, 144–155. [Google Scholar] [CrossRef]
  85. Zhou, H.; Zhang, Z.N. Nematode assemblages from submarine caves in Hong Kong. J. Nat. Hist. 2008, 42, 781–795. [Google Scholar] [CrossRef]
  86. Ape, F.; Arigó, C.; Gristina, M.; Genovese, L.; Di Franco, A.; Di Lorenzo, M.; Baiata, P.; Aglieri, G.; Milisenda, G.; Mirto, S. Meiofaunal diversity and nematode assemblages in two submarine caves of a Mediterranean marine protected area. Mediterr. Mar. Sci. 2016, 17, 202–215. [Google Scholar] [CrossRef]
  87. Moens, T.; Vincx, M. Observations on the feeding ecology of estuarine nematodes. J. Mar. Biol. Assoc. UK 1997, 77, 211–227. [Google Scholar] [CrossRef]
  88. Höckelmann, C.; Moens, T.; Jüttner, F. Odor compounds from cyanobacterial biofilms acting as attractants and repellents for free-living nematodes. Limnol. Oceanogr. 2004, 49, 1809–1819. [Google Scholar] [CrossRef] [Green Version]
  89. Traunspurger, W. Ecology of freshwater nematodes. Hand. Zool. 2013, 2, 153–169. [Google Scholar]
Figure 1. Map indicating the 60 sampling sites of aquatic nematode assemblages around the Cuban archipelago. Symbols indicate the nine habitat types.
Diversity 11 00166 g001
Figure 2. Accumulation curves of nematode species versus individuals. (a) For all the samples pooled using the observed species richness (SR) and the non-parametric estimator Chao 1; (b) the SR per habitat type.
Diversity 11 00166 g002
Figure 3. Species richness (SR) of nematode assemblages in 60 sites from nine aquatic habitats. (a) Observed SR ± 0.95 confidence intervals (CI); (b) Expected number of species (ES) in a subsample of 540 individuals. Note that ES (540) was not computed for two habitats due to their low abundance. Acronyms of the habitats: FC = freshwater cave, AC = anchihaline cave, BS = bare sand, UM = unvegetated mud, AT = algal turf, MT = macroalgae thallus, SM = seagrass meadow, CDZ = coral degradation zone, and DW = deep water.
Diversity 11 00166 g003
Figure 4. (a) Numerical ordination by non-metric multidimensional scaling (NMDS) of the samples coded by habitat type and based on square-root transformed abundance of nematodes. (b) β-diversity per habitat type represented as the mean (± standard deviation) of distance to centroid based on Bray–Curtis index. Note that β-diversity could not be computed in AC because only one site. (c) NMDS of habitats. Acronyms of the habitats: FC = freshwater cave, AC = anchihaline cave, BS = bare sand, UM = unvegetated mud, AT = algal turf, MT = macroalgae thallus, SM = seagrass meadow, CDZ = coral degradation zone, and DW = deep water.
Diversity 11 00166 g004
Figure 5. Biological traits of nematode assemblages across nine habitats. (a) Life strategy scale (scale from 1, colonizer to 5, persister) [43]. (b) Trophic groups based on buccal cavity morphology (detrit. = detritivore, pred. = predator, omniv. = omnivore) [46]. (c) Amphidial fovea shape (longit. = longitudinal) [34]. (d) Cuticle type (punct. = punctated, ann. = annulated, w/long. struct. = with longitudinal structures along the whole body length, ann. w/ridges = wide annules with ridges, cov. = covering) [34]. (e) Tail shape (clav. = clavate, con.-cyl. = conical-cylindrical, elong. = elongated, filif. = filiforme) [47]. Acronyms of the habitats: FC = freshwater cave, AC = anchihaline cave, BS = bare sand, UM = unvegetated mud, AT = algal turf, MT = macroalgae thallus, SM = seagrass meadow, CDZ = coral degradation zone, and DW = deep water.
Diversity 11 00166 g005
Figure 6. The relationships between species richness and abundance of nematodes across nine aquatic habitats. Gradients of physical disturbance and resource availability are superposed on qualitative bases. The curve (red line) is the best fitted line by a polynomial function. Based on the conceptual model in [15]. Four sites were removed because outlier values: two defaunated UM from the extremely polluted Havana Bay, one SM, and one CDZ represented aggregated samples with artificially high values of abundance.
Diversity 11 00166 g006
Table 1. Nematode species typical of each habitat type based on SIMPER analysis. Species were chosen by the ordered contribution to the within-habitat similarity (measured by Bray–Curtis index) and only those that contribute up to 50% of cumulative similarity were listed. Acronyms of the habitats: FC = freshwater cave, AC = anchihaline cave, BS = bare sand, UM = unvegetated mud, AT = algal turf, MT = macroalgae thallus, SM = seagrass meadow, CDZ = coral degradation zone, and DW = deep water.
SpeciesFCACBSUMATMTSMCDZDW
Average within-habitat similarity25% 36%26%46%68%25%53%27%
Ironus ignavusX
Monhystrella sp.X
Aphanolaimus sp.X
Pomponema sp. X
Zalonema ditlevseni X XX
Paradesmodora immersa X X
Desmodora pontica X X XX
Tricoma sp. X X X
Enoploides bisulcus X
Innocuonema asymmetricum X
Viscosia abyssorum X X
Sabatieria pulchra X
Terschellingia longicaudata X X
Terschellingia communis X
Euchromadora vulgaris X XX
Epsilonema sp. X
Croconema cinctum X X
Euchromadora gaulica X X
Acanthopharynx denticulata X
Chromadora brevipapillata X
Paracanthonchus platypus X
Chromadorella paramucrodonta X
Chromadorella filiformis X X
Euchromadora atypica X
Marylynnia sp. X
Halichoanolaimus chordiurus X
Cheironchus vorax X
Mesacanthion sp. X
Desmoscolex sp. X
Halichoanolaimus sp. X
Dorylaimopsis punctata X
Setosabatieria hilarula X
Daptonema sp. X
Draconema sp. X
Endeolophos fossiferus X
Metadasynemella falciphalla X
Acantholaimus megamphis X
Cervonema macramphis X
Pselionema simile X
Bolbolaimus sp. X
Desmodorella tenuispiculum X
Acantholaimus maks X
Metadasynemella cassidiniensis X

