Article

Evolutionary History of the Galápagos Rail Revealed by Ancient Mitogenomes and Modern Samples

by
Jaime A. Chaves
1,2,*,
Pedro J. Martinez-Torres
2,
Emiliano A. Depino
3,
Sebastian Espinoza-Ulloa
4,5,
Jefferson García-Loor
2,
Annabel C. Beichman
6 and
Martin Stervander
7,*
1
Department of Biology, San Francisco State University, 1600 Holloway, San Francisco, CA 94132, USA
2
Colegio de Ciencias Biológicas y Ambientales, Laboratorio de Biología Evolutiva, Campus Cumbayá, Universidad San Francisco de Quito, Casilla Postal 17-1200-841, Quito 170901, Ecuador
3
Laboratorio de Ecología, Comportamiento y Sonidos Naturales (ECOSON), Instituto de Bio y Geociencias del Noroeste Argentino (IBIGEO-CONICET), Av 9 de julio 14, Rosario de Lerma, Salta 4405, Argentina
4
Department of Biology, University of Saskatchewan, 112 Science Place, Saskatoon, SK S7N 5E2, Canada
5
Facultad de Medicina, Pontificia Universidad Católica del Ecuador, Av. 12 de Octubre, Quito 170901, Ecuador
6
Department of Genome Sciences, University of Washington, Seattle, WA 98195, USA
7
Bird Group, Department of Life Sciences, The Natural History Museum, Akeman Street, Tring, Hertfordshire HP23 6AP, UK
*
Authors to whom correspondence should be addressed.
Submission received: 8 October 2020 / Revised: 9 November 2020 / Accepted: 10 November 2020 / Published: 12 November 2020
(This article belongs to the Section Phylogeny and Evolution)

Abstract

:
The biotas of the Galápagos Islands are one of the best studied island systems and have provided a broad model for insular species’ origins and evolution. Nevertheless, some locally endemic taxa, such as the Galápagos Rail Laterallus spilonota, remain poorly characterized. Owing to its elusive behavior, cryptic plumage, and restricted distribution, the Galápagos Rail is one of the least studied endemic vertebrates of the Galapagos Islands. To date, there is no genetic data for this species, leaving its origins, relationships to other taxa, and levels of genetic diversity uncharacterized. This lack of information is critical given the adverse fate of island rail species around the world in the recent past. Here, we examine the genetics of Galápagos Rails using a combination of mitogenome de novo assembly with multilocus nuclear and mitochondrial sequencing from both modern and historical samples. We show that the Galápagos Rail is part of the “American black rail clade”, sister to the Black Rail L. jamaicensis, with a colonization of Galápagos dated to 1.2 million years ago. A separate analysis of one nuclear and two mitochondrial markers in the larger population samples demonstrates a shallow population structure across the islands, possibly due to elevated island connectivity. Additionally, birds from the island Pinta possessed the lowest levels of genetic diversity, possibly reflecting past population bottlenecks associated with overgrazing of their habitat by invasive goats. The modern and historical data presented here highlight the low genetic diversity in this endemic rail species and provide useful information to guide conservation efforts.

Graphical Abstract

1. Introduction

Studies of island biotas provide insights into the origin of species and the associated factors promoting diversification. From characterizing morphological variation, documenting the time of divergence from mainland counterparts, to ultimately understanding the formation of independently evolving lineages, insular species have inspired scientists for centuries [1,2,3,4,5,6]. Among these, the biological assemblage of the Galápagos archipelago has (1) provided support for the progression rule, i.e., the order of colonization of islands relative to their age [7,8,9]; (2) provided textbook examples of the origin of adaptive radiations (Darwin’s finches) [3,10]; (3) led to postulates of the role of isolation in promoting diversification (mockingbirds Mimus spp. [11] and giant tortoises Chelonoidis spp. [12]); and (4) showcased different origins of sympatric endemic species [13,14]. Most studies of the Galápagos fauna focus on highly charismatic species and, in particular, endemic vertebrate species have been subject to extensive molecular and morphological assessment, providing one of the greatest insular biota datasets [7,8,9,11,12,13]. These studies have helped to raise awareness of the conservation status and have informed management strategies for the preservation of several species, through the delineation of conservation units (see [15]) and, specifically, evolutionarily significant units (see [16]). Unfortunately, a few less charismatic endemic vertebrate species, such as the Galápagos Rail Laterallus spilonota, have suffered from a lack of such effort. This has not only left a gap in our understanding of their evolutionary trajectory and origin, but most importantly, their conservation status is poorly known, and their extinction could potentially go unnoticed.
Species inhabiting oceanic islands are most vulnerable to extinction due to human impact, particularly those that are flightless. Loss of flight in birds has evolved as a consequence of the absence of natural predators [17,18,19], promoting endemism. Rails (Rallidae) represent a paradigmatic example, with several species restricted to single islands [20,21]. Unfortunately, the introduction of predators make these species extremely susceptible to population declines and ultimately extinction [22,23]. Historically, rails have succumbed quickly to human contact with the loss of as many as 440–1580 species on islands in the Pacific [24]. Today, 22 of the 33 threatened rail species occur on islands, of which 86% are threatened by invasive mammals [25].
The endemic Galápagos Rail is a species with adaptations to remote oceanic islands that has been largely overlooked by researchers, making it one of the least studied land-bird species on the Galápagos Islands. To date, there is no genetic data available for the species. The historical distribution of Galápagos Rails has been documented by collectors and naturalists since the early 1900s, allowing a reconstruction of the impact and decline of populations compared to present data [26]. The introduction of rats and goats in the 18th century by mariners and early colonists, using these islands for water and food supply [27,28,29], had a direct impact on native species and their ecosystems [30]. Galápagos Rails, once abundant as reported by Darwin in 1896 [1], depend on the presence of wetlands and dense vegetation. These habitats were eroded by agricultural expansion and overgrazing by goats and were further altered by invasive plant species [31,32]. Likewise, predation by rats and cats had a devastating effect on rails given their inability to fly [25]. These events have resulted in the extinction of several of the Galápagos Rail populations across the archipelago. The few remaining populations [33] experienced dramatic declines and survive only in small pockets of natural habitat in the highlands on just five of the eight islands historically inhabited by the species. Listed as Vulnerable in the IUCN Red List [34], despite the eradication of goats in the 1970s and ongoing pest-control efforts [35,36,37], the Galápagos Rail still faces continuous threats of habitat modification by invasive species [38] and agricultural expansion [39].
Here, we bring to light the evolutionary history of the Galápagos Rail by assessing (1) its current genetic diversity; (2) its phylogenetic relationships to other rails; (3) the timing of its colonization; and (4) its phylogeographic patterns and inter-island genetic relationships. Gathering this genetic information is a fundamental prerequisite to preserve the evolutionary potential of rails in the face of their recent global decline.
We address the above by sequencing DNA from a combination of fresh tissue samples and century-old historic museum specimens collected by the California Academy of Sciences expedition to the Galápagos in 1905–1906. The phylogenetic relationships of the Galápagos Rail proposed here for the first time are based on a high-throughput sequenced de novo assembly of its mitochondrial genome (mitogenome). We also infer the timing of their long-distance colonization and characterize the partition of genetic diversity across the islands.

2. Materials and Methods

2.1. Study Sites and Sampling

Our priority was the generation of mitogenome data from material preserved in natural history collections. DNA extracted from toe pad tissue allows mitochondrial genome assembly at a relatively low total sequencing depth, as the cells contain a significantly higher ratio of mitochondrial to nuclear genomes compared to DNA from nucleated avian blood cells. While blood samples can be readily extracted from live birds, museum specimens offered a better opportunity for destructive tissue sampling. Therefore, a series of Galápagos Rail specimens deposited at the California Academy of Sciences (CAS) collected on Santa Cruz island in 1905–1906 were accessed and toe pad sections from ten individuals were loaned.
Additionally, modern blood samples were obtained from Santa Cruz, Santiago, Pinta, and Isabela (Galápagos Islands, Ecuador; Figure 1a,b) in May–July 2017 to complement the genetic assessment of Galápagos Rails. We concentrated our efforts to the highlands, where we used playback to confirm the presence of rails as well as to define their territories in order not to trap the same bird more than once. Birds were captured using V-netting with the playback trapping method [40], which consists of the arrangement of mist-nets forming a “V” and placed at ground level. Birds were lured inside the “V” using playback and led into the mist-nets by two people that monitor and adjust dynamically to bird responses. From each captured bird, we collected blood from the brachial vein in the field and preserved samples on Whatman® FTA® blood stain cards (Sigma Aldrich, St. Louis, MO, USA). We captured a total of 60 individuals in the field: 15 from Santa Cruz, 16 from Isabela, nine from Pinta, and 20 from Santiago. Out of the total number of samples from Santa Cruz, three were chicks, as were four from Santiago. Rails were found at sites above 500 m characterized by high coverage of bracken Pteridium aquilinum and tall grasses (Pennisetum purpureum and Paspalum conjugatum). Usually these sites were in a matrix with native Galápagos Miconia Miconia robinsoniana and invasive quinine trees Cinchona pubescens, primarily in Santa Cruz, with guava trees Psidium guajava and blackberry Rubus sp. in the rest of the islands sampled.

2.2. Ancient DNA Extraction and Mitogenome Assembly

Ancient DNA isolation from the museum samples was performed at UCLA’s dedicated ancient DNA facility following phenol–chloroform extraction procedures, but with 30 ul DTT added to the initial incubation step of the extraction. DNA quantification was done using Epoch™ (BioTek, Winooski, VT, USA) before the library preparations and amplification procedures. DNA quantity was tested using the Qubit™ dsDNA BR Assay Kit on an Invitrogen™ Qubit 3 fluorometer (ThermoFisher Scientific, Waltham, MA, USA). Whole-genome next generation paired-end sequencing libraries with dual-index barcodes were prepared from five museum samples at the UCLA Technology Center for Genomics and Bioinformatics (TCGB, Los Angeles, CA, USA). The samples were sequenced on the HiSeq3000 (150 PE) at the TCGB. Read quality was determined using MultiQC [41]. There was little need for trimming, as the reads were overall considerably shorter than 150 bp due to DNA fragmentation.
Exploration and preliminary mapping to Swinhoe’s Rail Coturnicops exquisitus (Genbank accession no. NC_012143) was performed for all samples in Geneious v. 10.2.6 [42], using their native mapper with highly relaxed settings: “custom sensitivity”, only allowing mapping of full read pairs at a minimum mapping quality of 7, maximum gaps per read of 30%, maximum mismatches per read of 35%, and maximum ambiguity of 10. We allowed up to 25 iterations, in which the first round reads are mapped directly onto the reference, and the subsequent iterations onto the consensus of the previously mapped reads, as a way of bridging regions of high divergence. Based on read quality, read length, and mapping success, we selected the sample GR9 (CAS ORN 274 catalog number) for a reference assembly of L. spilonota. For GR9, the mapping was complete in five iterations and 31,220 read pairs covered all of the C. exquisitus reference sequence. We extracted these as fastq files, which we then used as mitochondrion-enriched starting material for a de novo assembly and annotation of the mitochondrial genome with MitoZ v. 2.4.α [43]. Using three CPUs, we ran the filter, assemble, findmitoscaf, annotate, and visualize modules with standard parameter settings, specifying the clade Chordata, an insert-size of 200, and the filter_taxa_method 3. The resulting annotated genome was aligned with other rallid mitochondrial genomes and the annotations were manually inspected and adjusted with regard to the start of the 16S rRNA, and the inclusion of an additional C in ND3 causing a frameshift that is corrected through an unknown mechanism [44].
We mapped reads from the remaining samples to the circularized GR9 reference assembly in two steps with the Geneious mapper. First, we enriched for mitochondrial reads in a step using the setting “low sensitivity”, with a minimum mapping quality 15 and maximum mismatches per read of 10% in two iterations. We then took the mapping reads and re-mapped them with the “highest sensitivity” setting, allowing up to 25 iterations. The resulting contig consensus sequences were aligned with the GR9 reference, all annotations were lifted over, and every sequence variant position or ambiguity manually scrutinized against their respective mapping reads.

2.3. Genetic Diversity

In addition to the high-throughput sequencing described above, we sequenced one nuclear and two mitochondrial markers from 60 contemporary field samples to be able to assess a more detailed population structure and intraspecific patterns of diversification. Genomic DNA was extracted from blood cards using the DNeasy Blood and Tissue Kit (Qiagen, Germantown, MD, USA) and following the manufacturer’s protocol. We focused on the mitochondrial genes cytochrome b (cytb) and nicotinamide dehydrogenase 2 (ND2), and the nuclear recombination-activating gene 1 (RAG-1). Amplification and sequencing of cytb was done using the primer pairs L14990–H16065 and L5143–H6313 for cytb and ND2, respectively, following the protocols described in Bonaccorso et al. [45]. For RAG-1, we used the primers R52–R53 as described by Johansson et al. [46] (Table S1). Gel electrophoresis was run to confirm the amplification success and amplicon length, the products were cleaned using ExoSAP-ITTM (Applied BiosystemsTM, Waltham, MA, USA) and then sequenced at Macrogen (Seoul, South Korea). The sequences were aligned, edited, and trimmed using Geneious [42]. We represented intraspecific relationships from each marker using minimum-spanning haplotype networks using the package pegas [47], as implemented in R v. 3.6.2 [48]. Specifically, each haplotype network was built using a finite site model (i.e., uncorrected or Hamming distance) of DNA sequences and pairwise deletion of missing data. Then, a number of possible links to other haplotypes were proposed and the probability of all parsimonious links was calculated following Templeton et al. [49]. The pegas package was also used to estimate the haplotypic (Hb) and nucleotide diversity (π) for each marker, both considering the entire sample and single islands.

2.4. Phylogenetic Reconstruction and Molecular Dating

2.4.1. Coding Mitogenome Dataset

We followed Stervander et al. [50] and chose to analyze all coding regions (CDS) of the mitochondrial genome partitioned per codon position (dataset “mtCDS”). As there was no appreciable phylogenetic signal between the Galápagos Rail mitogenomes, we arbitrarily selected a single sample, GR5 (CAS ORN 262 catalog number), aligned it using MAFFT in Geneious to the dataset of Stervander et al. [50] and new extant gruiform mitogenomes (for taxa and accession numbers, see Figure 2a), which resulted in a matrix comprising 32 species (22 species within Rallidae, 3 non-rallid species within Ralloidea, and 7 species within Gruoidea) and 11,418 base pairs (bp).
We ran Bayesian Markov Chain Monte Carlo (MCMC) analyses in Beast v. 2.6.3 [51], partitioning per codon position across all mitochondrial genes [50]. Each partition was fitted with a general time-reversible (GTR) model with four gamma categories (Γ) and an estimated proportion of invariant sites (I). We applied a relaxed log-normal clock model, let speciation follow a birth–death prior, constrained Ralloidea as monophyletic, and applied two priors for dating. We based the calibration prior for crown Gruiformes (i.e., the root of the tree) on the fossil data compiled by Claramunt and Cracraft [52], fitting statistical distributions to the oldest fossils records from different parts of the world. However, the recent description of fossil material of Pellornis mikkelseni dating at 54 million years provides new evidence of a Paleocene origin of Gruiformes [53]. We therefore substituted P. mikkelseni for Messelornis cristata as the oldest European crown gruiform, and fitted a lognormal distribution with mean of 0.7, standard deviation of 1.6, and offset of 54.0 MY, using the “Solow method” of the R package cladeage v. 0.1 (https://github.com/evolucionario/cladeage). For Rallidae, we used the fossil data compiled in Stervander et al. [50], setting a prior following a lognormal distribution with a mean of 1.1, standard deviation of 1.8, and offset of 32.6 million years. However, as rightly pointed out by Garcia-R et al. [54], the inclusion of Belgirallus to calibrate crown Rallidae may not be correct, as this taxon may rather be representative of a stem rallid species [55]. We therefore primarily applied this prior to date the stem Rallidae (i.e., parental node of Rallidae, being the Ralloidea node, the most recent common ancestor (MRCA) of Rallidae, Heliornithidae, and Sarothruridae) and, secondarily, replicated the analyses applying this prior to the crown Rallidae (i.e., the MRCA of extant Rallidae species). The rate scaler operators for A–C and C–T substitutions were modified (weight increased from 0.1 to 0.3) for improved performance.
We ran three replicates of each analysis for 75 × 106 generations, sampled every 5 × 10³ generations, and discarded the first 10% as burn-in. Stationarity, high effectives sample sizes (ESS > 200), and between-replicate convergence were observed for almost all parameters (with the exception of some transition/transversion rate parameters for the second codon position, with ESS 135–200) in Tracer v1.7 [56], and maximum clade credibility trees with divergence times were obtained with median and mean node heights calculated with TreeAnnotator [57]. Given the overall convergence we used a single tree per analysis (based on runs with ESS > 200 for all parameters), and drew them in R [48] using the packages ape v. 5.3 [58,59] and phytools v. 0.6–99 [60].

2.4.2. One Nuclear and Two Mitochondrial Genes

In order to include more taxa, particularly focusing on the “American black rail clade” sensu Stervander et al. [50], we created a dataset “2mt1nc” based on the two mitochondrial genes cytb (1068 bp) and cytochrome oxidase subunit I (COI; 747 bp), and the nuclear gene 1 RAG-1 (930 bp). This dataset comprised 106 gruiform species with a varying degree of missing data. We followed the substitution model evaluation and partitioning by Stervander et al. [50], setting up Beast analyses partitioned by marker, with the substitution model HKY+Γ+I for cytb and COI, and K80+Γ+I for RAG-1. Priors for the clock model, speciation model, and calibrations followed those for the mtCDS dataset, as did the operator modifications and run specifications, although the number of generations was 100 × 106.

3. Results

3.1. Mitogenome Assembly and Diversity

Sequencing produced an average of 4.64 × 10⁷ (4.44–4.99 × 10⁷) reads per individual, with an average per sample length of 58–76 bp due to DNA fragmentation (Table S2). The complete circularized GR9 reference de novo assembly produced by MitoZ was 17,045 bp long, with an average read depth of 61× and a GC content of 42.4%. It contained 13 protein-coding genes, two rRNAs, 22 tRNAs, and a 1526-bp-long control region (Figure S1). For the four remaining samples, the average number of reads per sample that mapped to the GR9 reference assembly was 81.9–345.7 (Table S2). Two additional samples, GR5 and GR8 (with catalog number CAS ORN 270 and 262, respectively), produced complete mitochondrial assemblies, whereas another two samples, GR2 and GR7 (with catalog number CAS ORN 259 and 268, respectively), contained ≤0.1% missing data.
The five mitogenomes contained 27 variants, comprising 23 single nucleotide polymorphisms (SNPs) and 4 insertion/deletion (indel) polymorphisms, distributed in protein-coding genes (15), control region (11), and 16S rRNA (1; Table S3). Out of the 15 SNPs in the protein-coding genes, 4 were in codon position 1 and 11 in codon position 3, with 12 being synonymous mutations and 3 non-synonymous (Table S3). All variants were restricted to single samples, with two exceptions: a synonymous SNP in COIII grouped GR7 and GR9 versus the three remaining samples, whereas an indel in the control region grouped GR9 and GR5 (reference haplotype), GR2 and GR8 (1 bp insertion), and GR7 (2 bp insertion; Table S3). Finally, there was mononucleotide length variation in the beginning of the 16S rRNA, which was ambiguous and unresolved due to low mapping success/coverage.

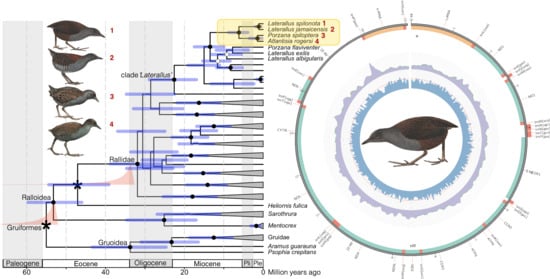
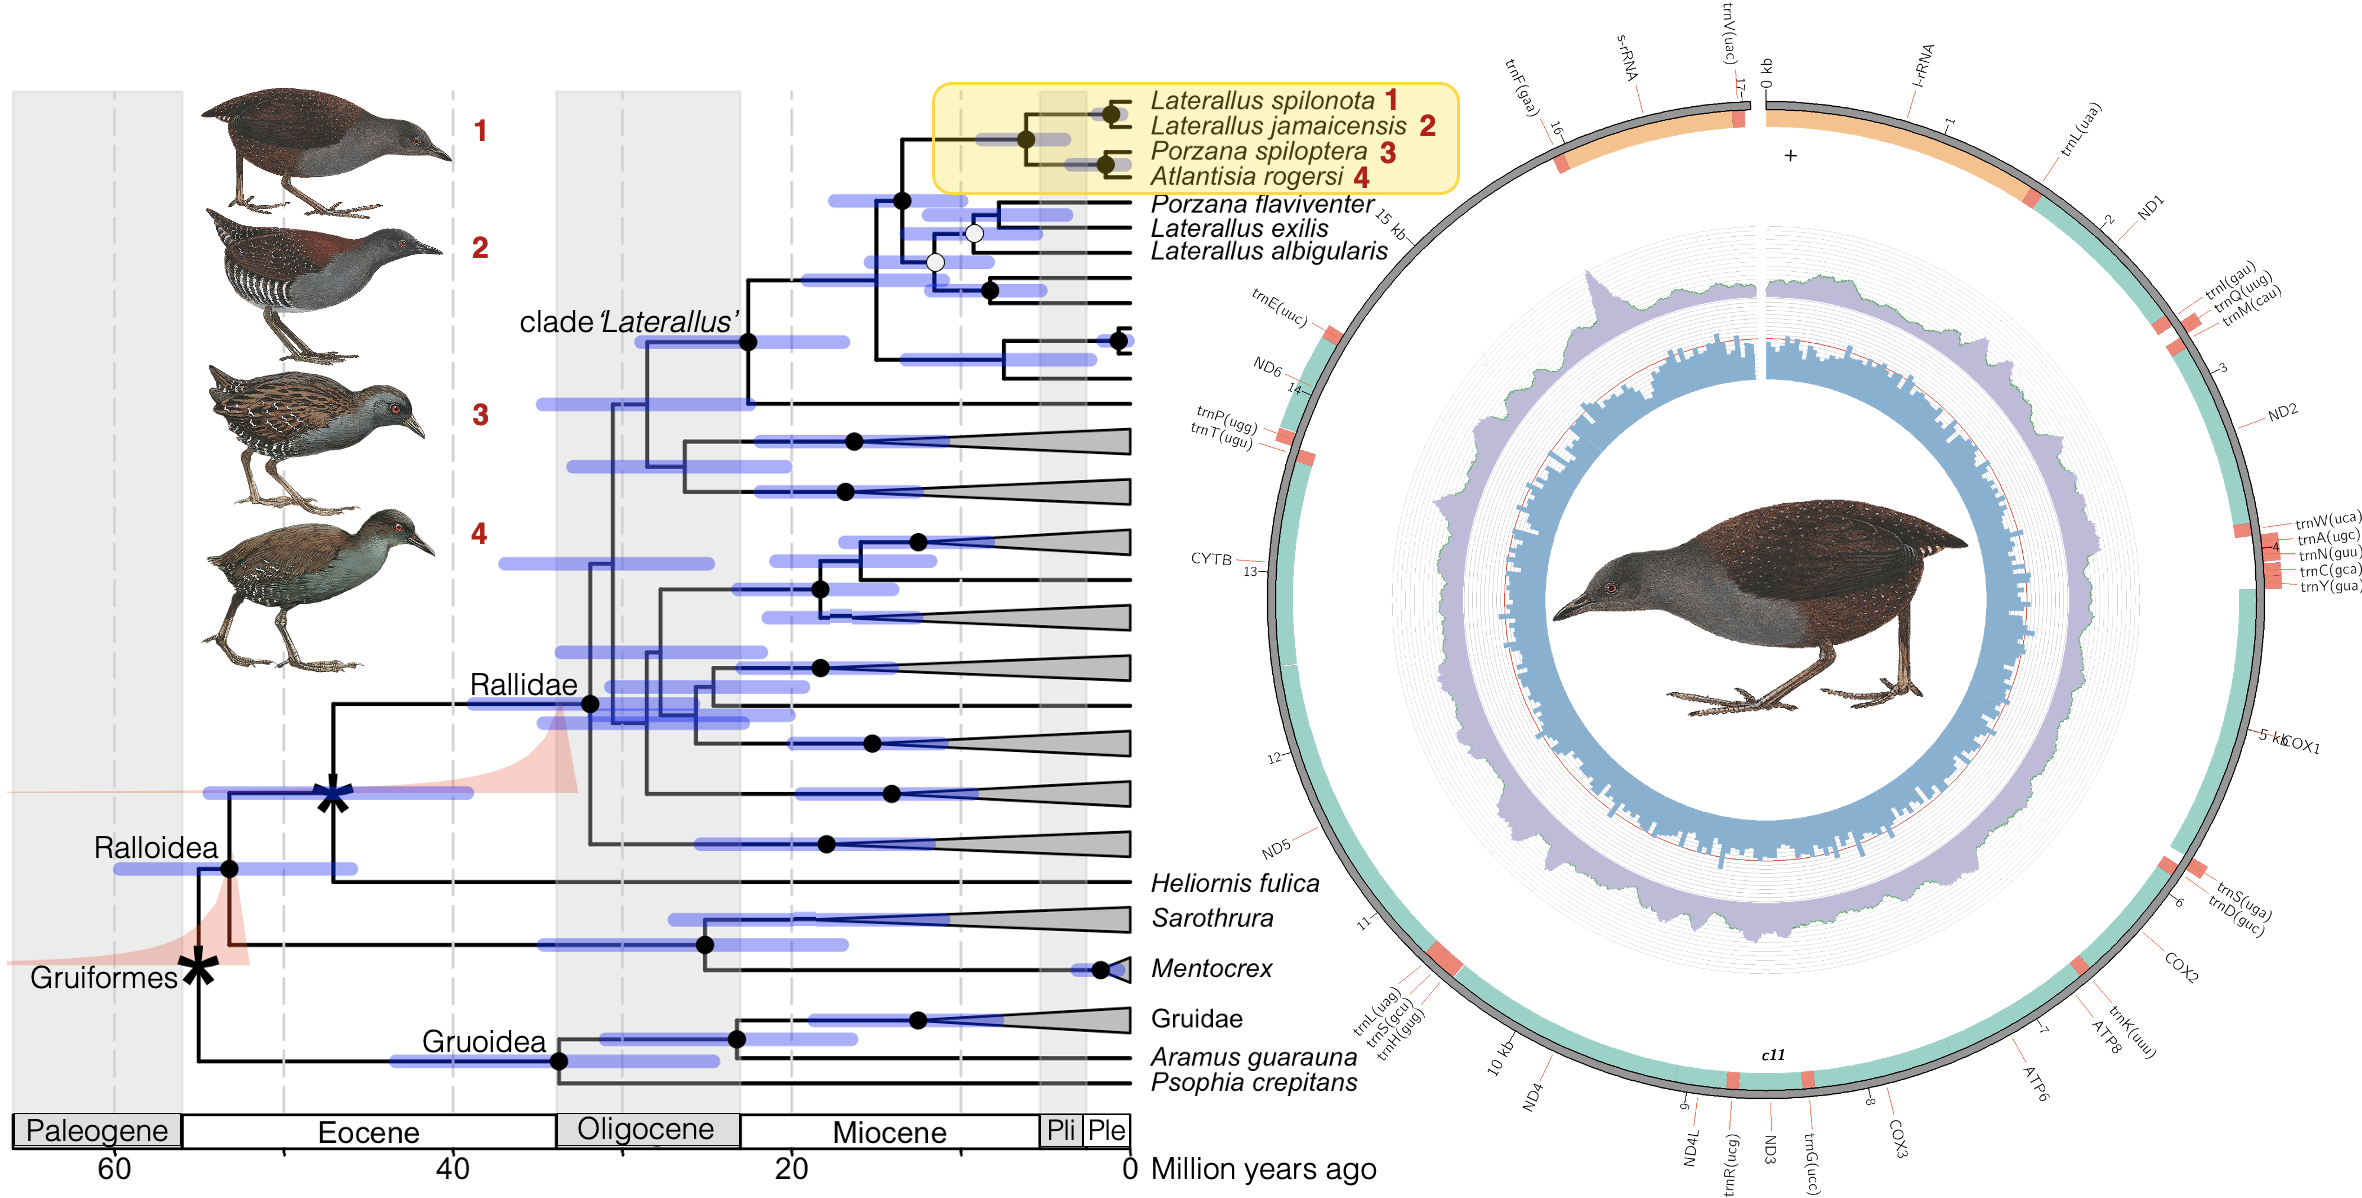
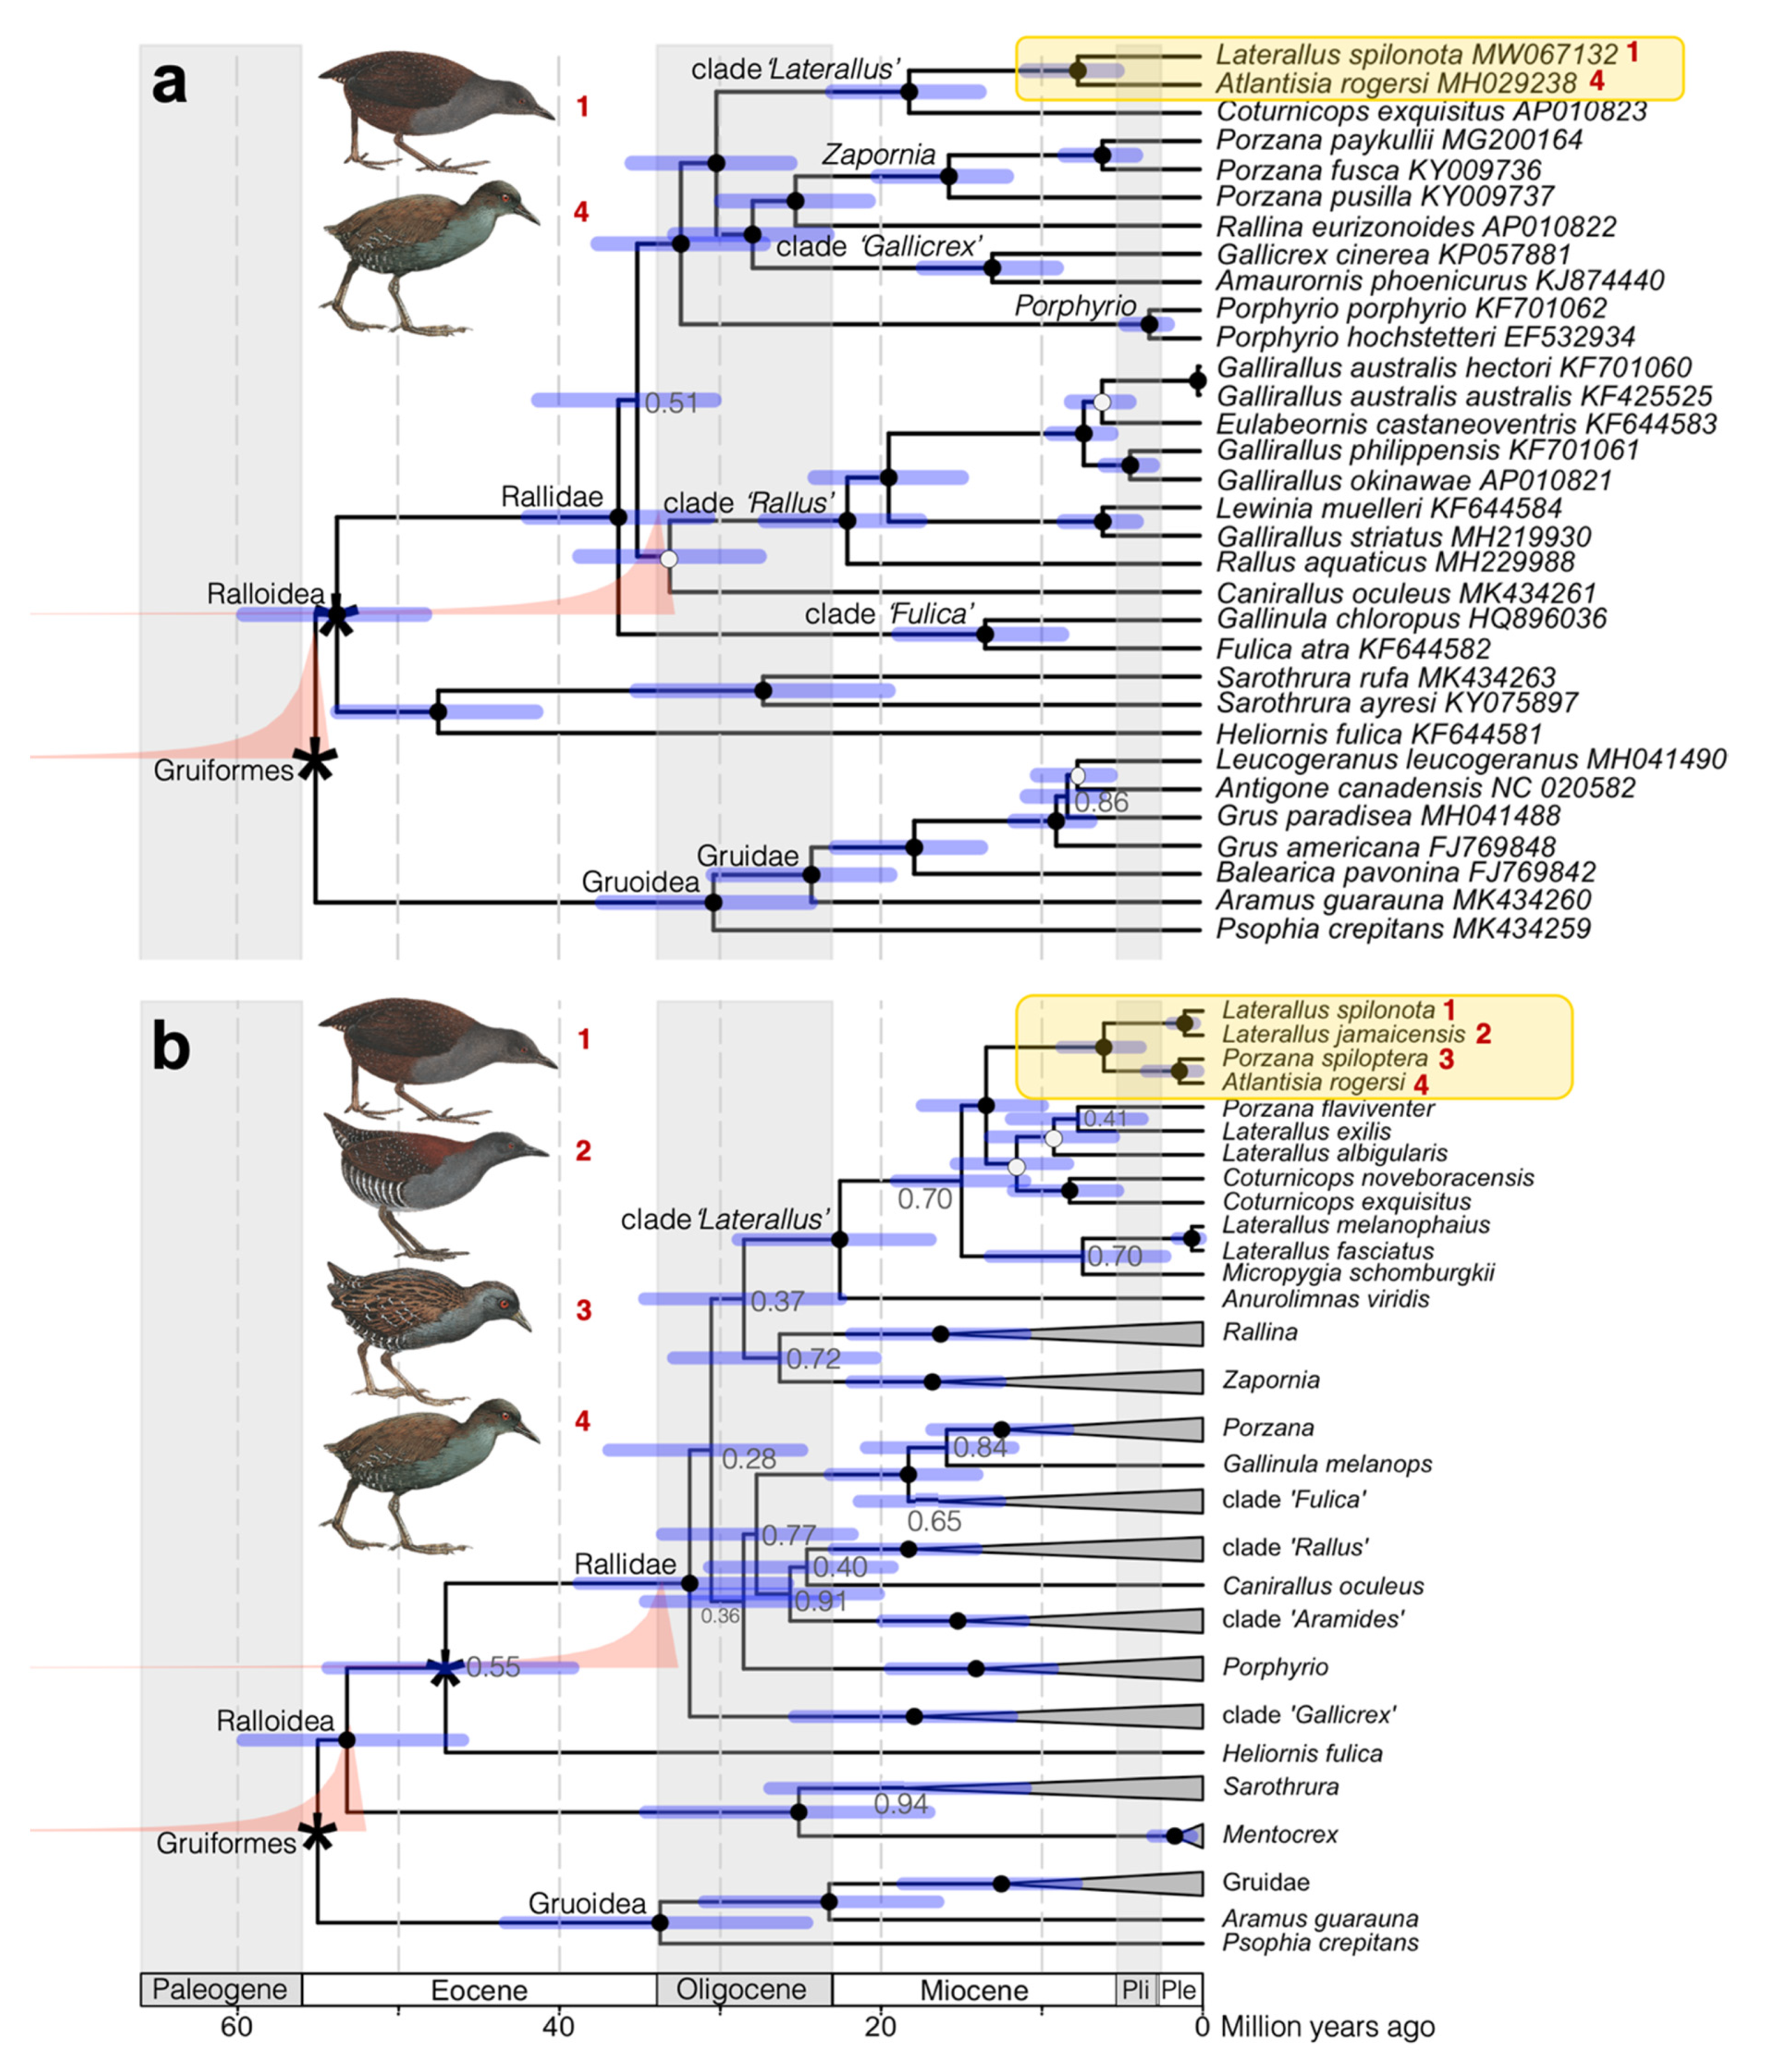
3.2. Phylogenetic Reconstruction and Molecular Dating

There was overall convergence between the replicate analyses, with no appreciable differences in estimated node ages (see Data Accessibility). Between-replicate differences were restricted to transition/transversion rate parameters for the second codon position of the mtCDS dataset, and the tree likelihood of COI vs. cytb for the 2mt1nc dataset, affecting total likelihood and posterior probability only through the varying placement of clade “Fulica”, which was not pertinent to our objectives (Figure 2; Data Accessibility).
The mitogenome-based phylogeny (mtCDS dataset) recovered the Galápagos Rail as a sister to the Inaccessible Island Rail Laterallus (Atlantisia) rogersi with the posterior probability (PP) = 1.0 (Figure 2a). The multilocus phylogeny 2mt1nc, which comprised more taxa but fewer base pairs, recovered the Galápagos Rail as sister to the Black Rail L. jamaicensis, the common ancestor of which was the sister of another sister species pair comprising the Inaccessible Island Rail and the Dot-winged Crake L. (Porzana) spiloptera (Figure 2b). All nodes received full support with PP = 1.0, and the estimated median age of the MRCA of the Galápagos Rail and the Black Rail was 1.1–1.2 million years (MA; 95% highest posterior densities (HPDs), 0.5–2.1 MA), irrespective of whether the Rallidae prior was applied to the stem or crown (Table 1). The MRCA of all four species was estimated at a median age of 6.2 (stem) or 6.7 MA (crown; for 95% HPDs, see Table 1), about one million years later than estimated from the mtCDS dataset (Table 1).
Overall, for both datasets, the placement of the Rallidae prior on the stem or crown had a small impact (≤9%) on the dating of both the younger and older nodes, including the MRCA of Rallidae (median age 31.9–36.1 MA; Table 1).

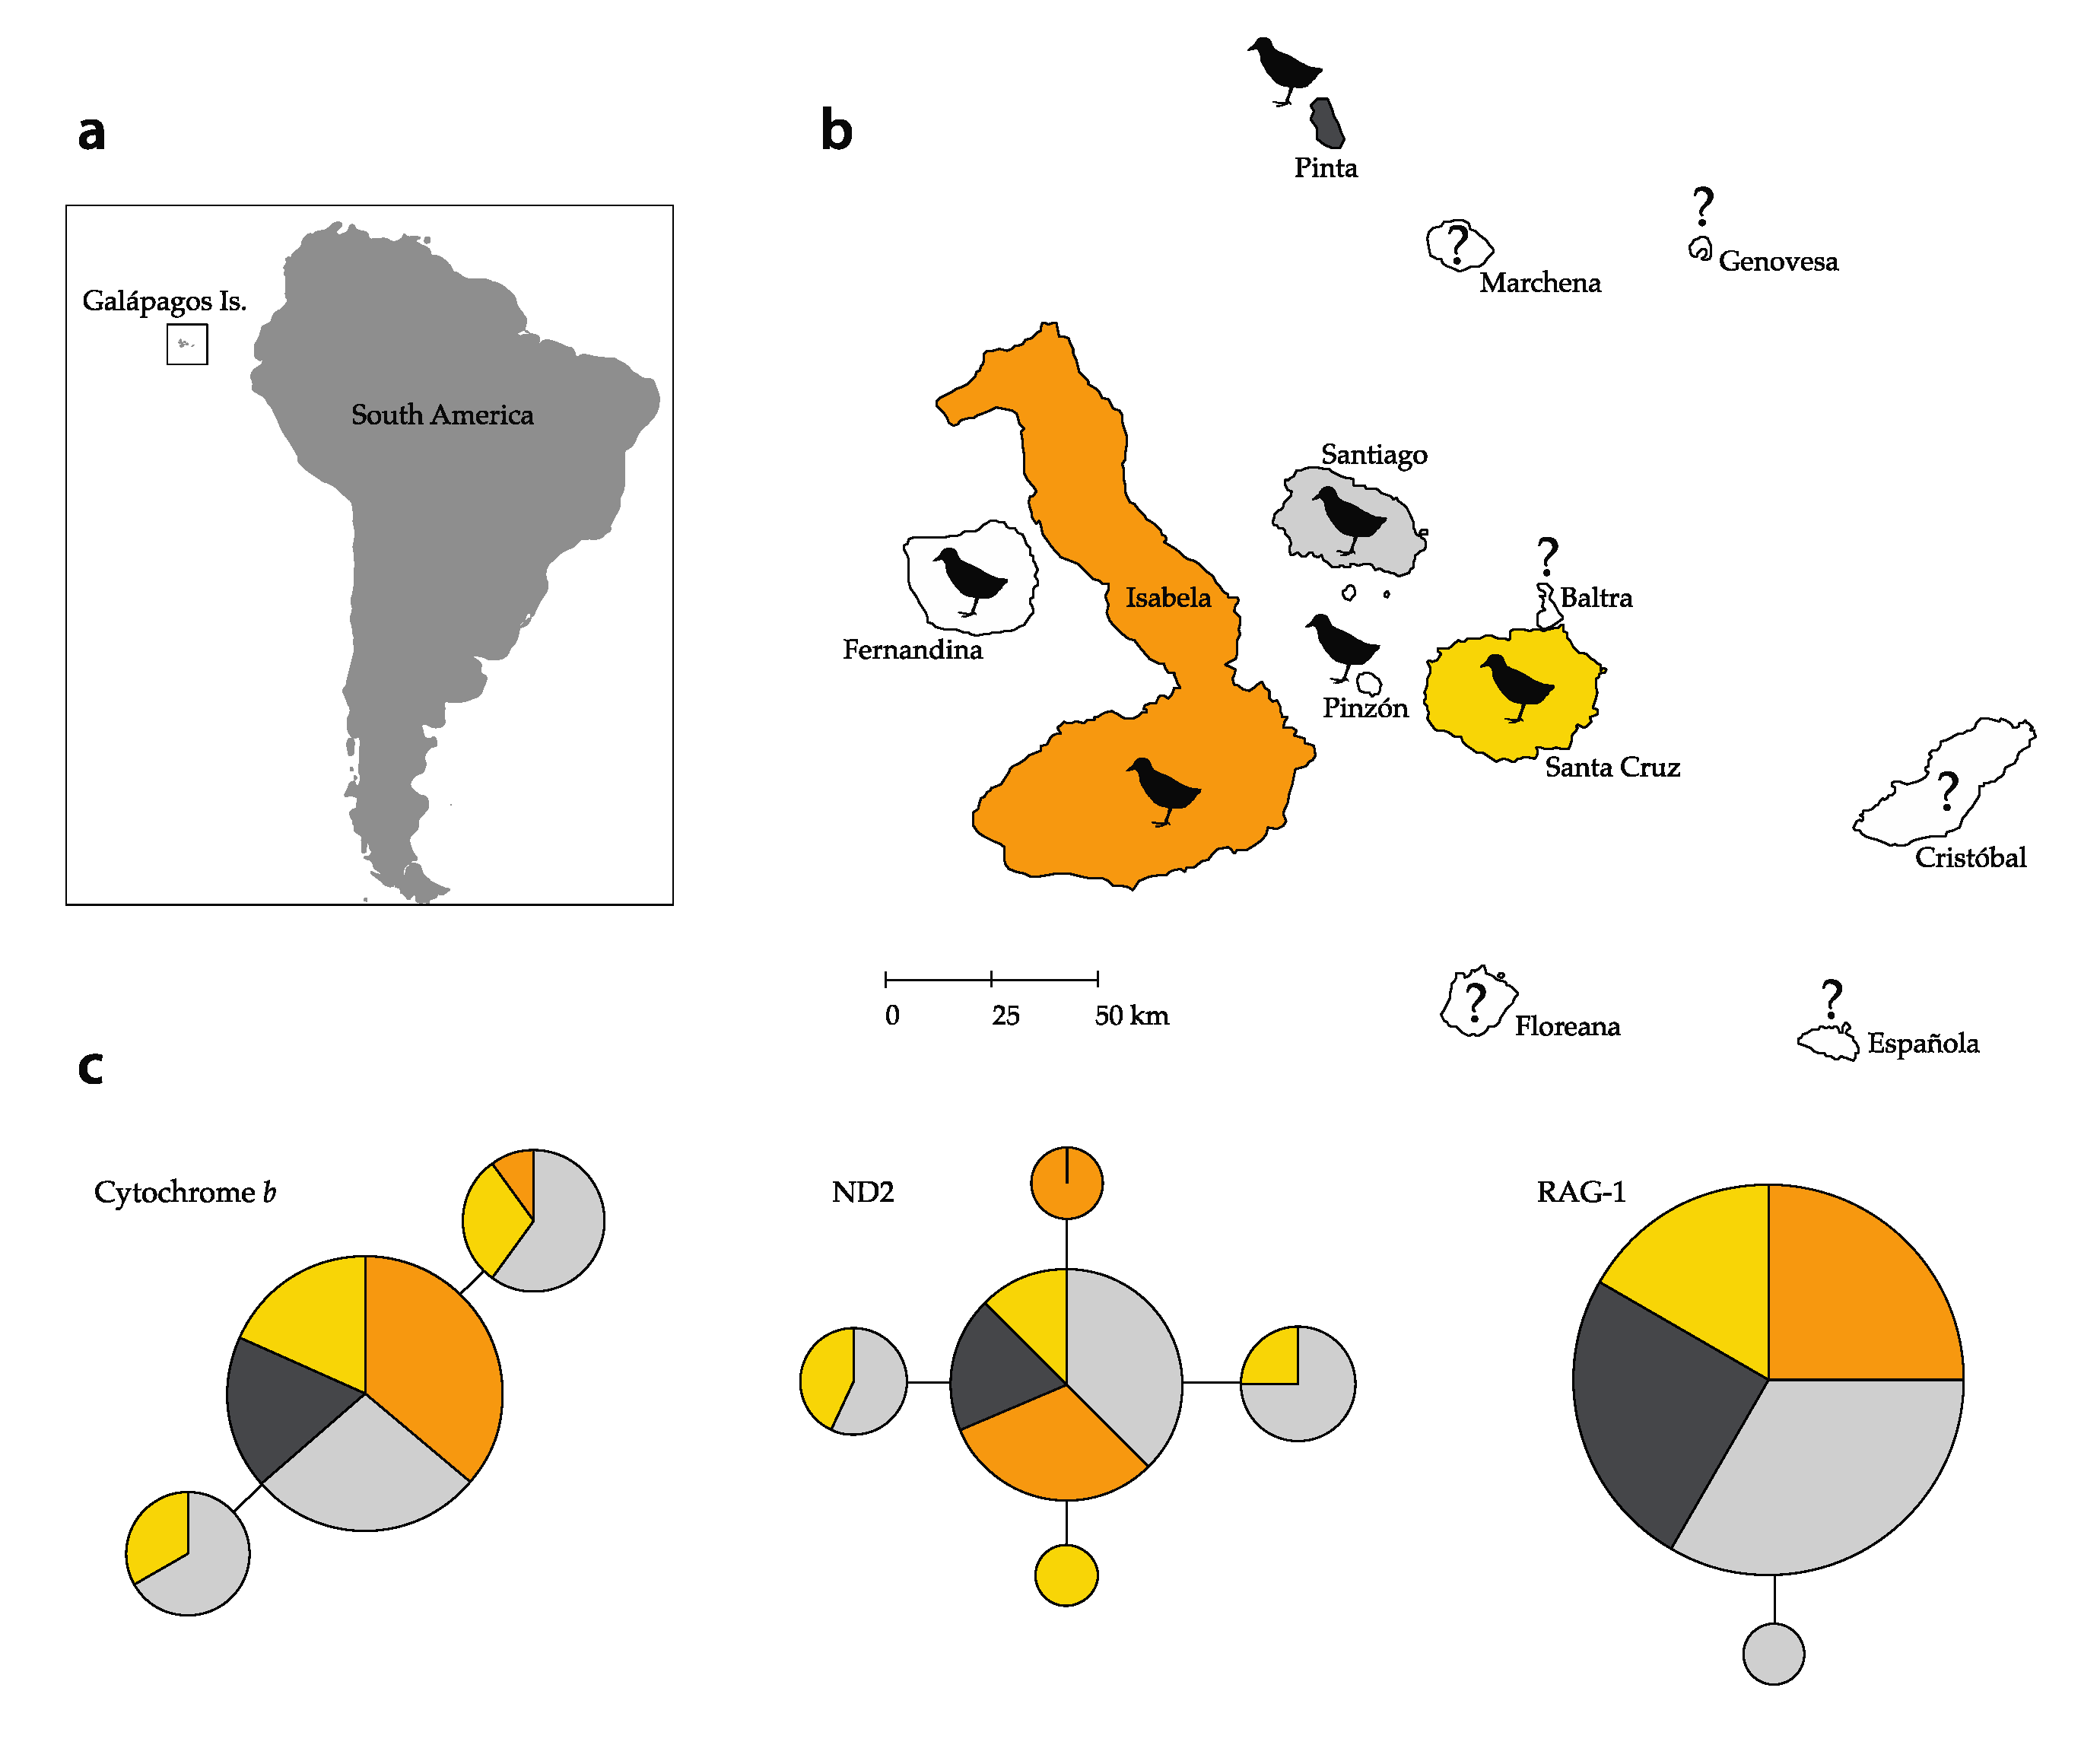
3.3. Intraspecific Genetic Diversity

We obtained 59 sequences for cytb (720 bp), 51 sequences for ND2 (969 bp), and 58 sequences for RAG-1 (302 bp). Overall genetic diversity (Hb) values were 0.439 for cytb, 0.580 for ND2, and 0.034 for RAG-1. We report an overall nucleotide diversity (π) of 0.0006 for cytb, 0.0007 for ND2, and 0.0001 for RAG-1. Values for each island for both Hb and π are reported in Table 2, with Santa Cruz possessing the highest values for both Hb (0.791) and π for ND2 compared to the other islands and markers. Similarly, Santa Cruz and Santiago presented the highest values for both genetic metrics for cytb. Pinta was the island that hosted populations with the lowest values for all markers. RAG-1, being a nuclear marker, presented the lowest values across the islands. Likewise, the haplotype networks demonstrated high levels of haplotype sharing among islands with shallow differences between haplotypes across the markers (Figure 1c). We recovered three haplotypes for cytb (maximum distance between haplotypes 2 bp) shared across the islands; five haplotypes for ND2 (maximum distance 2 bp), of which one was private to Isabela and one to Santa Cruz; and two haplotypes for RAG-1 (1 bp difference), one of which was private to Santiago and occurred in a single bird. Cytb haplotype I (LS02_Cytb) presented the highest frequency (n = 43) and was found on all four islands, followed by haplotype II (LS07_Cytb; n = 9) found on Santiago, Santa Cruz, and Isabela, and haplotype III (LS06_Cytb; n = 7) found on Santiago and Santa Cruz. ND2 haplotype I (LS05_ND2) had the highest frequency (n = 32) and was found on all four islands; haplotype II (LS06_ND2; n = 7) only on Santiago and Santa Cruz; haplotype III (LS21_ND2; n = 5) only on Isabela; haplotype IV (LS03_ND2; n = 4) on Santiago and Santa Cruz; and haplotype V (LS07_ND2; n = 3) only on Santa Cruz. RAG-1 haplotype I (LS02_RAG1) presented the highest frequency (n = 57) and was found on all four islands, whereas haplotype II (LS58_RAG1) was found in only one individual on Santiago (n = 1).

4. Discussion

We found that the endemic Galápagos Rail forms a monophyletic group indicative of a single colonization event to the Galápagos Islands around 1.2 million years ago (Mya). Differences depending on whether the Belgirallus fossil was considered a crown or stem rallid for the calibration of the dated tree were negligible (Table 1), an overall pattern contrasting the findings of García-R et al. [54]. In comparison with other Galápagos land-bird colonizers, rails coincide with the estimated arrival of Darwin’s finches (1.5–1.0 Mya [61,62]) and flycatchers (genus Pyrocephalus: 1 Mya [63]; Myiarchus: 0.85 Mya [64]). This also suggests that ancestors of the Galápagos Rail arrived to the older islands first, most likely Cristóbal and Santa Cruz (maximum emergence age ~4.0 and 2.3 MA, respectively [65]), moving west and colonizing new islands as these were formed by volcanic activity (maximum emergence age Isabela ~0.8 MA and Fernandina ~0.06 MA [65]; Figure 1b). Interestingly, speciation events have been idiosyncratic and variable in groups of the same time of origin. Finches have diversified into over 18 species [61] and Pyrocephalus flycatchers into two [63] compared to a single taxon in the case of the Galápagos Flycatcher Myiarchus magnirostris and Galápagos Rail. This phenomenon could be explained by an intrinsic evolvability in some groups compared to others, as explained by Chaves et al. [66] for Darwin’s finches and Hawaiian honeycreepers compared to other insular taxa of the same age and sympatric to the same island systems.
Our phylogenetic reconstruction places the Galápagos Rail as sister to the Black Rail, confirming the conjecture of Leck [67]. Our findings also confirm the taxonomic placement for both Laterallus species, together with the Inaccessible Island Rail and Dot-winged Crake, within a clade defined as the “American black rails”, characterized by striking similarities in plumage coloration (see illustrations in Figure 2b) [21,50,68]. Following island biogeographic theory [69], we assume tighter sister relationships of species with geographically close distributions. In the case of the Galápagos avifauna, there are several examples of sister relationships between land-bird species on the islands and continental species (Central America: Galápagos Yellow Warbler Setophaga petechia aureola [66]; North America: Galápagos Hawk Buteo galapagoensis [70]; North/Central America: Galápagos Flycatcher [64]; South/North America: Pyrocephalus flycatchers [63]; and Caribbean forms (Darwin’s finches [71], Galápagos mockingbirds genus: Mimus [11]). The Black Rail presents a patchy distribution with resident subspecies populations on both the east (L. j. jamaicensis) and west (L. j. coturniculus) coast of North America (mainly U.S.), the Caribbean and Central America, with non-breeding (migrant) populations wintering in the Gulf of Mexico and the Caribbean (L. j. jamaicensis) [72]. Another group of subspecies is distributed along the Pacific coast of Perú (L. j. murivagans) and Chile (L. j. salinasi), and up to high elevation marshes around Lago Junín (L. j. tuerosi) at a 4,200 m elevation in the central Andes of Perú [73,74]. It is likely that this species consists of several phylogenetically distinct lineages given the large, geographically disjunct distribution and differentiated migratory behavior. Indeed, L. j. tuerosi has been suggested to represent a distinct species [68,75]. Leck’s suggestion for the origin of the Galápagos Rail as derived from former migrants of North American Black Rail populations (L. j. jamaicensis) needs further exploration by including the phylogenetic affinities between all Black Rail populations to pinpoint a possible origin of the Galápagos Rail. If proven right, it would not be the first group of migratory birds to have reached the Galápagos Islands to become a resident (and endemic) species of the archipelago (e.g., Pyrocephalus flycatchers and the Galápagos Yellow Warbler—currently endemic subspecies).
The little genetic differentiation recovered from rail populations between islands is nevertheless surprising, particularly given the natural history of the species and time since colonization. Most insular rails are endemic to one island (or set of islands), suggesting a limited vagility after arrival [50,76,77]. Contrary to these patterns, our haplotype reconstruction suggests high degrees of connectivity between islands. The absence of genetic structure in the three markers could be attributed to frequent movements among the islands that are on average 25 km apart, with the largest distance to Pinta, 75–90 km from the neighboring islands, containing rail populations. These results were contrary to our prediction that Galápagos Rails should show higher levels of genetic structure not only based on its limited dispersal ability, but also given its habitat specialization. Rails are restricted to patchy marshes and meadows in the highlands and thus potentially support smaller local population sizes. It is important to mention that, in the past, rails have been seen foraging near the coast in mangrove habitats [21], thus increasing the chances to access open water. It is possible then that rails perform seasonal (or random) elevational migrations toward the coast and thus increase the chance for between-island connectivity, as shown by the sharing of haplotypes. A degree of swimming capacity has been reported for this species [78], which could be relevant for movements between islands, but alternative means of dispersal (i.e., rafting and nocturnal flights) remain speculative. Finally, it is worth noting that we have measured genetic diversity using two mitochondrial markers and one nuclear sequence marker, which provide limited insight. It is desirable to further evaluate contemporary population structure with genomic methods that could capture both neutral and potentially adaptive nuclear variation [15].
Thee low levels of genetic diversity reported in Galápagos Rails could be indicative of the negative effects of past population bottlenecks. Galápagos Rails have suffered dramatically from the introduction of invasive species, either directly or indirectly. Goats were introduced after the first human settlements on the islands, with the largest impact in the 1960s and 1970s when they stripped bare large expanses of native highland habitat by grazing, crucial for the presence of Galápagos Rails and other endemic fauna (e.g., giant tortoises). This ecological erosion, combined with the presence of rats and cats, probably extirpated populations on Floreana, Baltra, Cristóbal, and Pinta islands [21,78,79], and most likely dramatically reduced the populations numbers on the surviving islands, as our homogenous genetic data indicates. After aggressive goat eradication and pest control programs were put in place, many of these islands became goat free (currently Isabela, Pinta, and Santiago). However, not all islands suffered the impact of mammal introduction to the same extent. Varying levels of genetic diversity could be the result of such idiosyncratic historical events shaping rail demography on each island separately. For instance, the Pinta population showed the lowest mitochondrial genetic diversity compared to the others. This island was reported to be practically rail free after the introduction of goats [80], with a swift recovery only a few years after the start of eradication programs in late 1971 [78]. To date, rails are commonly found in high numbers, thriving in the now restored habitat. These past events could have left a genetic signature in present-day individuals, which are descended from a small number of survivors that represent only a portion of the ancestral gene pool. Alternatively, a complete extirpation on Pinta, followed by a recolonization event from neighboring islands (founder effect), could also result in this pattern. The lack of private haplotypes on Pinta and the sharing of common haplotypes across islands supports the notion of high connectivity following island bottlenecks (or local extinction) and possible dynamic across-island recolonization events.
Natural history collections have served as a source of invaluable material to explore changes in declining, extinct, or inaccessible taxa. Here, we relied on historical samples collected by the California Academy of Sciences in 1905–1906 to evaluate, for the first time, the phylogenetic reconstruction of the endemic Galápagos Rail. The combination of historical and modern samples allowed us to put forward a glimpse of the genetic history for this species and explore critical aspects of its evolutionary history. Unfortunately, several islands lost their rail populations in the last few decades (Floreana, Cristóbal, and Baltra) and the magnitude of loss in genetic variation could be remarkable. Museum specimens collected prior to this ecological collapse (including those from islands where the species is now extinct) could be used to assess the magnitude of the effect of invasive species on endemic Galápagos species. Genetic data produced from both present and historical samples has the potential to guide in situ management plans as well as translocations and reintroductions to islands with extirpated populations. The overall vulnerability of the Galápagos Rail is mirrored by the precarious conservation status of most insular rails around the world. Since the behavior of the Galápagos Rail makes it easily overlooked, it is one of the least studied land-bird species on the Galápagos and its decline and extinction could therefore go unnoticed. We recommend that the genetic information we provide here be incorporated in future recovery and reintroduction programs of the Galápagos National Park, which would directly benefit this endemic species and promote conservation efforts for other flightless rails.

Supplementary Materials

The following material is available online at https://0-www-mdpi-com.brum.beds.ac.uk/1424-2818/12/11/425/s1, Figure S1: Graphic representation of mitochondrial genome assembly, Table S1: Primer information, Table S2: Sequencing characteristics of mitochondrial genome, Table S3: Mitogenome sequence variation among museum samples, Table S4: Sequence information for cytb, ND2, and RAG-1.

Author Contributions

Conceptualization, J.A.C.; methodology, J.A.C., E.A.D., S.E.-U., A.C.B. and M.S.; validation, J.A.C., P.J.M.-T., S.E.-U., J.G.-L., A.C.B., E.A.D. and M.S.; formal analysis, J.A.C., P.J.M.-T., S.E.-U., A.C.B. and M.S.; investigation, J.A.C., P.J.M.-T., S.E.-U., J.G.-L., A.C.B., E.A.D. and M.S.; resources, J.A.C., S.E.-U., A.C.B. and M.S.; data curation, J.A.C., A.C.B. and M.S.; writing—original draft preparation, J.A.C.; writing—review and editing, J.A.C., P.J.M.-T., S.E.-U., J.G.-L., A.C.B., E.A.D. and M.S.; visualization, J.A.C. and M.S.; supervision, J.A.C.; project administration, J.A.C.; funding acquisition, J.A.C. All authors have read and agreed to the published version of the manuscript.

Funding

This research was funded by Universidad San Francisco de Quito and COCIBA Grant during field and laboratory exploration (J.A.C.). The project received support from the European Union’s Horizon 2020 research and innovation programme under the Marie Skłodowska-Curie grant agreement no. 893225 (M.S.) and the NSF Graduate Research Fellowship Program (A.C.B.).

Acknowledgments

The authors want to thank the Department of Ornithology and Mammalogy, California Academy of Sciences (CAS) and its Senior Collections Manager Maureen Flannery for granting us access to historical samples from Galápagos collected during the 1905–1906 expedition. To Matthew James for bringing to life the incredible story of the CAS expedition to the Galápagos and being a source of inspiration for this work. To Gabriela Gavilanez and Nathalia Valencia at the Laboratorio de Biología Evolutiva-USFQ. Special thanks to Dario F. Cueva for an invaluable contribution towards data management. Permits to access genetic material in Galápagos were granted by the Ministerio del Ambiente (MAE-DNB-CM-2016-0041) and Parque Nacional Galápagos (PC-63-18). Robert Wayne at UCLA provided critical support during ancient DNA extraction and sequencing. John Postlethwait at the University of Oregon generously contributed computing power for the phylogenetic analyses. Three anonymous reviewers gave valuable comments on an earlier version of this manuscript.

Conflicts of Interest

The authors declare no conflict of interest.

Data Accessibility

The new Galápagos Rail sequences (cytb and ND2 haplotypes, RAG-1 alleles) have been deposited at GenBank with accession numbers MW074873–MW074882 and the mitochondrial reference genome with accession number MW067132. The input and output files from all the phylogenetic analyses have been deposited at Zenodo: https://0-doi-org.brum.beds.ac.uk/10.5281/zenodo.4244354.

References

  1. Darwin, C. Journal of Researches into the Natural History and Geology of the Countries Visited During the Voyage of the H.M.S. Beagle around the World; D. Appleton: New York, NY, USA, 1896. [Google Scholar]
  2. Gillespie, R. Community assembly through adaptive radiation in Hawaiian spiders. Science 2004, 303, 356–359. [Google Scholar] [CrossRef] [PubMed] [Green Version]
  3. Grant, P.R.; Grant, B.R. How and Why Species Multiply: The Radiation of Darwin’s Finches; Princeton University Press: Princeton, NJ, USA, 2011; ISBN 0-691-14999-2. [Google Scholar]
  4. Losos, J.B.; Ricklefs, R.E. Adaptation and diversification on islands. Nature 2009, 457, 830–836. [Google Scholar] [CrossRef] [PubMed]
  5. Mayr, E.; Vaurie, C. Evolution in the family Dicruridae (birds). Evolution 1948, 2, 238–265. [Google Scholar] [CrossRef] [PubMed]
  6. Wallace, A.R. On the physical geography of the Malay Archipelago. J. R. Geogr. Soc. Lond. 1863, 33, 217–234. [Google Scholar] [CrossRef]
  7. Parent, C.E.; Caccone, A.; Petren, K. Colonization and diversification of Galápagos terrestrial fauna: A phylogenetic and biogeographical synthesis. Philos. Trans. R. Soc. B Biol. Sci. 2008, 363, 3347–3361. [Google Scholar] [CrossRef] [Green Version]
  8. Shaw, K.L.; Gillespie, R.G. Comparative phylogeography of oceanic archipelagos: Hotspots for inferences of evolutionary process. Proc Natl. Acad. Sci. USA 2016, 113, 7986–7993. [Google Scholar] [CrossRef] [Green Version]
  9. Poulakakis, N.; Miller, J.M.; Jensen, E.L.; Beheregaray, L.B.; Russello, M.A.; Glaberman, S.; Boore, J.; Caccone, A. Colonization history of Galapagos giant tortoises: Insights from mitogenomes support the progression rule. J. Zool. Syst. Evol. Res. 2020, 58, 1262–1275. [Google Scholar] [CrossRef]
  10. Lack, D. Darwin’s Finches; Cambridge University Press Archive: Cambridge, UK, 1983; ISBN 0-521-27242-4. [Google Scholar]
  11. Arbogast, B.S.; Drovetski, S.V.; Curry, R.L.; Boag, P.T.; Seutin, G.; Grant, P.R.; Grant, B.R.; Anderson, D.J. The Origin and Diversification of Galapagos Mockingbirds. Evolution 2006, 60, 370–382. [Google Scholar] [CrossRef]
  12. Miller, J.M.; Quinzin, M.C.; Edwards, D.L.; Eaton, D.A.; Jensen, E.L.; Russello, M.A.; Gibbs, J.P.; Tapia, W.; Rueda, D.; Caccone, A. Genome-wide assessment of diversity and divergence among extant Galapagos giant tortoise species. J. Hered. 2018, 109, 611–619. [Google Scholar] [CrossRef]
  13. Caccone, A.; Gibbs, J.P.; Ketmaier, V.; Suatoni, E.; Powell, J.R. Origin and evolutionary relationships of giant Galápagos tortoises. Proc. Natl. Acad. Sci. USA 1999, 96, 13223–13228. [Google Scholar] [CrossRef] [Green Version]
  14. Sari, E.; Bollmer, J.L. Colonization of Galápagos Birds: Identifying the Closest Relative and Estimating Colonization. In Disease Ecology; Springer: Cham, Switzerland, 2018; pp. 15–43. [Google Scholar]
  15. Funk, W.C.; McKay, J.K.; Hohenlohe, P.A.; Allendorf, F.W. Harnessing genomics for delineating conservation units. Trends Ecol. Evol. 2012, 27, 489–496. [Google Scholar] [CrossRef] [PubMed] [Green Version]
  16. Fraser, D.J.; Bernatchez, L. Adaptive evolutionary conservation: Towards a unified concept for defining conservation units. Mol. Ecol. 2001, 10, 2741–2752. [Google Scholar] [CrossRef] [PubMed]
  17. Cooper, W.E.; Pyron, R.A.; Garland, T., Jr. Island tameness: Living on islands reduces flight initiation distance. Proc. R. Soc. B Biol. Sci. 2014, 281, 20133019. [Google Scholar] [CrossRef] [Green Version]
  18. Olson, S.L. Evolution of the rails of the South Atlantic islands (Aves: Rallidae). Smithson. Contrib. Zool. 1973, 152, 1–53. [Google Scholar] [CrossRef]
  19. Wright, N.A.; Steadman, D.W.; Witt, C.C. Predictable evolution toward flightlessness in volant island birds. Proc. Natl. Acad. Sci. USA 2016, 113, 4765–4770. [Google Scholar] [CrossRef] [PubMed] [Green Version]
  20. Roff, D.A. The evolution of flightlessness: Is history important? Evol. Ecol. 1994, 8, 639–657. [Google Scholar] [CrossRef]
  21. Taylor, B.; van Perlo, B. Rails. A Guide to the Rails, Crakes, Gallinules and Coots of the World; Yale University Press: New Haven, CT, USA, 1998; pp. 1–600. [Google Scholar]
  22. Blackburn, T.M.; Cassey, P.; Duncan, R.P.; Evans, K.L.; Gaston, K.J. Avian extinction and mammalian introductions on oceanic islands. Science 2004, 305, 1955–1958. [Google Scholar] [CrossRef] [Green Version]
  23. Courchamp, F.; Chapuis, J.-L.; Pascal, M. Mammal invaders on islands: Impact, control and control impact. Biol. Rev. 2003, 78, 347–383. [Google Scholar] [CrossRef] [Green Version]
  24. Kirchman, J. Speciation of flightless rails on islands: A DNA-based phylogeny of the typical rails of the Pacific. Auk 2012, 129, 56–69. [Google Scholar] [CrossRef]
  25. Donlan, C.J.; Campbell, K.; Cabrera, W.; Lavoie, C.; Carrion, V.; Cruz, F. Recovery of the Galápagos rail (Laterallus spilonotus) following the removal of invasive mammals. Biol. Conserv. 2007, 138, 520–524. [Google Scholar] [CrossRef]
  26. Steadman, D.W. Extinction and Biogeography of Tropical Pacific Birds; University of Chicago Press: Chicago, IL, USA, 2006. [Google Scholar]
  27. Schofield, E.K. Effects of introduced plants and animals on island vegetation: Examples from the Galapagos Archipelago. Conserv. Biol. 1989, 3, 227–238. [Google Scholar] [CrossRef]
  28. Hamann, O. Vegetation changes over three decades on Santa Fe Island, Galápagos, Ecuador. Nord. J. Bot. 2003, 23, 1–10. [Google Scholar] [CrossRef]
  29. Phillips, R.; Wiedenfeld, D.; Snell, H. Current status of alien vertebrates in the Galápagos Islands: Invasion history, distribution, and potential impacts. Biol. Invasions 2012, 14, 461–480. [Google Scholar] [CrossRef]
  30. Harper, G.A.; Bunbury, N. Invasive rats on tropical islands: Their population biology and impacts on native species. Glob. Ecol. Conserv. 2015, 3, 607–627. [Google Scholar] [CrossRef] [Green Version]
  31. Jiménez-Uzcátegui, G.; Weindenfield, D.; Valle, C.A.; Vargas, H.; Piedrahita, P.; Muñoz-Abril, L.J.; Álava, J.J. Threats and vision for the conservation of Galápagos birds. Open Ornithol. J. 2019, 12, 1–15. [Google Scholar] [CrossRef] [Green Version]
  32. Vargas, H.; Bensted-Smith, R. Past and present ornithology in Galapagos. Bull. L’Institut R. Sci. Nat. Belg. 2000, 70, 47–52. [Google Scholar]
  33. Gibbs, J.P.; Shriver, W.G.; Vargas, H. An assessment of a Galapagos Rail population over thirteen years (1986 to 2000). J. Field Ornithol. 2003, 74, 136–140. [Google Scholar] [CrossRef]
  34. Freile, J.F.; Santander, T.G.; Jiménez-Uzcátegui, G.; Carrasco, L.; Cisneros-Heredia, D.; Guevara, E.A.; Sánchez-Nivicela, M.; Tinoco, B.A. Lista Roja de las Aves del Ecuador continental; Ministerio del Ambiente, Aves y Conservación, Comité Ecuatoriano de Registros Ornitológicos, Universidad del Azuay, Red Aves Ecuador y Universidad San Francisco de Quito: Quito, Ecuador, 2019. [Google Scholar]
  35. Campbell, K.; Donlan, C.J.; Cruz, F.; Carrion, V. Eradication of feral goats Capra hircus from Pinta Island, Galápagos, Ecuador. Oryx 2004, 38, 328–333. [Google Scholar] [CrossRef] [Green Version]
  36. Campbell, K.; Donlan, C.J. Feral goat eradications on islands. Conserv. Biol. 2005, 19, 1362–1374. [Google Scholar] [CrossRef]
  37. Hamann, O. Regeneration of vegetation on Santa Fe and Pinta Islands, Galapagos, after the eradication of goats. Biol. Conserv. 1979, 15, 215–235. [Google Scholar] [CrossRef]
  38. Shriver, W.G.; Gibbs, J.P.; Woltz, H.W.; Schwarz, N.P.; Pepper, M.A. Galápagos Rail Laterallus spilonotus population change associated with habitat invasion by the Red-barked Quinine Tree Cinchona Pubescens. Bird Conserv. Int. 2011, 21, 221–227. [Google Scholar] [CrossRef] [Green Version]
  39. Wiedenfeld, D.A.; Jiménez-Uzcátegui, G.A. Critical problems for bird conservation in the Galápagos Islands. Cotinga 2008, 29, 22–27. [Google Scholar]
  40. Depino, E.A.; Areta, J.I. V-Netting with playback: An active cost-effective method for trapping small rails. Ardeola 2019, 67, 145–156. [Google Scholar] [CrossRef]
  41. Ewels, P.; Magnusson, M.; Lundin, S.; Käller, M. MultiQC: Summarize analysis results for multiple tools and samples in a single report. Bioinformatics 2016, 32, 3047–3048. [Google Scholar] [CrossRef] [PubMed] [Green Version]
  42. Kearse, M.; Moir, R.; Wilson, A.; Stones-Havas, S.; Cheung, M.; Sturrock, S.; Buxton, S.; Cooper, A.; Markowitz, S.; Duran, C. Geneious Basic: An integrated and extendable desktop software platform for the organization and analysis of sequence data. Bioinformatics 2012, 28, 1647–1649. [Google Scholar] [CrossRef]
  43. Meng, G.; Li, Y.; Yang, C.; Liu, S. MitoZ: A toolkit for animal mitochondrial genome assembly, annotation and visualization. Nucleic Acids Res. 2019, 47, 63. [Google Scholar] [CrossRef]
  44. Mindell, D.P.; Sorenson, M.D.; Dimcheff, D.E. An extra nucleotide is not translated in mitochondrial ND3 of some birds and turtles. Mol. Biol. Evol. 1998, 15, 1568–1571. [Google Scholar] [CrossRef] [Green Version]
  45. Bonaccorso, E.; Peterson, A.T.; Navarro-Sigüenza, A.G.; Fleischer, R.C. Molecular systematics and evolution of the Cyanocorax jays. Mol. Phylogenetics Evol. 2010, 54, 897–909. [Google Scholar] [CrossRef] [Green Version]
  46. Johansson, U.S.; Parsons, T.J.; Irestedt, M.; Ericson, P.G.P. Clades within the higher land birds’, evaluated by nuclear DNA sequences. J. Zool. Syst. Evol. Res. 2001, 39, 37–52. [Google Scholar] [CrossRef] [Green Version]
  47. Paradis, E. pegas: An R package for population genetics with an integrated–modular approach. Bioinformatics 2010, 26, 419–420. [Google Scholar] [CrossRef] [Green Version]
  48. R Core Team R. A Language and Environment for Statistical Computing; R Foundation for Statistical Computing: Vienna, Austria, 2019. [Google Scholar]
  49. Templeton, A.R.; Crandall, K.A.; Sing, C.F. A cladistic analysis of phenotypic associations with haplotypes inferred from restriction endonuclease mapping and DNA sequence data. III. Cladogram Estim. Genet. 1992, 132, 619–633. [Google Scholar]
  50. Stervander, M.; Ryan, P.G.; Melo, M.; Hansson, B. The origin of the world’s smallest flightless bird, the Inaccessible Island Rail Atlantisia rogersi (Aves: Rallidae). Mol. Phylogenetics Evol. 2019, 130, 92–98. [Google Scholar] [CrossRef] [PubMed]
  51. Bouckaert, R.; Vaughan, T.G.; Barido-Sottani, J.; Duchêne, S.; Fourment, M.; Gavryushkina, A.; Heled, J.; Jones, G.; Kühnert, D.; De Maio, N. BEAST 2.5: An advanced software platform for Bayesian evolutionary analysis. PLoS Comput. Biol. 2019, 15, 1006650. [Google Scholar]
  52. Claramunt, S.; Cracraft, J. A new time tree reveals Earth history’s imprint on the evolution of modern birds. Sci. Adv. 2015, 1, 1501005. [Google Scholar] [CrossRef] [PubMed] [Green Version]
  53. Musser, G.; Ksepka, D.T.; Field, D.J. New material of Paleocene-Eocene Pellornis (Aves: Gruiformes) clarifies the pattern and timing of the extant gruiform radiation. Diversity 2019, 11, 102. [Google Scholar] [CrossRef] [Green Version]
  54. García, J.C.; Lemmon, E.M.; Lemmon, A.R.; French, N. Phylogenomic Reconstruction Sheds Light on New Relationships and Timescale of Rails (Aves: Rallidae) Evolution. Diversity 2020, 12, 70. [Google Scholar] [CrossRef] [Green Version]
  55. De Pietri, V.L.; Mayr, G. Reappraisal of early Miocene rails (Aves, Rallidae) from central France: Diversity and character evolution. J. Zool. Syst. Evol. Res. 2014, 52, 312–322. [Google Scholar] [CrossRef]
  56. Rambaut, A.; Drummond, A.J.; Xie, D.; Baele, G.; Suchard, M.A. Posterior summarization in Bayesian phylogenetics using Tracer 1.7. Syst. Biol. 2018, 67, 901–904. [Google Scholar] [CrossRef] [Green Version]
  57. Rambaut, A.; Drummond, A.J. TreeAnnotator v1.7.0. Available online: http://beast.bio.ed.ac.uk (accessed on 1 August 2018).
  58. Paradis, E. Analysis of Phylogenetics and Evolution with R.; Springer Science & Business Media: New York, NY, USA, 2011; ISBN 1-4614-1743-0. [Google Scholar]
  59. Paradis, E.; Claude, J.; Strimmer, K. APE: Analyses of phylogenetics and evolution in R language. Bioinformatics 2004, 20, 289–290. [Google Scholar] [CrossRef] [Green Version]
  60. Revell, L.J. Phytools: An R package for phylogenetic comparative biology (and other things). Methods Ecol. Evol. 2012, 3, 217–223. [Google Scholar] [CrossRef]
  61. Lamichhaney, S.; Berglund, J.; Almén, M.S.; Maqbool, K.; Grabherr, M.; Martinez-Barrio, A.; Promerová, M.; Rubin, C.-J.; Wang, C.; Zamani, N.; et al. Evolution of Darwin’s finches and their beaks revealed by genome sequencing. Nature 2015, 518, 371–375. [Google Scholar] [CrossRef]
  62. Petren, K.; Grant, P.R.; Grant, B.R.; Keller, L.F. Comparative landscape genetics and the adaptive radiation of Darwin’s finches: The role of peripheral isolation. Mol. Ecol. 2005, 14, 2943–2957. [Google Scholar] [CrossRef]
  63. Carmi, O.; Witt, C.C.; Jaramillo, A.; Dumbacher, J.P. Phylogeography of the Vermilion Flycatcher species complex: Multiple speciation events, shifts in migratory behavior, and an apparent extinction of a Galápagos-endemic bird species. Mol. Phylogenetics Evol. 2016, 102, 152–173. [Google Scholar] [CrossRef] [Green Version]
  64. Sari, E.; Parker, P.G. Understanding the colonization history of the Galápagos flycatcher (Myiarchus magnirostris). Mol. Phylogenetics Evol. 2012, 63, 244–254. [Google Scholar] [CrossRef] [PubMed]
  65. Geist, D.J.; Snell, H.; Snell, H.; Goddard, C.; Kurz, M.D. A paleogeographic model of the Galápagos Islands and biogeographical and evolutionary implications. In The Galápagos: A Natural Laboratory for the Earth Sciences; Harpp, K.S., Mittelstaedt, E., d’Ozouville, N., Graham, D.W., Eds.; American Geophysical Union: Washington, DC, USA, 2014; pp. 145–166. [Google Scholar]
  66. Chaves, J.A.; Parker, P.G.; Smith, T.B. Origin and population history of a recent colonizer, the yellow warbler in Galápagos and Cocos Islands. J. Evol. Biol. 2012, 25, 509–521. [Google Scholar] [CrossRef] [PubMed]
  67. Leck, C.F. Establishment of New Population Centers with Changes in Migration Patterns. J. Field Ornithol. 1980, 51, 168–173. [Google Scholar]
  68. Taylor, P.B. Family Rallidae (rails, gallinules and coots). In Handbook of the Birds of the World. Hoatzin to Auks; del Hoyo, J., Elliot, A., Sargata, J., Eds.; Lynx Edicions: Barcelona, Spain, 1996; Volume 3, pp. 108–209. [Google Scholar]
  69. MacArthur, R.H.; Wilson, E.O. The Theory of Island Biogeography; Princeton University Press: Princeton, NJ, USA, 1967. [Google Scholar]
  70. Bollmer, J.L.; Kimball, R.T.; Whiteman, N.K.; Sarasola, J.H.; Parker, P.G. Phylogeography of the Galápagos hawk (Buteo galapagoensis): A recent arrival to the Galápagos Islands. Mol. Phylogenet. Evol. 2006, 39, 237–247. [Google Scholar] [CrossRef] [PubMed]
  71. Sato, A.; O’hUigin, C.; Figueroa, F.; Grant, P.R.; Grant, B.R.; Tichy, H.; Klein, J. Phylogeny of Darwin’s Finches as Revealed by mtDNA Sequences. Proc. Natl. Acad. Sci. USA 1999, 96, 5101–5106. [Google Scholar] [CrossRef] [Green Version]
  72. Girard, P.; Takekawa, J.Y.; Beissinger, S.R. Uncloaking a cryptic, threatened rail with molecular markers: Origins, connectivity and demography of a recently-discovered population. Conserv. Genet. 2010, 11, 2409–2418. [Google Scholar] [CrossRef] [Green Version]
  73. Eddleman, W.R.; Flores, R.E.; Legare, M.L. The Birds of North America; Poole, A., Gills, F., Eds.; Acad. Nat. Sci. Philadelphia and Am. Ornithol. Union: Washington, DC, USA, 1994; No. 123; pp. 1–20. [Google Scholar]
  74. Gill, F.; Donsker, D.; Rasmussen, P. IOC World Bird List (v10.2). Available online: https://0-doi-org.brum.beds.ac.uk/10.14344/IOC.ML.10.2. (accessed on 20 July 2020).
  75. Dinesen, L.; Chamorro, A.; Fjeldså, J.; Aucca, C. Distribution and habitat description of Junín Rail Laterallus tuerosi, Andean Peru. Bird Conserv. Int. 2017, 27, 388. [Google Scholar] [CrossRef] [Green Version]
  76. García–R., J.C.; Gibb, G.C.; Trewick, S.A. Eocene diversification of crown group rails (Aves: Gruiformes: Rallidae). PLoS ONE 2014, 9, e109635. [Google Scholar]
  77. Slikas, B.; Olson, S.L.; Fleischer, R.C. Rapid, independent evolution of flightlessness in four species of Pacific Island rails (Rallidae): An analysis based on mitochondrial sequence data. J. Avian Biol. 2002, 33, 5–14. [Google Scholar] [CrossRef] [Green Version]
  78. Franklin, A.B.; Clark, D.A.; Clark, D.B. Ecology and Behavior of the Galapagos Rail. Wilson Bull. 1979, 91, 202–221. [Google Scholar]
  79. Rosenberg, D. The impact of introduced herbivores on the Galapagos Rail (Laterallus spilonotus). Monogr. Syst. Bot. Mo. Bot. Gard. 1990, 32, 169–178. [Google Scholar]
  80. Kramer, P.; Black, J. Scientific and Conservation Report; Charles Darwin Station: Galapagos, Ecuador, 1970. [Google Scholar]
Figure 1. Map of the Galápagos Islands and the haplotype network of the Galápagos Rail Laterallus spilonota: (a) Geographic location of the Galápagos Islands off the coast of mainland Ecuador (South America); (b) Galápagos Islands with black rails representing the current distribution and question marks corresponding to islands where rails are now extinct or their presence is unknown; (c) haplotype network of the mitochondrial markers cytochrome b (cytb), nicotinamide dehydrogenase 2 (ND2), and the nuclear recombination-activating gene 1 (RAG-1). Each circle represents a different haplotype; the size of the circles is proportional to the number of individuals sharing that particular haplotype, and the color corresponds to the four islands analyzed here. Haplotypes differ from their neighboring haplotype by one nucleotide represented by one branch.
Diversity 12 00425 g001
Figure 2. Dated phylogenies of the family Rallidae showing the origin of the Galápagos Rail Laterallus spilonota based on (a) all coding sequences of mitochondrial genes (dataset mtCDS; GenBank accession numbers stated at tips); and (b) the mitochondrial genes cytochrome b and cytochrome oxidase I, and the coding sequence of the nuclear recombination-activating gene 1 (dataset 2mt1nc; for GenBank accession numbers and taxon selection, see Data Accessibility). The chronograms are based on a relaxed clock model with fossil-based calibrations of stem Rallidae and crown Gruiformes. We also ran alternative analyses in which the Rallidae calibration was applied to the crown node, yielding small differences in the estimated node ages (see Table 1). Nodes that were time-calibrated are indicated with an asterisk, and the prior densities are drawn in salmon. Posterior probabilities (PP) are represented by filled circles (PP = 1.0), open circles (0.950 ≤ PP ≤ 0.995), or stated at nodes if lower. Node are drawn at median ages, with the 95% highest posterior density represented with blue bars. Shading represent geological periods (Paleogene to Oligocene) and epochs of the Neogene period: Miocene, Pliocene (Pli), and Pleistocene (Ple). Every ten million years is indicated with dashed vertical lines. Illustrations reproduced with permission from Lynx Edicions ©.
Diversity 12 00425 g002
Table 1. Estimated ages for the relevant nodes (most recent common ancestors, MRCA) in the phylogenies created from the mtCDS and 2mt1nc sequence datasets, where the calibration density for the age of Rallidae was placed on either the crown or stem of the family. Age estimates are presented for the median and mean age as well as the 95% highest posterior density (HPD).
Node (MRCA)Sequence SetRallidae PriorNode Age Estimates (Million Years)
MedianMean95% HPD
L. spilonota, L. jamaicensis2mt1ncstem1.11.20.5–1.9
crown1.21.30.5–2.1
L. spilonota, L. rogersi2mt1ncstem6.26.33.9–8.8
crown6.76.84.2–9.6
mtCDSstem7.67.75.1–10.8
crown7.47.55.0–10.1
Rallidae2mt1ncstem31.932.125.8–38.8
crown33.534.132.6–37.1
mtCDSstem36.136.330.6–41.7
crown34.935.332.6–37.1
Gruiformes2mt1ncstem55.055.954.0–60.7
crown55.556.654.0–62.5
mtCDSstem54.955.854.0–60.2
crown54.955.554.0–59.0
Table 2. Genetic diversity of the Galápagos Rail Laterallus spilonota based on two mitochondrial markers, cytochrome b (cytb) and nicotinamide dehydrogenase 2 (ND2), and the nuclear recombination-activating gene 1 (RAG-1). The number of individuals sampled (ind.), the number of haplotypes, the number of polymorphic sites, haplotype diversity (Hb), and nucleotide diversity (π) are shown for each of the four islands on which rails were sampled, and across all islands.
IslandInd.HaplotypesPolymorphic SitesHbπ
Santa Cruz14320.626 ± 0.1040.0007 ± 0.0001
Isabela16210.125 ± 0.1060.0001 ± 0.0001
Pinta9100.00 ± 0.000.00 ± 0.00
Santiago21320.626 ± 0.0820.0007 ± 0.0001
Total cytb56320.439 ± 0.0690.0006 ± 0.0001
Santa Cruz14430.791 ± 0.0580.0010 ± 0.0001
Isabela16210.458 ± 0.0950.0004 ± 0.0001
Pinta3100.000 ± 0.0000.0000 ± 0.0000
Santiago13310.500 ± 0.0800.0004 ± 0.0001
Total ND246530.791 ± 0.0580.0006 ± 0.0001
Santa Cruz15100.00 ± 0.000.00 ± 0.00
Isabela15100.00 ± 0.000.00 ± 0.00
Pinta8100.00 ± 0.000.00 ± 0.00
Santiago20210.100 ± 0.0070.0003 ± 0.0002
Total RAG-158210.034 ± 0.0330.0001 ± 0.0001
Publisher’s Note: MDPI stays neutral with regard to jurisdictional claims in published maps and institutional affiliations.

