Article

Cover Crop Diversity as a Tool to Mitigate Vine Decline and Reduce Pathogens in Vineyard Soils

1
Department of Biology, University of British Columbia—Okanagan, 3187 University Way, Kelowna, BC V1V 1V7, Canada
2
Summerland Research and Development Centre, Agriculture and Agri-food Canada, 4200 Highway 97 South, Summerland, BC V0H 1Z0, Canada
3
Department of Pediatrics, University of California San Diego, 9500 Gilman Dr, La Jolla, CA 92093, USA
*
Author to whom correspondence should be addressed.
Submission received: 1 March 2020 / Revised: 26 March 2020 / Accepted: 27 March 2020 / Published: 30 March 2020
(This article belongs to the Special Issue Plant-Soil Interactions)

Abstract

:
Wine grape production is an important economic asset in many nations; however, a significant proportion of vines succumb to grapevine trunk pathogens, reducing yields and causing economic losses. Cover crops, plants that are grown in addition to main crops in order to maintain and enhance soil composition, may also serve as a line of defense against these fungal pathogens by producing volatile root exudates and/or harboring suppressive microbes. We tested whether cover crop diversity reduced disease symptoms and pathogen abundance. In two greenhouse experiments, we inoculated soil with a 106 conidia suspension of Ilyonectria liriodendri, a pathogenic fungus, then conditioned soil with cover crops for several months to investigate changes in pathogen abundance and fungal communities. After removal of cover crops, Chardonnay cuttings were grown in the same soil to assess disease symptoms. When grown alone, white mustard was the only cover crop associated with reductions in necrotic root damage and abundance of Ilyonectria. The suppressive effects of white mustard largely disappeared when paired with other cover crops. In this study, plant identity was more important than diversity when controlling for fungal pathogens in vineyards. This research aligns with other literature describing the suppressive potential of white mustard in vineyards.

1. Introduction

Grapevines (Vitis vinifera L.) are one of the most widely grown crops worldwide and an important economic commodity, especially in British Columbia where vineyards account for a total of 9652 hectares [1]. Grapevines experience multiple challenges, including competition with weeds [2], nutrient leeching [3], root lesion nematodes [4], viral infections [5], and especially fungal diseases [6] that reduce profit for growers. Although historic reports of fungal diseases exist [7], this problem has gained a considerable amount of attention in the 1990s [6] as wine grape production increased in Australia, Canada, the United States, and South Africa, among other countries [8,9,10].
Young vine decline (YVD) is a type of grapevine trunk disease that results in stunted growth, reduced yield, delayed fruiting, root necrosis, and eventually death in young vineyards 5–7 years old [11]. YVD occurs in British Columbia and other major wine grape regions around the world [6,12], resulting in significant economic losses [13]. YVD is considered a disease complex whereby the physical symptoms observed are a result of abiotic and biotic factors. Among many of the biotic stressors is Ilyonectria, a genus of soil-borne fungi and a causal agent of YVD [14]. Moreover, these fungi are generalist pathogens and are known to infect the roots of certain apple and cherry cultivars [15]. Ilyonectria is not only confined to vineyard soil, but also found in nurseries all over the world that often serve as breeding grounds for the pathogen [12,16,17].
In Canada, there are no commercially available fungicides or fumigants for managing young vine decline and other grapevine trunk diseases (GTDs) [18]. Methyl bromide, a once popular soil fumigant, has been phased out due to its toxicity and ozone depletion [19], and has been shown to reduce arbuscular mycorrhizal (AM) fungi and other beneficial organisms [20]. Available fumigants such as 1,3-dichloropropene and chloropicrin do not protect against the full spectrum of fungal pathogens including Phytophthora and Fusarium [21]. In addition, fungicides that are applied directly to plants as a liquid or powder coating can enter soil and accumulate overtime, reducing microbial diversity and activity [22]. Other approaches for controlling grapevine trunk pathogens include hot water treatment, in which propagation material is soaked in hot water (~50 °C) for a specified time [23,24]. This approach carries risks however, as improper procedures can damage propagation material and reduce vigor [25].
Cover cropping is a potential tool to mitigate GTDs in vineyards. Traditionally, cover crops have been grown to reduce soil erosion [26], increase available nitrogen for grapevines [27], control pests [28], and suppress weeds via allelopathy [29]. Growers also use cover crops to decrease vegetative growth in high vigor situations, which reduces canopy cover and improves the microclimates for ripening fruits [30]. Although cover crops have a long history of use in vineyards, their potential to mitigate soil-borne diseases has not been fully explored.
Existing literature highlights the biofumigant effects of brassicaceous crops (mustards/crucifers) that have exhibited suppression of soil-borne pathogens in vineyards and nurseries [31,32]. Other cover crops including forbs, legumes, and grasses may help reduce soil-borne diseases by harboring beneficial and antagonistic microbes [33,34], or via host dilution in which the risk of infection decreases with increasing host diversity [35]. The different mechanisms of suppression though these plants provide an incentive to implement cover crop diversity in vineyards as a management strategy for soil-borne diseases.
A diverse plant community can increase soil microbial diversity [36], biomass [37], and activity [38] via root exudation, rhizodeposition, and plant litter [39,40], which can improve ecosystem services. Soils from long term grasslands and forests contain plant growth-promoting rhizobacteria (PGPR), which can suppress pathogens when added to agricultural soil [41,42]. Implementation of cover crops in vineyards can increase the activity of PGPR [43,44], which are commonly found in soil [45,46]. If beneficial microbes can be isolated from nearby soil and used to reduce disease symptoms in agricultural plots, it is possible that cover crops can provide similar soil inputs and encourage proliferation of microbes that suppress fungal pathogens.
To date, most cover crop experiments use commercial rather than native plants [47,48], and the efficacy of native cover crops has not been studied extensively in vineyards [49,50,51,52]. Plant provenance may be as important as diversity due to local adaptation and coevolution between native plants and their microbial counterparts [53]. This is observed in highly specific legume-rhizobia interactions [54,55] and could hold true for other plant–microbe interactions.
In many “home vs away” studies, plants perform better when grown with soil from the same region as the plant [56,57,58]. Moreover, decomposition rate is increased when a plant litter is sympatric to the soil compared to allopatric soils [59,60]. Since plant–microbe interactions heavily depend on genotypic differences [61] and resource availability [40,62], microbial communities under native plants may differ compared to common cultivar cover crops, leading to differences in ecosystem services and possibly the suppression of pathogens. Given these circumstances, native cover crops may stimulate and harbor local microbial communities through more-efficient interactions based on root exudation, litter decomposition, and chemical signaling that has been subject to selective forces over many generations [63].
To evaluate the effect of cover crop diversity on GTD symptoms and the abundance of pathogenic fungi, the effects of single cover crops grown on their own were compared to the same cover crops grown together. Using native and common cover crops, we hypothesized that mixtures of cover crops would result in fewer disease symptoms, reduce pathogen abundance, and increase fungal diversity more than any plant on its own. The present study provides insight into cover crop management in vineyards, primarily in the context of disease mitigation.

2. Materials and Methods

2.1. Establishment of Experiments

In order to understand the effects of cover crop diversity on GTD symptoms, we established two separate greenhouse experiments at the Summerland Research and Development Centre (SuRDC) in Summerland, BC, Canada:
“Cultivar Study”. This experiment used four cover crops that are commonly used in vineyards (Table 1). Crimson clover (Trifolium incarnatum L.) and buckwheat (Fagopyrum esculentum Moench) were purchased from a local supplier (WestCoastSeeds, Vancouver, Canada), while white mustard (Sinapis alba L.) and wheatgrass (Triticum aestivum L.) were purchased from a commercial seed supplier (Richters, Ontario, Canada).
“Native Study”. This experiment used four plants native to the southern interior British Columbia as cover crops. We used white yarrow (Achillea millefolium L.) and silky lupine (Lupinus sericeus Pursh), which were sourced from a local supplier (Xeriscape Endemic Nursery, West Kelowna, BC, Canada) along with bluebunch wheatgrass (Pseudoroegneria spicata Pursh, Löve), which was collected in Summerland, BC. Holboell’s rockcress (Bochera hoellbelii Hornem, Löve) seeds were donated by SeedsCo Community Conservation, a local native plant supplier (Table 1).

2.2. Effect of Cover Crop Diversity on Disease Symptoms

In order to observe the effect of cover crop diversity on incidence of disease, each species for the native and cultivar studies was grown on its own (monoculture) as well as with all other plants (all native or all cultivar), totaling five treatments and 10 replicates per treatment for each study (Table 1). In addition to the cover crop treatments, the cultivar study had an additional “fallow” treatment in which the soil was kept bare. This treatment was not seeded with cover crops to determine the incidence of disease and grapevine growth without the addition of inoculant or cover crop. Both experiments consisted of a randomized block design with 10 blocks (five blocks per table) to account for environmental variation inside the greenhouse and the rectangular shape of the tables. Each treatment was assigned to its block via random number generation. Treatments were standardized to four plants per pot such that monoculture pots consisted of four plants of the same species while all native and all cultivar pots consisted of one individual for each species totaling four plants (Table 1).

2.3. Location and Greenhouse Conditions

Plants were grown in a greenhouse at SuRDC (49°33’57.8” N 119°38’10.0” W) from 27 April 2018 to 4 March 2019. To reduce stress during warm summer months, the room was cooled by a fog system that turned on when temperatures rose above 28 °C and shade curtains were activated from 12:30 p.m. until sunset. During the spring and fall, daytime and nighttime temperatures were kept at 20 and 15 °C, respectively, with supplementary lights to maintain 15-hour days.

2.4. Soil

Soil was collected at SuRDC on 21 March 2018 from a small cherry block. This soil is described as a Skaha loamy sand which had previously harbored apples (Braeburn grafted to M.26 rootstock) until it was replanted with sweet cherry during the 2014 growing season (Table A1) [64,65]. Fusarium, Ilyonectria, and Rhizoctonia species (which are known to infect grapevine roots) were previously isolated from this site [64], increasing the likelihood of resident pathogens already in the soil. Soil was collected from the northwest guard zone, which consisted of a sweet cherry row that separated treatments from the access road. A trench (250 × 40 × 25 cm) was dug, keeping as close to the row as possible. Soil was thoroughly homogenized by hand on a large tarp and stones were removed before the soil was transferred into 3-liter nursery pots that were filled, leaving a gap of 4 cm from the top to prevent water overflow. Nursery pots were placed in SuRDC greenhouse facilities for the duration of the study.

2.5. Pathogen Incubation and Inoculation

We inoculated each pot with three isolates of Ilyonectria liriodendri (SuRDC 340, 60, 393) to increase the likelihood of infection. This pathogen was previously isolated from vineyards in British Columbia [6] and the isolates were selected for their ability to grow and sporulate. The addition of inoculum also ensured the presence of YVD pathogens that could infect grapevine cuttings. Single cultures of each isolate were incubated for one week (22 °C) using 5% potato dextrose agar (PDA) solution (autoclaved at 121 °C for 30 minutes). Cultures were propagated by cutting a 1 cm2 slice of colonized agar and placing it upside down on new PDA until enough material was available for inoculation of all pots. Plates were examined under a compound light microscope to observe sporulation before inoculum preparation. A 106 conidia spore suspension was created for each isolate by flooding the agar plates with 1% tween solution and disturbing the surface with a metal utensil. The liquid was then passed through double-layer cheese cloth to form the stock solution. A hemocytometer was used to count conidia spores and make the specified concentration. Soil was inoculated on 24 April 2018 by pouring 45 mL of inoculum in a circle near the center of the pot.

2.6. Germination and Growth of Plants

Seeds were germinated in starter trays with an equal mixture of field soil and Sunshine Mix #4 (Sun Gro) peat/perlite mix (autoclaved at 121 °C, 1.5 hours) before transplantation into 3-liter pots on 27 April 2018. Due to the lower germination of native plants, pots were re-seeded following transplantation so that the number of plants in each pot was equal to four. Pots were watered by hand with no additional supplements and allowed to dry before subsequent watering. During the summer months, pots were watered more frequency to prevent drought and heat stress. Cultivar study plants were grown in the greenhouse until 30 July 2018, while native study plants were grown for an additional month until 3 September 2018 due to the perennial nature of the native plants. At harvest, soil was removed from roots followed by a thorough rinsing to remove as much soil as possible. Plants were bagged and taken to University of British Columbia (UBC) Okanagan where they were dried and weighed.
Vitis vinifera (Chardonnay) cuttings were collected from SuRDC on 15 February 2018 (49°33’56.2” N 119°37’46.7” W) and placed in a cold storage room at 2 °C until propagation. Cuttings were taken out of cold storage in June 2018 and cut into smaller pieces containing two nodes (30 cm) with a pruning tool. Canes with visible signs of mold on the surface were discarded and the remaining canes were put in a plastic container filled to a 3-cm depth of water then placed in the experimental greenhouse until the appearance of roots. Chardonnay cuttings were transplanted on 31 July 2018 (cultivar study) and 1 August 2018 (native study). Cultivar study vines were grown for approximately four and a half months while native study vines were grown for seven months to maximize exposure to pathogens. During the first week any vines that died were removed.
Initially, grapevines were given 150 mL of Miracle Gro© (20-20-20) fertilizer on a weekly basis according to manufacturer’s instructions. Nutrients were reduced to (15-15-18) after six weeks followed by dilutions to induce stressful conditions (Table A2). Cultivar study grapevines were harvested on 12 December 2018. At harvest, soil was removed from roots, followed by a thorough rinsing with reverse osmosis water. Samples were placed into paper bags and held at 4 °C until January 2019. Cuttings grown in soil conditioned by native cover crop treatments were left without fertilizer from 7 December 2018 to 6 January 2019 to further induce nutrient stress. On 8 January 2019, leaves were removed from each vine to further stress the plants and increase susceptibility to pathogens. Grapevine cuttings were removed from the greenhouse on February 12 and put into cold storage for two weeks until they were destructively harvested on 4 March 2019.

2.7. Incidence of Disease

To determine the extent of necrotic tissue in Chardonnay cuttings, a cross section was cut 1 cm from the basal end of the cane and placed on a scanner (Epson Expression 1680). Images were created with Adobe Photoshop© CS2 and analyzed with WinRhizo Pro (©2013) by defining color classes representing necrotic and healthy tissue. Percent necrosis was determined by dividing the area of necrotic tissue by the total analyzed area. For native treatments an additional measurement was performed. After imagery analysis, the progression of necrosis from the basal end to the top was determined by cutting the cane into 1-cm sections and looking for signs of necrotic tissue under a dissecting microscope (VWR Bioimager BRC-1600). Disease progression was rounded to the nearest centimeter.

2.8. Molecular Data

To determine the effects of cover crop diversity and provenance on the abundance of I. liriodendri, we assayed the abundance of DNA extracted from soil. Soil samples were also used to measure fungal community composition and species richness. Soil samples were taken from each nursery pot after inoculation with I. liriodendri before seeding with cover crops (starting soil), and again before removal of cover crops (conditioned soil). Root samples were collected after four and five months of growth for the cultivar study and native study experiments, respectively. We used a digital droplet (dd) PCR assay to observe changes in the abundance of I. liriodendri and Illumina sequencing of the internal transcribed spacer (ITS) 2 region to uncover fungal community composition.

2.9. DNA Extraction

On 26 April 2018, three rhizosphere core samples (1 cm diameter) totaling approximately 20 g were collected from the center of each pot at a depth of five centimeters. On 30 July 2018, another set of soil samples from cultivar treatments was collected before commercial cover crops were removed using the same method described above. Soil samples from native cover crop treatments were collected on 5 September 2018 before removal of cover crops. Soil cores were homogenized and kept at −20 °C at UBC Okanagan laboratories until DNA extraction.
Soil was dried at 60 °C for 24 hours to remove water from soil, allowing a higher DNA concentration during the final elution step [66,67]. Half a gram from each sample was used for DNA isolation. DNA was extracted using the FastDNA Spin Kit for Soil (MPBio ©2018, Irvine, CA, USA) according to the manufacturer’s instructions. This resulted in approximately 90 µL of eluded DNA per sample, with an average concentration of 30 ng/µL (nanodrop 1000c ©2009, Thermo Fisher Scientific, Wilmington, NC, USA). DNA was stored at −80 °C until PCR and Illumina sequencing.
After surface sterilizing, 1 gram of root subsamples was placed in a 15-mL falcon tube and frozen at −20 °C until DNA extraction. Roots were then broken down in a mortar and ground up with liquid nitrogen until very small root fragments remained. Half a gram of ground-up roots was put into lysing tubes and the rest was put back into their original falcon tubes and frozen at −20 °C. DNA extractions performed using the FastDNA Spin Kit for Soil (MPBio ©2018) with a few modifications. Lysing was performed at an intensity of 6.5 m/s instead of the standard 6.0 m/s, and initial centrifugation was extended to 10 min to promote complete separation of root tissues and nucleic acids.

2.10. Droplet Digital Assay

In order to detect the Ilyonectria isolates used in the inoculum, a specific primer/probe assay that targets the beta-tubulin region was designed [68]. The primer, forward 5′-CGAGGGACATACTTGTTTCCAGAG-3′ (Tm 61, GC 60%), reverse 5′-TCAACGAGGTACGCGAAATC-3′-R (Tm 62, GC 50%), and probe TGTCAAACTCACACCACGTAGGCC amplify beta-tubulin, a highly conserved region and single-copy gene, making it ideal for the quantification or spores and/or septate hyphae in soil and roots.
Reactions consisted of 10 µL Supermix (Supermix for probes no dUTP by Bio-Rad Inc., Hercules, CA, USA), 7 µL DNAse free water, 1 µL primer/probe, and 2 µL DNA, for a total volume of 20 µL. Droplets were created using the Bio-Rad QX100 Droplet Generator using the total reaction volume per sample and 70 µL of Bio-Rad Droplet Generator Oil for Probes. PCR runs were completed in the C1000 Thermal Cycler (Bio-Rad) with the following conditions: initial heating at 95 °C for 10 min, 94 °C for 1 min, and annealing at 59 °C for 2 min × 44 cycles. Fluorescence was measured using the QX 100 Droplet Reader (Bio-Rad) and Quantalife software (version 1.7.4. Bio-Rad) by selecting FAM-HEX as the fluorescence setting. The threshold was set manually at 3000 using a pure positive and environmental positive controls as a reference. For analysis, the copy number of each sample was back calculated to represent the number of copies per gram of soil and root using a formula described in Kokkoris et al. (2019) [69].

2.11. Illumina Sequencing and Bioinformatics

Illumina sequencing was completed at the Centre for Comparative Genomics and Evolutionary Bioinformatics (Dalhousie University, Halifax Nova Scotia). Amplicon sequencing of the ITS2 sub-region was performed for each treatment (n = 5 for cover crops, n = 10 for starting soil) using primers ITS86F 5′-GTGAATCATCGAATCTTTGAA-3′ and ITS4R 5′-TCCTCCGCTTATTGATATGC-3′. Samples were demultiplexed, and barcodes were removed and returned as individual per-sample fastq files from the sequencing facility.
Initial quality control and amplicon filtering was performed using the Divisive Amplicon Denoising Algorithm (DADA2 package 1.12.1) in R statistical software (R version 3.6.1, 2019) by following the DADA2 ITS Pipeline Workflow 1.9 [70]. Primers, their reverse orientation, and complements were removed from reads using cutadapt (version 2.3). Sequence reads were filtered and trimmed using filterAndTrim (DADA2) by setting standard parameters (maxN = 0, truncQ = 2, rm.phix = TRUE, and maxEE = 2). Forward and reverse reads were dereplicated using derepFastq before applying the DADA algorithm [70]. Denoising was done by pooling samples (pool = TRUE). Sharing information across samples makes it easier for singletons appearing multiple times across samples to be resolved. Paired reads were merged and an amplicon sequence variant (ASV) table was created. Finally, chimeras were removed using removeBimeraDenovo (method = “consensus”) resulting in high-quality, filtered reads. The number of reads retained at each DADA2 step is shown in Table A3.
Beta diversity analyses were performed in QIIME2 (version 2019.10, https://qiime2.org) [71] and completed separately for native and cultivar studies. First, a phylogenetic tree was constructed using the q2-phylogeny plugin for QIIME2. To assign taxonomy, a reference classifier from UNITE (version 8.0) was used [72] and applied to the representative sequences from DADA2 (see above).
Native study samples were analyzed using the q2 diversity core-metrics-phylogenetic plugin. First, the ASV table containing all samples was filtered to contain only native samples. A sampling depth of 3316 was chosen based on sample B3-3 (silky lupine) because it excluded only three samples while maximizing the sampling depth. Weighted UniFrac dissimilarity [73] was used to create a distance matrix and beta diversity results were viewed via Principal Coordinates Analysis (PCoA).
Due to non-normal distribution of features and appearance of horseshoe distributions with Weighted UniFrac distance, beta diversity for cultivar study samples was performed using the DEICODE plugin (version 0.1.5) for QIIME2 [74], which creates a Robust Aitchison principal component analysis (PCA) distance matrix that handles sparse and/or non-normal datasets. A new ASV table with only cultivar samples was created. A sampling depth of 3146 was chosen, as it compromised sample exclusion and maximal sampling depth for beta diversity (see nonchim, Table A3). As with the native study, beta diversity results were viewed via PCoA.

2.12. Statistical Analyses

Data for root necrosis were transformed by taking the square root of (k-x), where k is the maximum value for percent necrotic tissue plus 1 and x is percent necrotic tissue for each sample. Disease progression of native study grapevines was normalized by taking the natural logarithm of 1+x, where x is the vertical progression of the disease, measured in centimeters.
For native study treatments, copy number per gram of root was square-root transformed to satisfy normality. After transformation, two outliers were removed from the copy number values before modelling and subsequent statistical analyses using Tukey’s interquartile range (IQR). According to this method, values that are more or less than 1.5 times the IQR are removed. In the cultivar study, the copy number from root samples was cube-root transformed to meet normality assumptions. All statistical analyses were performed by fitting a linear mixed-effects model in R (R version 3.6.1, 2019, open source, http://www.r-project.org/) using the lme4 package (1.1.21). Normality was assessed using a Shapiro–Wilk normality test (stats package 3.6.1), and variance homoscedasticity was tested using Levene’s test (car package 3.0.6). For each analysis, treatment was tested as a fixed factor and block as a random factor. Post hoc comparisons were completed using Tukey’s honest significant difference test [75] within the emmeans package (1.4.1).
Alpha diversity of native and cultivar study samples was compared in QIIME2 with q2 diversity alpha-group-significance using Shannon evenness vectors from the q2 diversity core-metrics-phylogenetic. Overall and pairwise interactions were determined with the Kruskal–Wallis test by ranks [76] at a significance of 0.05. Beta diversity of native samples was determined via PERMANOVA in the q2 diversity beta-group-significance plugin using the Weighted UniFrac distance matrix created from the q2 diversity core-metrics-phylogenetic plugin, as it incorporates sequence abundance and phylogeny in community composition and distance between samples. Distances for native cover crop treatments were visualized using principal coordinate analysis (PCoA) with the q2-emperor plugin. For cultivar study samples, Robust Aitchison distance matrices were used from the DEICODE plugin to determine beta diversity (version 0.2.3). All PERMANOVA tests used 999 permutations and pseudo-F as the test statistic. Dispersion of native and cultivar study samples was determined with q2 diversity beta-group-significance by setting --p-method to permdisp. Dispersion tests were executed with 999 permutations and the F-value as the test statistic.

3. Results

3.1. Cover Crop Growth

Yarrow, bluebunch wheatgrass, and rockcress germinated after two to three weeks (Table A4). Silky lupine experienced lower germination rates likely due to lack of appropriate rhizobia and/or high temperatures. When grown separately, above- and below-ground biomass of bluebunch wheatgrass and white yarrow were similar to each other and significantly higher than silky lupine and rockcress. When all cover crops were grown together, above- and below-ground biomass was not different than bluebunch wheatgrass or yarrow. Cultivar monocultures varied in biomass. When grown separately, wheat yielded the highest root biomass, followed by buckwheat and clover. Crimson clover yielded the most biomass above ground followed by buckwheat then wheat. The lowest biomass measurements were observed for white mustard, in which below- and above-ground were significantly different from all other cover crop treatments. When cultivar crops were grown together, below-ground biomass was greater than all but wheat monocultures and the highest above-ground biomass.

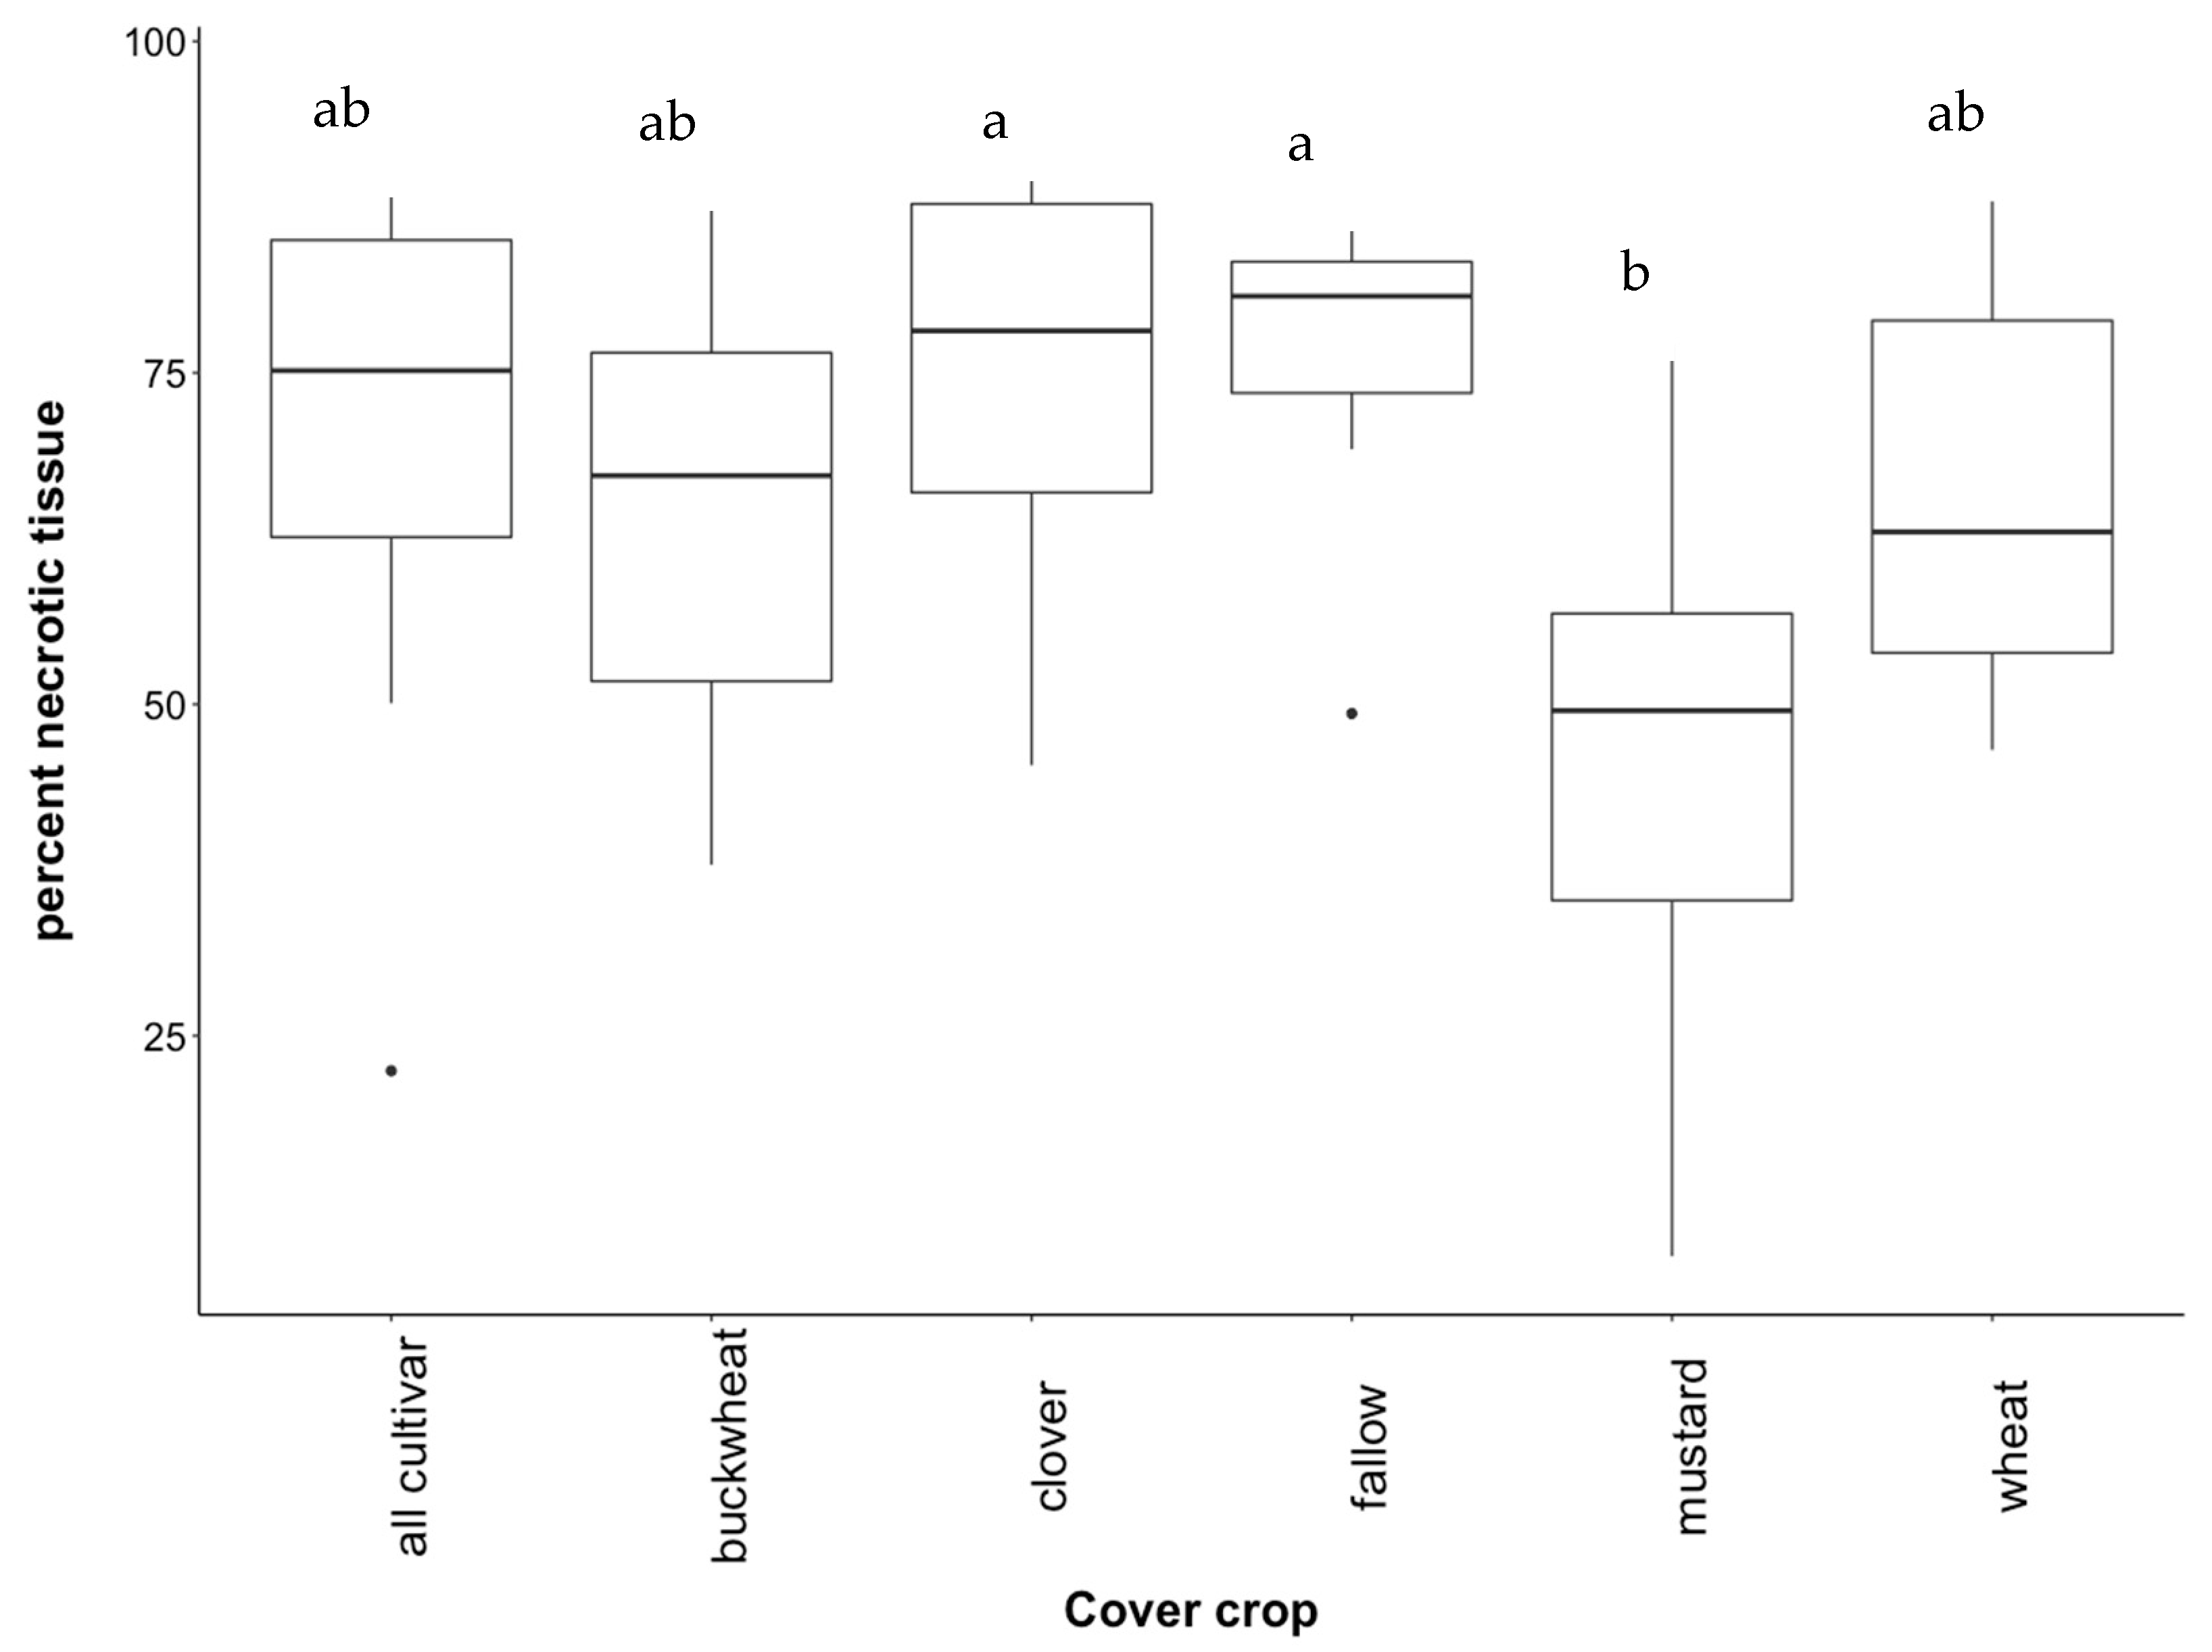
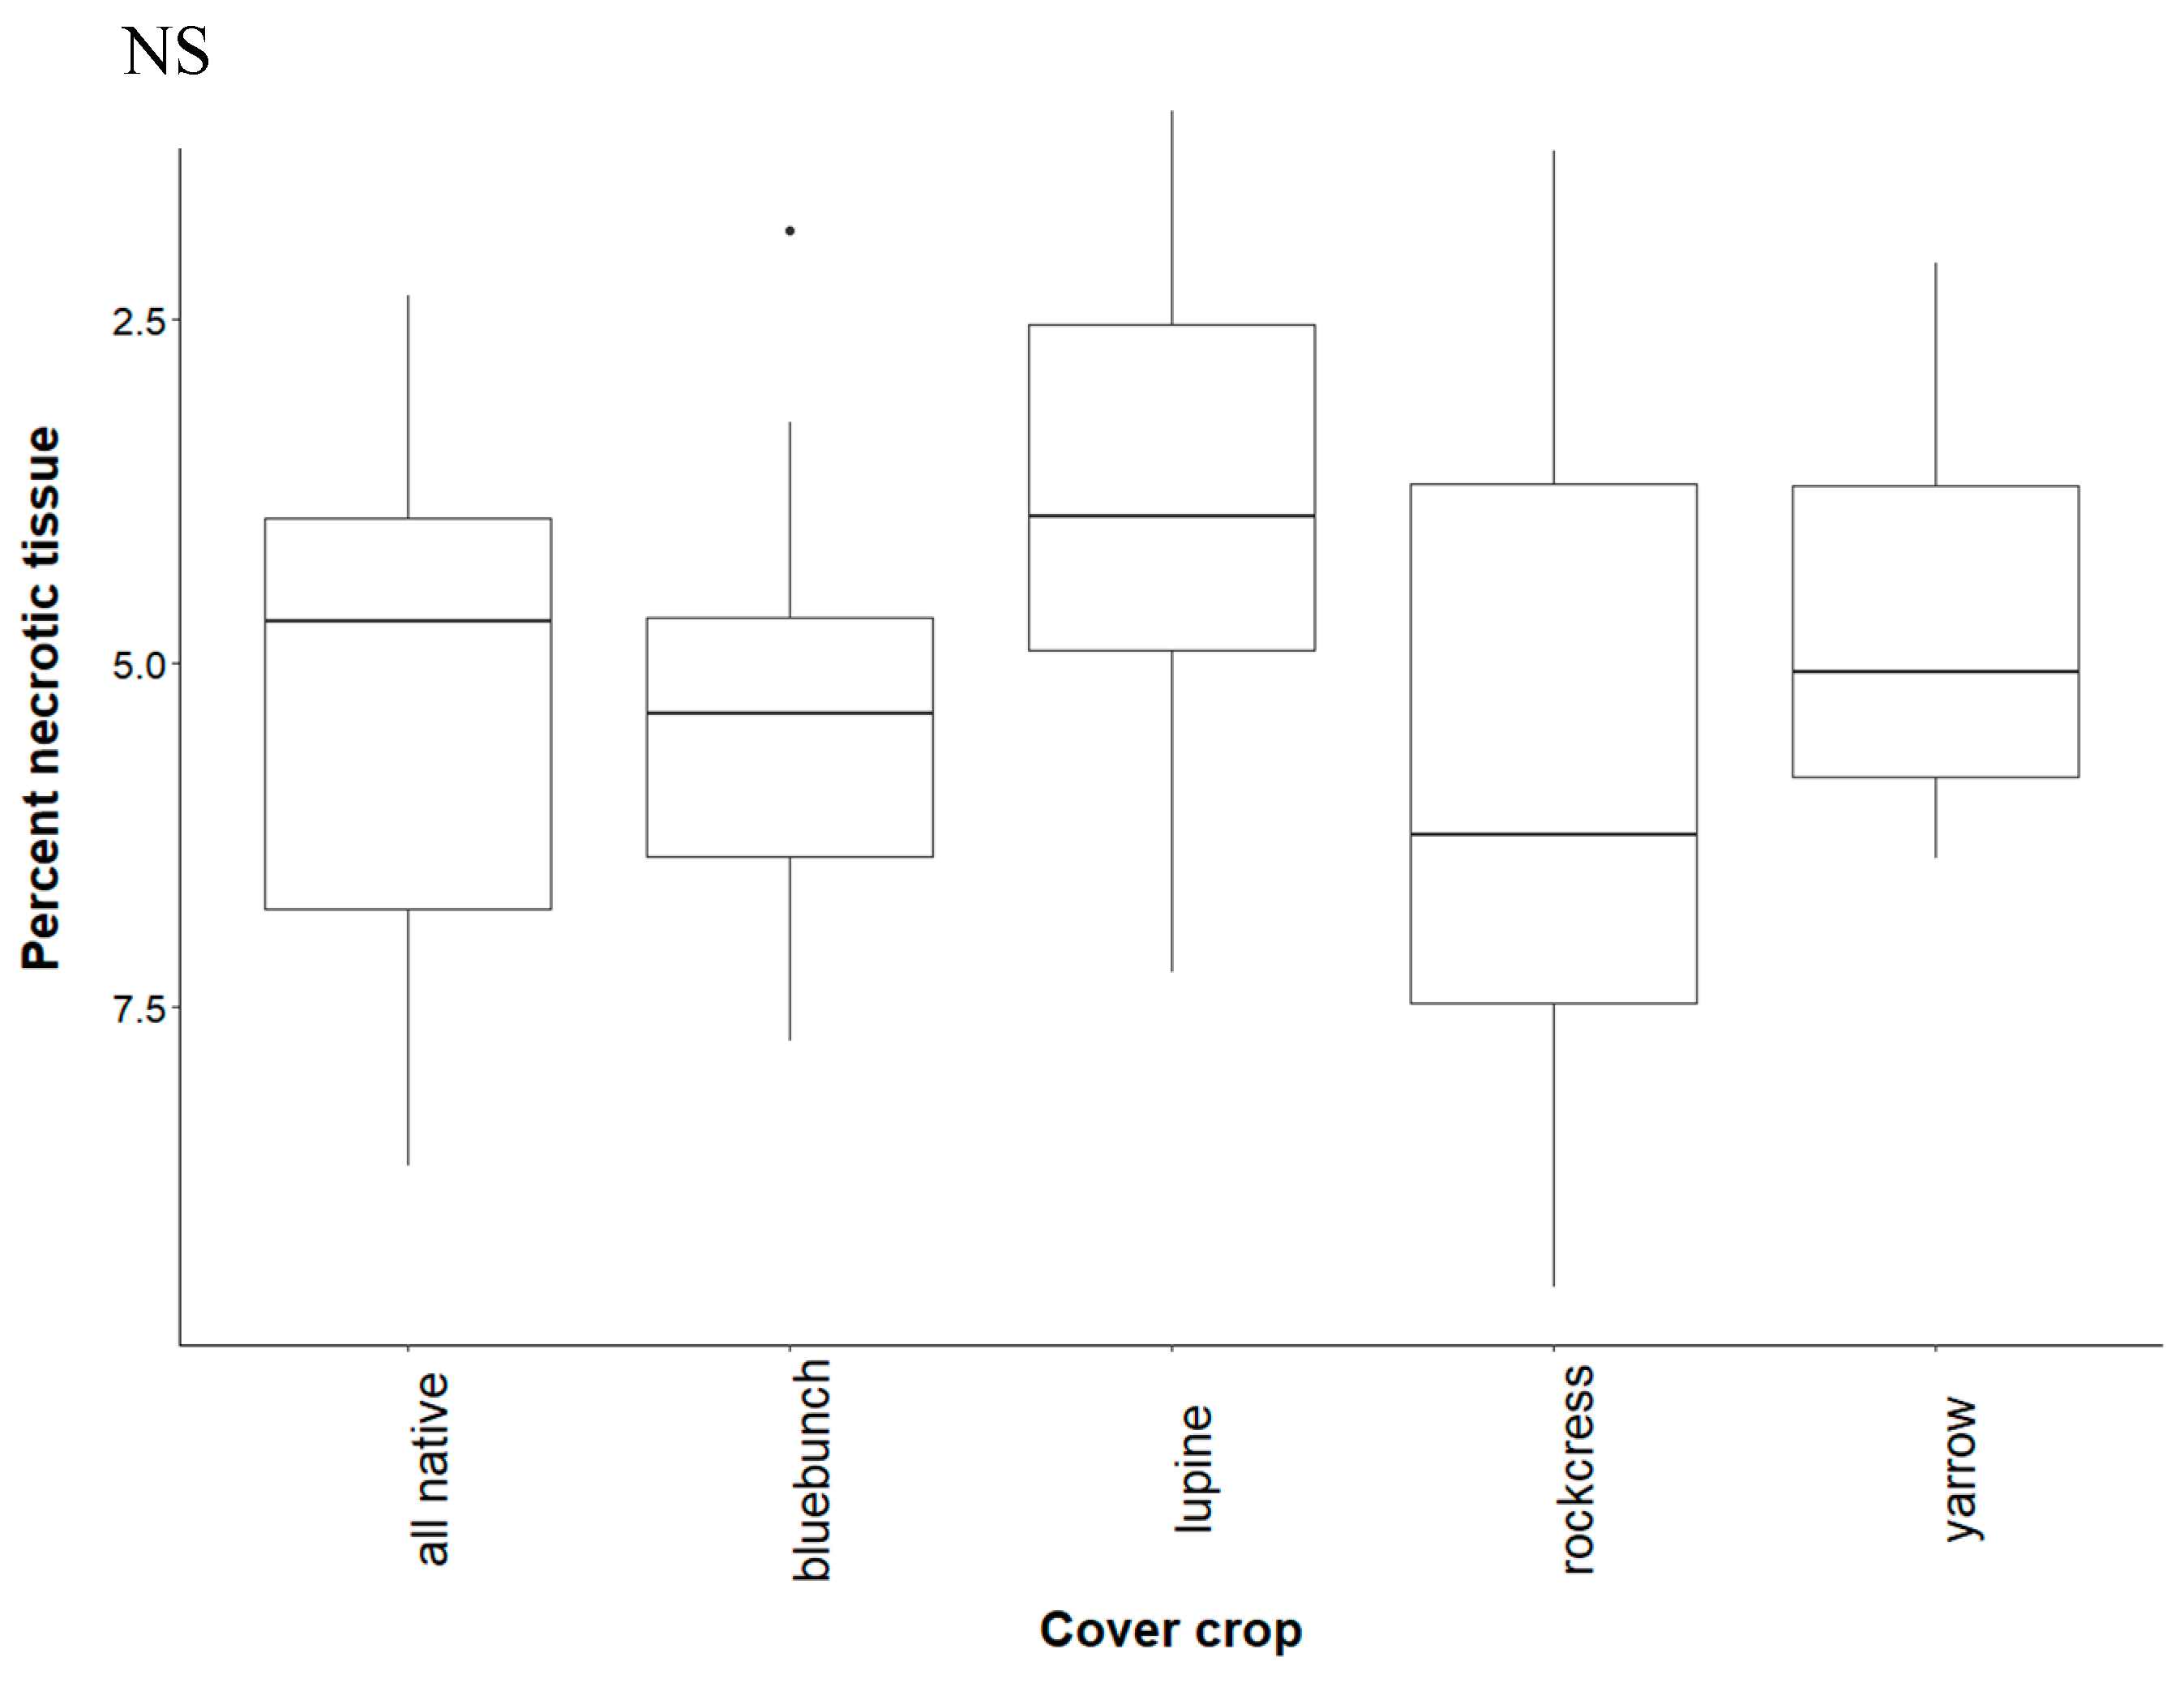
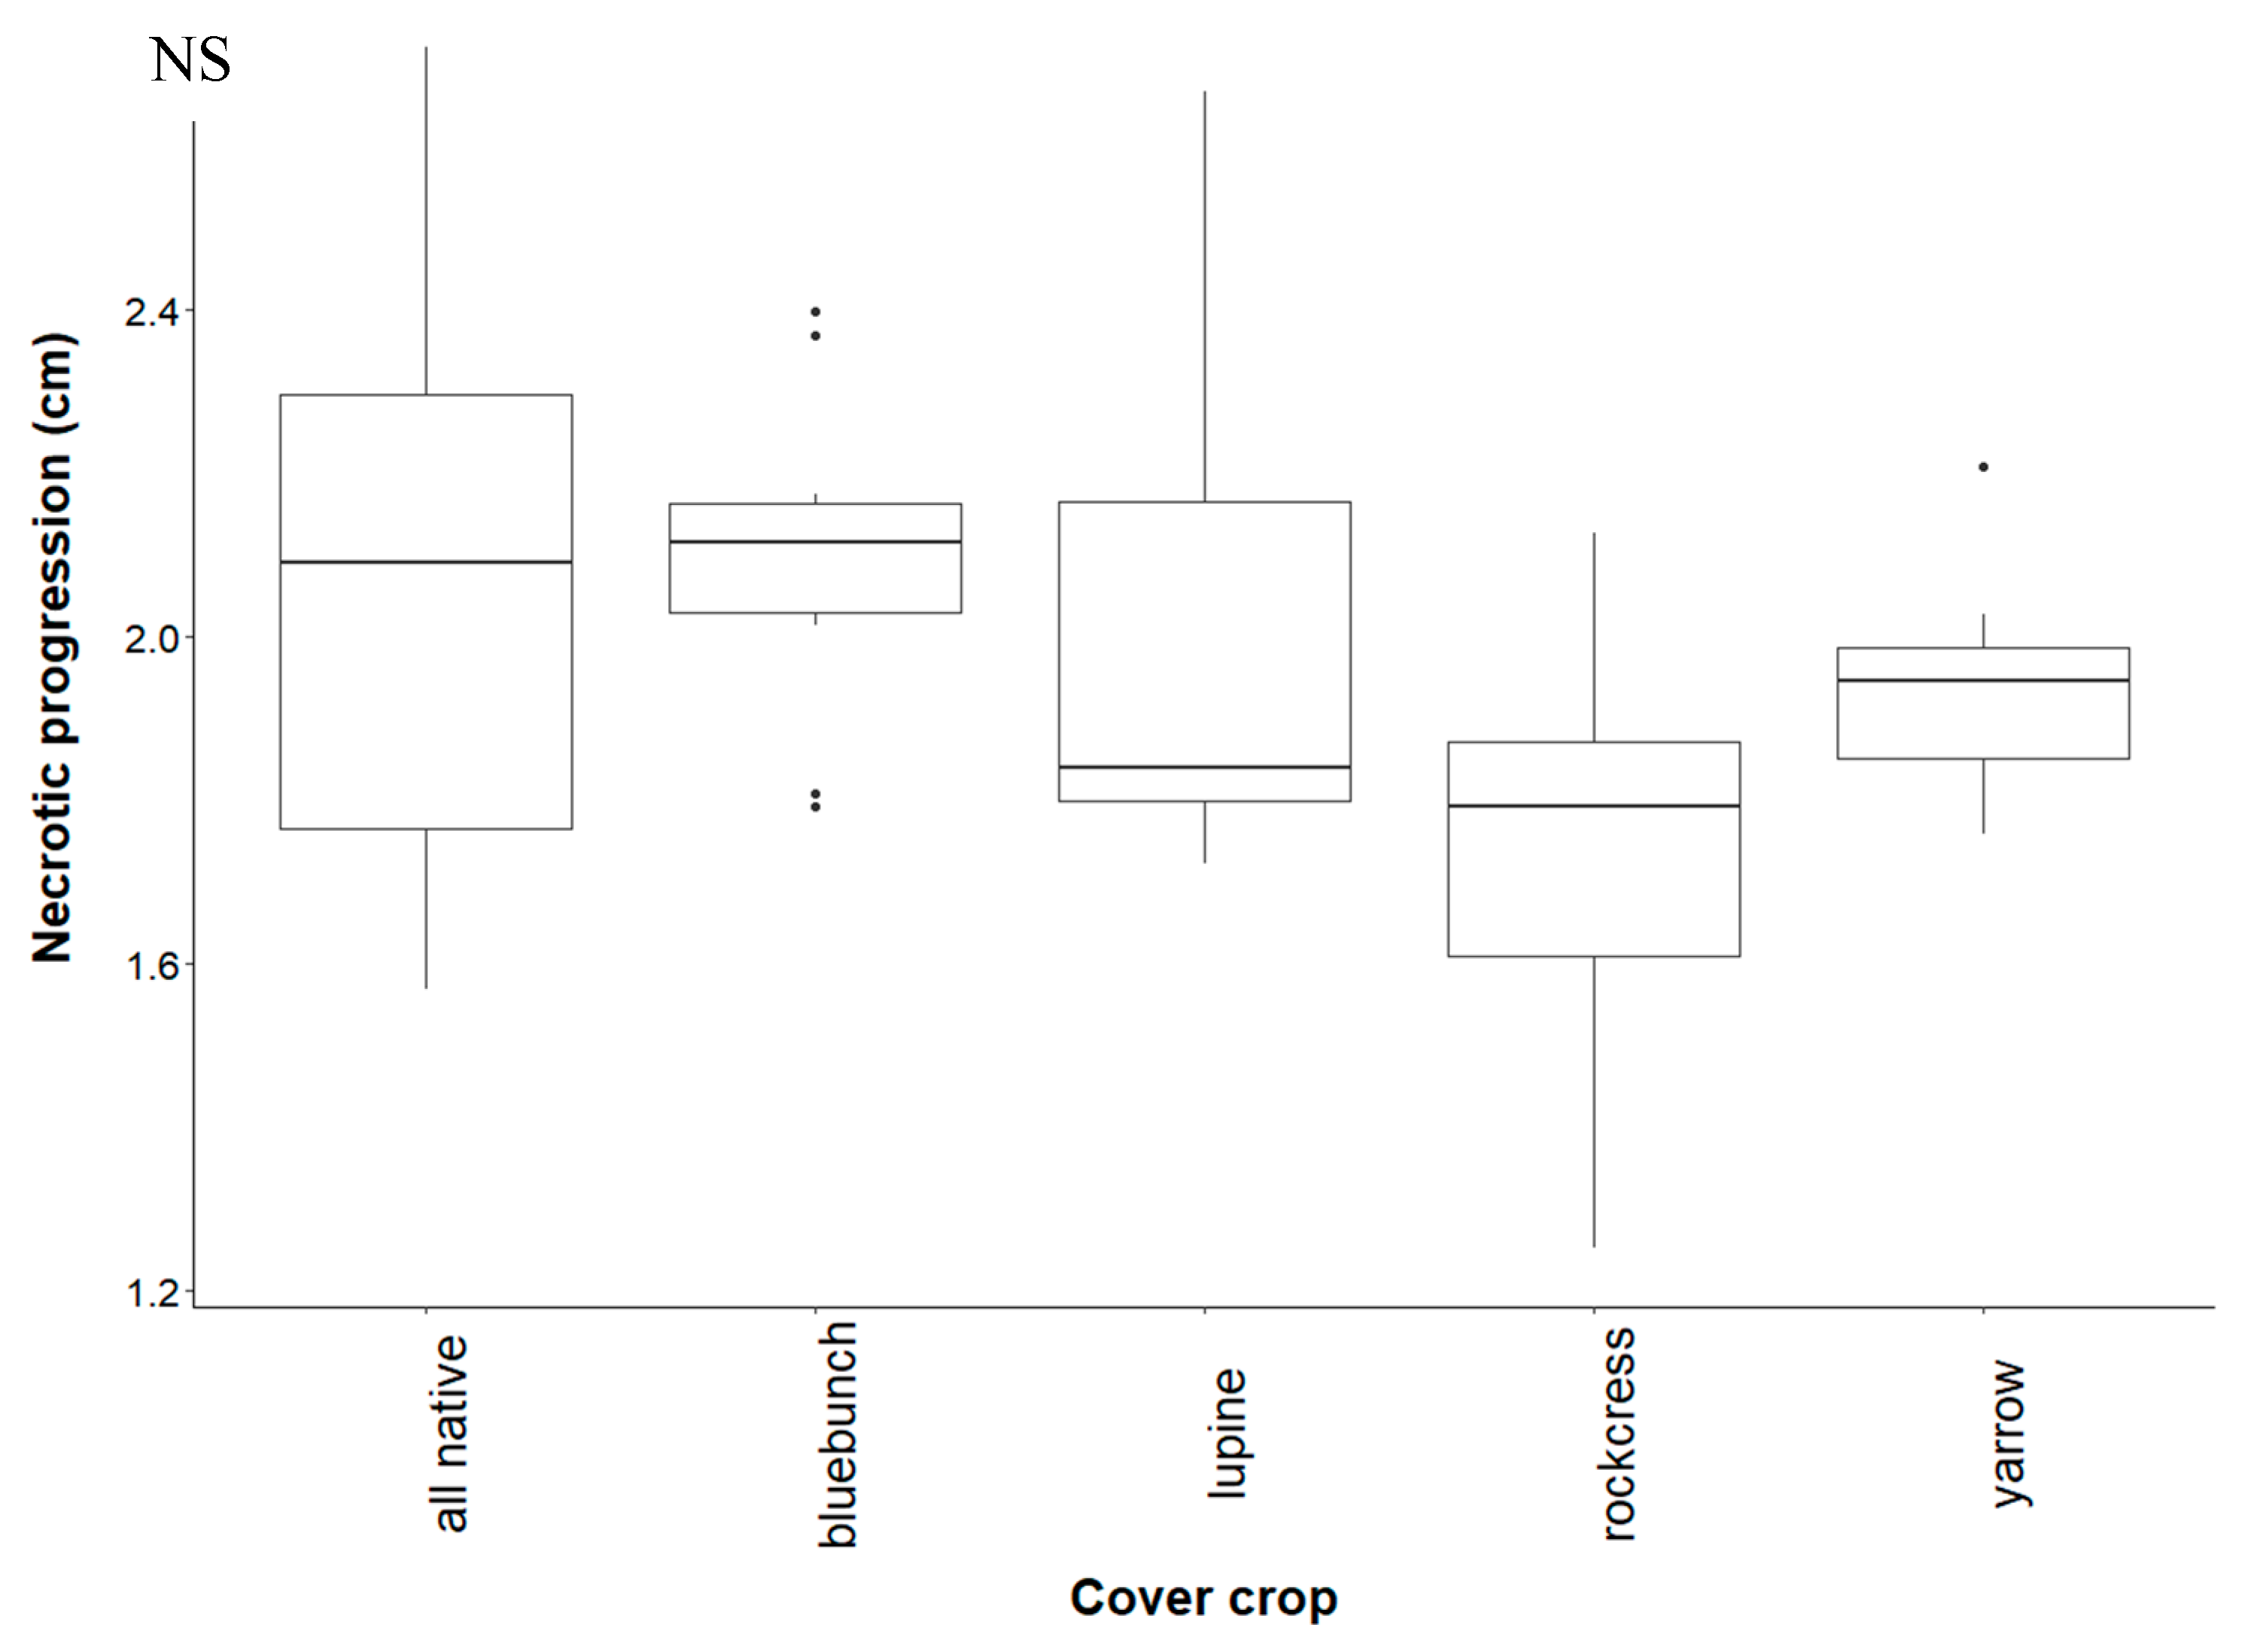
3.2. Effect of Cover Crops on Incidence of Disease in Vines

Contrary to our hypothesis, grapevines grown in native study monocultures did not have higher rates of necrosis when compared to all plants growing together (Figure A1). Necrotic progression (evidence of necrosis from the basal to distal end) was near significant among monocultures (p = 0.057), with rockcress yielding the lowest average necrotic progression (Figure A2). Contrary to predictions, white mustard yielded the lowest percent necrotic tissue and was significantly different than fallow and crimson clover treatments in the cultivar study (p = 0.035), as seen in Figure 1. The lower necrotic damage found in grapevines growing in white mustard soil increased slightly when white mustard was grown with other cover crops.

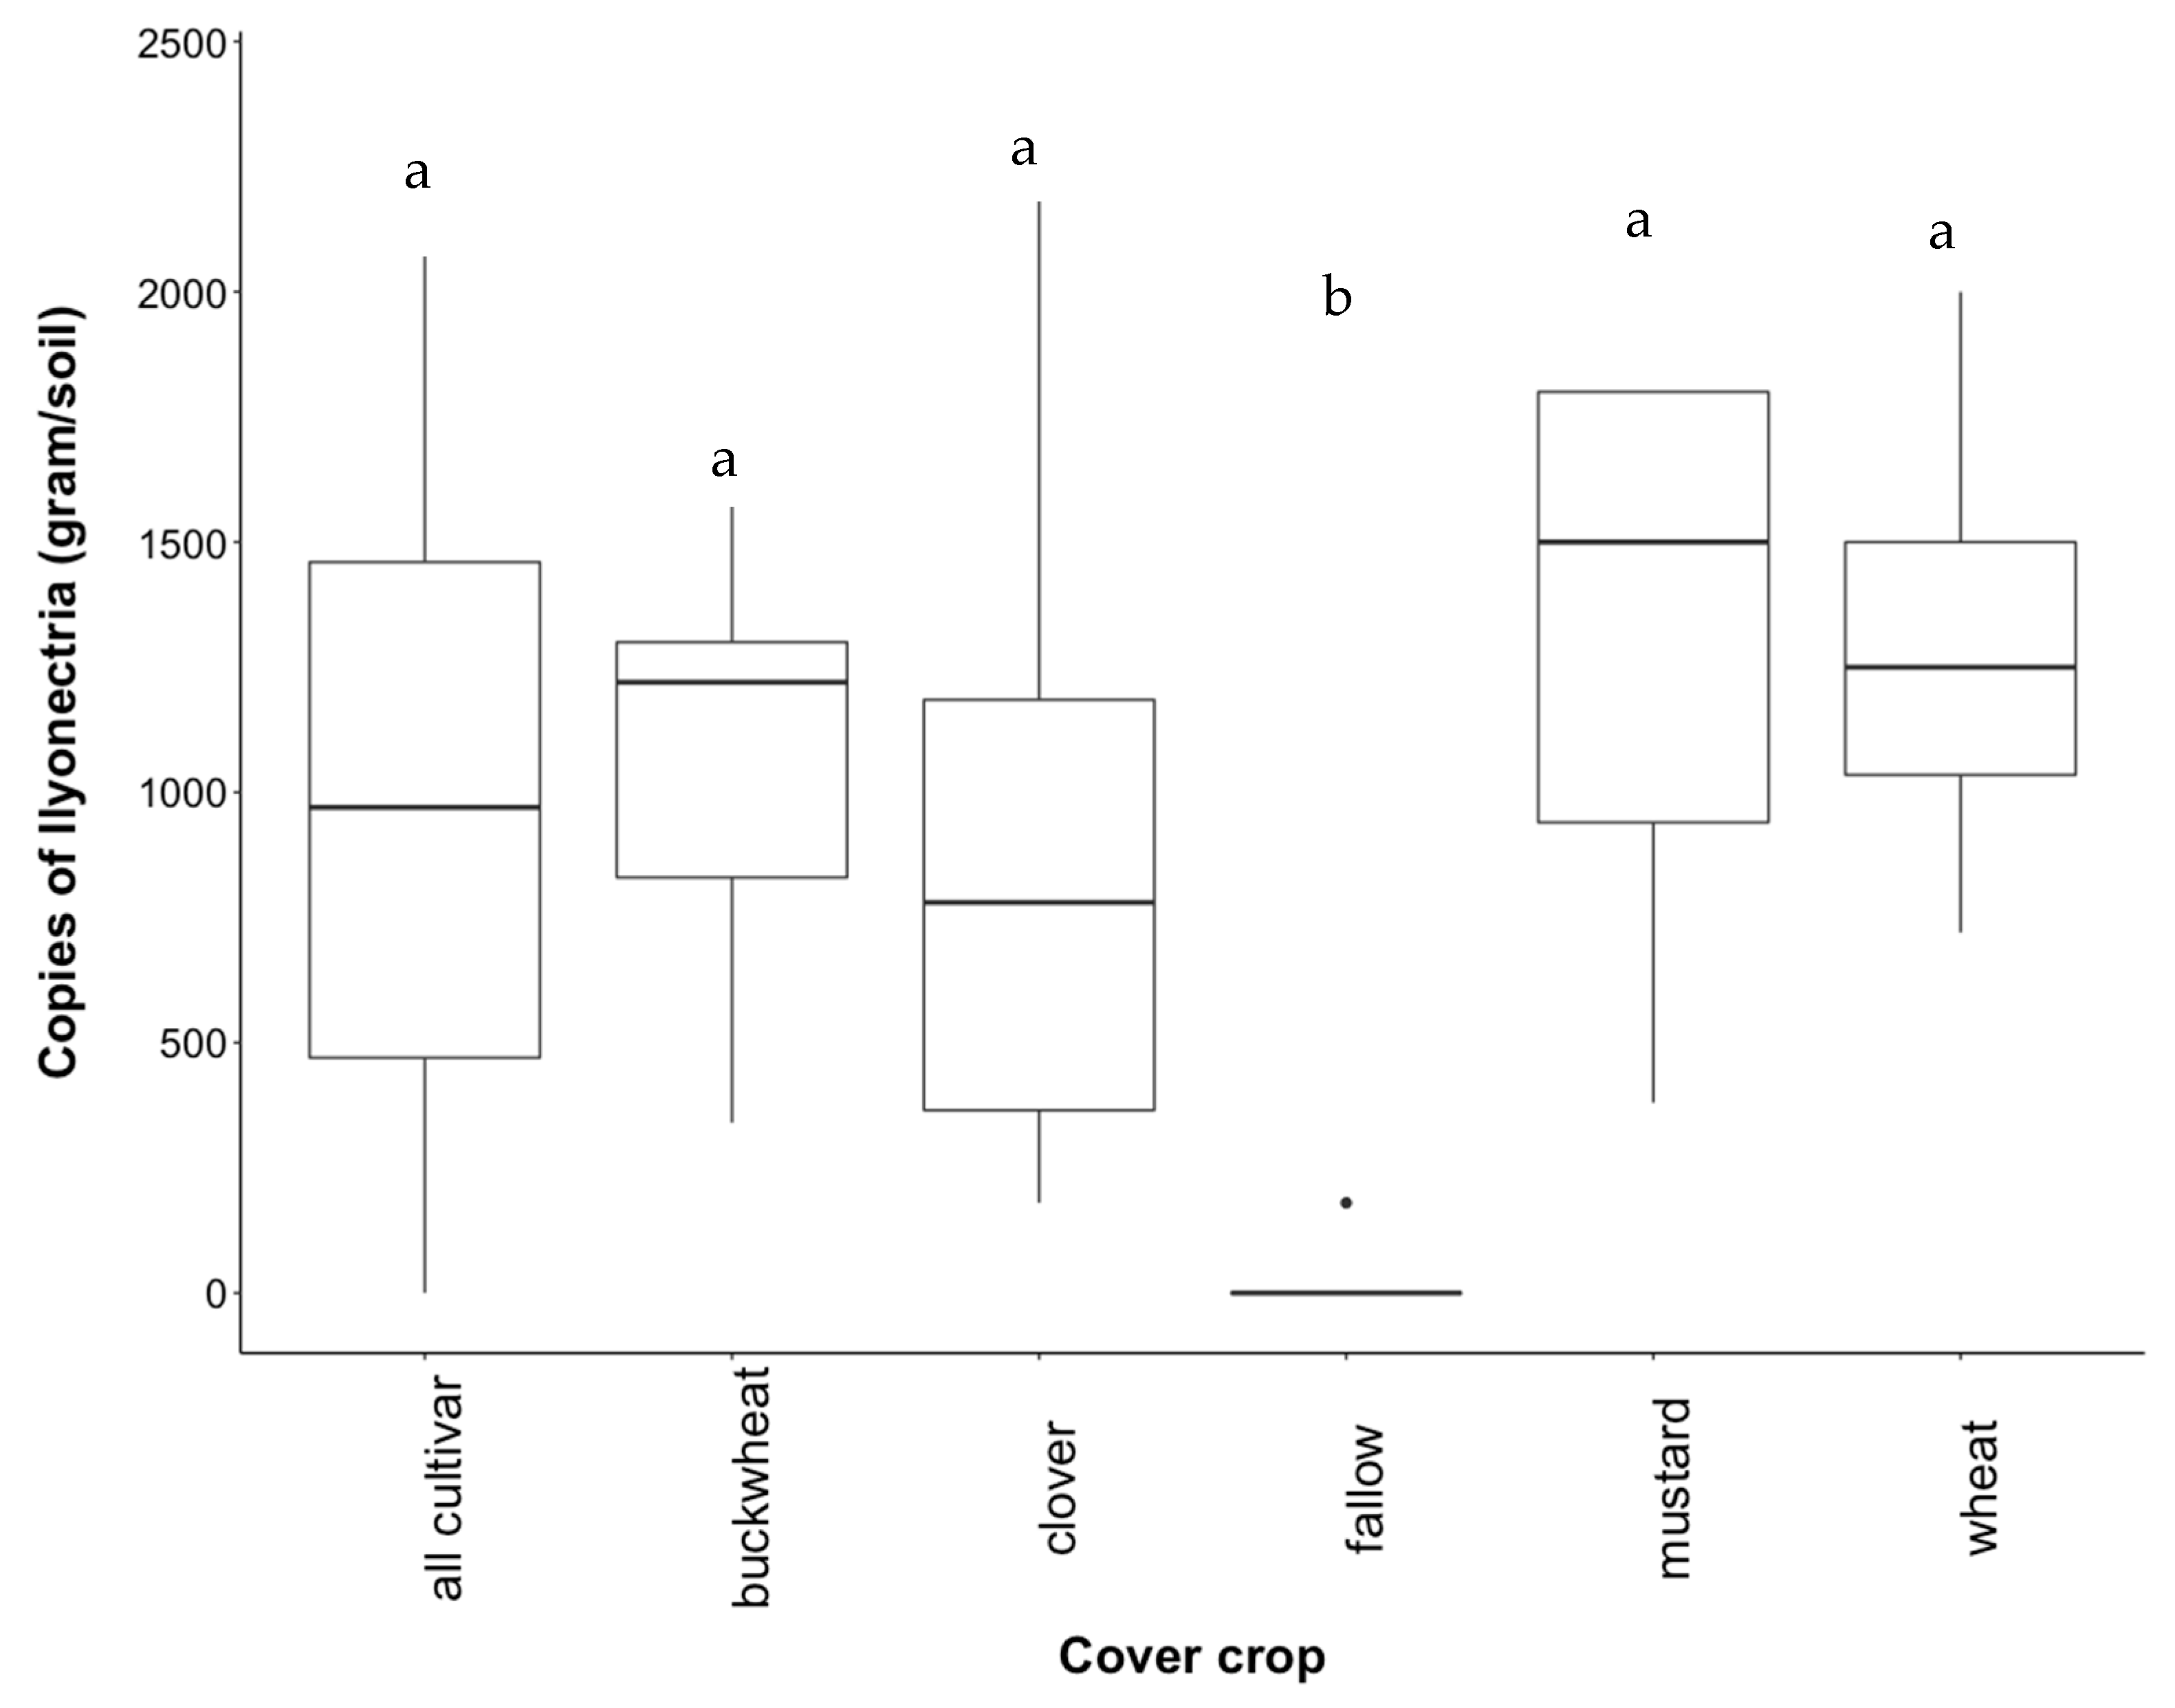
3.3. Recovery of Ilyonectria from Soil

In the native study, I. liriodendri was recovered from all treatments; however, its abundance varied highly between samples. Contrary to predictions, there was no significant variation between individual cover crops and when plants were grown together (Figure A3). Abundance of I. liriodendri was lowest in white yarrow soil while bluebunch wheatgrass yielded the highest abundance (Figure A3). In the cultivar study, abundance of Ilyonectria did not vary significantly between cover crop treatments (Figure 2) except for fallow, which was expected (p < 0.001). White mustard yielded an average of 1326 copies of I. liriodendri target DNA per gram of soil, the highest average copy number of all treatments, which was inconsistent with percent necrotic tissue.

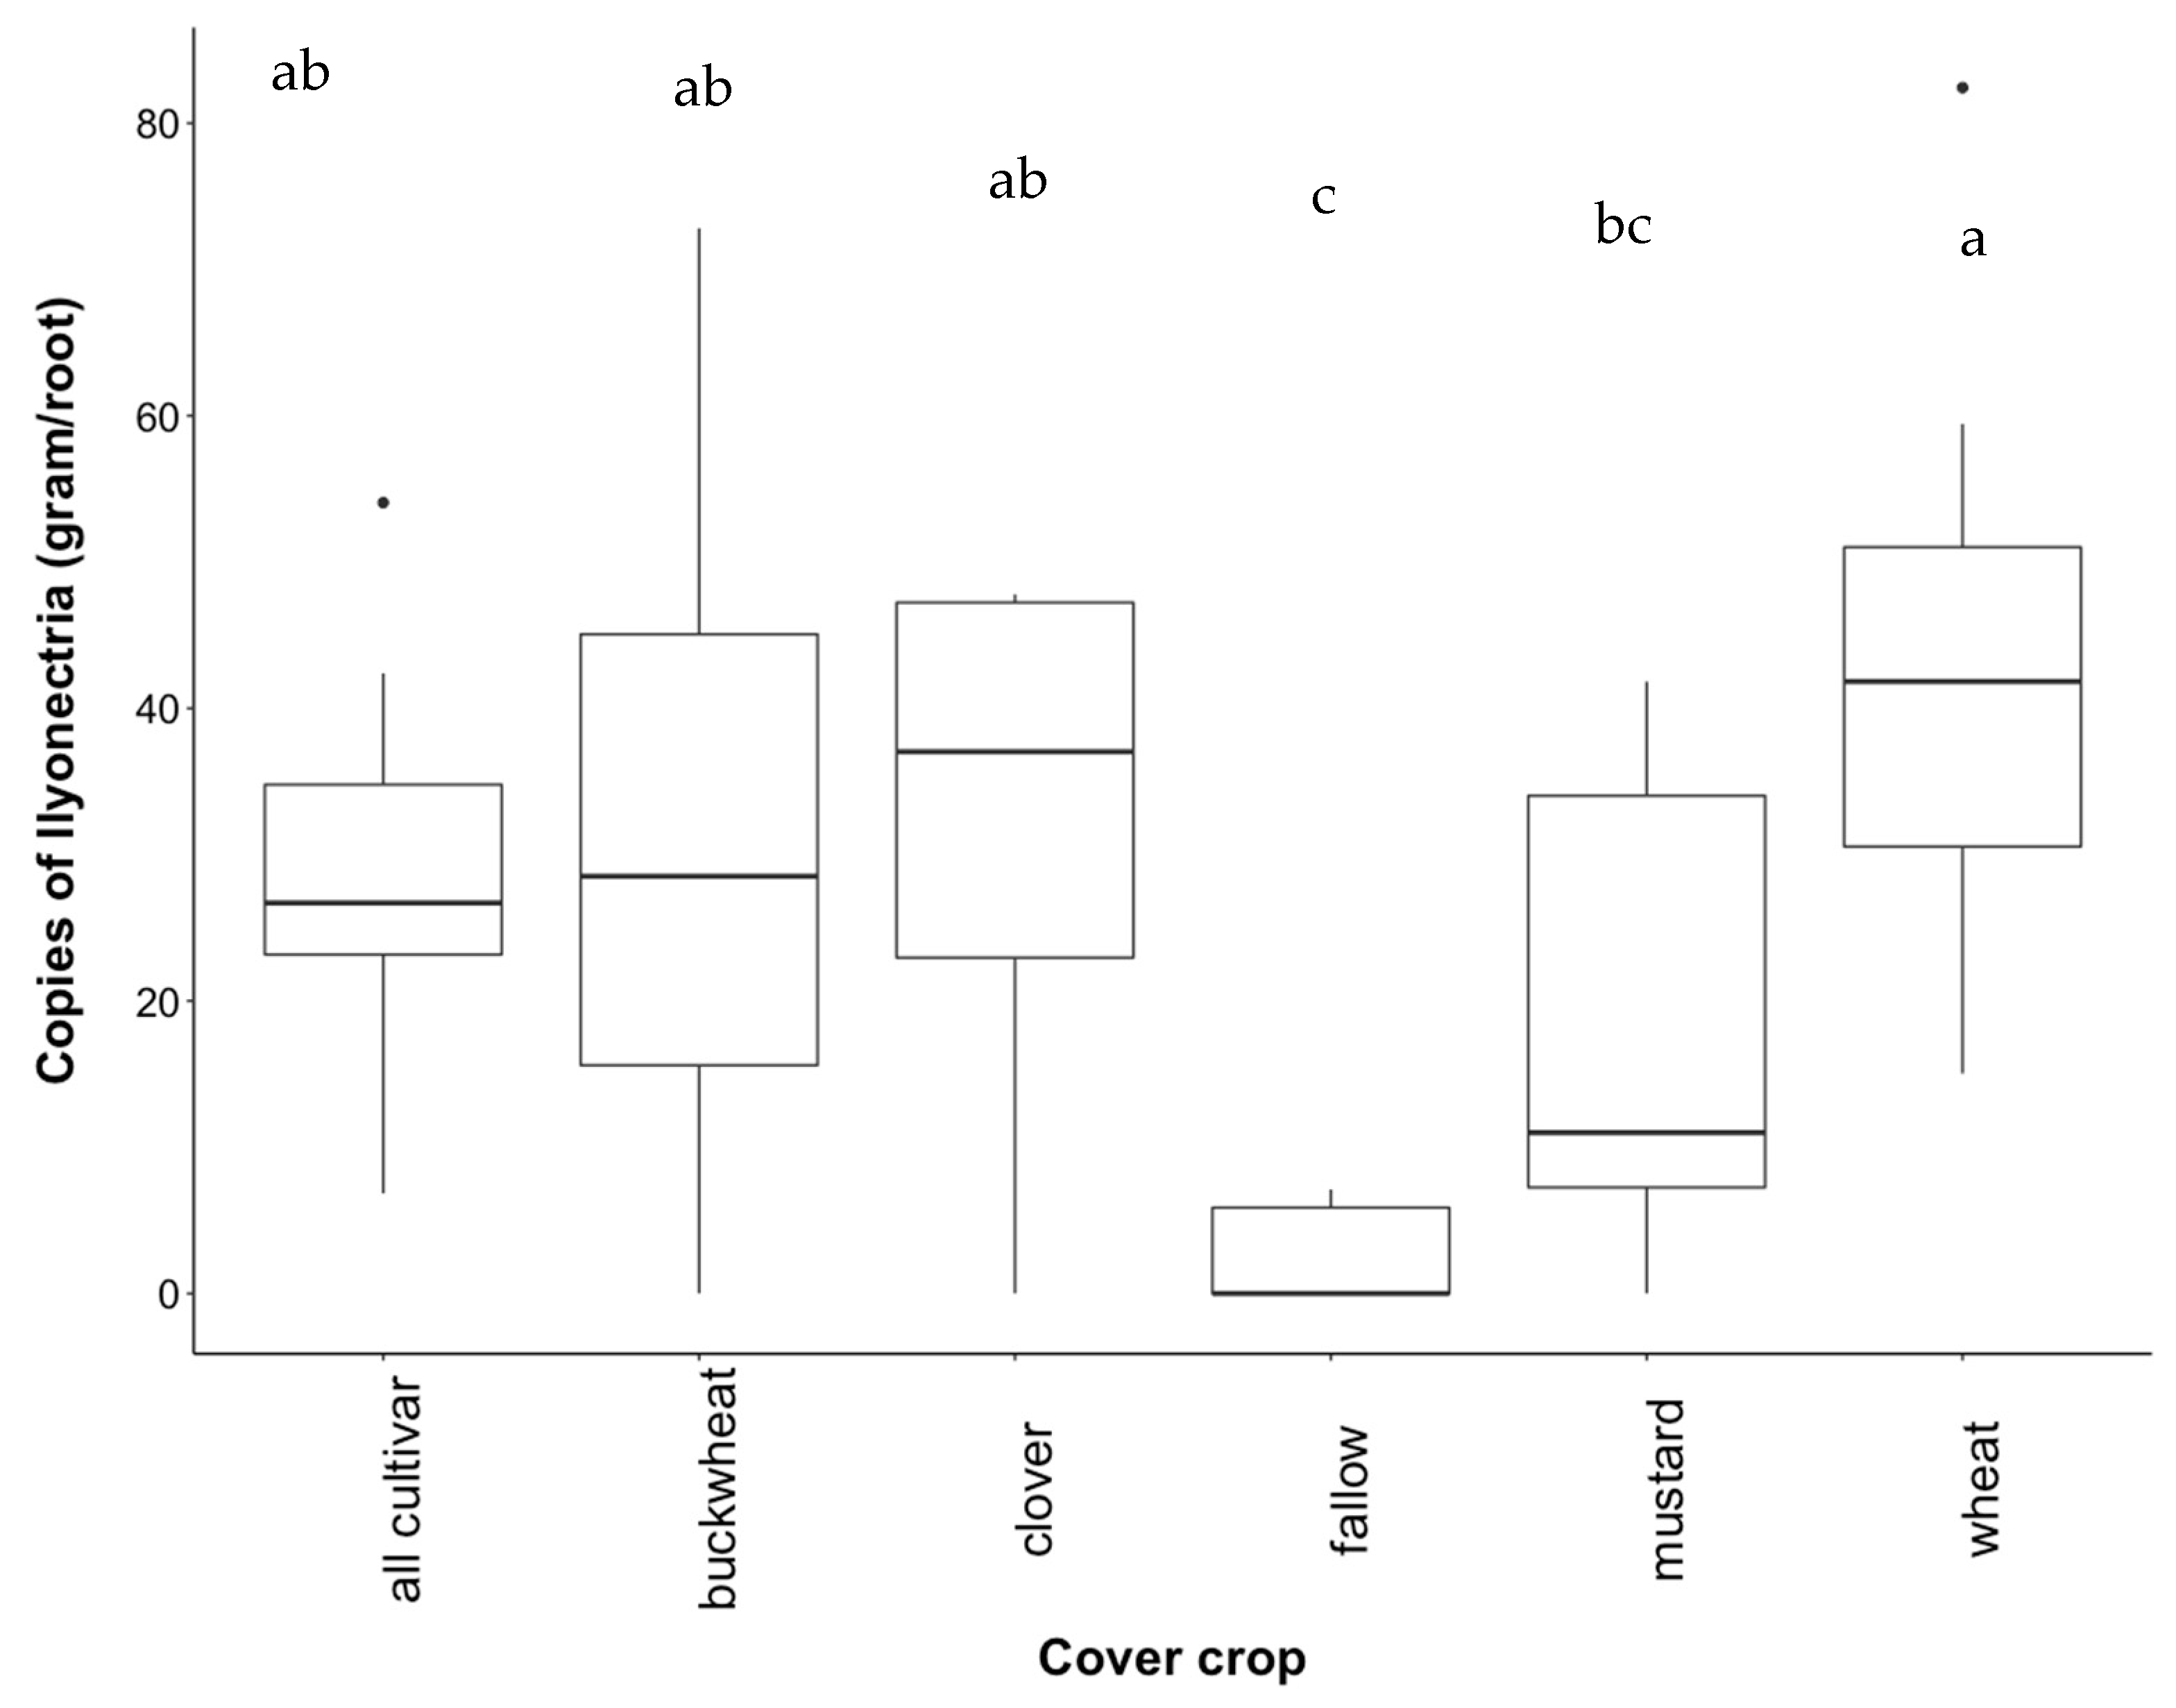
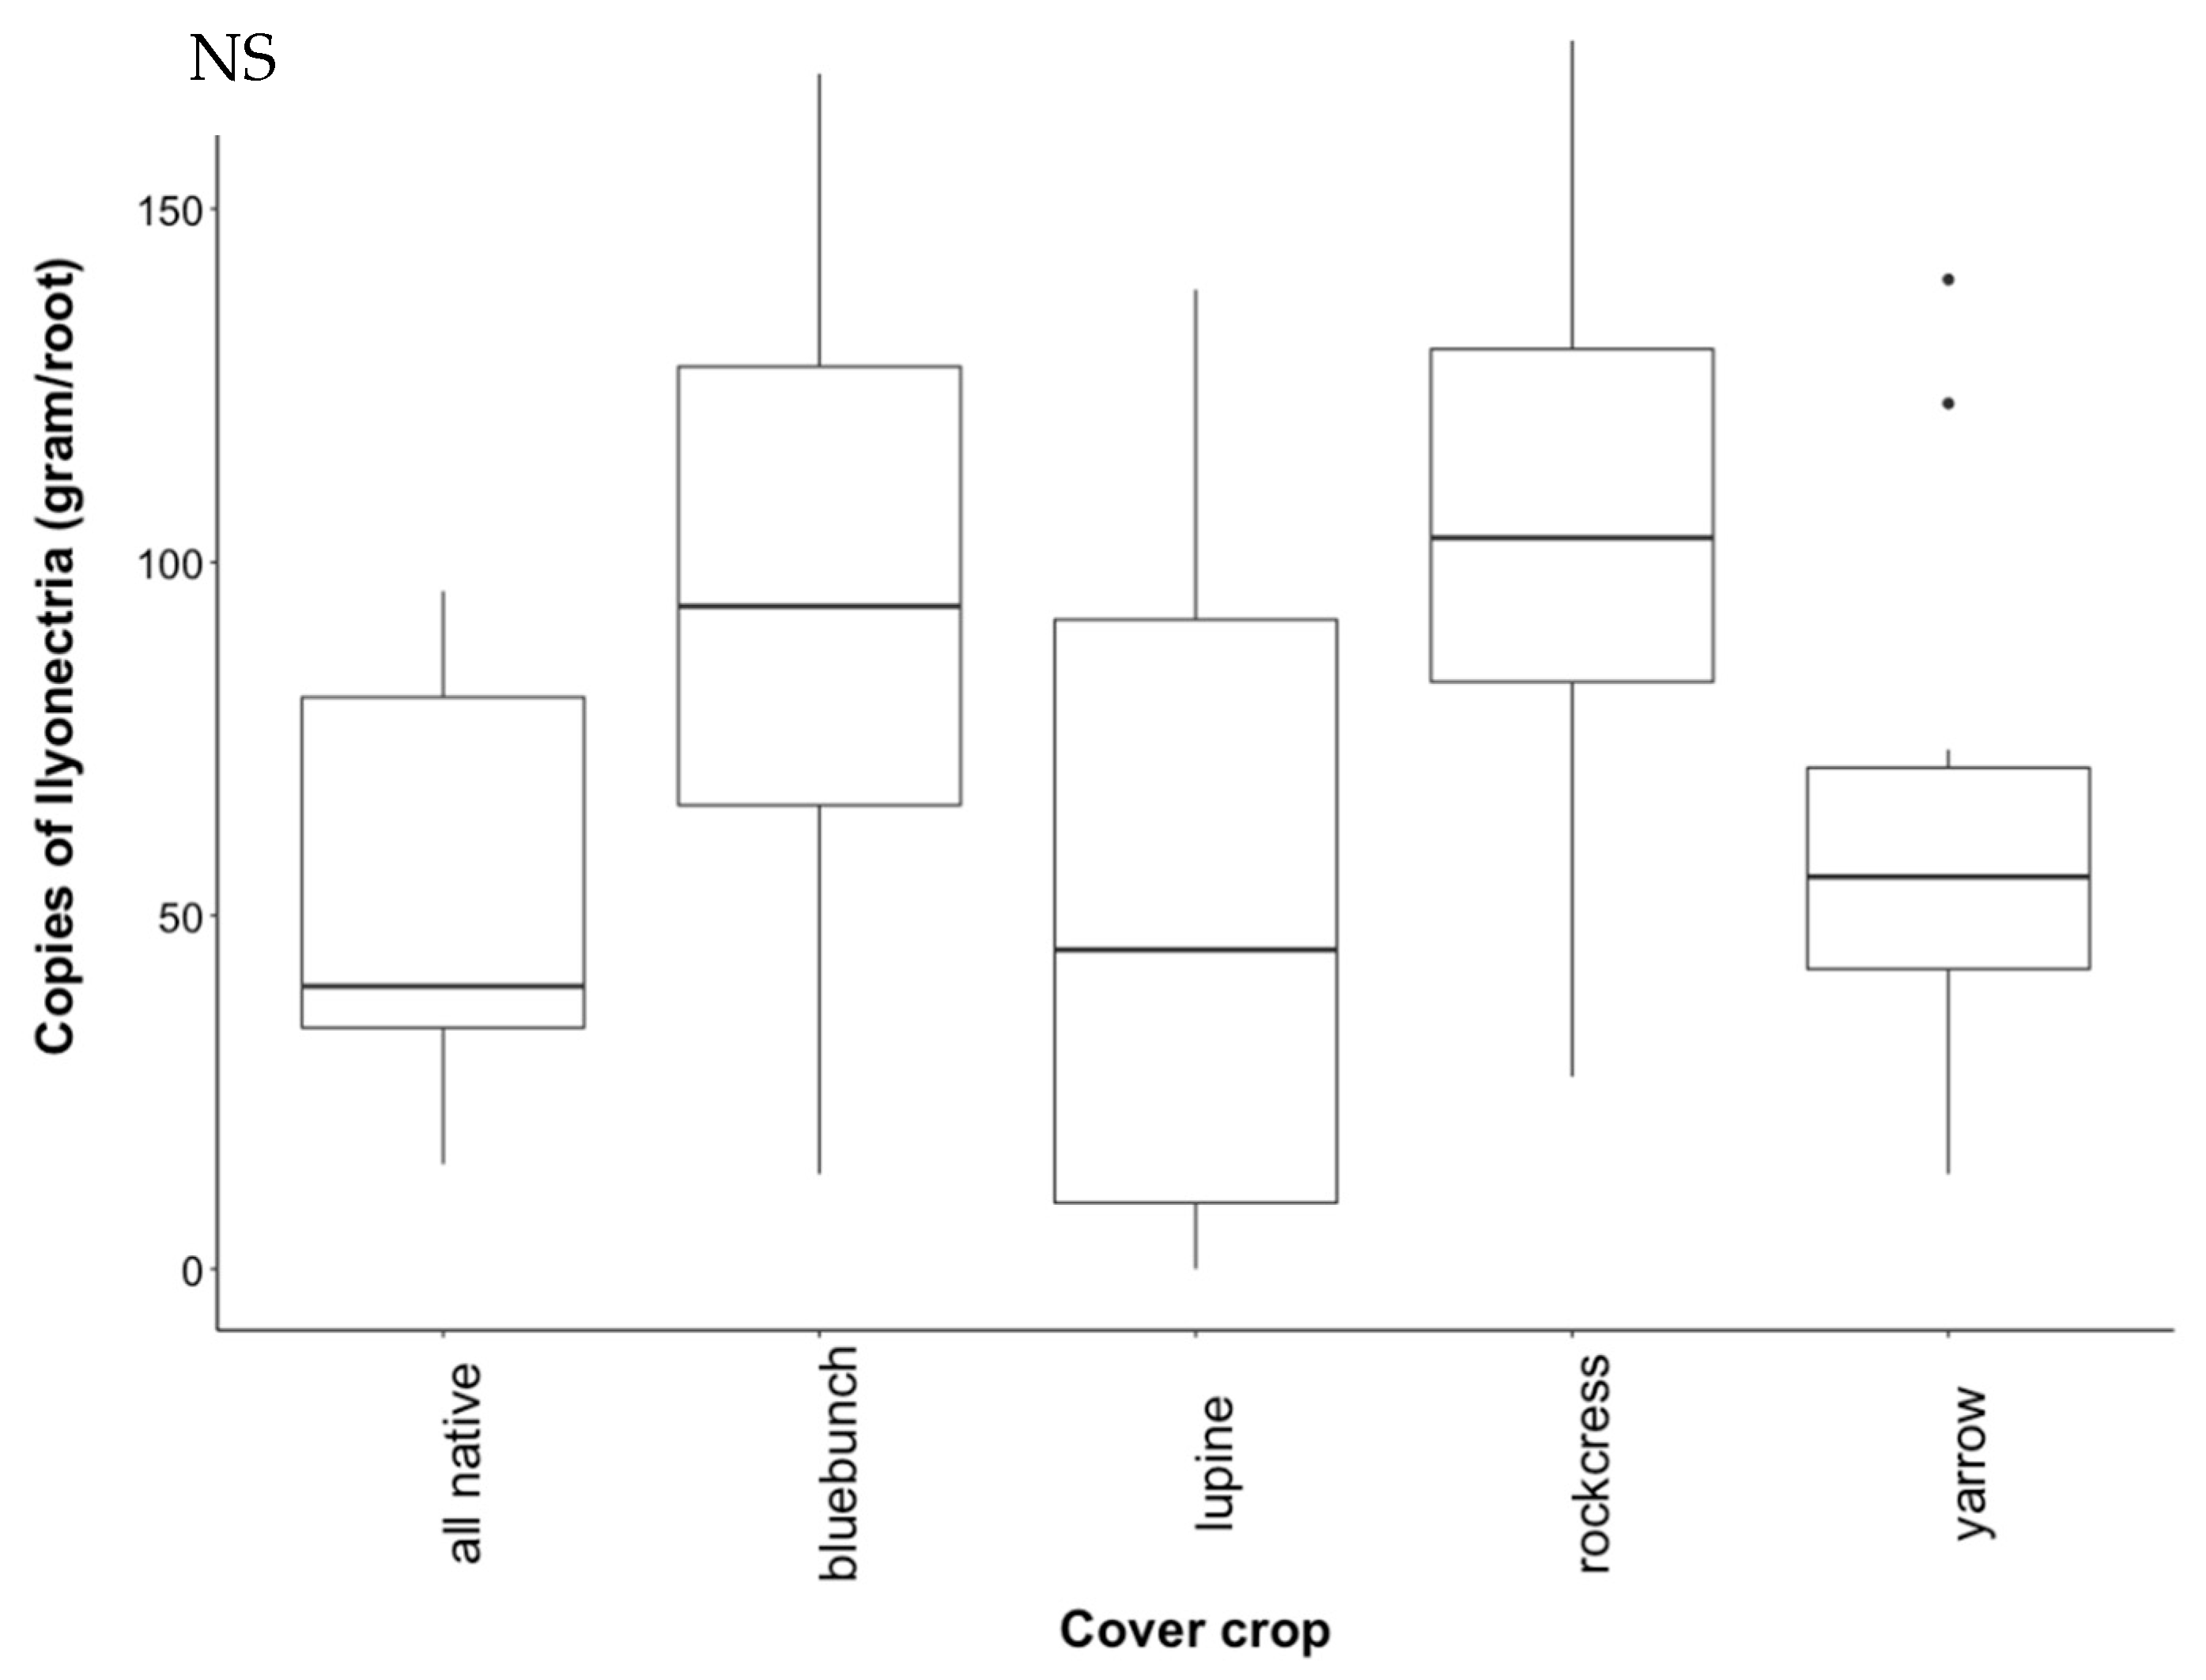
3.4. Recovery of Ilyonectria from Roots

Contrary to predictions, I. liriodendri abundance did not change significantly in the native study (Figure A4). Ilyonectria abundance from grapevine roots was extremely variable in monocultures, with silky lupine displaying the most variability. Roots from rockcress and bluebunch wheatgrass showed the highest abundance of I. liriodendri, followed by white yarrow and all native (Figure A4).
Contrary to our hypothesis, abundance of I. liriodendri did not decrease when cultivar plants were grown together (Figure 3). Abundance of I. liriodendri was lowest in white mustard roots, which was consistent with the lower necrotic damage observed in grapevine cross sections from the same treatment. Abundance of I. liriodendri in white mustard was significantly lower compared to wheatgrass (p = 0.041) (Figure 3). Consistent with the digital PCR results from soil samples, roots from uninoculated fallow treatment had either zero or very small copy numbers of target DNA.

3.5. Sequence Results

A total of 2089 amplicon sequence variants (unique DNA sequences) with a combined frequency of 875,526 were present from the 111 soil samples after initial denoising and filtering. The minimum feature count per sample was 769 (bluebunch wheatgrass), while the maximum was 17,904 (soil before cover crop conditioning). The highest feature occurrence was 170,112 across all 111 samples while eight features occurred only once (0.004% of all features). A total of six phyla (one unidentified), 19 classes, 40 orders, 68 families, and 76 genera were recovered from all soil samples (Figure A5 and Figure A6). Ascomycota yielded the highest relative frequency, followed by Basidiomycota, Mortierellomycota, and Chytridiomycota, which were present in all 111 samples. Glomeromycota was present in 78 samples, followed by an unidentified phylum that was observed in 94 samples.

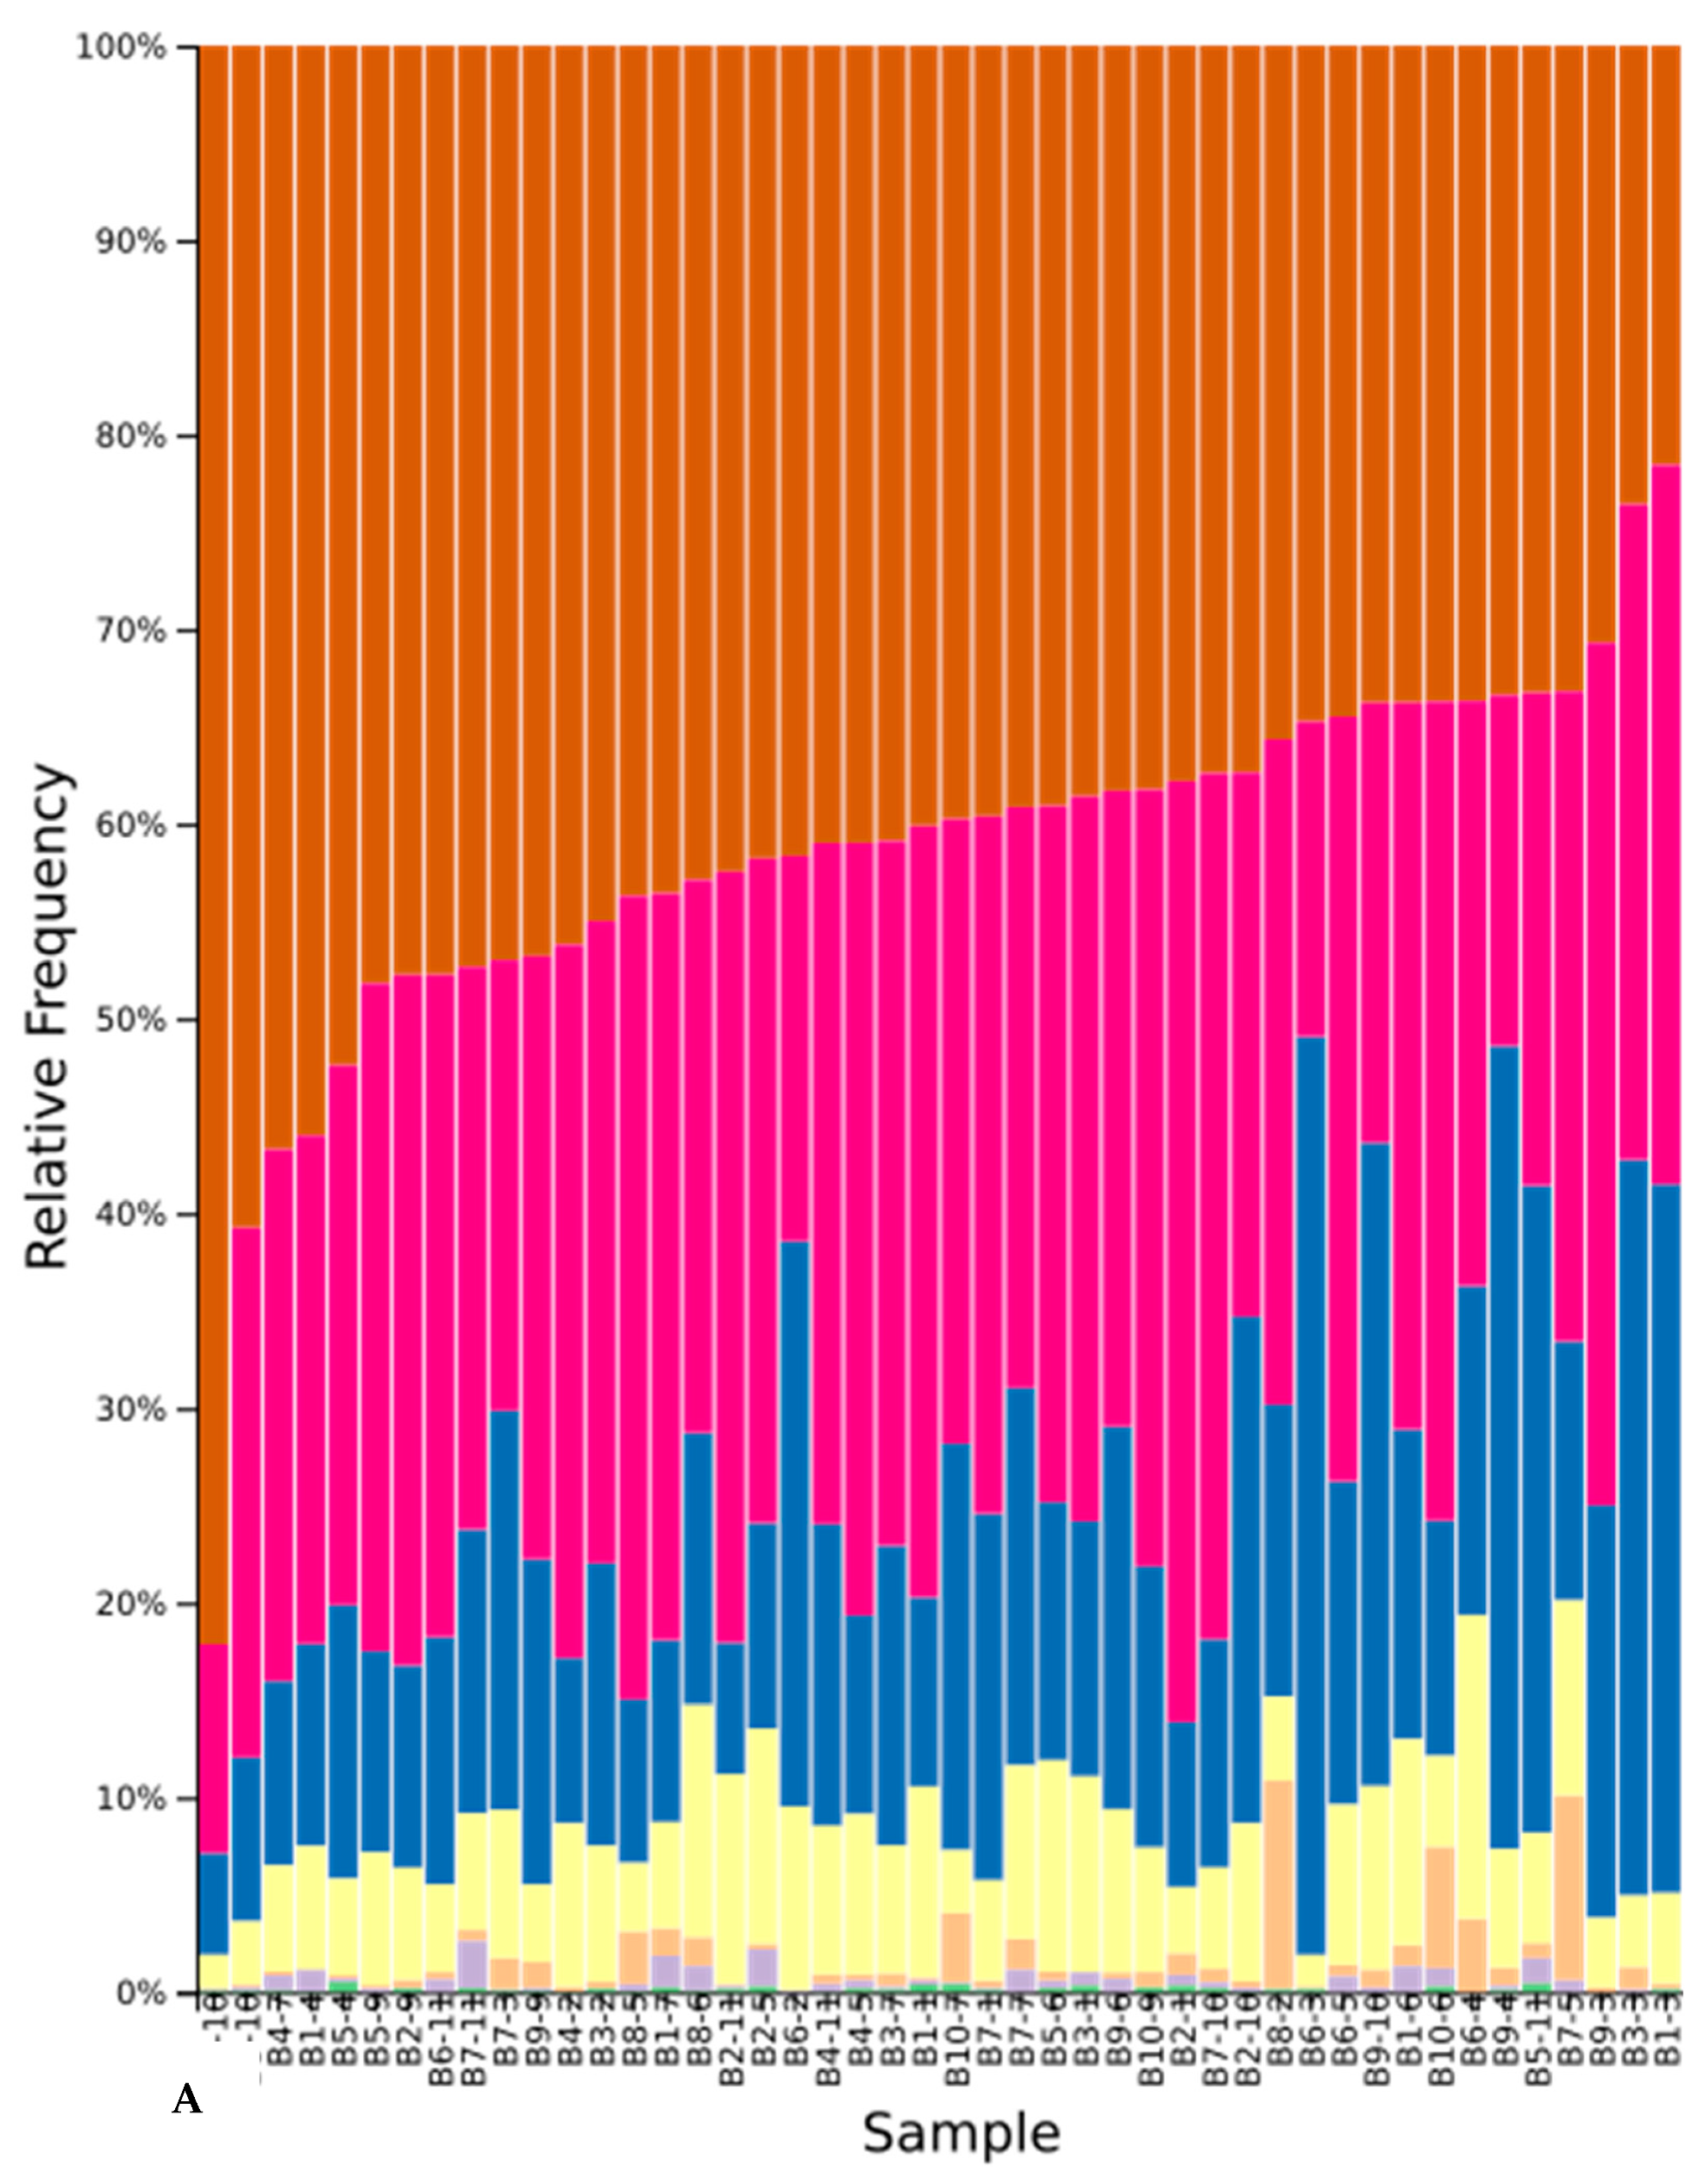
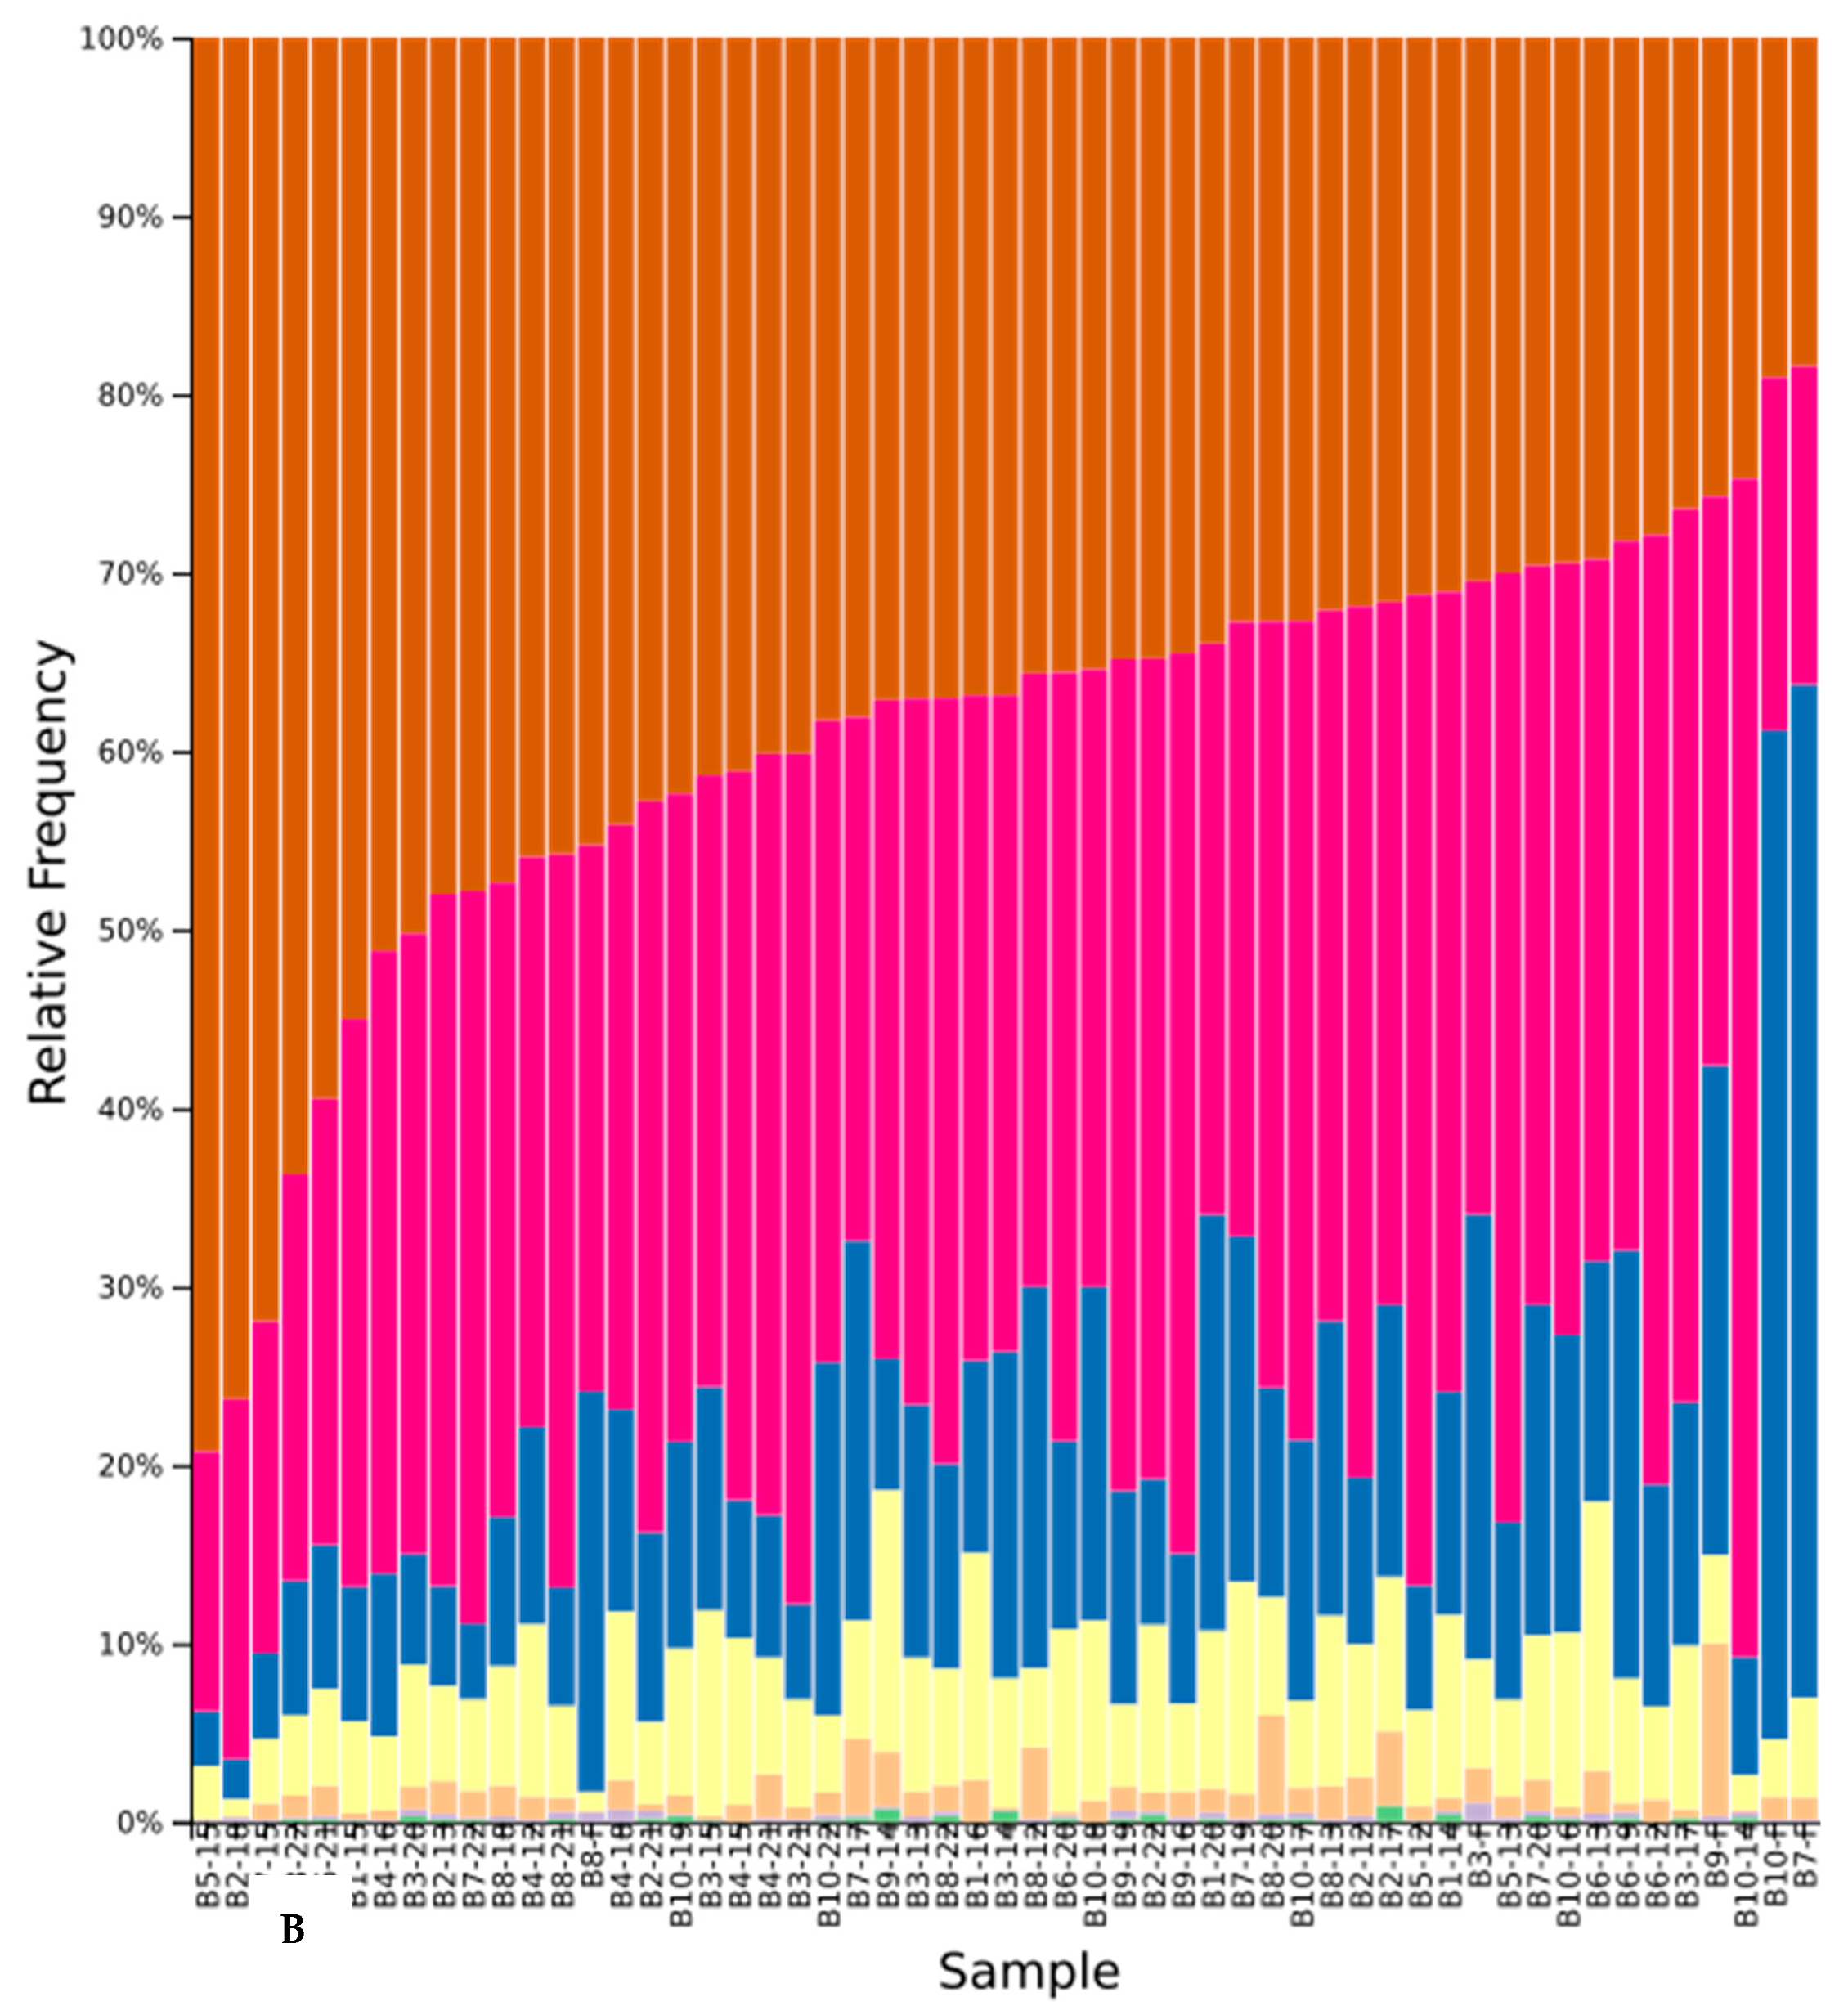
3.6. Effect of Cover Crops on Fungal Diversity

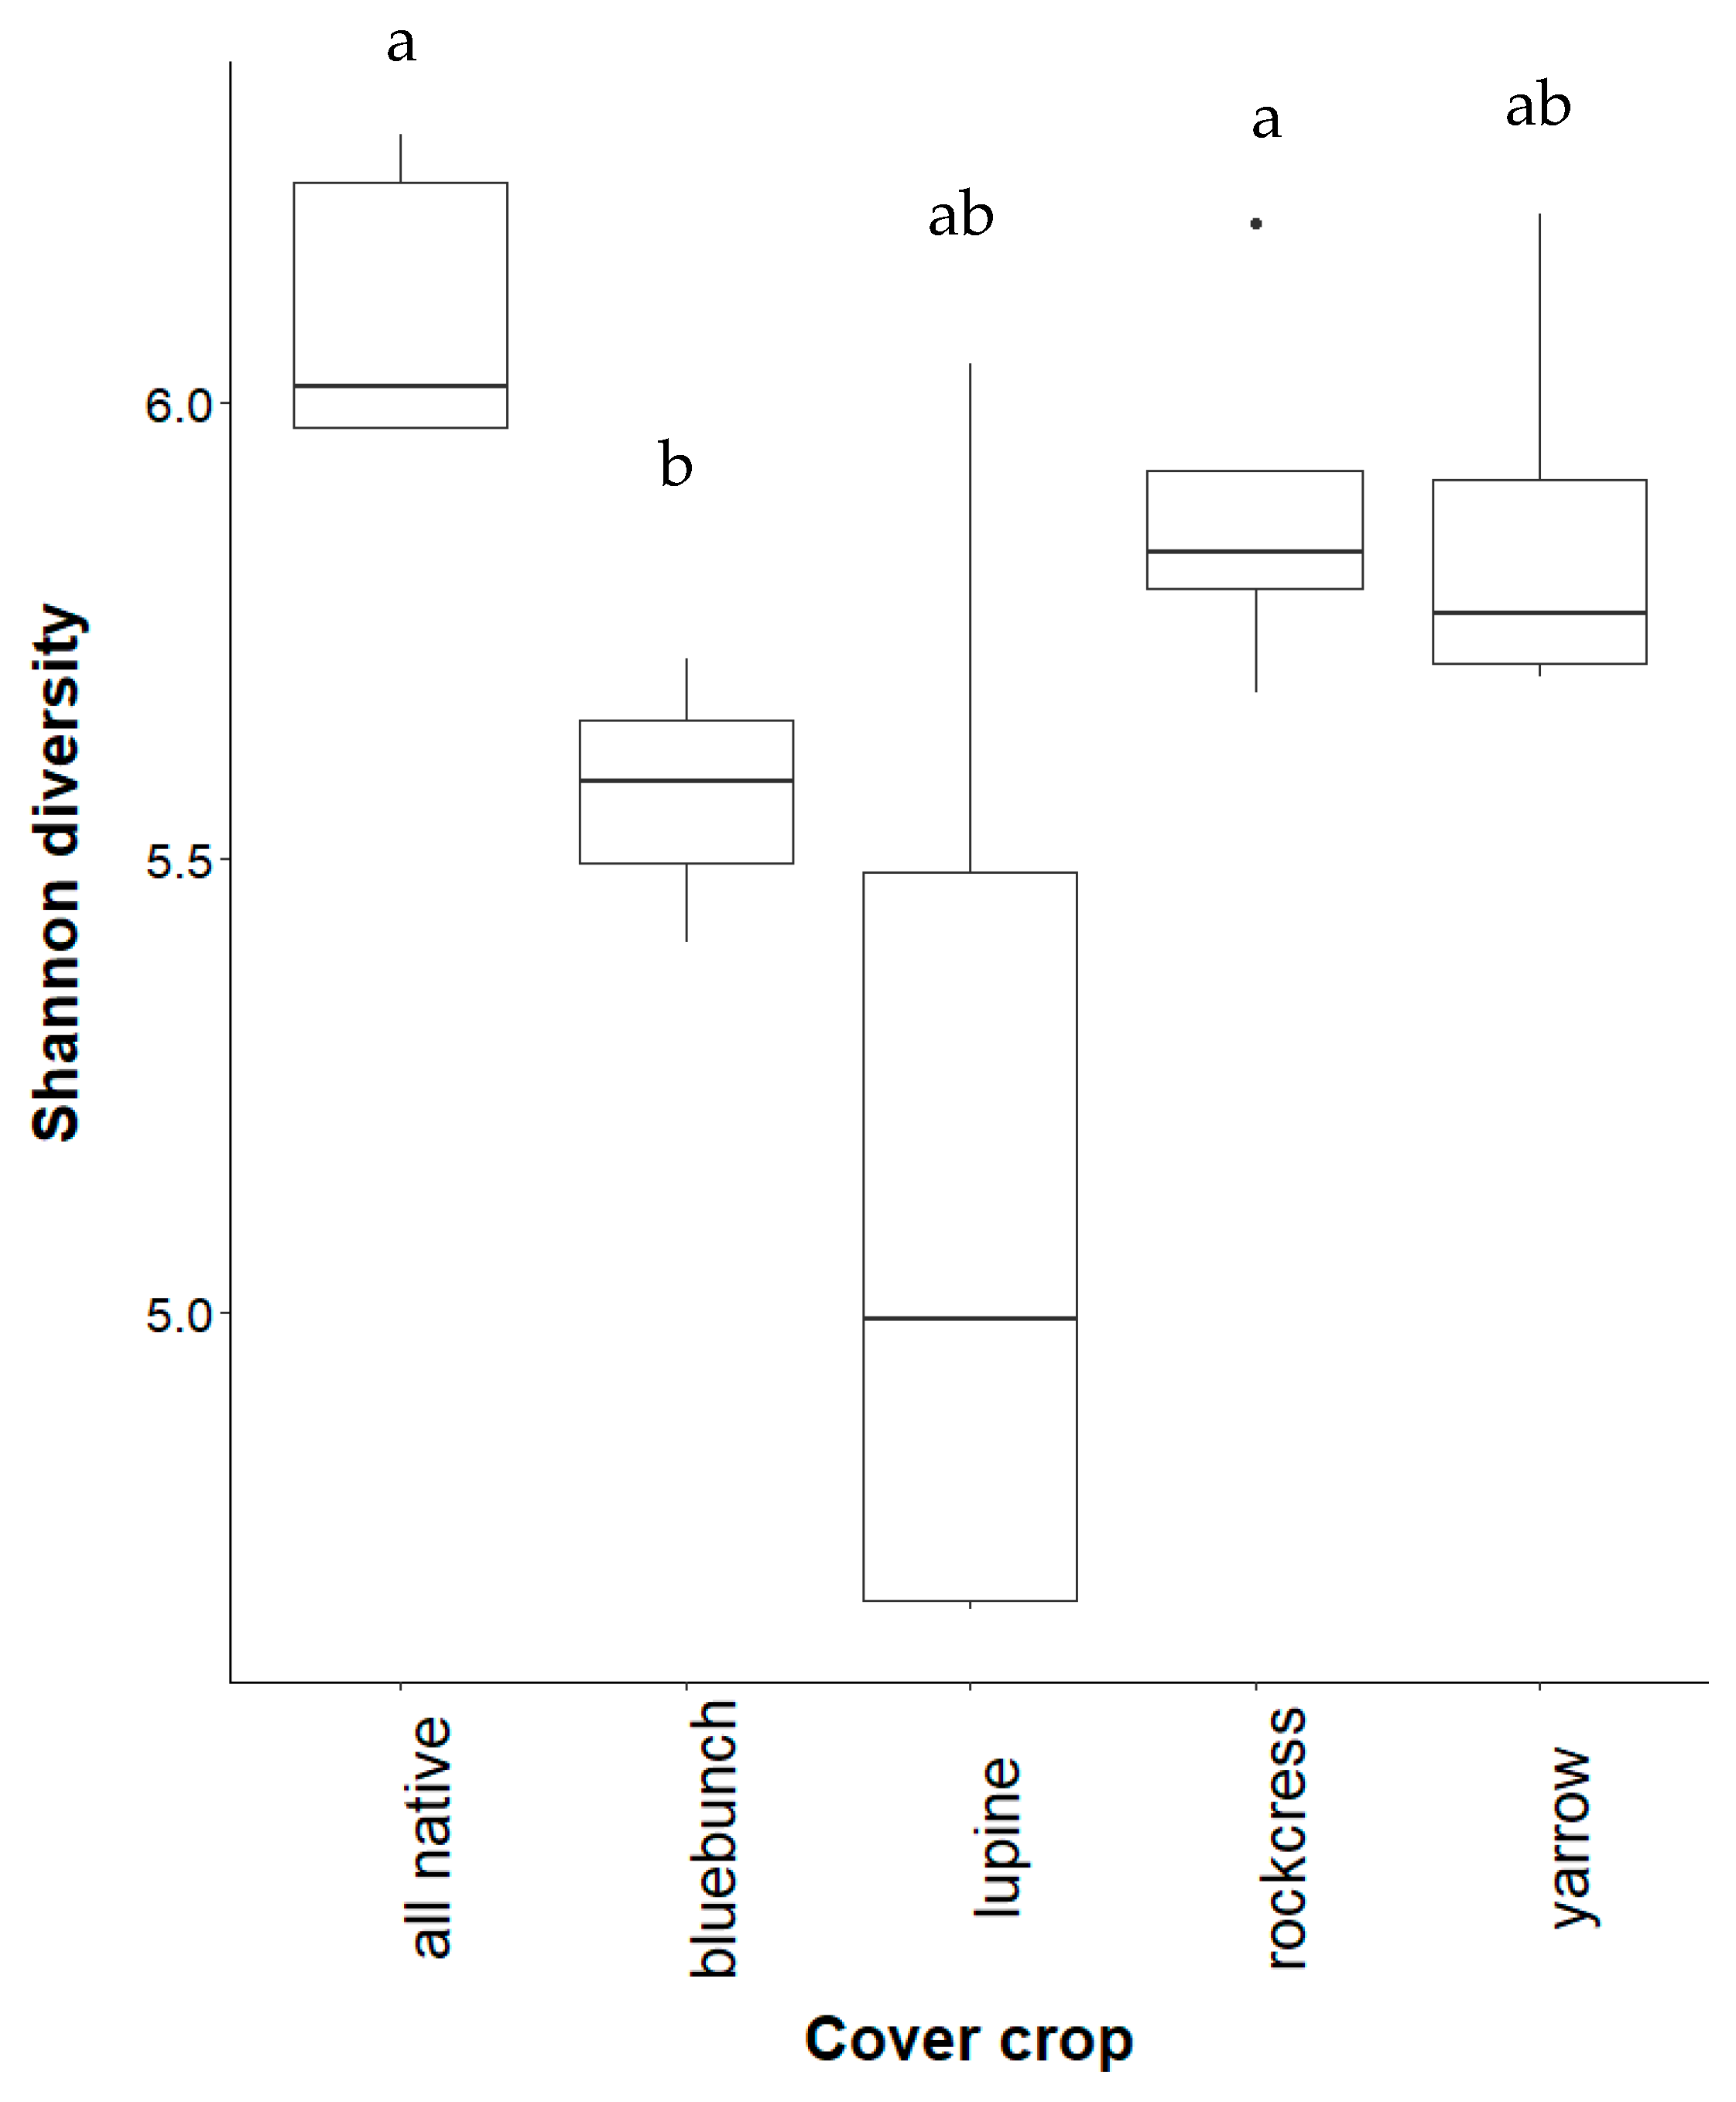
3.6.1. Alpha Diversity

As predicted, alpha diversity of rhizosphere fungi increased with cover crop diversity in the native study. Silky lupine yielded the lowest fungal diversity followed by bluebunch wheatgrass. Fungal diversity was highest when all plants were grown together (Figure 4). Contrary to predictions, fungal diversity did not change with cultivar cover crops. Fungal communities were less diverse under crimson clover while buckwheat and wheatgrass were similar to the all species treatment. As expected, fallow soil contained the lowest diversity measurement, although no significant differences were detected between treatments (Figure A6).

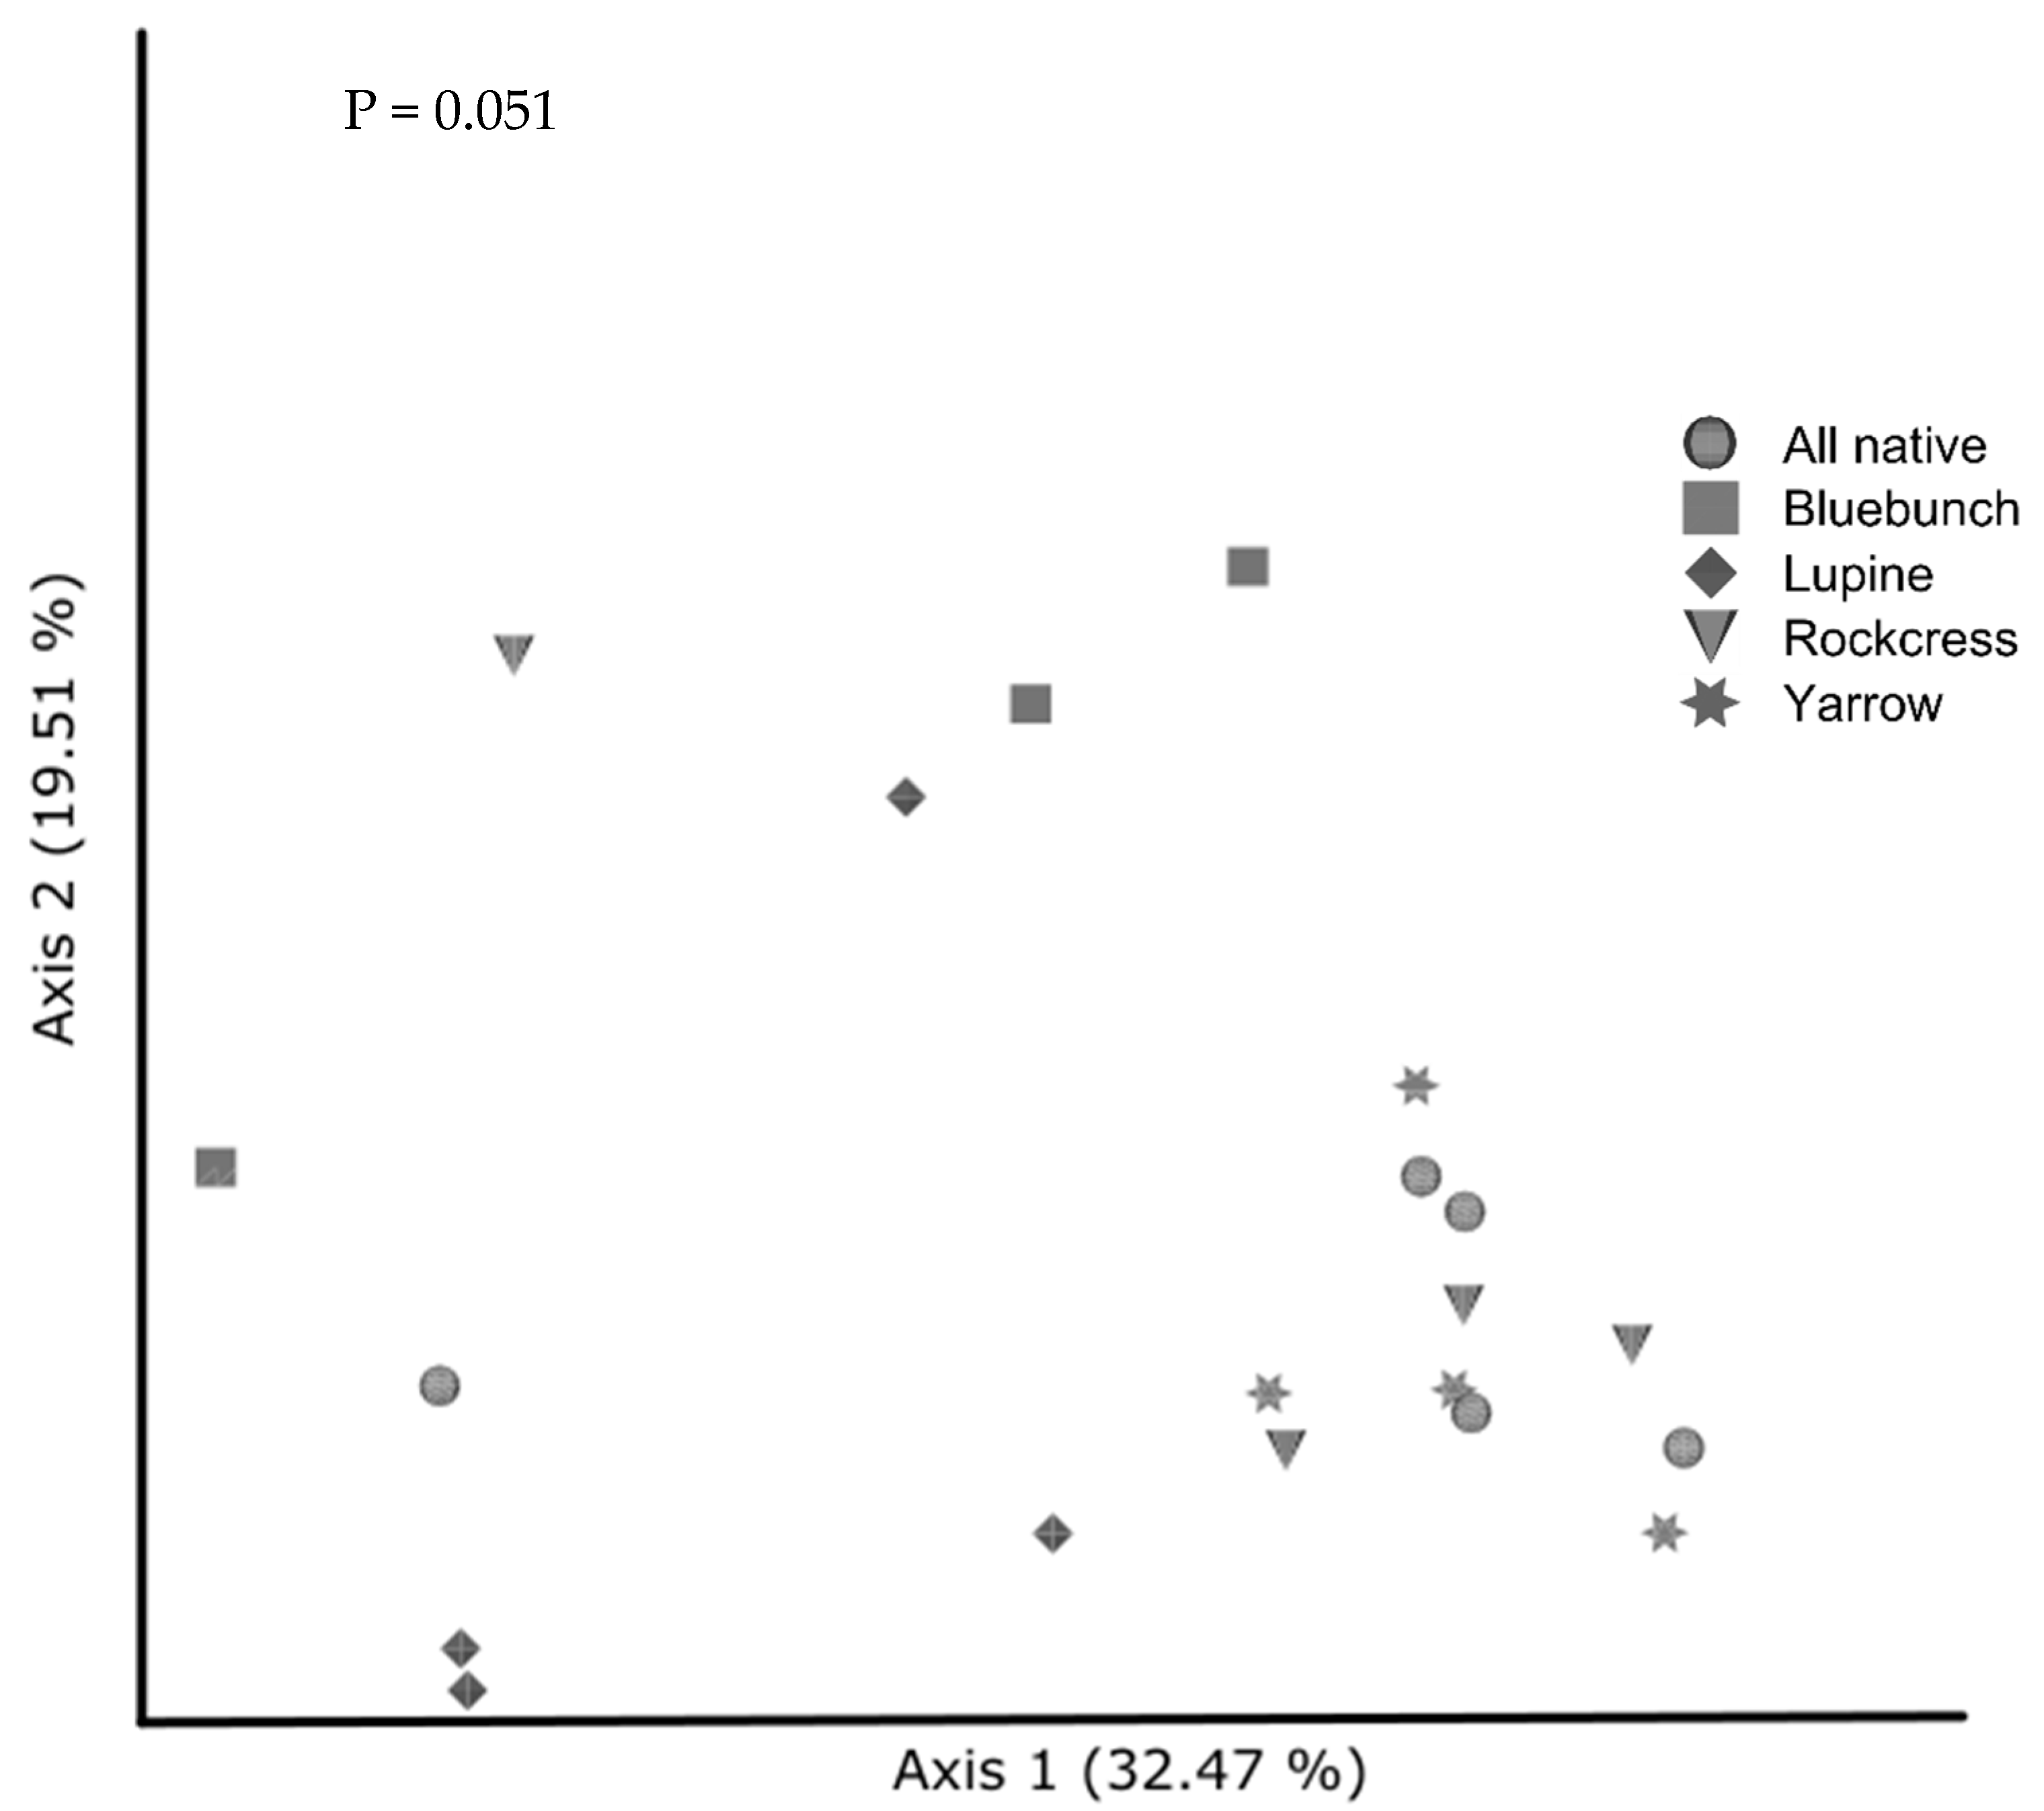
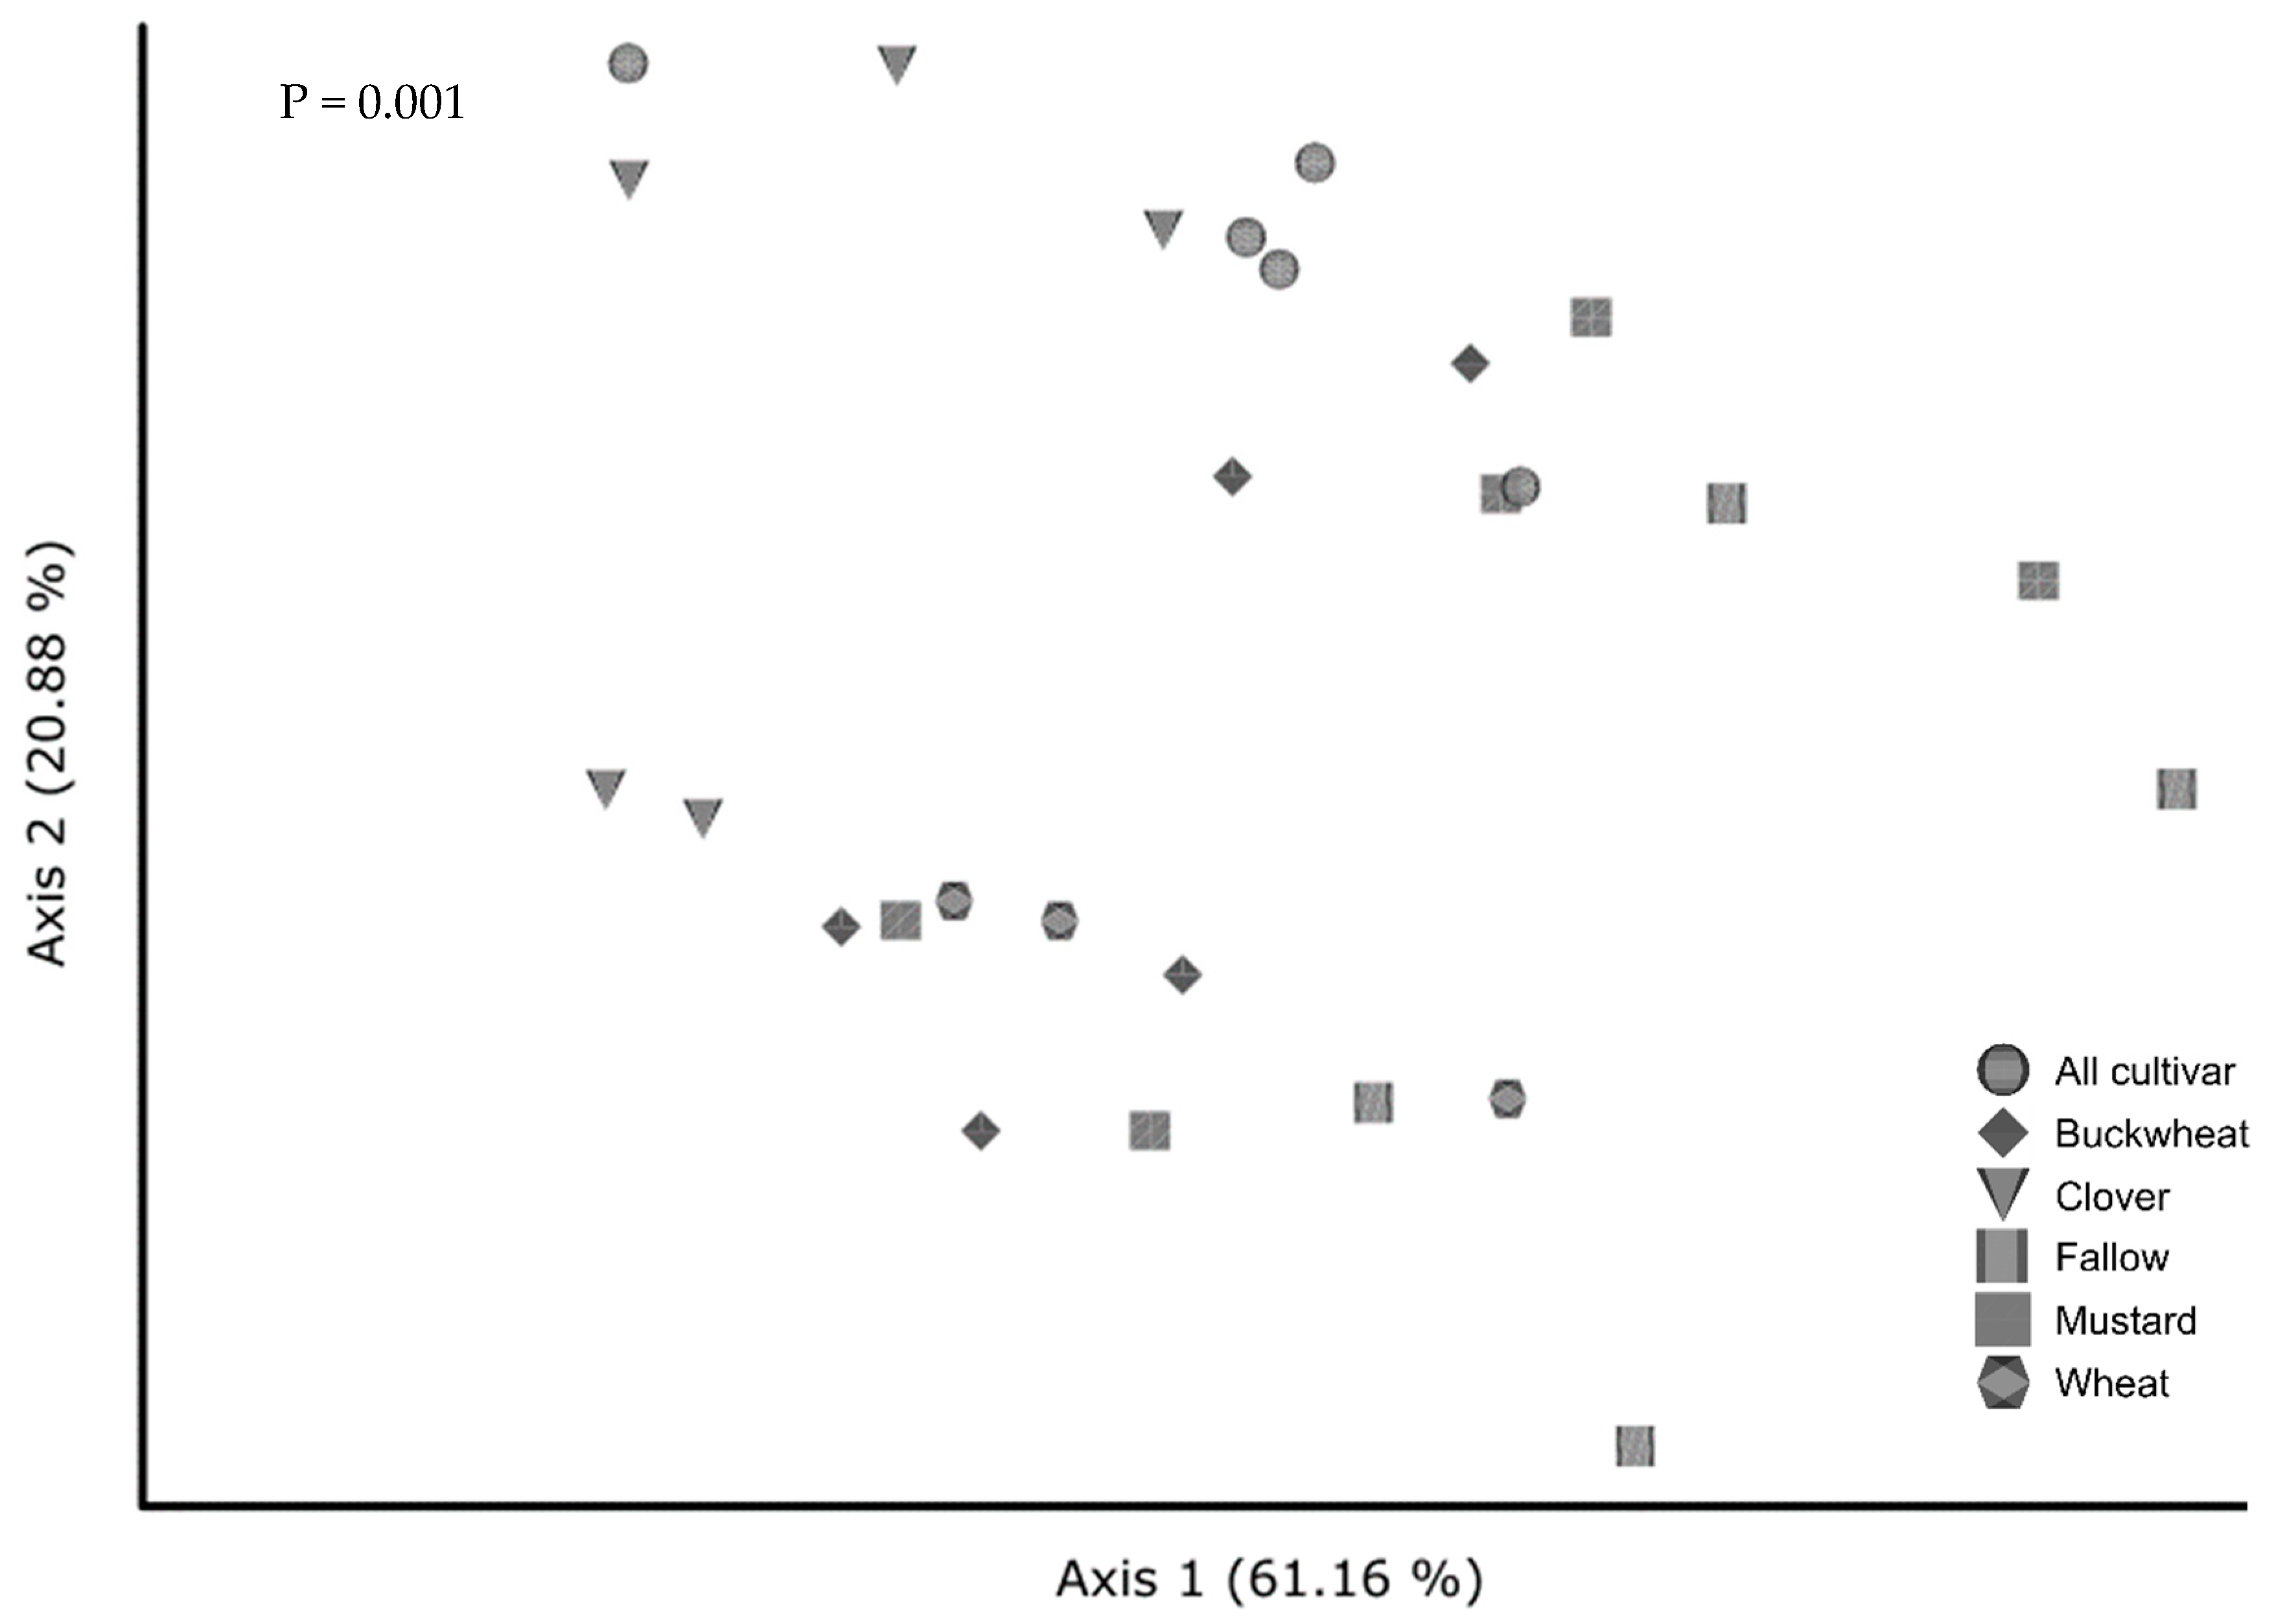
3.6.2. Beta Diversity in Native and Cultivar Studies

Contrary to predictions, fungal community composition was similar among most native monocultures and when all plants were grown together (p = 0.051). However, community composition under bluebunch wheatgrass was distinct from white yarrow (p = 0.036) (Figure 5). Likewise, fungal community composition under silky lupine was different from white yarrow (p = 0.056). Dispersion of fungal communities (clustering) was similar under native monocultures (p = 0.881).
In the cultivar study, cover crop diversity changed community composition only in some treatments (Figure 6). All cultivar communities were distinct from fallow (p = 0.005) and wheatgrass (p = 0.017) but not others. Overall dispersion of fungal communities from monocultures was similar (p = 0.183).

4. Discussion

4.1. Effect of Cover Crop Diversity on Root Necrosis

Contrary to our hypothesis, cover crop diversity was not associated with necrotic root symptoms in self-rooted Chardonnay grapevines. This was true in both the native and cultivar study. One possible explanation is that the biotic properties of the soil did not change enough due to the short soil conditioning phase by cover crops. In these studies, cover crops were grown for three to four months, which translates to approximately half a growing season in the Okanagan Valley [77]. Since plant–soil feedback is not instantaneous [78], perhaps more time was needed to develop beneficial and/or antagonistic microbial communities, leading to a delay in their suppressive effects. Eisenhauer et al. (2012) [79] found that benefits from soil biota were more pronounced in long term grassland studies (four years) due to successional changes in soil microbial communities. Vogel et al. (2019) [80] further elucidated the effect of time on plant–soil feedback by showing that microbial biomass was greater in soil with a 14-year conditioning period by a specific plant community compared to new soil conditioned by the same plant community for only one year.
Another explanation could be the lack of cover crop incorporation into the soil, resulting in very little competition from other saprophytic fungi. Decomposers represent a significant group among soil microbial life and contribute to multiple ecosystem services [81]. In this experiment, we did not incorporate any litter at harvest. Instead, all cover crop material was removed including roots, which would have limited decomposer communities [82]. Most importantly, litter can contain symbiotic plant endophytes including Trichoderma, which are present during active plant growth and are also known to decompose litter [83,84]. The presence of Trichoderma could reduce GTD pathogens if they were surviving as saprophytes in plant litter, although further research is needed to determine whether stimulations of decomposer communities can reduce GTD pathogens.
In this study, the basal end of each cane was not covered with wax or another barrier, leaving a large area of vascular tissue exposed to pathogens. Such a large amount of exposed tissue in the soil would have facilitated infection even in the presence of antifungal exudates or antagonistic microbes, as below-ground wounds can serve as entry points in grapevines [85]. This is especially the case in pathogen transfer above ground in which pruning wounds left uncovered act as entry points for airborne spores [5,86].
White mustard, when grown as a monoculture, was the only cover crop that reduced necrotic tissue damage in grapevine roots. This plant matures quickly, is a high-biomass crop [87], and is known for its production of sulfur-containing glucosinolates including glucoerucin and glucoiberverin [88]. White mustard products have previously been associated with the suppression of grapevine and tree fruit pathogens [89,90,91]. The antifungal chemicals produced by white mustard are known to inhibit spore germination [92] and mycelial growth [93], which may have resulted in the lower incidence of necrosis observed. These results align with previous biofumigant studies that implement brassicaceous cover crops and their products [31,89,94,95].
In contrast, when white mustard was grown with other cover crops, necrotic damage was not reduced. Since each pot was standardized to four plants, only two white mustard plants grew in the soil, which would have reduced glucosinolate production. This likely reduced the concentration of antifungal compounds in the soil, allowing pathogens to proliferate more easily.
In the native study, Holboell’s rockcress (a brassicaceous plant) was not associated with lower percentages of necrotic tissue. While the suppressive potential of Holboell’s rockcress has not been studied in an agricultural setting, the plant matures slower due to its perennial nature, and has many natural predators including fungi [96]. Although rockcress did not show any signs of suppression in this short-term study, its persistence over multiple growing seasons and/or its degradation after maturity may contribute to the mitigation of soil-borne pathogens in vineyards.

4.2. Effect of Cover Crop Diversity on Abundance of Ilyonectria

In both studies, cover crops did not correlate with the abundance of I. liriodendri in the soil when grown by themselves or when grown together. This could partially be due to the absence of roots in the first centimeters of soil, where samples were taken. Overtime, the initial concentration of 1 × 10⁶ conidia per milliliter would have diffused as pots were watered, causing spores to travel to deeper depths in the pot. Since the majority of root biomass was found below five centimeters, any effect of root exudation would have been more noticeable at lower soil depths but limited on the surface.
Consistent with percent necrotic tissue, abundance of I. liriodendri was lower in the white mustard monocultures. At the time of harvest, white mustard cover crops had gone to seed and had started to senesce, a period in which the metabolism of glucosinolates into antifungal isothiocyanates occurs. The breakdown and release of isothiocyanates from white mustard perhaps inhibited spore germination, reducing available inoculum during the grapevine growth stage. Antifungal compounds from brassicaceous crops can stay active for a period of 25–30 days [93,97] before they start to break down. Suppressive effects of white mustard may have been more pronounced had the plant been left to decompose in the soil [93,95,98].
In this study, Ilyonectria abundance in white mustard treatments was significantly lower than wheatgrass. Wheat is used in vineyards to manage soil erosion, prevent frost damage, and build organic matter [99]; however, wheat and other plants growing in a vineyard may act as off-target hosts, as has been observed in South African nurseries [48] and in Spanish vineyards [100]. In these studies, we did not examine cover crop roots for pathogens; however, it is possible that some acted as off-target hosts [48,100]. If cover crops can be colonized by I. liriodendri and/or other pathogens, this could maintain the spore bank and allow them to persist in soils, increasing the risk of infection. Creating a suppressive environment may require more than cover crop implementation. Changes to nutrient and watering regimes, pruning time [101], or inoculation with beneficial microbes and nearby soil may also reduce pathogens [102,103]. Indeed, there is a diverse array of fungal pathogens that infect grapevine tissues at various growth stages, which means further research is required to elucidate whether particular combinations of cover crops and pathogenic fungi can be problematic in vineyards and nurseries.

4.3. Effect of Cover Crop Diversity on Fungal Diversity

Alpha diversity of rhizosphere fungi increased with cover crop diversity in the native study but not cultivar study. The fact that microbial diversity changed under native but not cultivar cover crops perhaps implies that native plants are more dependent on resident fungi, and specifically mycorrhizal fungi, compared to plants introduced [104,105] through coevolutionary mechanisms [106]. Alternatively, carbon inputs and exudation of cultivar crops could have promoted specific fungi though positive plant–soil feedback, limiting diversity [107,108]. Since mycorrhizal fungi and resident bacteria can heavily influence functional traits—including nitrogen content, stress tolerance, morphology, leaf longevity, and pathogen resistance [109]—the presence of native plants may have stimulated these communities more than the cultivar varieties in order to maximize their fitness. Indeed, Klironomos (2003) [110] found that the frequency of positive responses from foreign plants was reduced when paired with resident AM fungi compared to the more-even distribution of responses observed when resident AM fungi and plants were paired. Alternatively, fungal diversity in the cultivar study may have been limited because the introduced plants increased the abundance of specific fungi. This has been observed in invasion studies in which the invasive plant experiences positive plant–soil feedback that allows it to outcompete native plants [107,108].
It is also possible that fungal diversity changed more under native cover crops due to a longer conditioning phase. Soil was conditioned by cultivar plants for three months whereas native plants were given four, allowing an additional month for fungi to respond to exudation, rhizodeposition [111], and root turnover [112]. In addition, root exudates and carbon deposits change as plants develop, which affects microbial communities [113]. The fact that cultivar plants matured quickly in our study perhaps led to microbial turnover whilst inputs from native plants were more consistent, allowing communities to develop overtime.
Since soil fungi are saprophytic, diversity may have increased if cover crops were left to decompose [60]. This likely would have result in compositional differences in fungal communities, as decomposers are strongly affected by plant litter type [114]. However, despite the increase in fungal diversity in cover crop mixtures and when all plants were grown together, fungal diversity was not associated with incidence of root necrosis or abundance of I. liriodendri in soil or roots.
Regarding pairwise interactions between treatments, alpha diversity was significantly higher under rockcress compared to bluebunch wheatgrass. Brassicaceous crops can inhibit fungal activity due to hydrolysis products of the glucosinolates they produce [115]; however, this is often limited to fungal pathogens [97], and is not widely observed in symbiotic fungi [116,117]. The fact that fungal diversity under rockcress was comparable to that of white yarrow and all plants combined suggests that rockcress did not inhibit fungi as much as other brassicaceous crops. However, alpha diversity under white mustard was also similar to other cover crops, meaning factors other than glucosinolate content contributed to alpha diversity.

4.4. Effect of Cover Crops on Community Composition

In the native study, fungal communities were dissimilar only for bluebunch wheatgrass and yarrow. Historically, white yarrow has been used as a traditional medicine in many cultures because of the phenolic compounds it produces [118] and because its extracts are known to suppress the in vitro growth of pathogenic bacteria and fungi [119]. On the contrary, bluebunch wheatgrass is not as widespread as yarrow [120], and its competitiveness is more dependent on rhizosphere microbes [121]. Given the different life history strategies employed by these plants, it is not surprising that their soil microbial communities differ.
In the cultivar study, some cover crops appeared to be more influential than others. For example, fungal communities in clover soil were distinct from those in white mustard, wheatgrass, buckwheat, and fallow soil, but not when all plants were grown together. Crimson clover produced highly branched root systems with the most above-ground biomasses out of all cover crops. Legumes are known for their mycorrhizal attributes [122], and have previously been associated with increases in fungal diversity [123], abundance of AM fungi [124], and saprophytic fungi [125]. White mustard, on the other hand, typically reduces the abundance of soil fungi relative to controls [126], although in this experiment the community composition under mustard was similar to fallow, buckwheat, wheat, and all plants grown together. At the same time, this treatment was associated with a lower incidence of root necrosis, which suggests it reduced the overall abundance of fungi associated with disease [93,97].

5. Conclusions

After a short conditioning period, we found that cover crop diversity was not associated with incidence of disease in grapevine roots. Incidence of disease was instead associated with white mustard, a common brassica cover crop. Although this apparent biofumigant effect was not observed in Holboell’s rockcress (the native brassica), the results from the cultivar study align with the biofumigant literature of white mustard and other brassicaceous crops. Consistent with necrotic tissue damage, we found that white mustard was associated with a lower abundance of I. liriodendri in the roots of Chardonnay cuttings. However, this effect was reduced when white mustard was paired with other cover crops, and was not observed in any other monoculture.
Cover crop diversity increased fungal diversity, but only in the native study. Fungal diversity was higher in cultivar cover crops compared to fallow soil; however, there was no additive effect when all cover crops were grown together. Although not observed in this study, cover crop diversity could play a major role in the long term, especially if more diverse plant communities support diverse microbes with suppressive properties.
In summary, cover crop identity was more important than diversity for controlling fungal pathogens in grapevines. Results from the cultivar study align with other literature, which highlights the suppressive effect of brassicas. We found that when grown from seed, a brassica cover crop could offer traditional benefits such as erosion control or weed suppression as well as partially suppressing soil-borne fungi.
These results provide evidence that disease symptoms and pathogen abundance can be reduced by growing a cover crop that produces antifungal compounds. While seeding multiple cover crops confers a wide range of benefits, certain cover crops may act as vectors for fungal pathogens, thus maintaining the inoculum load. To further unveil how fungal pathogens persist in vineyard soils, future studies should focus on whether native or commercial cover crops act as vectors for GTD pathogens.

Author Contributions

Conceptualization, A.R., M.H., and J.R.Ú.-T.; methodology, A.R.; validation, P.B., T.L., and J.R.Ú.-T.; formal analysis, A.R. and M.E.; writing—original draft preparation, A.R.; writing—review and editing, M.H. and A.R.; supervision, M.H.; funding acquisition, M.H. and J.R.Ú.-T. All authors have read and agreed to the published version of the manuscript.

Funding

This research was funded by Agriculture and Agri-Food Canada, Grape Cluster activity 19, project ASC-12.

Acknowledgments

We would like to thank Xeriscape Endemic Nursery and SeedsCo Community Conservation for supplying native seeds for the experiment.

Conflicts of Interest

The authors of this paper declare no conflict of interest. The funders had no role in the design of the study; in the collection, analyses, or interpretation of data; in the writing of the manuscript; or in the decision to publish the results.

Appendix A

Figure A1. Percent necrotic tissue of grapevines grown in soil conditioned by native cover crops. The extent of necrosis is measured from the basal end up. Treatments are all plants grown together (“all native”), bluebunch wheatgrass (“bluebunch”), silky lupine (“lupine”), Holboell’s rockcress (“rockcress”), and white yarrow (“yarrow”). Boxplots show the first and third quartile, median (middle line), range (whiskers), and circles (outliers). Data were normalized by taking the square root of the reciprocal (100.975 – x) where x is the value for percent necrosis. There was no significant difference (NS) between cover crop treatments (p = 0.407).
Diversity 12 00128 g0a1
Figure A2. Progression of necrotic damage in grapevines grown in soil conditioned by native cover crops. The extent of necrosis is measured from the basal end. Treatments are all plants grown together (“all native”), bluebunch wheatgrass (“bluebunch”), silky lupine (“lupine”), Holboell’s rockcress (“rockcress”), and white yarrow (“yarrow”). Boxplots show the first and third quartile, median (middle line), range (whiskers), and circles (outliers). Data were normalized by taking the natural logarithm plus 1 (log1p) of necrotic progression values. There was no significant difference (NS) between cover crop treatments.
Diversity 12 00128 g0a2
Figure A3. Recovery of I. liriodendri DNA from soil after conditioning with native cover crops. Treatments are all plants grown together (“all native”), bluebunch wheatgrass (“bluebunch”), silky lupine (“lupine”), Holboell’s rockcress (“rockcress”), and white yarrow (“yarrow”). Copy number did not differ significantly (NS) among treatments (p = 0.731).
Diversity 12 00128 g0a3
Figure A4. Recovery of I. liriodendri DNA from native study Chardonnay roots. Treatments are all plants grown together (“all native”), bluebunch wheatgrass (“bluebunch”), silky lupine (“lupine”), Holboell’s rockcress (“rockcress”), and white yarrow (“yarrow”). Data were normalized by taking the square root of the copy number then removing outliers using Tukey’s interquartile range (IQR). Copy number did not differ significantly (NS) between cover crop treatments (p = 0.109).
Diversity 12 00128 g0a4
Figure A5. Relative abundance of phyla across native study samples (A) and cultivar study samples (B) after initial denoising and filtering. Samples are shown with block number followed by treatment number. Numbers 1–4 are white yarrow, Holboell’s rockcress, silky lupine, and bluebunch wheatgrass, respectively while 11 is all native. Numbers 12–15 are white mustard, buckwheat, wheatgrass, and crimson clover, respectively, while 22 and 23 are all cultivar and fallow, respectively. Phyla are Ascomycota (brown), Basidiomycota (pink), Mortierellomycota (yellow), Chytridiomycota (orange), Glomeromycota (purple), and unidentified (blue and green).
Diversity 12 00128 g0a5aDiversity 12 00128 g0a5b
Figure A6. Shannon diversity of fungi in cultivar study soil. Treatments are all plants (“all cultivar”), buckwheat (“buckwheat”), crimson clover (“clover”), uninoculated fallow (“fallow”), white mustard (“mustard”), and wheatgrass (“wheat”). Fungal diversity did not vary significantly (NS) between treatments (p = 0.531).
Diversity 12 00128 g0a6
Table A1. Site information and soil physiochemical properties adopted from Watson et al. (2018) [65].
Site PropertiesResponse
Fruit treeSweet cherry
Soil textureLoamy sand
pH6.9
Organic matter (%)2.3
C/N ratio8.5
Phosphorous (ppm)66
Potassium (ppm)360
Magnesium (ppm)170
Calcium (ppm)1330
Sodium (ppm)25
Aluminum (ppm)13
Sulfur (ppm)9
Nitrate (ppm)23
Table A2. Fertilizer application for Vitis vinifera cuttings in native and cultivar studies. Miracle-Gro fertilizer was used to prepare solutions of varying concentrations. Enough fertilizer was applied to cover the soil and soak through.
DateFertilizer TypeAmount AppliedDilution
October 11 201815-15-18150 mL50%
October 25 201815-15-18150 mLNo
November 1 201815-15-18150 mL50%
November 22 201815-15-18150 mL33%
November 29 201815-15-18150 mL40%
December 7 201815-15-18150 mL40%
Table A3. Number of reads retained at each step in the DADA2 pipeline. Samples are shown with the block number first followed by the treatment number separated by a hyphen. Numbers 1–4 are white yarrow, Holboell’s rockcress, silky lupine, and bluebunch wheatgrass, respectively, while 11 is all native. Numbers 12–15 are white mustard, buckwheat, wheatgrass, and crimson clover, respectively, while 22 and 23 are all cultivar and fallow, respectively. From left to right are the initial read counts (input), reads after filtering (filtered), forward reads after denoising (denoisedF), reverse reads after denoising (denoisedR), number of reads after merging (merged), and number of reads after chimera removal (nonchim). Denoising and filtering were completed with R statistical software.
SampleInputfilteredDenoisedFDenoisedRMergedNonchim
B1-112,25166656644664461846176
B1-1014,58981558133812779097907
B1-1414,19382578222818373077290
B1-1516,92090429020901384248409
B1-1616,35488448808878980578053
B1-2021,93698429807979990409028
B1-3943945994589459042764268
B1-413,17565596524652060916086
B1-610,87365686514653059645962
B1-710,95061406113609454695451
B10-14601134463429343131503146
B10-1613,83179687941791872487233
B10-1710,98249274898489645484506
B10-1810,05956225605560750535029
B10-1912,87674377419739766046579
B10-2221,34211,58411,55111,56410,11810,041
B10-629,91115,43415,38115,40414,29914,200
B10-7842748114787478443644352
B10-913,36665606530653459645957
B10-fal24,13112,37412,34812,34911,73511,671
B2-112,41265636522651261176079
B2-1019,27211,00210,97310,96510,16610,161
B2-11862647664754475144614400
B2-1217,98098049768977088018729
B2-1310,05055685552553951785158
B2-1718,59110,11110,08010,06789788935
B2-18648837543734373536443640
B2-2120,71010,89710,86410,86310,17010,086
B2-2220,42910,22710,19010,17893869305
B2-512,17570216998698163556338
B2-915,94387388696868681718105
B3-114,60580418015801272817259
B3-13838647824765475843034296
B3-1417,54977047666764871187107
B3-1513,92259425919592453985398
B3-17786644914473446940904069
B3-222,01811,33211,27411,27010,31810,247
B3-2019,79410,47310,43610,42796819618
B3-2124,71712,95812,90812,92312,06811,915
B3-2219,20410,21810,18210,19196409581
B3-3669336433631362233223316
B3-720,74310,07910,01010,00793159237
B3-fal18,85510,32010,29610,25195879503
B4-1110,41160316007599450495049
B4-1214,15370036958695664176403
B4-1516,61187088658866279157840
B4-1619,34010,28510,24010,24196509558
B4-18851551315124512247084697
B4-225,97313,68813,61713,62512,31512,203
B4-2123,88212,56312,49812,47311,63811,530
B4-523,44312,02711,95511,96111,00310,927
B4-720,20910,31710,27010,26596009531
B5-1012,45767266689670764156378
B5-1135,39918,21518,14218,13816,67116,523
B5-1224,20313,41013,35013,34912,38512,216
B5-1323,82912,48112,42912,41411,44911,327
B5-1529,53817,06617,03517,02216,48616,416
B5-423,03296309594958089538943
B5-6757039833967396535653562
B5-911,39845824558455742694268
B6-1111,20465956572655560716052
B6-12815545124484449140284021
B6-1310,77957835755574451945178
B6-1929,86616,42716,36716,36015,01214,867
B6-217,68895829411936686838677
B6-20851947954783478243314317
B6-2122,81912,35412,30512,29511,63211,567
B6-3534128662855285125742573
B6-46254847832835771769
B6-5537722092198218720001995
B7-124,12412,56512,50812,50411,63511,547
B7-1025,22013,85113,78913,79813,06212,847
B7-11958655575530551651315111
B7-1526,46914,18914,15614,15013,58013,489
B7-1716,91788978856884282048161
B7-1913,20880507998799071877167
B7-2010,60961696151614055955589
B7-2229,65416,54016,49216,50315,39115,259
B7-319,38210,25510,22010,21694509450
B7-511,10553715353534248654863
B7-712,03268616824681962986291
B7-fal24,74613,16813,1471311612,13512,111
B8-1220,94710,87810,83310,82599079825
B8-1314,15178137771778170107009
B8-1813,89969286888688663736342
B8-226,48214,40014,33714,31713,35013,228
B8-2018,91394759447945187708695
B8-2114,12979227901789373917332
B8-2218,84398569801980790078966
B8-520,50310,68810,64810,64810,08110,023
B8-613,99170146976698563946378
B8-fal460325182478246623622358
B9-1011,95352295209520246794670
B9-14654939553938394136023599
B9-1611,55867756752675561196111
B9-1911,14651445116511548044744
B9-310,35446644648464440814076
B9-413,70169746945693364406422
B9-6948744444414441140934089
B9-919,15810,13610,09410,08892879246
B9-fal703741314117411638503836
PRE-1922754465423541649634954
PRE-1041,28020,18220,11520,09518,03317,904
PRE-210,04655755566555950855084
PRE-316,16477247665767970817074
PRE-425,02511,93511,91511,90311,14111,055
PRE-521,85811,15711,12511,11710,27310,187
PRE-631,86717,22217,16317,14515,88915,758
PRE-729,49914,84214,81614,80913,73013,649
PRE-817,77294659443943687148689
PRE-922,91712,09512,05312,06211,22011,125
Table A4. Average biomass (grams) for each cover crop treatment in native and cultivar studies. Cover crops are bluebunch wheatgrass (“bluebunch”), silky lupine (“lupine”), Holboell’s rockcress (“rockcress”), white yarrow (“yarrow”), buckwheat (“buckwheat”), crimson clover (“clover”), white mustard (“mustard”), and wheatgrass (“wheat”). Letters to the right of values indicate significance at p ≤ 0.05.
ExperimentCover Crop TreatmentBelow-Ground BiomassAbove-Ground Biomass
Native studyAll native0.885 a2.715 a
Bluebunch0.795 a3.041 a
Lupine0.319 b0.730 b
Rockcress0.138 b1.380 b
Yarrow1.056 a2.822 a
Cultivar studyAll cultivar1.238 a6.917 a
Buckwheat0.694 b4.771 b
Clover0.527 b7.483 a
Mustard0.121 c1.834 c
Wheat2.272 d3.663 d

References

  1. Statistics Canada. 2016 Census of Agriculture. 2019. Available online: https://www.statcan.gc.ca/eng/survey/agriculture/3438 (accessed on 29 February 2020).
  2. Klodd, A.E.; Eissenstat, D.M.; Wolf, T.K.; Centinari, M. “Coping with cover crop competition in mature grapevines. Plant Soil 2016, 400, 391–402. [Google Scholar] [CrossRef]
  3. Messiga, A.J.; Gallant, K.S.; Sharifi, M.; Hammermeister, A.; Fuller, K.; Tango, M.; Fillmore, S. Grape yield and quality response to cover crops and amendments in a vineyard in Nova Scotia, Canada. Am. J. Enol. Vitic. 2016, 67, 77–85. [Google Scholar] [CrossRef]
  4. Rahman, L.; Somers, T. Suppression of root knot nematode (Meloidogyne javanica) after incorporation of Indian mustard cv. Nemfix as green manure and seed meal in vineyards. Australas. Plant Pathol. 2005, 34, 77–83. [Google Scholar] [CrossRef]
  5. Gramaje, D.; Úrbez-Torres, J.R.; Sosnowski, M.R. Managing Grapevine Trunk Diseases With Respect to Etiology and Epidemiology: Current Strategies and Future Prospects. Plant Dis. 2017, 102, 12–39. [Google Scholar] [CrossRef] [Green Version]
  6. Úrbez-Torres, J.R.; Haag, P.; Bowen, P.; O’Gorman, D.T. Grapevine Trunk Diseases in British Columbia: Incidence and Characterization of the Fungal Pathogens Associated with Black Foot Disease of Grapevine. Plant Dis. 2013, 98, 456–468. [Google Scholar] [CrossRef] [Green Version]
  7. Maluta, D.R.; Larignon, P. Pied-noir: Mieux vaut prévenir. Viticulture 1991, 11, 71–72. [Google Scholar]
  8. Anderson, K. Lessons for Other Industries from Australia’s Booming Wine Industry. SSRN Electron. J. 2005. [Google Scholar] [CrossRef] [Green Version]
  9. Sumner, D.; Bombrun, H. An Economic Survey of the Wine and Winegrape Industry in the United States and Canada. 2001. Available online: http://www.academia.edu/download/44327963/Winegrape.pdf (accessed on 29 July 2019).
  10. Townsend, R.F.; Kirsten, J.; Vink, N. Farm size, productivity and returns to scale in agriculture revisited: A case study of wine producers in South Africa. Agric. Econ. 1998, 19, 175–180. [Google Scholar] [CrossRef]
  11. Úrbez-Torres, J.R.; Haag, P.; Bowen, P.; Lowery, T.; O’Gorman, D.T. Development of a DNA Macroarray for the Detection and Identification of Fungal Pathogens Causing Decline of Young Grapevines. Phytopathology 2015, 105, 1373–1388. [Google Scholar] [CrossRef] [Green Version]
  12. Gramaje, D.; di Marco, S. Identifying practices likely to have impacts on grapevine trunk disease infections: A European nursery survey. Phytopathol. Mediterr. 2015, 54, 313–324. [Google Scholar] [CrossRef]
  13. Hofstetter, V.; Buyck, B.; Croll, D.; Viret, O.; Couloux, A.; Gindro, K. What if esca disease of grapevine were not a fungal disease? Fungal Divers. 2012, 54, 51–67. [Google Scholar] [CrossRef] [Green Version]
  14. Morales-Cruz, A.; Figueroa-Balderas, R.; García, J.F.; Tran, E.; Rolshausen, P.E.; Baumgartner, K.; Cantu, D. Profiling grapevine trunk pathogens in planta: A case for community-targeted DNA metabarcoding. BMC Microbiol. 2018, 18, 1–14. [Google Scholar] [CrossRef] [PubMed] [Green Version]
  15. Watson, T.T.; Forge, T.A.; Nelson, L.M. Pseudomonads contribute to regulation of Pratylenchus penetrans (Nematoda) populations on apple. Can. J. Bot. 2018, 64, 775–785. [Google Scholar] [CrossRef] [PubMed]
  16. Álvarez-Pérez, J.M.; González-García, S.; Cobos, R.; Olego, M.Á; Ibañez, A.; Díez-Galán, A.; Garzón-Jimeno, E.; Coque, J.J.R. Use of endophytic and rhizosphere actinobacteria from grapevine plants to reduce nursery fungal graft infections that lead to young grapevine decline. Appl. Environ. Microbiol. 2017, 83, e01564–17. [Google Scholar] [CrossRef] [Green Version]
  17. Cardoso, M.; Diniz, I.; Cabral, A.; Rego, C.; Oliveira, H. Unveiling inoculum sources of black foot pathogens in a commercial grapevine nursery. Phytopathol. Mediterr. 2013, 52, 298–312. [Google Scholar]
  18. Canada, H. Pesticide Product Information Database. 2017. Available online: https://pesticide-registry.canada.ca/en/product-search.html (accessed on 30 January 2020).
  19. Schneider, S.M.; Rosskopf, E.N.; Leesch, J.G.; Chellemi, D.O.; Bull, C.T.; Mazzola, M. United States Department of Agriculture - Agricultural Research Service research on alternatives to methyl bromide: Pre-plant and post-harvest. Pest Manag. Sci. 2003, 59, 814–826. [Google Scholar] [CrossRef]
  20. Bendavid-Val, R.; Rabinowitch, H.D.; Katan, J.; Kapulnik, Y. Viability of VA-mycorrhizal fungi following soil solarization and fumigation. Plant Soil 1997, 195, 185–193. [Google Scholar] [CrossRef]
  21. Cabrera, J.A.; Hanson, B.D.; Gerik, J.S.; Gao, S.; Qin, R.; Wang, D. Pre-plant soil fumigation with reduced rates under low permeability films for nursery production, orchard and vineyard replanting. Crop Prot. 2015, 75, 34–39. [Google Scholar] [CrossRef]
  22. Baćmaga, M.; Wyszkowska, J.; Kucharski, J. The biochemical activity of soil contaminated with fungicides. J. Environ. Sci. Heal.—Part B Pestic. Food Contam. Agric. Wastes 2019, 54, 252–262. [Google Scholar] [CrossRef]
  23. Fourie, P.H.; Halleen, F. Proactive Control of Petri Disease of Grapevine Through Treatment of Propagation Material. Plant Dis. 2004, 88, 241–1245. [Google Scholar] [CrossRef] [Green Version]
  24. Gramaje, D.; Armengol, J.; Salazar, D.; López-Cortés, I.; García-Jiménez, J. Effect of hot-water treatments above 50°C on grapevine viability and survival of Petri disease pathogens. Crop Prot. 2009, 28, 280–285. [Google Scholar] [CrossRef]
  25. Waite, H.; Morton, L. Hot water treatment, trunk diseases and other critical factors in the production of high-quality grapevine planting material. Phytopathol. Mediterr. 2007, 46, 5–17. [Google Scholar]
  26. Corti, G.; Cavallo, E.; Cocco, S.; Biddoccu, M.; Brecciaroli, G.; Agnelli, A. Evaluation of Erosion Intensity and Some of Its Consequences in Vineyards from Two Hilly Environments Under a Mediterranean Type of Climate, Italy. In Soil Erosion Issues in Agriculture; Godone, D., Stanchi, S., Eds.; IntechOpen: London, UK, 2011. [Google Scholar]
  27. Bair, K.E.; Davenport, J.R.; Stevens, R.G. Release of Available Nitrogen after Incorporation of a Legume Cover Crop in Concord Grape. HortScience 2008, 43, 875–880. [Google Scholar] [CrossRef] [Green Version]
  28. Irvin, N.A.; Hagler, J.R.; Hoddle, M.S. Measuring natural enemy dispersal from cover crops in a California vineyard. Biol. Control 2018, 126, 15–25. [Google Scholar] [CrossRef]
  29. Khanh, T.D.; Chung, M.I.; Xuan, T.D.; Tawata, S. The exploitation of crop allelopathy in sustainable agricultural production. J. Agron. Crop Sci. 2005, 191, 172–184. [Google Scholar] [CrossRef]
  30. Monteiro, A.; Lopes, C.M. Influence of cover crop on water use and performance of vineyard in Mediterranean Portugal. Agric. Ecosyst. Environ. 2007, 121, 336–342. [Google Scholar] [CrossRef]
  31. Bleach, C.M.; Jones, E.E.; Jaspers, M.V. Biofumigation using brassicaceous plant products to control Cylindrocarpon black foot disease in New Zealand soils. Phytopathol. Mediterr. 2010, 49, 10–1007. [Google Scholar]
  32. Whitelaw-Weckert, M.; Rahman, L.; Cappello, J.; Bartrop, K. Preliminary findings on the grapevine yield response to Brassica biofumigation soil treatment. Phytopathol. Mediterr. 2014, 53, 587. [Google Scholar]
  33. Mazzola, M.; Granatstein, D.M.; Elfving, D.C.; Mullinix, K.; Gu, Y.H. Cultural management of microbial community structure to enhance growth of apple in replant soils. Phytopathology 2002, 92, 1363–1366. [Google Scholar] [CrossRef] [Green Version]
  34. Wiggins, B.E.; Kinkel, L.L. Green Manures and Crop Sequences Influence Potato Diseases and Pathogen Inhibitory Activity of Indigenous Streptomycetes. Phytopathology 2005, 95, 178–185. [Google Scholar] [CrossRef] [PubMed] [Green Version]
  35. Ostfeld, R.S.; Keesing, F. Effects of Host Diversity on Infectious Disease. Annu. Rev. Ecol. Evol. Syst. 2012, 43, 157–182. [Google Scholar] [CrossRef]
  36. Steinauer, K.; Chatzinotas, A.; Eisenhauer, N. Root exudate cocktails: The link between plant diversity and soil microorganisms? Ecol. Evol. 2016, 6, 7387–7396. [Google Scholar] [CrossRef] [PubMed] [Green Version]
  37. Eisenhauer, N.; Beßler, H.; Engels, C.; Gleixner, G.; Habekost, M.; Milcu, A.; Partsch, S.; Sabais, A.C.W.; Scherber, C.; Steinbeiss, S. Plant diversity effects on soil microorganisms support the singular hypothesis. Ecology 2010, 91, 485–496. [Google Scholar] [CrossRef] [PubMed]
  38. Lange, M.; Eisenhauer, N.; Sierra, C.A.; Bessler, H.; Engels, C.; Griffiths, R.I.; Mellado-Vázquez, P.G.; Malik, A.A.; Roy, J.; Scheu, S.; et al. Plant diversity increases soil microbial activity and soil carbon storage. Nat. Commun. 2015, 6, 6707. [Google Scholar] [CrossRef]
  39. Mariotte, P.; Mehrabi, Z.; Bezemer, T.M.; de Deyn, G.B.; Kulmatiski, A.; Drigo, B.; Veen, G.F.; van der Heijden, M.G.A.; Kardol, P. Plant–soil feedback: Bridging natural and agricultural sciences. Trends Ecol. Evol. 2018, 33, 129–142. [Google Scholar] [CrossRef] [Green Version]
  40. Morgan, J.A.W.; Bending, G.D.; White, P.J. Biological costs and benefits to plant-microbe interactions in the rhizosphere. J. Exp. Bot. 2005, 56, 1729–1739. [Google Scholar] [CrossRef] [Green Version]
  41. Garbeva, P.; Postma, J.; van Veen, J.A.; van Elsas, J.D. Effect of above-ground plant species on soil microbial community structure and its impact on suppression of Rhizoctonia solani AG3. Environ. Microbiol. 2006, 8, 233–246. [Google Scholar] [CrossRef]
  42. van Elsas, J.D.; Garbeva, P.; Salles, J. Effects of agronomical measures on the microbial diversity of soils as related to the suppression of soil-borne plant pathogens. Biodegradation 2002, 13, 29–40. [Google Scholar] [CrossRef]
  43. Latz, E.; Eisenhauer, N.; Rall, B.C.; Allan, E.; Roscher, C.; Scheu, S.; Jousset, A. Plant diversity improves protection against soil-borne pathogens by fostering antagonistic bacterial communities. J. Ecol. 2012, 100, 597–604. [Google Scholar] [CrossRef]
  44. Latz, E.; Eisenhauer, N.; Scheu, S.; Jousset, A. Plant identity drives the expression of biocontrol factors in a rhizosphere bacterium across a plant diversity gradient. Funct. Ecol. 2015, 29, 1225–1234. [Google Scholar] [CrossRef]
  45. Lee, B.D.; Dutta, S.; Ryu, H.; Yoo, S.J.; Suh, D.S.; Park, K. Induction of systemic resistance in panax ginseng against phytophthora cactorum by native bacillus amyloliquefaciens HK34. J. Ginseng Res. 2015, 39, 213–220. [Google Scholar] [CrossRef] [PubMed] [Green Version]
  46. Shen, Z.; Ruan, Y.; Xue, C.; Zhong, S.; Li, R.; Shen, Q. Soils naturally suppressive to banana Fusarium wilt disease harbor unique bacterial communities. Plant Soil 2015, 393, 21–33. [Google Scholar] [CrossRef]
  47. Irvin, N.A.; Tracy, R.P.; Thomas, M.P.; Hoddle, M. Evaluating the potential of buckwheat and cahaba vetch as nectar producing cover crops for enhancing biological control of Homalodisca vitripennis in California vineyards. Biol. Control 2014, 76, 10–18. [Google Scholar] [CrossRef]
  48. Langenhoven, S.D.; Halleen, F.; Spies, C.F.J.; Stempien, E.; Mostert, L. Detection and quantification of black foot and crown and root rot pathogens in grapevine nursery soils in the Western Cape of South Africa. Phytopathol. Mediterr. 2018, 57, 519–537. [Google Scholar] [CrossRef]
  49. Shields, M.W.; Tompkins, J.M.; Saville, D.J.; Meurk, C.D.; Wratten, S. Potential ecosystem service delivery by endemic plants in New Zealand vineyards: Successes and prospects. PeerJ 2016, 4, e2042. [Google Scholar] [CrossRef] [Green Version]
  50. Tompkins, J.-M. Ecosystem Services Provided by Native New Zealand Plants in Vineyards. Ph.D. Thesis, Lincoln University, Lincoln, New Zealand, 2010. [Google Scholar]
  51. Vukicevich, E.; Lowery, D.T.; Bennett, J.A.; Hart, M. Influence of Groundcover Vegetation, Soil Physicochemical Properties, and Irrigation Practices on Soil Fungi in Semi-arid Vineyards. Front. Ecol. Evol. 2019, 7, 1–10. [Google Scholar] [CrossRef] [Green Version]
  52. Holland, T.; Vukicevich, E.; Thomsen, C.; Pogiatzis, A.; Hart, M.; Bowen, P. Arbuscular Mycorrhizal Fungi in Viticulture: Should We Use Biofertilizers? Catal. Discov. Pract. 2018, 2, 59–63. [Google Scholar] [CrossRef]
  53. Revillini, D.; Gehring, C.A.; Johnson, N.C. The role of locally adapted mycorrhizas and rhizobacteria in plant–soil feedback systems. Funct. Ecol. 2016, 30, 1086–1098. [Google Scholar] [CrossRef] [Green Version]
  54. Lupwayi, N.Z.; Kennedy, A.C. Grain legumes in Northern Great plains: Impacts on selected biological soil processes. Agron. J. 2007, 99, 1700–1709. [Google Scholar] [CrossRef]
  55. Ratcliff, W.C.; Kadam, S.V.; Denison, R.F. Poly-3-hydroxybutyrate (PHB) supports survival and reproduction in starving rhizobia. FEMS Microbiol. Ecol. 2008, 65, 391–399. [Google Scholar] [CrossRef] [Green Version]
  56. Mehrabi, Z.; Bell, T.; Lewis, O.T. Plant-soil feedbacks from 30-year family-specific soil cultures: Phylogeny, soil chemistry and plant life stage. Ecol. Evol. 2015, 5, 2333–2339. [Google Scholar] [CrossRef] [PubMed]
  57. Rúa, M.A.; Antoninka, A.; Antunes, P.M.; Chaudhary, V.B.; Gehring, C.; Lamit, L.J.; Piculell, B.J.; Bever, J.D.; Zabinski, C.; Meadow, J.F.; et al. Home-field advantage? Evidence of local adaptation among plants, soil, and arbuscular mycorrhizal fungi through meta-analysis. BMC Evol. Biol. 2016, 16, 122. [Google Scholar] [CrossRef] [PubMed] [Green Version]
  58. Smith, D.S.; Schweitzer, J.A.; Turk, P.; Bailey, J.K.; Hart, S.C.; Shuster, S.M.; Whitham, T.G. Soil-mediated local adaptation alters seedling survival and performance. Plant Soil 2012, 352, 243–251. [Google Scholar] [CrossRef]
  59. Tian, K.; Kong, X.; Gao, J.; Jia, Y.; Lin, H.; He, Z.; Ji, Y.; Bei, Z.; Tian, X. Local root status: A neglected bio-factor that regulates the home-field advantage of leaf litter decomposition. Plant Soil 2018, 431, 175–189. [Google Scholar] [CrossRef]
  60. Veen, G.F.; Snoek, B.L.; Bakx-Schotman, T.; Wardle, D.A.; van der Putten, W.H. Relationships between fungal community composition in decomposing leaf litter and home-field advantage effects. Funct. Ecol. 2019, 33, 1524–1535. [Google Scholar] [CrossRef] [Green Version]
  61. Madritch, M.D.; Greene, S.L.; Lindroth, R.L. Genetic mosaics of ecosystem functioning across aspen-dominated landscapes. Oecologia 2009, 160, 119–127. [Google Scholar] [CrossRef]
  62. Wei, C.; Yu, Q.; Bai, E.; Lü, X.; Li, Q.; Xia, J.; Kardol, P.; Liang, W.; Wang, Z.; Han, X.; et al. Nitrogen deposition weakens plant-microbe interactions in grassland ecosystems. Glob. Chang. Biol. 2013, 19, 3688–3697. [Google Scholar] [CrossRef]
  63. Lambers, H.; Mougel, C.; Jaillard, B.; Hinsinger, P. Plant-microbe-soil interactions in the rhizosphere: An evolutionary perspective. Plant Soil 2009, 321, 83–115. [Google Scholar] [CrossRef]
  64. Watson, T.; Nelson, L.; Jones, M.; Urbez-Torres, J.R. Non-Fumigant Alternative Soil Management Practices for Mitigating Replant Disease of Fruit Trees: Mechanisms Contributing to Pratylenchus Penetrans Suppression. Ph.D. Thesis, The University of British Columbia, Vancouver, BC, Canada, April 2018. [Google Scholar]
  65. Watson, T.T.; Nelson, L.M.; Forge, T.A. Preplant Soil Incorporation of Compost to Mitigate Replant Disease: Soil Biological Factors Associated with Plant Growth Promotion in Orchard Soil. Compost Sci. Util. 2018, 26, 286–296. [Google Scholar] [CrossRef]
  66. Overmann, J. Mahoney lake: A case study of the ecological significance of phototrophic sulfur bacteria. In Advances in Microbial Ecology; Jones, J.G., Ed.; Springer Science & Business Media: Berlin, Germany, 1997. [Google Scholar]
  67. Lindahl, B.D.; Nilsson, R.H.; Tedersoo, L.; Abarenkov, K.; Carlsen, T.; Kjøller, R.; Kõljalg, U.; Pennanen, T.; Rosendahl, S.; Stenlid, J.; et al. Fungal community analysis by high-throughput sequencing of amplified markers—a user’s guide. New Phytol. 2013, 199, 288–299. [Google Scholar] [CrossRef] [Green Version]
  68. Holland, T.; Bowen, P.; Kokkoris, V.; Urbez-Torres, J.R.; Hart, M. Does inoculation with arbuscular mycorrhizal fungi reduce trunk disease in grapevine rootstocks? Horticulturae 2019, 5, 61. [Google Scholar] [CrossRef] [Green Version]
  69. Kokkoris, V.; Li, Y.; Hamel, C.; Hanson, K.; Hart, M. Site specificity in establishment of a commercial arbuscular mycorrhizal fungal inoculant. Sci. Total Environ. 2019, 660, 1135–1143. [Google Scholar] [CrossRef] [PubMed]
  70. Callahan, B.J.; McMurdie, P.J.; Rosen, M.J.; Han, A.W.; Johnson, A.J.A.; Holmes, S.P. DADA2: High-resolution sample inference from Illumina amplicon data. Nat. Methods 2016, 13, 581–583. [Google Scholar] [CrossRef] [PubMed] [Green Version]
  71. Bolyen, E.; Rideout, J.R.; Dillon, M.R.; Bokulich, N.A.; Abnet, C.C.; Al-Ghalith, G.A.; Alexander, H.; Alm, E.J.; Arumugam, M.; Asnicar, F. Reproducible, interactive, scalable and extensible microbiome data science using QIIME 2. Nat. Biotechnol. 2019, 37, 852–857. [Google Scholar] [CrossRef]
  72. Nilsson, R.H.; Larsson, K.H.; Taylor, A.F.S.; Bengtsson-Palme, J.; Jeppesen, T.S.; Schigel, D.; Kennedy, P.; Picard, K.; Glöckner, F.O.; Tedersoo, L.; et al. The UNITE database for molecular identification of fungi: Handling dark taxa and parallel taxonomic classifications. Nucleic Acids Res. 2019, 47, 259–264. [Google Scholar] [CrossRef]
  73. Lozupone, C.; Knight, R. UniFrac: A new phylogenetic method for comparing microbial communities. Appl. Environ. Microbiol. 2005, 71, 8228–8235. [Google Scholar] [CrossRef] [Green Version]
  74. Martino, C.; Morton, J.T.; Marotz, C.A.; Thompson, L.R.; Tripathi, A.; Knight, R.; Zengler, K. A novel sparse compositional technique reveals microbial perturbations. Am. Soc. Microbiol. 2019, 4, 1–13. [Google Scholar] [CrossRef] [Green Version]
  75. Tukey, J.W. Comparing individual means in the analysis of variance. Biometrics 1949, 5, 99. [Google Scholar] [CrossRef]
  76. Kruskal, W.H.; Wallis, W.A. Use of Ranks in One-Criterion Variance Analysis. J. Am. Stat. Assoc. 1952, 47, 583–621. [Google Scholar] [CrossRef]
  77. Neilsen, D.; Smith, C.A.S.; Frank, G.; Koch, W.; Alila, Y.; Merritt, W.S.; Taylor, W.G.; Barton, M.; Hall, J.W.; Cohen, S.J.; et al. Potential impacts of climate change on water availability for crops in the Okanagan Basin, British Columbia. Can. J. Soil. Sci 2006, 86, 921–936. [Google Scholar] [CrossRef]
  78. Hawkes, C.V.; Kivlin, S.N.; Du, J.; Eviner, V.T. The temporal development and additivity of plant-soil feedback in perennial grasses. Plant Soil 2013, 369, 141–150. [Google Scholar] [CrossRef]
  79. Eisenhauer, N.; Reich, P.B.; Scheu, S. Increasing plant diversity effects on productivity with time due to delayed soil biota effects on plants. Basic Appl. Ecol. 2012, 13, 571–578. [Google Scholar] [CrossRef]
  80. Vogel, A.; Ebeling, A.; Gleixner, G.; Roscher, C.; Scheu, S.; Ciobanu, M.; Koller-France, E.; Lange, M.; Lochner, A.; Meyer, S.T.; et al. A new experimental approach to test why biodiversity effects strengthen as ecosystems age. Adv. Ecol. Res. 2019, 61, 221–264. [Google Scholar]
  81. Barrios, E. Soil biota, ecosystem services and land productivity. Ecol. Econ. 2007, 64, 269–285. [Google Scholar] [CrossRef]
  82. Ball, B.A.; Bradford, M.A.; Coleman, D.C.; Hunter, M.D. Linkages between below and aboveground communities: Decomposer responses to simulated tree species loss are largely additive. Soil Biol. Biochem. 2009, 41, 1155–1163. [Google Scholar] [CrossRef]
  83. Cumagun, C.J.R. Managing plant diseases and promoting sustainability and productivity with Trichoderma: The Philippine experience. J. Agric. Sci. Technol. 2012, 14, 699–714. [Google Scholar]
  84. Naher, L.; Yusuf, U.K.; Ismail, A.; Hossain, K. Trichoderma spp.: A biocontrol agent for sustainable management of plant diseases. Pak. J. Bot. 2014, 46, 1489–1493. [Google Scholar]
  85. Fourie, P.H.; Halleen, F. Occurrence of grapevine trunk disease pathogens in rootstock mother plants in South Africa. Australas. Plant Pathol. 2004, 33, 313–315. [Google Scholar] [CrossRef]
  86. Cobos, R.; Mateos, R.M.; Álvarez-Pérez, J.M.; Olego, M.A.; Sevillano, S.; González-García, S.; Garzón-Jimeno, E.; Coque, J.J.R. Effectiveness of natural antifungal compounds in controlling infection by grapevine trunk disease pathogens through pruning wounds. Appl. Environ. Microbiol. 2015, 81, 6474–6483. [Google Scholar] [CrossRef] [Green Version]
  87. Clark, A. Managing Cover Crops Profitably; Sustainable Agriculture Research and Education: College Park, MD, USA, 2012. [Google Scholar]
  88. Fahey, J.W.; Zalcmann, A.T.; Talalay, P. The chemical diversity and distribution of glucosinolates and isothiocyanates among plants. Phytochemistry 2001, 56, 5–51. [Google Scholar] [CrossRef]
  89. Berlanas, C.; Andrés-Sodupe, M.; López-Manzanares, B.; Maldonado-González, M.M.; Gramaje, D. Effect of white mustard cover crop residue, soil chemical fumigation and Trichoderma spp. root treatment on black-foot disease control in grapevine. Pest Manag. Sci. 2018, 74, 2864–2873. [Google Scholar] [CrossRef] [PubMed]
  90. Mazzola, S.; Hewavitharana, M.; Strauss, S.S. Brassica seed meal soil amendments transform the rhizosphere microbiome and improve apple production through resistance to pathogen re-infestation. Phytopathology 2014, 105, 1–48. [Google Scholar] [CrossRef] [Green Version]
  91. Wang, L.; Mazzola, M. Interaction of Brassicaceae seed meal soil amendment and apple rootstock genotype on microbiome structure and replant disease suppression. Phytopathology 2019, 109, 607–614. [Google Scholar] [CrossRef] [PubMed] [Green Version]
  92. Drakopoulos, D.; Luz, C.; Torrijos, R.; Meca, G.; Weber, P.; Banziger, I.; Voegele, R.T.; Six, J.; Vogelgsang, S. Use of Botanicals to Suppress Different Stages of the Life Cycle of Fusarium graminearum. Phytopathology 2019, 109, 2116–2123. [Google Scholar] [CrossRef] [Green Version]
  93. Prasad, P.; Kumar, J. Management of fusarium wilt of chickpea using brassicas as biofumigants. Legum. Res. 2017, 40, 178–182. [Google Scholar] [CrossRef] [Green Version]
  94. Mazzola, M.; Granatstein, D.M.; Elfving, D.C.; Mullinix, K. Suppression of specific apple root pathogens by Brassica napus seed meal amendment regardless of glucosinolate content. Phytopathology 2001, 91, 673–679. [Google Scholar] [CrossRef] [Green Version]
  95. Mowlick, S.; Yasukawa, H.; Inoue, T.; Takehara, T.; Kaku, N.; Ueki, K.; Ueki, A. Suppression of spinach wilt disease by biological soil disinfestation incorporated with Brassica juncea plants in association with changes in soil bacterial communities. Crop Prot. 2013, 54, 185–193. [Google Scholar] [CrossRef] [Green Version]
  96. Roy, B.A. Patterns of Rust Infection as a Function of Host Genetic Diversity and Host Density in Natural Populations of the Apomictic Crucifer, Arabis holboellii. Evolution 1993, 47, 111. [Google Scholar] [CrossRef]
  97. Ma, Y.; Gentry, T.; Hu, P.; Pierson, E.; Gu, M.; Yin, S. Impact of brassicaceous seed meals on the composition of the soil fungal community and the incidence of Fusarium wilt on chili pepper. Appl. Soil Ecol. 2015, 90, 41–48. [Google Scholar] [CrossRef]
  98. Wen, L.; Lee-Marzano, S.; Ortiz-Ribbing, L.M.; Gruver, J.; Hartman, G.L.; Eastburn, D.M. Suppression of soilborne diseases of soybean with cover crops. Plant Dis. 2017, 101, 1918–1928. [Google Scholar] [CrossRef] [Green Version]
  99. BC Wine Grape Council. 2010 Best Practices Guide for Grapes; British Columbia Wine Grape Council: Peachland, BC, Canada, 2010. [Google Scholar]
  100. Agustí-Brisach, C.; Gramaje, D.; León, M.; García-Jiménez, J.; Armengol, J. Evaluation of vineyard weeds as potential hosts of black-foot and petri disease pathogens. Plant Dis. 2011, 95, 803–810. [Google Scholar] [CrossRef] [PubMed] [Green Version]
  101. Urbez-Torres, J.R.; O’Gorman, D.T.; Boule, J.; Walker, M.; Pollard-Flamand, J. Pruning time can reduce grapevine trunk diseases infection under British Columbia environmental con-ditions. Phytopathol. Mediterr. 2019, 58, 426. [Google Scholar]
  102. Boruah, H.P.D.; Kumar, B.S.D. Plant Disease Suppression and Growth Promotion by a Fluorescent Pseudomonas Strain. Folia Microbiol. 2002, 47, 137–143. [Google Scholar] [CrossRef] [PubMed]
  103. Ridout, M.; Newcombe, G. Disease suppression in winter wheat from novel symbiosis with forest fungi. Fungal Ecol. 2016, 20, 40–48. [Google Scholar] [CrossRef] [Green Version]
  104. Inderjit; van der Putten, W. H. Impacts of soil microbial communities on exotic plant invasions. Trends Ecol. Evol. 2010, 25, 512–519. [Google Scholar] [CrossRef] [PubMed]
  105. van der Putten, W.H.; Klironomos, J.N.; Wardle, D.A. Microbial ecology of biological invasions. ISME J. 2007, 1, 28–37. [Google Scholar] [CrossRef] [PubMed] [Green Version]
  106. Gouda, S.; Kerry, R.G.; Das, G.; Paramithiotis, S.; Shin, H.S.; Patra, J.K. Revitalization of plant growth promoting rhizobacteria for sustainable development in agriculture. Microbiol. Res. 2018, 206, 131–140. [Google Scholar] [CrossRef]
  107. Broz, A.K.; Manter, D.K.; Vivanco, J.M. Soil fungal abundance and diversity: Another victim of the invasive plant Centaurea maculosa. ISME J. 2007, 1, 763–765. [Google Scholar] [CrossRef] [Green Version]
  108. Klironomos, J.N. Feedback with soil biota contributes to plant rarity and invasiveness in communities. Nature 2002, 417, 67–70. [Google Scholar] [CrossRef]
  109. Friesen, M.L.; Porter, S.S.; Stark, S.C.; von Wettberg, E.J.; Sachs, J.L.; Martinez-Romero, E. Microbially Mediated Plant Functional Traits. Annu. Rev. Ecol. Evol. Syst. 2011, 42, 23–46. [Google Scholar] [CrossRef] [Green Version]
  110. Klironomos, J.N. Variation in plant response to native and exotic arbuscular mycorrhizal fungi. Ecology 2003, 84, 2292–2301. [Google Scholar] [CrossRef]
  111. Broeckling, C.D.; Broz, A.K.; Bergelson, J.; Manter, D.K.; Vivanco, J.M. Root exudates regulate soil fungal community composition and diversity. Appl. Environ. Microbiol. 2008, 74, 738–744. [Google Scholar] [CrossRef] [PubMed] [Green Version]
  112. Rosenstock, N.; Ellström, M.; Oddsdottir, E.; Sigurdsson, B.D.; Wallander, H. Carbon sequestration and community composition of ectomycorrhizal fungi across a geothermal warming gradient in an Icelandic spruce forest. Fungal Ecol. 2019, 40, 32–42. [Google Scholar] [CrossRef]
  113. Garbeva, P.; van Veen, J.A.; van Elsas, J.D. Microbial Diversity In Soil: Selection of Microbial Populations by Plant and Soil Type and Implications for Disease Suppressiveness. Annu. Rev. Phytopathol. 2004, 42, 243–270. [Google Scholar] [CrossRef]
  114. Veen, G.F.; Fry, E.L.; Hooven, F.C.t.; Kardol, P.; Morriën, E.; de Long, J.R. The Role of Plant Litter in Driving Plant-Soil Feedbacks. Front. Environ. Sci. 2019, 7. [Google Scholar] [CrossRef]
  115. Wang, Q.; Ma, Y.; Yang, H.; Chang, Z. Effect of biofumigation and chemical fumigation on soil microbial community structure and control of pepper Phytophthora blight. World J. Microbiol. Biotechnol. 2014, 30, 507–518. [Google Scholar] [CrossRef]
  116. Glenn, M.G.; Chew, F.S.; Williams, P.H. Influence of glucosinolate content of Brassica (Cruciferae) roots on growth of vesicular–arbuscular mycorrhizal fungi. New Phytol. 1988, 10, 217–225. [Google Scholar] [CrossRef]
  117. Koron, D.; Sonjak, S.; Regvar, M. Effects of non-chemical soil fumigant treatments on root colonisation with arbuscular mycorrhizal fungi and strawberry fruit production. Crop Prot. 2014, 55, 35–41. [Google Scholar] [CrossRef]
  118. Vitalini, S.; Beretta, G.; Iriti, M.; Orsenigo, S.; Basilico, N.; Dall’Acqua, S.; Iorizzi, M.; Fico, G. Phenolic compounds from Achillea millefolium L. and their bioactivity. Acta Biochim. Pol. 2011, 58, 203–209. [Google Scholar] [CrossRef]
  119. Candan, F.; Unlu, M.; Tepe, B.; Daferera, D.; Polissiou, M.; Sökmen, A.; Akpulat, H.A. Antioxidant and antimicrobial activity of the essential oil and methanol extracts of Achillea millefolium subsp. millefolium Afan. (Asteraceae). J. Ethnopharmacol. 2003, 87, 215–220. [Google Scholar] [CrossRef]
  120. Clair, J.B.S.; Kilkenny, F.F.; Johnson, R.C.; Shaw, N.L.; Weaver, G. Genetic variation in adaptive traits and seed transfer zones for Pseudoroegneria spicata (bluebunch wheatgrass) in the northwestern United States. Evol. Appl. 2013, 6, 933–948. [Google Scholar] [CrossRef] [PubMed]
  121. Callaway, R.M.; Thelen, G.C.; Barth, S.; Ramsey, P.W.; Gannon, J.E. Soil fungi alter interactions between the invader Centaurea maculosa and North American natives. Ecology 2004, 85, 062–1071. [Google Scholar] [CrossRef] [Green Version]
  122. Hayman, D.S. Mycorrhizae of nitrogen-fixing legumes. MIRCEN J. Appl. Microbiol. Biotechnol. 1986, 2, 121–145. [Google Scholar] [CrossRef]
  123. Nieva, A.S.; Bailleres, M.A.; Llames, M.E.; Taboada, M.A.; Ruiz, O.A.; Menéndez, A. Promotion of Lotus tenuis in the Flooding Pampa (Argentina) increases the soil fungal diversity. Fungal Ecol. 2018, 33, 80–91. [Google Scholar] [CrossRef]
  124. Benitez, M.S.; Taheri, W.I.; Lehman, R.M. Selection of fungi by candidate cover crops. Appl. Soil Ecol. 2016, 103, 72–82. [Google Scholar] [CrossRef]
  125. Sanchez, I.I.; Fultz, L.M.; Lofton, J.; Haggard, B. Soil Biological Response to Integration of Cover Crops and Nitrogen Rates in a Conservation Tillage Corn Production System. Soil Sci. Soc. Am. J. 2019, 83, 1356–1367. [Google Scholar] [CrossRef]
  126. Hewavitharana, S.S.; Ruddell, D.; Mazzola, M. Carbon source-dependent antifungal and nematicidal volatiles derived during anaerobic soil disinfestation. Eur. J. Plant Pathol. 2014, 140, 39–52. [Google Scholar] [CrossRef]
Figure 1. Percent necrotic tissue of grapevines growing in soil conditioned by cultivar cover crops. Treatments include a mixture of all plants (“all cultivar”), buckwheat (“buckwheat”), crimson clover (“clover”), uninoculated fallow (“fallow”), white mustard (“mustard”), and wheatgrass (“wheat”). Boxplots show the first and third quartile, median (middle line), range (whiskers), and circles (outliers). Letters represent statistical significance at p < 0.05. This section may be divided by subheadings and should provide a concise and precise depiction of the experimental results, their interpretation, and the experimental conclusions that can be drawn.
Diversity 12 00128 g001
Figure 2. Recovery of I. liriodendri DNA from soil conditioned by cultivar cover crops. Treatments are a mixture of all plants (“all cultivar”), buckwheat (“buckwheat”), crimson clover (“clover”), uninoculated fallow (“fallow”), white mustard (“mustard”), and wheatgrass (“wheat”). Letters above boxplots represent statistical significance at p < 0.05.
Diversity 12 00128 g002
Figure 3. Abundance of I. liriodendri DNA from the cultivar study Chardonnay roots. The cube root of copy number was taken to normalize data. Treatments are a mixture of all plants (“all cultivar”), buckwheat (“buckwheat”), crimson clover (“clover”), uninoculated fallow (“fallow”), white mustard (“mustard”), and wheatgrass (“wheat”). Letters above boxplots represent significant differences at p < 0.05.
Diversity 12 00128 g003
Figure 4. Shannon diversity of fungi in native study soils. Treatments are bluebunch wheatgrass (“bluebunch”), silky lupine (“lupine”), Holboell’s rockcress (“rockcress”), and white yarrow (“yarrow”). Overall group significance was observed in monocultures (p = 0.047). Letters over treatments indicate pairwise differences at a significance level of 0.05.
Diversity 12 00128 g004
Figure 5. Principal coordinates analysis of fungal communities from native study cover crops visualized by Weighted UniFrac distance. Treatments are all species together (“All native”), bluebunch wheatgrass (“Bluebunch”), Silky lupine (“Lupine”), Holboell’s rockcress (“Rockcress”), and white yarrow (“Yarrow”). Fungal communities show no significant clustering overall (p = 0.051); however, bluebunch wheatgrass (squares) and white yarrow (stars) reveal differences in beta diversity (p = 0.036, q = 0.280).
Diversity 12 00128 g005
Figure 6. Principal coordinates analysis of fungal communities from cultivar cover crops visualized by Robust Aitchison distance. Treatments are all plants grown together (“All cultivar”), buckwheat (“buckwheat”), crimson clover (“Clover”), uninoculated fallow (“Fallow”), white mustard (“Mustard”), and wheatgrass (“Wheat”)m with the following significant pairwise interactions: All cultivar and Fallow (p = 0.005, q = 0.045), All cultivar and wheatgrass (p = 0.017, q = 0.084), Clover and Fallow (p = 0.006, q = 0.045), clover and mustard (p = 0.025, q = 0.084), clover and wheatgrass (p = 0.037, q = 0.092).
Diversity 12 00128 g006
Table 1. Selected cover crops for native study and cultivar study greenhouse experiments. Native plants were collected in the Okanagan Valley, while seeds of cultivar plants were purchased from seed suppliers. N/A = not applicable.
TreatmentLatin BinomialStudyDiversityGroupLife Cycle
Crimson cloverTrifolium incarnatumCultivar1LegumeAnnual
WheatTriticum aestivumCultivar1GrassAnnual
BuckwheatFagopyrum esculentumCultivar1ForbAnnual
White mustardSinapis albaCultivar1BrassicaAnnual
All cultivar Cultivar4 Annual
FallowN/ACultivar0N/AN/A
Silky LupineLupinus sericeusNative1LegumePerennial
Bluebunch wheatgrassPseudoroegneria spicataNative1GrassPerennial
White yarrowAchillea millefoliumNative1ForbPerennial
Holboell’s rockcressBochera hoellbeliiNative1BrassicaPerennial
All native Native4 Perennial

