Article

Meiofauna Life on Loggerhead Sea Turtles-Diversely Structured Abundance and Biodiversity Hotspots That Challenge the Meiofauna Paradox

by
Jeroen Ingels
1,*,
Yirina Valdes
2,*,
Letícia P. Pontes
3,
Alexsandra C. Silva
3,
Patrícia F. Neres
3,
Gustavo V. V. Corrêa
3,
Ian Silver-Gorges
4,
Mariana M.P.B. Fuentes
4,
Anthony Gillis
4,
Lindsay Hooper
4,
Matthew Ware
4,
Carrie O’Reilly
4,
Quintin Bergman
5,
Julia Danyuk
6,
Sofia Sanchez Zarate
7,
Laura I. Acevedo Natale
1,8 and
Giovanni A. P. dos Santos
3
1
Coastal and Marine Laboratory, Florida State University, St Teresa, FL 32358, USA
2
Department of Biological Sciences, Federal University of Paraíba, 58397-000 Areia-PB, Brazil
3
Zoology Department, Federal University of Pernambuco, 50670-901 Recife-PE, Brazil
4
Department of Earth Ocean and Atmospheric Science, Florida State University, Tallahassee, FL 32306, USA
5
Public Works-Coastal Division, Indian River County, Vero Beach, FL 32960, USA
6
Florida Department of Environmental Protection, Tallahassee, FL 32399, USA
7
Department of Computer Science and Engineering, Columbia University, New York, NY 10027, USA
8
Department of Geosciences and Natural Resource Management, University of Copenhagen, Valby, 2500 Copenhagen, Denmark
*
Authors to whom correspondence should be addressed.
Submission received: 3 April 2020 / Revised: 12 May 2020 / Accepted: 13 May 2020 / Published: 20 May 2020
(This article belongs to the Special Issue Meiofauna Biodiversity and Ecology)

Abstract

:
Sea turtles migrate thousands of miles annually between foraging and breeding areas, carrying dozens of epibiont species with them on their journeys. Most sea turtle epibiont studies have focused on large-sized organisms, those visible to the naked eye. Here, we report previously undocumented levels of epibiont abundance and biodiversity for loggerhead sea turtles (Caretta caretta), by focusing on the microscopic meiofauna. During the peak of the 2018 loggerhead nesting season at St. George Island, Florida, USA, we sampled all epibionts from 24 carapaces. From the subsamples, we identified 38,874 meiofauna individuals belonging to 20 higher taxa. This means 810,753 individuals were recovered in our survey, with an average of 33,781 individuals per carapace. Of 6992 identified nematodes, 111 different genera were observed. To our knowledge, such levels of sea turtle epibiont abundance and diversity have never been recorded. Loggerhead carapaces are without doubt hotspots of meiofaunal and nematode diversity, especially compared to other non-sedimentary substrates. The posterior carapace sections harbored higher diversity and evenness compared to the anterior and middle sections, suggesting increased colonization and potentially facilitation favoring posterior carapace epibiosis, or increased disturbance on the anterior and middle carapace sections. Our findings also shed new light on the meiofauna paradox: “How do small, benthic meiofauna organisms become cosmopolitan over large geographic ranges?” Considering high loggerhead epibiont colonization, the large distances loggerheads migrate for reproduction and feeding, and the evolutionary age and sheer numbers of sea turtles worldwide, potentially large-scale exchange and dispersal for meiofauna through phoresis is implied. We distinguished different groups of loggerhead carapaces based on divergent epibiont communities, suggesting distinct epibiont colonization processes. These epibiont observations hold potential for investigating loggerhead movements and, hence, their conservation.

1. Introduction

Epibiosis in sea turtles has gained significant attention in recent years to support cryptic migratory and foraging behaviors [1,2]. The majority of epibiotic studies have focused on describing epifaunal diversity. Rarely are community questions and ecological interactions occurring on the turtle carapace addressed [3,4], or relationships between sea turtle epibionts and the environments frequented by the turtles investigated [1]. In addition, the increased focus on sea turtle epibiosis has shown that we are far removed from complete sea turtle epibiont inventories, partly owing to the limited number of taxonomic experts available, and partly because a comprehensive epibiont community analysis is difficult to achieve.
Caretta caretta, the loggerhead sea turtle, occurs in subtropical and temperate waters across continental shelves and estuarine areas in the Atlantic, Pacific and Indian Oceans [5,6]. Throughout this range, loggerheads spend most of their time in nearshore and inshore waters, sometimes associated with reefs and other natural and artificial hard substrates [5]. Loggerheads are opportunistic carnivores, feeding primarily on benthic invertebrates and freshly deceased fish, but also gelatinous plankton [7]. Following an early pelagic developmental period [8], most sea turtles, including loggerheads, transition to more coastal and neritic habitats for feeding and reproduction. In these environments, loggerheads are exposed to intense colonization by marine larvae searching for a hard substrate to start their benthic life stage [1]. So far, over 200 epibiont taxa have been documented on loggerhead carapaces [1]. Turtle carapaces also provide suitable substrates for the smallest of motile invertebrates, including the abundant and diverse meiofauna [3,4]. While prokaryotes and microscopic metazoans are likely the first to colonize carapaces, larger, mostly sessile invertebrates can provide a habitat and structure that substantially facilitate further colonization by motile organisms, and enhance the biodiversity of the fully functional epibiotic carapace ecosystem [4,9]. Loggerhead carapaces have potential as a suitable habitat for microscopic organisms, and because of this, we wish to assess how abundant and diverse such communities are, by focusing on the meiofauna.
Meiofauna (size class between 32 µm and 1 mm, but mesh sizes may vary; identified here as between 63 µm and 1 mm), are rarely the focus of sea turtle or marine mammal epibiont studies. In fact, only a handful of studies have reported the association of meiofaunal organisms and sea turtles [1,3,4,10], yet they are a vast source of biodiversity and fulfill important ecological roles in all marine ecosystems [11]. Currently, 20 metazoan phyla and three protistan (unicellular) phyla have meiofaunal representatives [12], comprising many tens of thousands to millions of species, described and yet undiscovered [13,14,15,16]. Given the biomass and diversity of loggerhead macrofaunal epibiont communities, it is likely that loggerhead carapaces have potential to host similarly diverse and abundant meiofaunal communities. Thus, these communities would have the inherent ability to raft with turtles as they migrate, with phoretic dispersal and geographic expansion as potential consequences. Meiofauna distribution patterns from local to global scales offer insights into meiofauna dispersal, migration and phoresis to an extent, but the origins of these patterns remain debated. Meiofauna are often numerically dominant, in shallow waters all the way to the deepest ocean depths. They are also the first metazoans to colonize newly available sediments and substrates [17,18]. Many meiofauna taxa are widespread or even cosmopolitan [19,20,21,22], yet meiofauna taxa typically live their entire lives in between the sediment grains, since they do not possess pelagic larval stages; instead, they show direct development or brooding [23]. The assumed contradiction between pronounced dispersal limitations of meiofauna and yet their global presence and ubiquity is captured in the concept of the ‘meiofauna paradox’ and its central question: “How do small, benthic meiofauna organisms without active means of dispersal become distributed over wide geographic ranges?” However, the presence of pelagic larvae is not the single factor causing dispersal and wide distribution ranges. Many factors may be evoked to understand the distribution ranges of meiofauna, including the underestimated dispersal potential, taxonomic artefacts, biological and evolutionary phenomena like stasis or speciation, as well as geological, oceanographic and climatic processes [24]. Often overlooked in the literature is the role of rafting or phoresis in explaining the distribution of meiofaunal taxa. Rafting implies the unintended travel of small organisms on various substrates, while phoresis is defined as smaller organisms being carried by larger organisms. By assessing the abundance and diversity of meiofaunal epibiotic communities on loggerhead carapaces, we hope to shed light on the potential dispersal capabilities of meiofauna.
Here, we comprehensively document the abundance and diversity of meiofaunal higher taxa and nematode epibionts on loggerhead sea turtles in the northeastern Gulf of Mexico. The few turtle epibiont studies focused on meiofauna have reported high abundances. Thus, we expected to recover high abundances and relatively high diversity on loggerhead sea turtles, with much of it undocumented so far in the literature. To assess how variable loggerhead epibiont communities are, we tested for the similarity of meiofauna and nematode abundance, diversity and community structure among different carapace sections (anterior, middle and posterior, following [25]) and entire carapaces. Loggerheads are highly migratory, capable of traveling hundreds to thousands of kilometers between breeding and foraging areas, where colonization may occur. We therefore also address the potential of loggerhead colonization influencing meiofauna dispersal in a broader context. In addition, differences between epibiont communities may give an indication of where loggerhead turtles have been during epibiont colonization, since distinct epibiont communities from different carapace sections and entire carapaces are likely shaped by different colonization processes (on different spatial and temporal scales) and potentially related to the origin of sea turtle epibionts prior to colonization [1].

2. Material and Methods

2.1. Study Area and Epibiont Sampling

Loggerheads nesting in the northwest Atlantic Ocean comprise the largest loggerhead population globally [26], and are the population from which most epibiont studies have originated [1]. To date, studies of sea turtle epibiosis have focused on turtles nesting on the Atlantic coast of the United States [25], which hosts the majority of nesting in this region [26]. Epibiosis has yet to be documented from loggerheads nesting in the Gulf of Mexico, which forage in different habitats and locations than loggerheads nesting on the Atlantic coast [27,28]. We therefore focused sampling on turtles nesting at St. George Island, Florida, the largest nesting assemblage in the genetically discrete Northern Gulf of Mexico Recovery Unit [26,29,30].
During the peak loggerhead nesting season (June 16th–July 1st, 2018) at St George Island, we carried out a two-week, night-time survey for nesting loggerhead turtles. Teams of scientists patrolled the beach at night, looking for nesting turtles, covering 18 kilometers of the island in four ~4.5 kilometer sections; each section was patrolled several times per night. Upon encountering a turtle, teams assessed the activity of the turtle and only commenced sampling once sampling activity was allowed according to permit conditions (either the turtle did not nest and began to return to the ocean, or the turtle nested and began covering the egg chamber; MTP-18-239). Prior to epibiont collection, turtles were measured for curved carapace length (CCL), both minimum (from the anterior point to the posterior notch along the midline) and standard [notch to tip] (from the anterior point to the posterior tip of the longest supracaudal along the midline), as well as for curved width length (CWL) [31]. Turtles were also checked for Inconel identification tags; if one was not present, then a tag was applied in each front flipper. Twenty-four loggerhead carapaces were sampled, including one recapture, which was sampled a second time one day later. Turtle carapaces were divided into three sections, roughly equal in surface area: anterior (A), middle (M) and posterior (P), following [25] (Figure 1). This resulted in 67 unique samples (some anterior sections could not be sampled, and some sections could not be sampled separately, because of the limited time available before the turtle reached the water). Barnacles were efficiently removed by placing a putty knife at the base of the barnacle and tapping it with a small hammer. This caused the barnacle to come off instantly in one piece and without damage to the carapace. This method was more efficient than pulling barnacles off with pliers or intense scraping, which may cause specimen and carapace damage if the barnacle was encrusted. Each section was then carefully but exhaustively scraped with larger putty knives to collect all visible and invisible organisms. When we were confident all visible organisms were removed, we proceeded by wiping down each section using a separate, uncontaminated wet sponge to clean the carapace entirely. All epibionts, debris, overlaying sand and sponges for each carapace section were placed carefully in 500 mL wide-mouth Nalgene containers. ‘Control’ sand samples were taken at high (near nest), middle (between nest and tideline) and low (tideline) beach, corresponding with the location for each of seven turtles, by means of 9 cm high, 3 cm diameter plastic cores, to compare meiofauna and nematode abundance and communities found in the beach sand and on the loggerhead carapaces. Three cores were taken from each of the high, middle and low beach locations; these three cores were pooled for analysis, resulting in 21 sand samples (three beach levels x seven turtle locations). These samples were used to assess potential contamination of the carapace by the meiofauna, because during the digging and the covering of the nest, a substantial amount of sand is swept onto the carapace. Fixative (DESS, a DMSO and EDTA salt solution [32], suitable for morphological (present study), as well as molecular analysis (future studies)) was added to the carapace epibiont and beach samples as soon as possible (usually within an hour of sampling). All the samples were kept on ice, until stored in refrigerators within two days of sampling.

2.2. Meiofauna and Nematode Processing

Both carapace and sand samples were processed the same way. Samples were washed over a stack of 1 mm and 63 µm sieves to separate the macrofauna (>1 mm) and meiofauna (63 µm–1 mm) size fractions at the Florida State University Coastal and Marine Laboratory. The washed macrofauna were placed in DESS in 500 mL Nalgene bottles, and the rinsed meiofauna were collected in 250 mL Nalgene bottles, also in DESS. To extract the meiofauna organisms from debris and sediments, we applied the decantation method [33]. Each meiofauna sample was placed in 1 L measuring beakers, and topped up with tap water to 550 mL; the volume was vigorously stirred (but avoiding splashes or spills) and left until the sand settled (usually within minutes), after which the supernatant was poured off on a 63 µm sieve, and collected in a 250 mL bottle. This decantation procedure was repeated 10 times for each sample.
We observed that vast numbers of organisms were collected, and that subsampling was necessary. The washed and decanted meiofauna samples were placed in a 1 L beaker (volumes were calibrated) and topped up to 800 mL with tap water. Each sample was homogenized using a magnetic stirrer (600 rpm), and 2% of the total volume was extracted using clean pipettes, ensuring that a representative subsample was taken. Following counting (see below), the subsampling procedure was repeated until at least 300 meiofauna individuals were encountered, unless the entire sample needed to be counted. This yielded a representative subsample of the community present in the sample (11% of total sample size on average). Tap water control samples were taken before, during and after the washing procedure (taps were left running for 10 min on 63 µm sieve several times), to ensure that samples were processed with contamination-free water. No organisms were recovered from these control samples.
Meiofauna were identified and counted in gridded Petri-dishes or purpose-built counting trays to higher taxon level following [34], and specific keys to invertebrates for the Gulf of Mexico, using stereoscopic microscopes (250–500 × magnification). Nematodes were picked out randomly (minimum of 120, or all if less than 120 were present) and placed in embryo dishes for diaphanization in a solution of 50% tap water, 10% glycerol and 40% alcohol, adapted from [35]. Partially covered embryo dishes were left in the oven overnight at 55 °C to allow for the evaporation of water and alcohol, with the nematodes left in pure glycerol. Embryo dishes were then placed in a cabinet desiccator until mounting on glass slides [35]. After mounting, nematodes were identified to genus level (1000× magnification), or family level, where the genus could not be identified (note that family level classifications still comprise at least one unique genus), using [36,37,38] and specialized nematode taxonomic literature and descriptions.

2.3. Data Analyses

Meiofauna higher taxa and nematode generic analyses were based on total abundance and counts matrices. For two loggerhead turtles, we were not able to sample carapace sections separately; these samples were not considered in analyses where carapace sections were compared, but were included in analyses where only entire carapaces were used. The total abundance data was used for carapace section analyses, while the carapace section data were summed for each turtle individual when conducting entire carapace (i.e., for each individual turtle) analyses. All multivariate analyses were conducted on standardized (by sample totals) and square root transformed data, to reduce the effect of highly variable abundances and highly dominant taxa. For multivariate data (abundance matrices) and univariate data (abundance, density and diversity indices), Bray-Curtis and Euclidean distance were used as the resemblance measures, respectively. Multivariate and univariate PERMANOVAs to test for carapace section differences were conducted using a one-way design (factor: carapace section; anterior, middle, posterior). These were followed with pairwise tests and PERMDISPs, to assess whether dispersion of homogeneity affected the results. Non-metric Multi-Dimensional Scaling ordinations (nMDS) were used to visualize community patterns, overlain with vector plots, bubble plots, and pie bubbles allowing taxa correlations and abundance of different taxa to be represented. These were accompanied by CLUSTER (including SIMPROFs with 5% significance tests) analyses to assess groups of samples that were significantly different from each other. SIMPER was used to assess the dissimilarity of the cluster groups, and to identify the taxa that were mainly responsible for differences between these groups. The DIVERSE routine was used to generate meiofauna higher taxa richness and nematode genera diversity indices (genus richness, ES(51) [39], Hills Indices (N1, N2, Ninf) [40]), covering a range of indices between pure richness (S) and evenness (dominance index = Ninf) [41]. Nematode genus richness was used to calculate cumulative dominance curves to assess diversity and evenness among carapace sections. Finally, coherence plots were generated to assess how specific genera occurrence and abundance changed among different carapace sections [42,43].
Carapace surface area was estimated as the surface area of an ellipse using A = PI × a × b (with a and b being half the minor (CWL) and major (CCL) axes values). For one turtle, width measurements were missing and replaced with calculated width, using the regression equation based on all other complete turtle measurements (y = 0.7214x + 18.198; R2 = 0.6551). Carapace surface area ranged 5427–8076 cm2, averaging 6413 cm2. Surface area for the beach core samples was calculated as 3 × PI × r(1.5 cm)2 = 21.2 cm2 (triplicates pooled). The carapace surface areas were used to calculate meiofauna density (ind./10 cm2) for testing differences among carapace sections. The very low abundances of meiofauna in beach samples relative to the carapace epibiont abundances, the contrast between carapace and core sample surface areas (as calculated above), and the inherent differences in the habitat complexity between hard substrate surfaces and the 3D interstitial sediment matrix made direct comparisons difficult. We therefore used only meiofauna and nematode community structure (nMDS, PERMDISP) and diversity (richness) to compare beach and carapace samples, whereby data were presence-absence transformed. This transformation reduced or eliminated the effect of inherent abundance and habitat structure differences, yet it still allowed us to assess the commonality of taxa between carapace and beach samples. All analyses and plot renderings were conducted using PRIMER v7 [42] and the PERMANOVA+ add-on [44].

3. Results

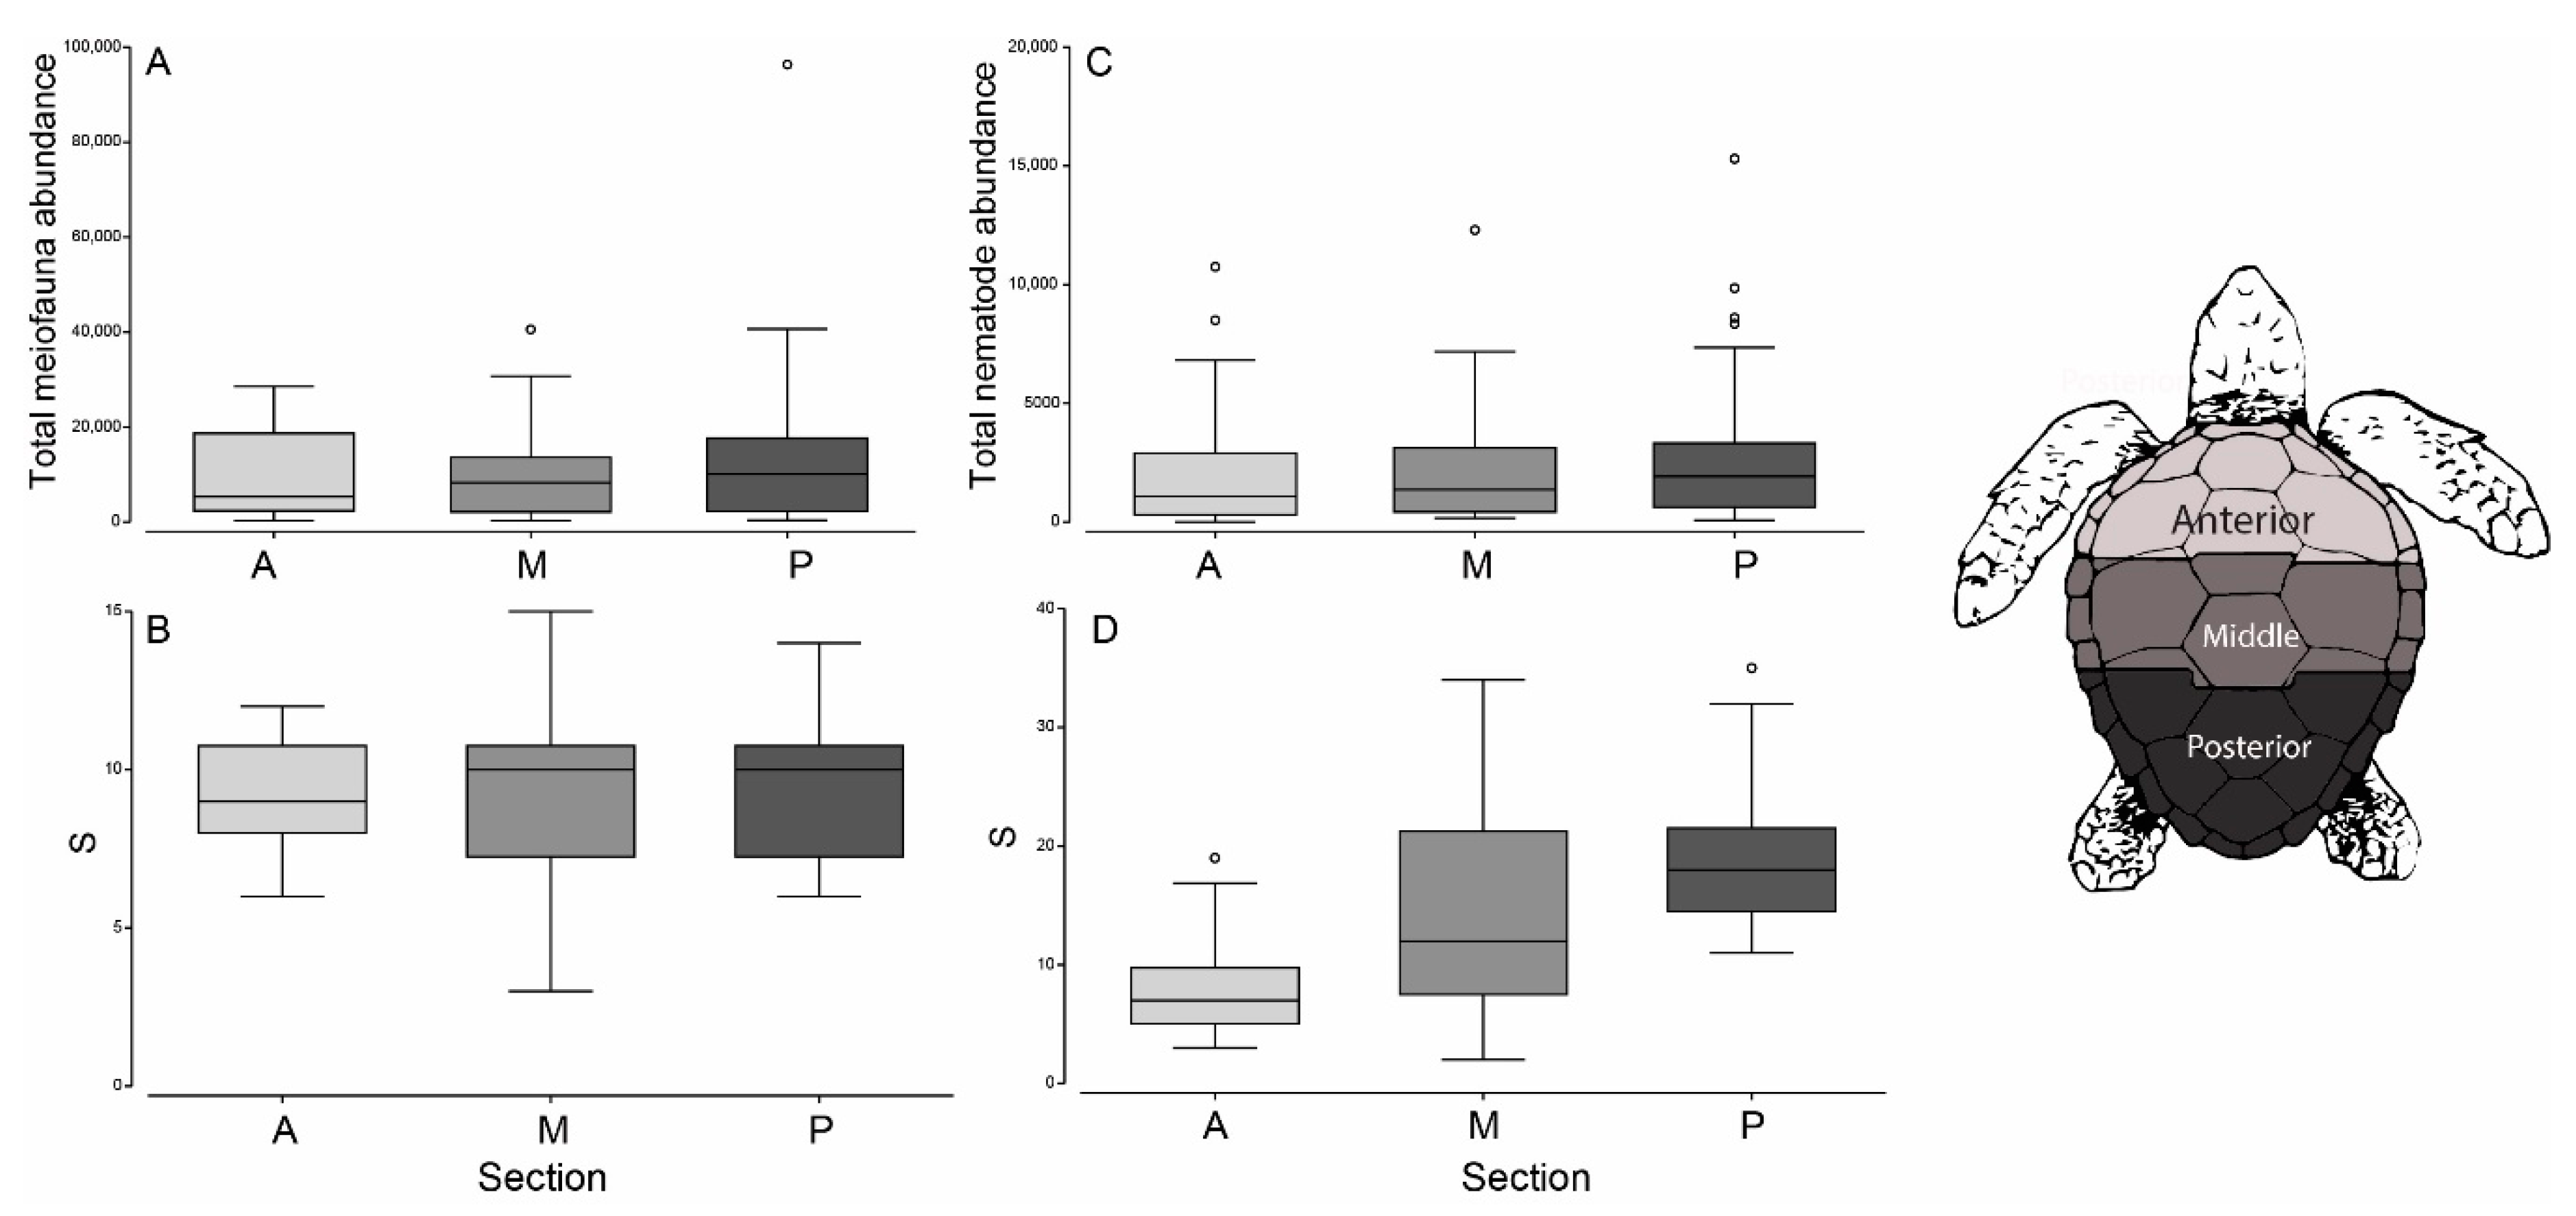
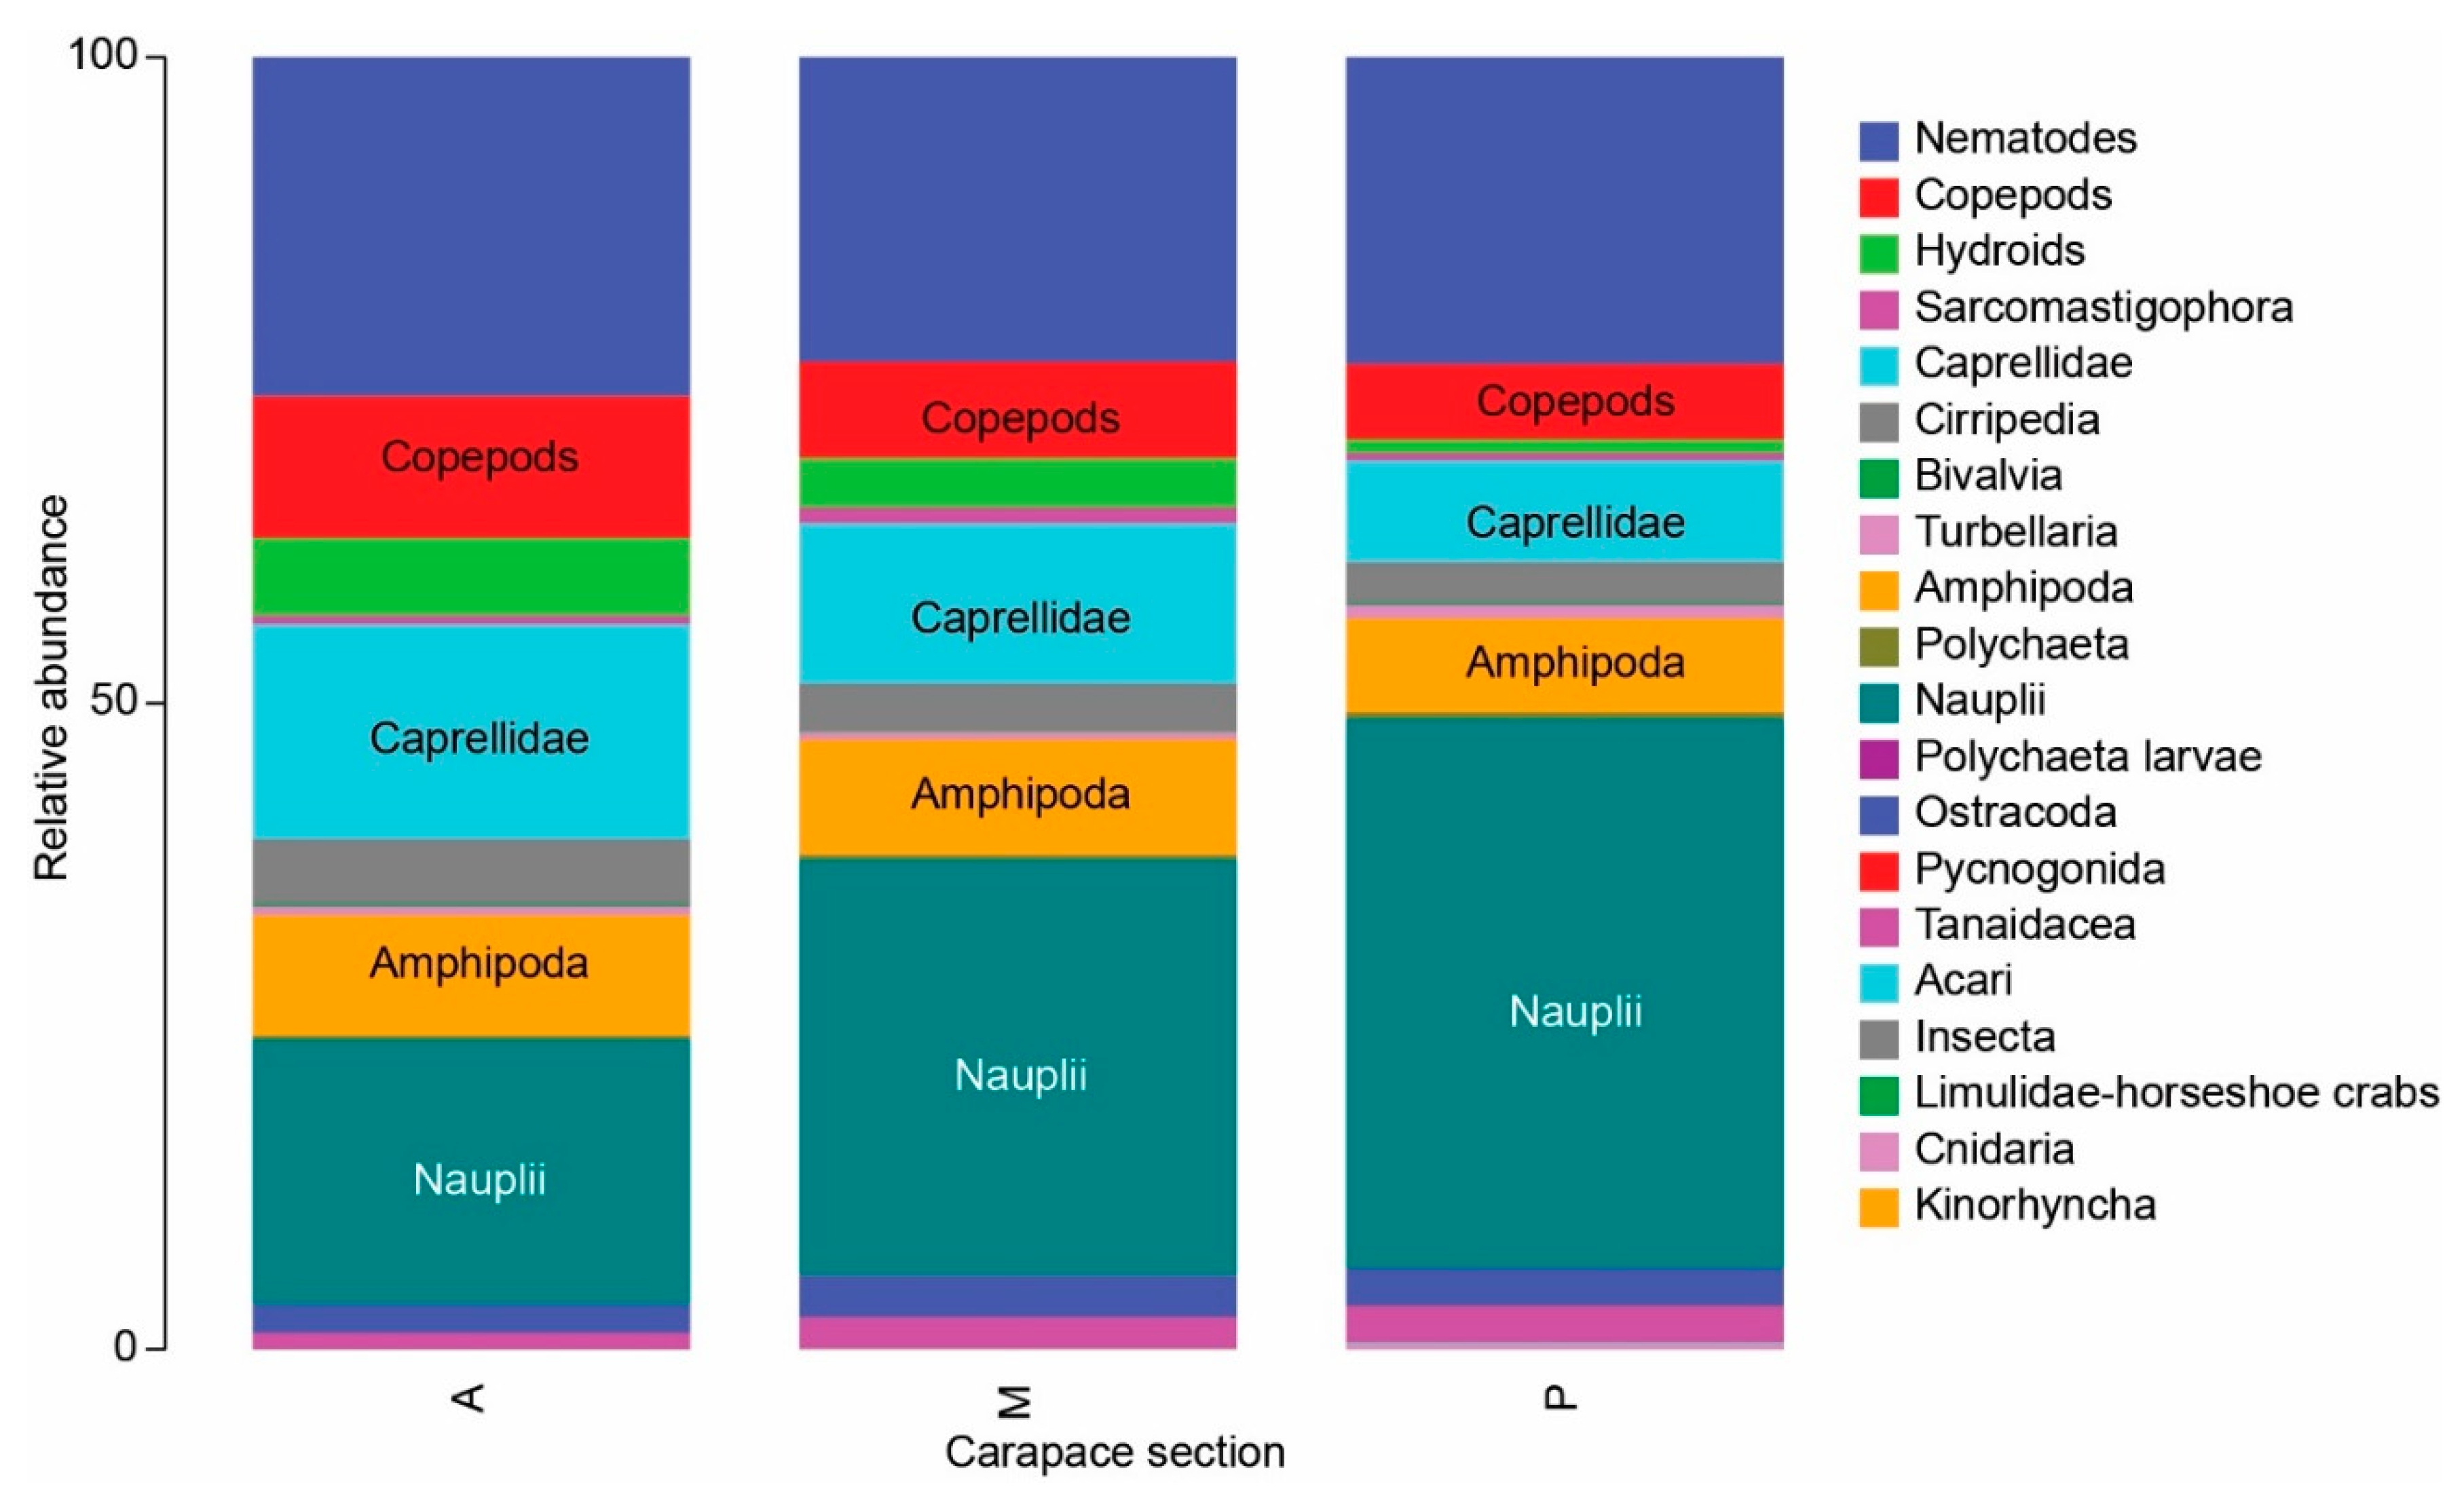
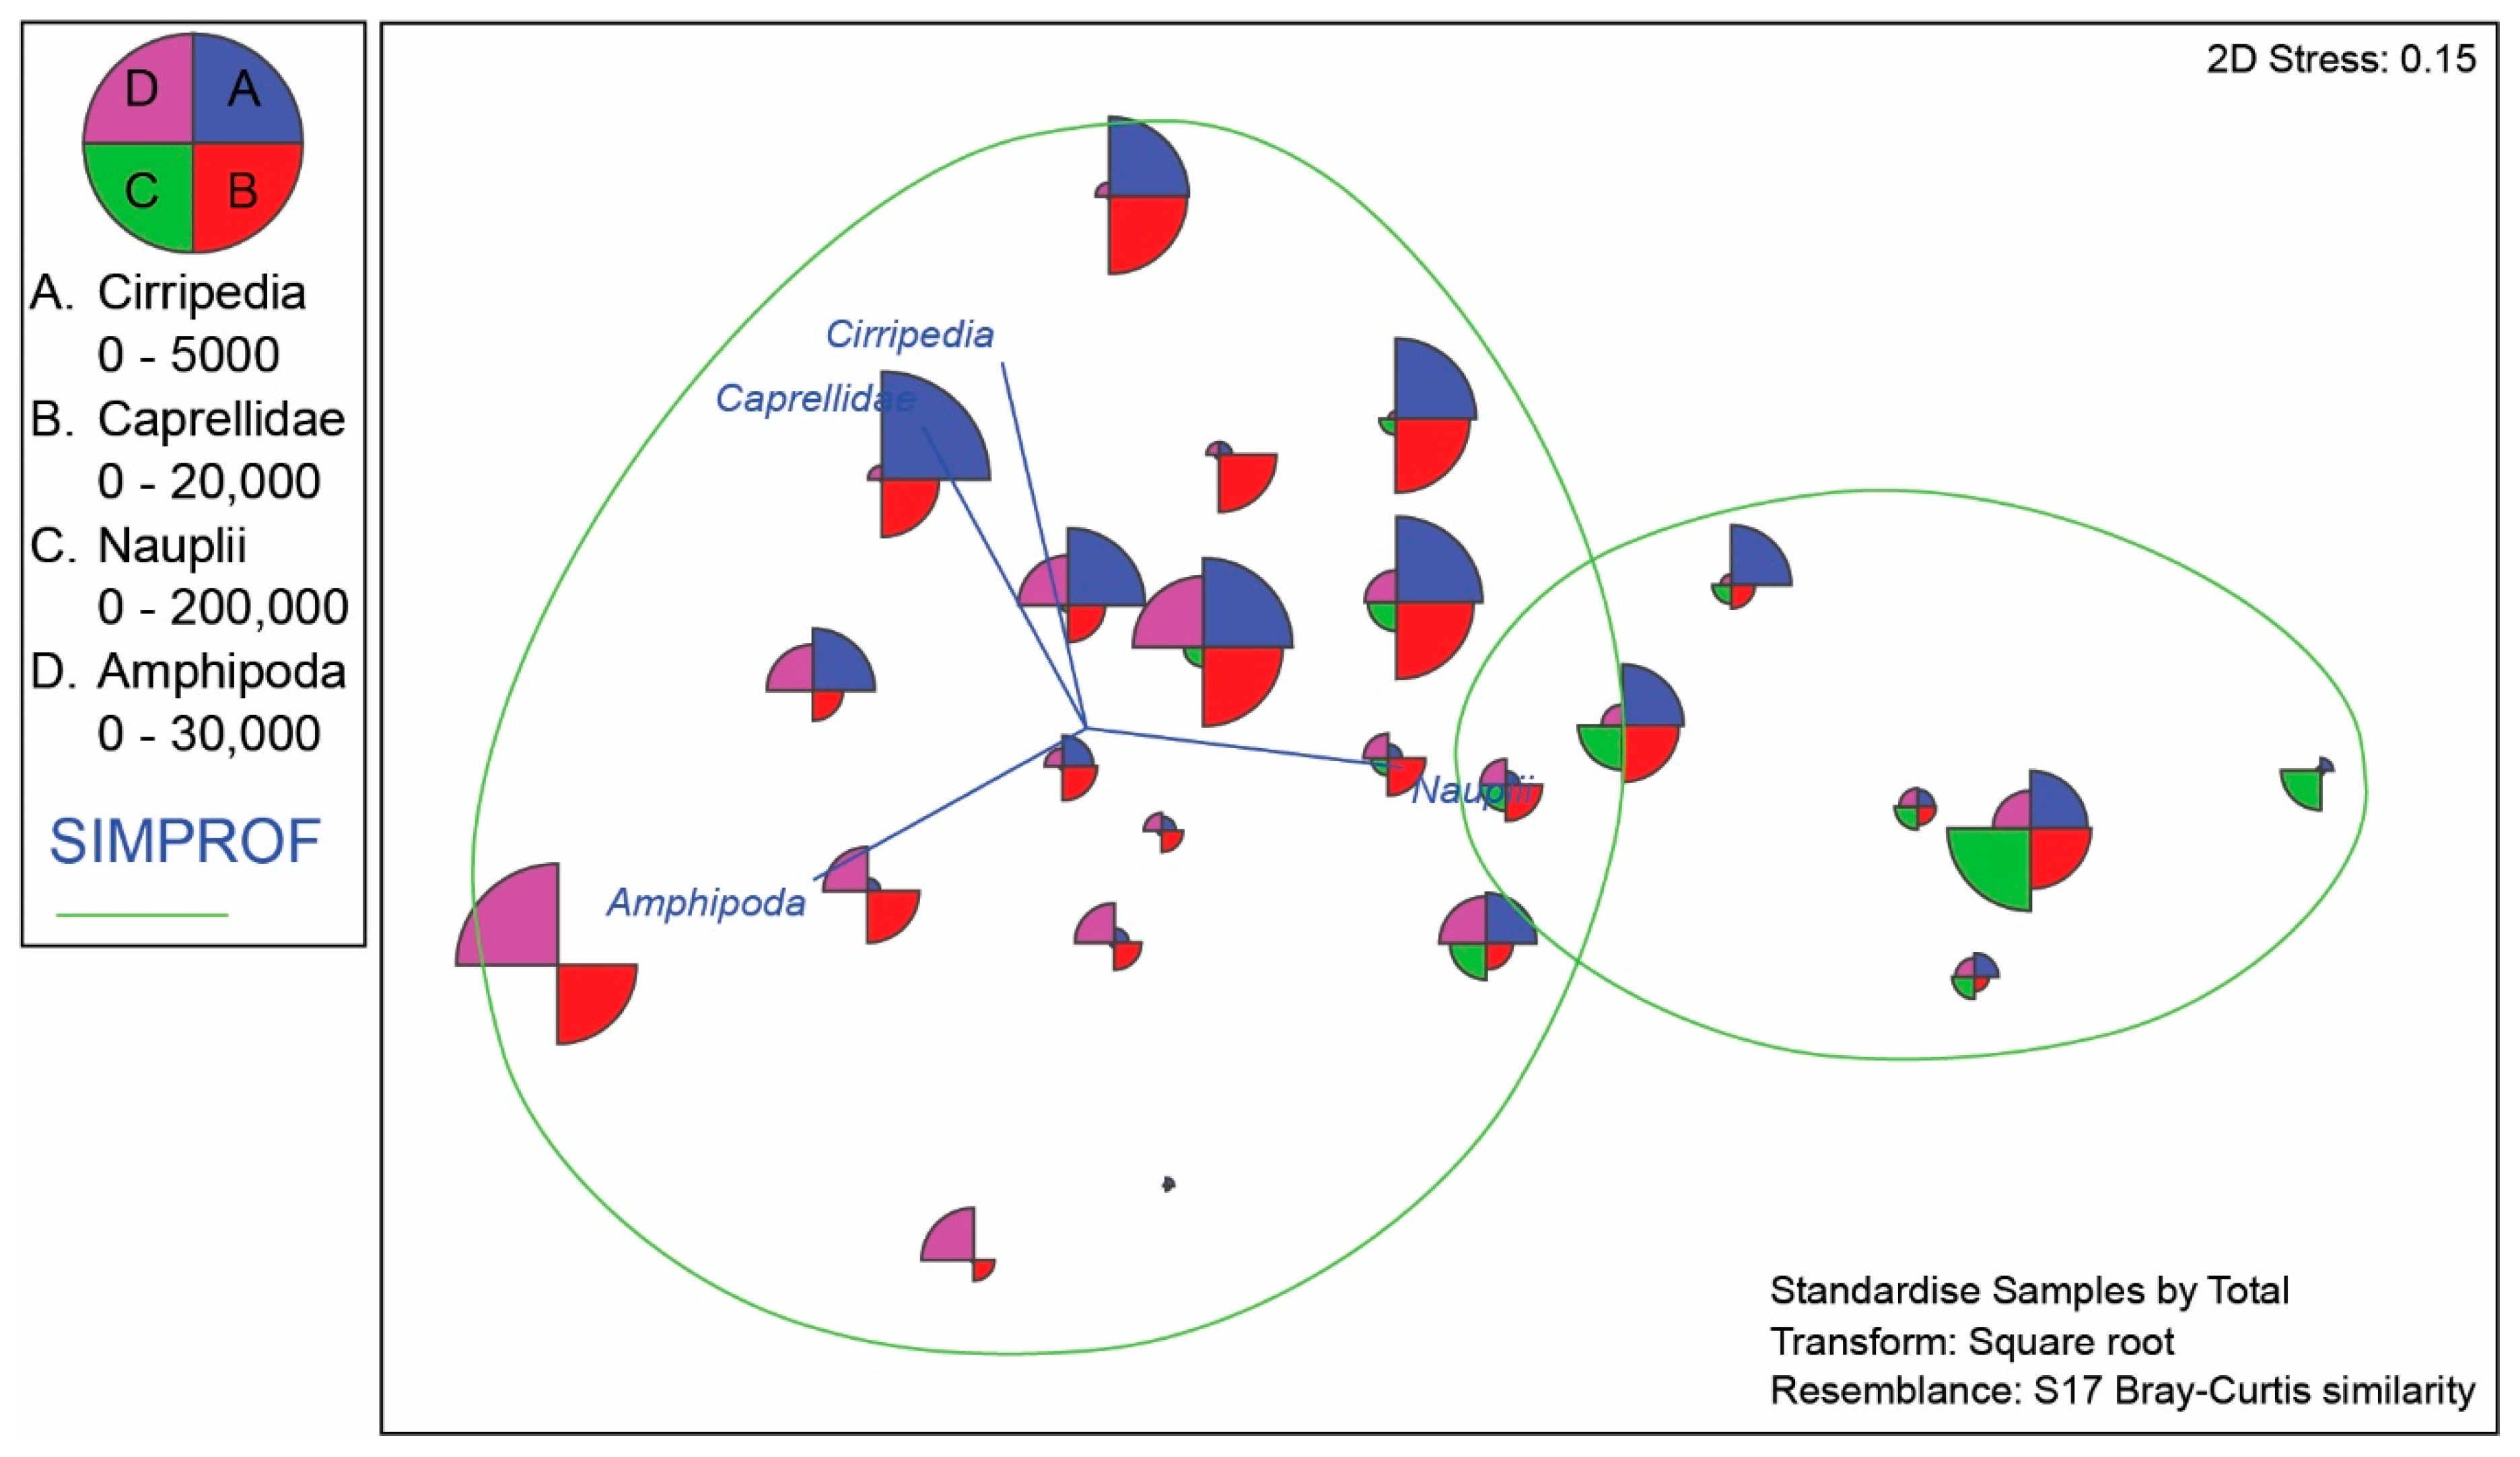
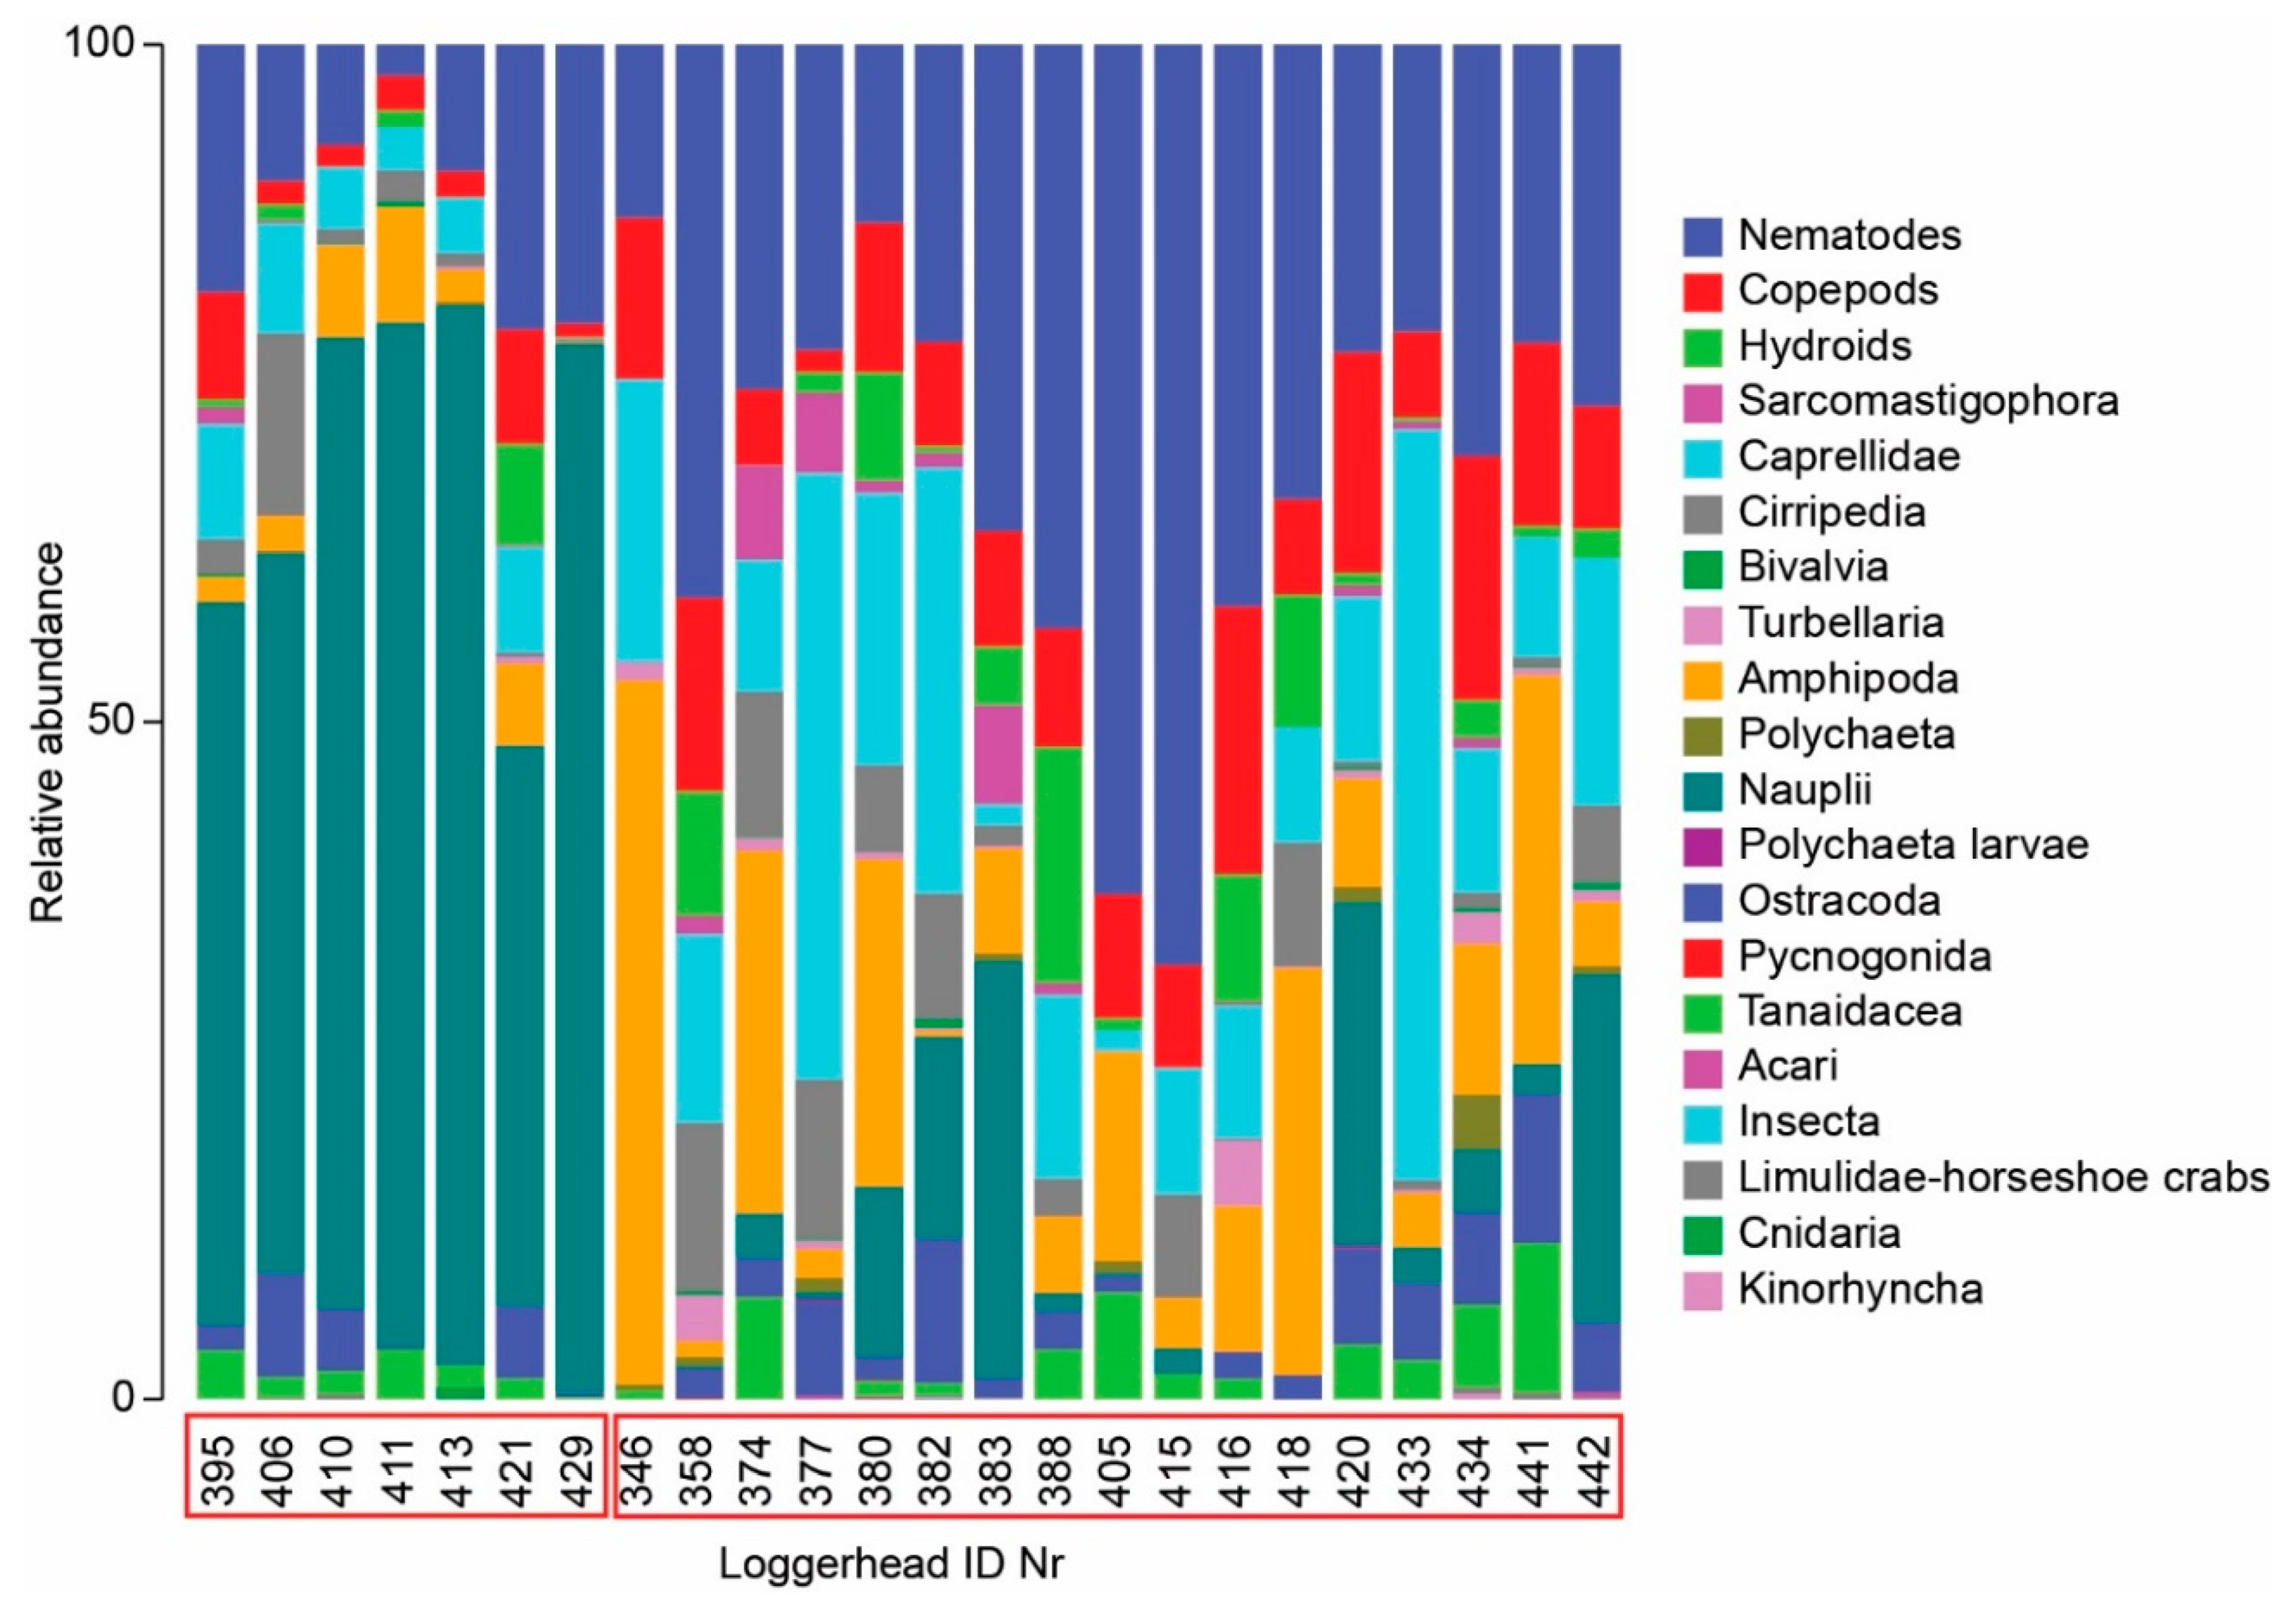
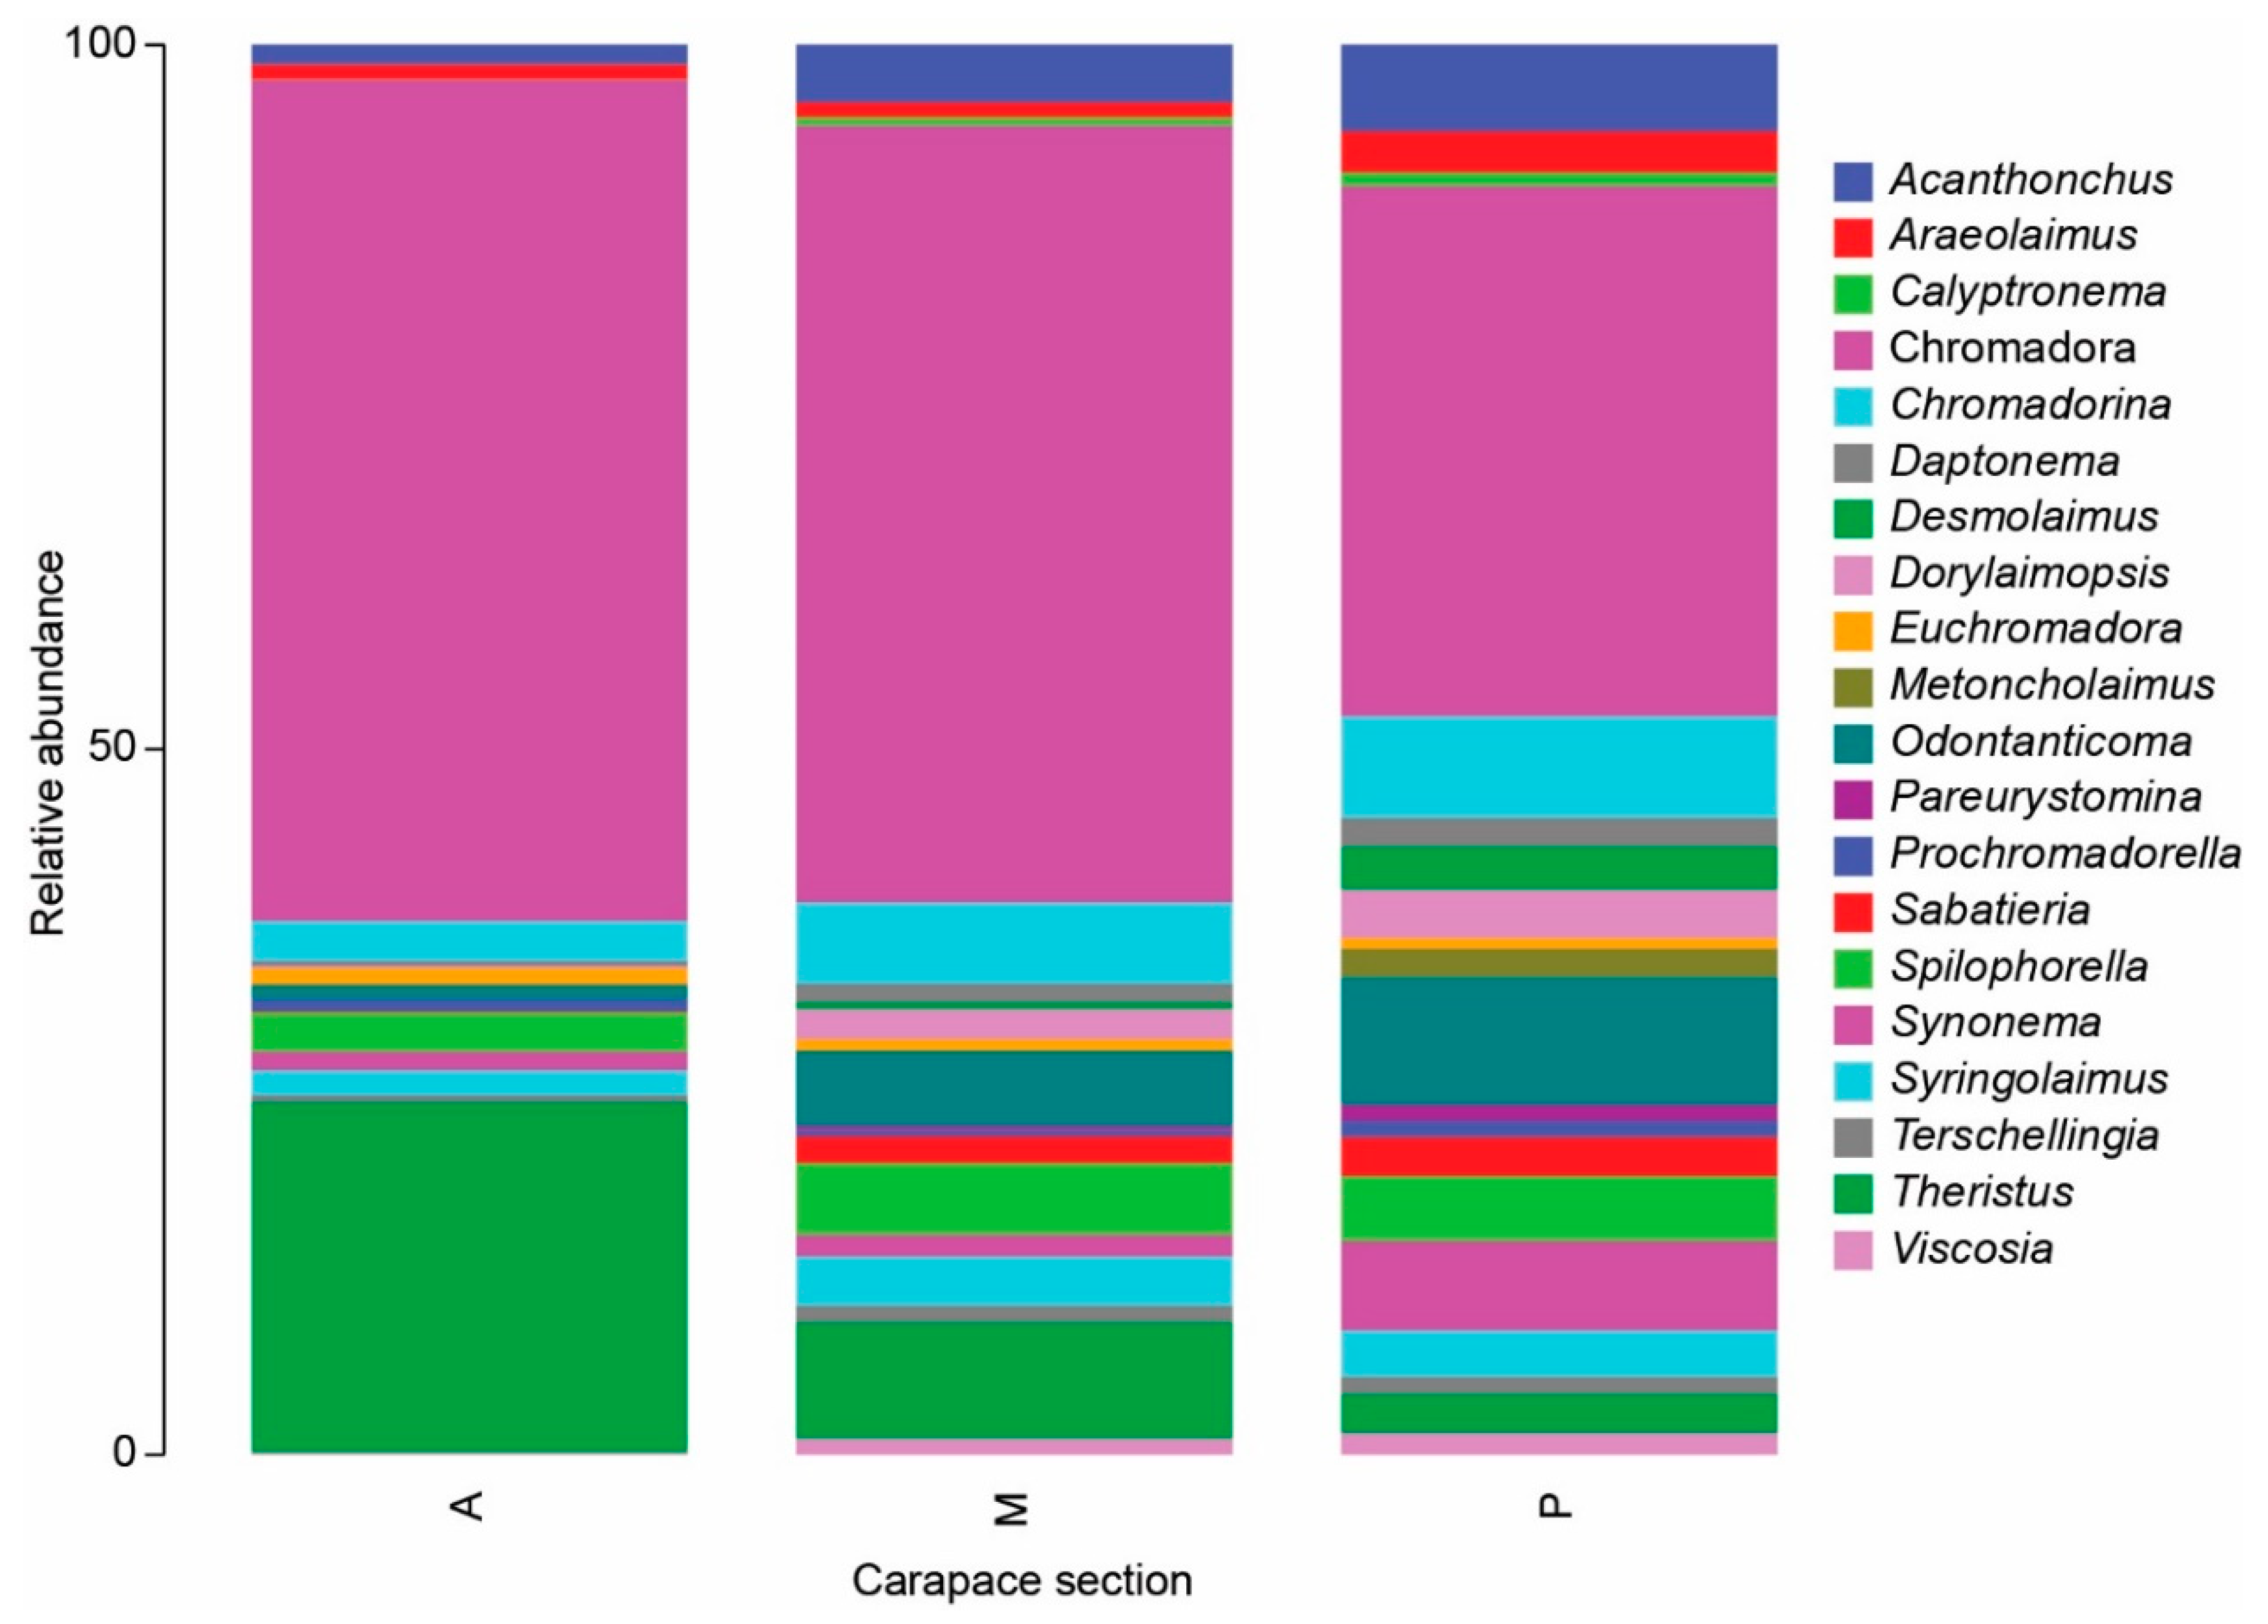
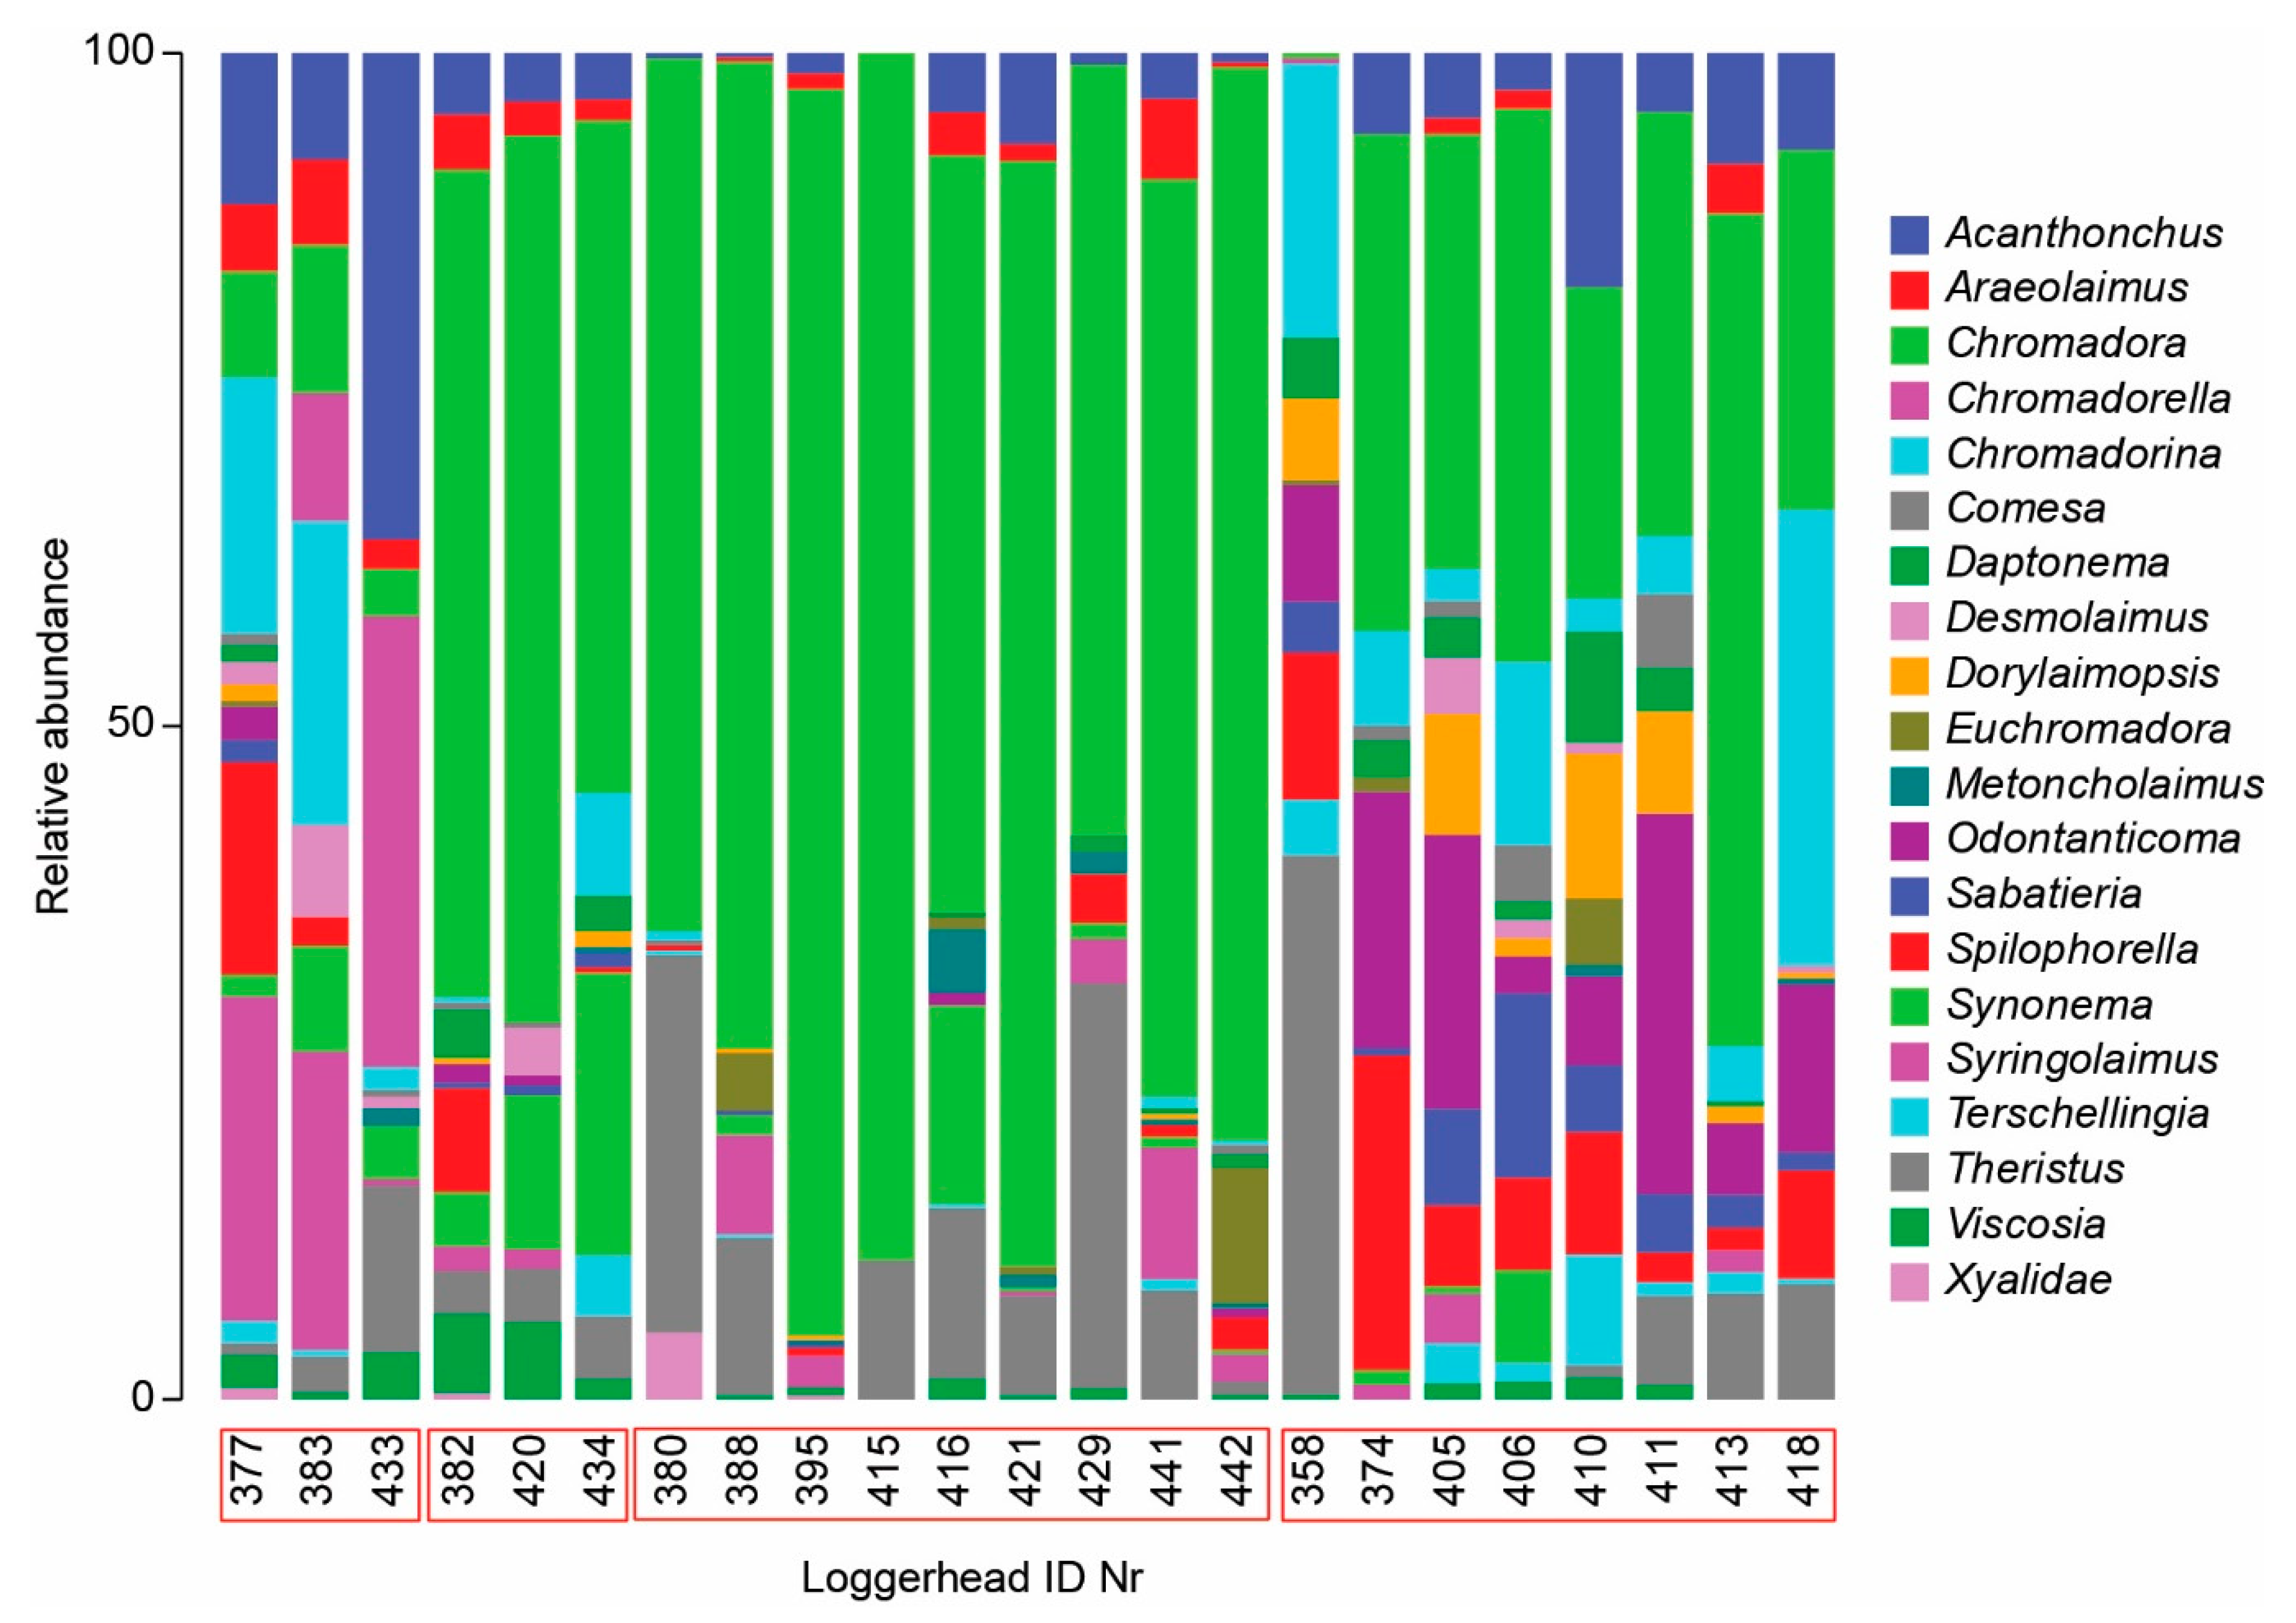
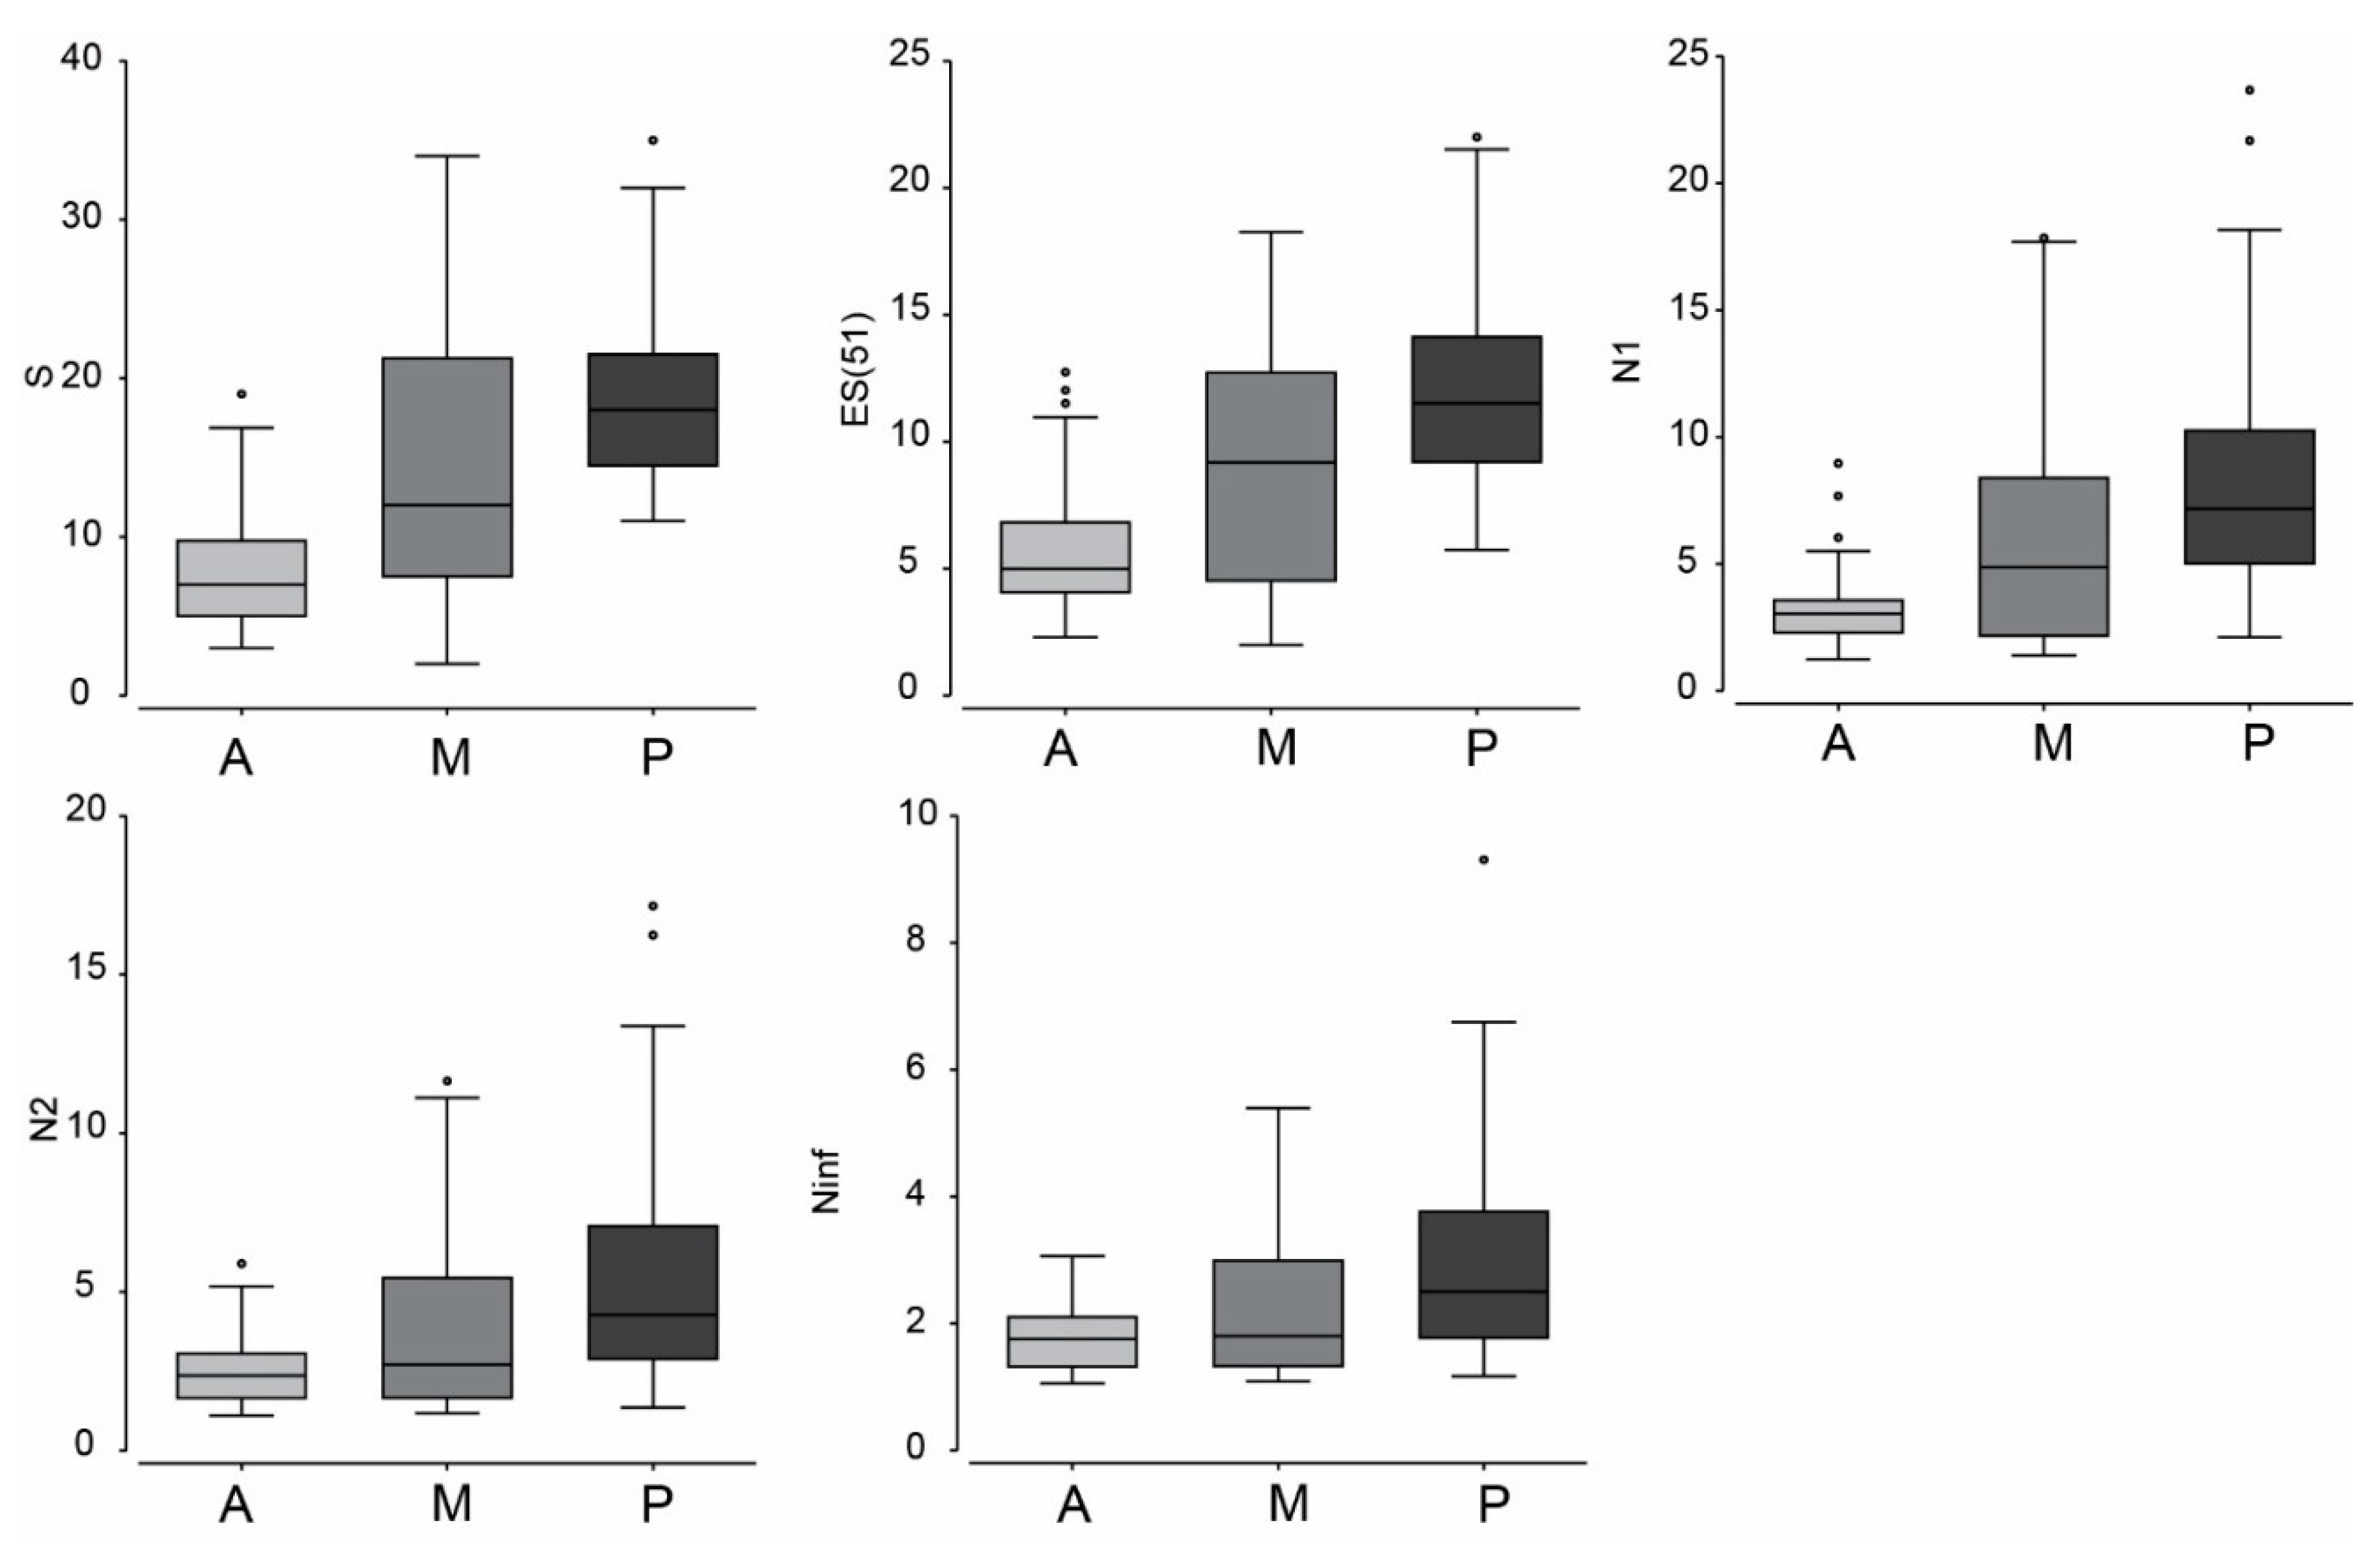
3.1. Meiofauna Communities

Abundance and density. Meiofauna abundance ranged 353–146,190 per entire carapace (average: 33,781 ± 30,596 SD). The minimum of 353 individuals occurred on the recaptured loggerhead turtle, with the next lowest abundance being 6950 individuals. Meiofauna abundance per carapace section: anterior: 333–28,540, average: 9306 ± 9244 SD; middle: 353–40,570, average: 9660 ± 9450 SD; posterior: 382–96,350, average: 13,561 ± 19,715 SD (Figure 1). There was no significant difference in meiofauna abundance nor meiofauna density (ind./10 cm2) between the different carapace sections (PERMANOVA, p = 0.567, p = 0.598, respectively).
Community structure. Meiofauna higher taxa community structure did not show any significant differences between the carapace sections (PERMANOVA, p = 0.389), but stacked bar plots in Figure 2 show some variability in taxa composition for each section averaged across all carapaces (e.g., Copepoda, Cirripedia, nauplii and Amphipoda).
Meiofauna higher taxa community cluster analysis indicated two significantly different groups of turtle carapaces (p < 0.05). The nMDS in Figure 3 shows this clustering in relation to taxa that have Pearson correlations with the nMDS axes >0.5 (cf. overlying vectors, size represent strength of correlation), namely nauplii, Cirripedia, Caprellidae and Amphipoda. Caprellidae belong to the Amphipoda but were treated separately here, because they are specifically adapted to attach to substrates by their grasping appendages, called pereopods, unlike the other Amphipoda. Nauplii were mostly, if not all, larval harpacticoid copepod stages. The two carapace groups are distinguished mainly by the differences in nauplii abundance, as indicated by the bubble pie charts in the nMDS of Figure 3. The SIMPER analysis shows that nauplii contribute 28.49% to the differences between the two cluster groups. The smaller cluster in the nMDS has an average similarity value of 75.46%, while the larger cluster has a similarity of 68.34%; their dissimilarity was 42.69%. The prominent role of nauplii in distinguishing the two significant carapace groups is also clear in the stacked bar chart in Figure 4, where a trade off in relative abundance is noticeable between nauplii and other meiofaunal taxa.
Diversity. A total of 20 meiofauna higher taxa were recovered from loggerhead carapaces (Table S1), with 16, 18 and 18 higher taxa appearing on anterior, middle and posterior sections, respectively. Polychaete larvae and kinorhynchs were only found on the middle sections, pycnogonids only on the posterior sections. Average taxon richness per sample was 9.2 ± 2.3 SD, ranging between 3 and 15 taxa. PERMANOVA analyses did not show significant taxon richness differences between sections (p = 0.995). For entire carapaces, the average richness was 11.8 ± 2.4, ranging between seven and 16 taxa. Meiofauna taxon richness per section is shown in Figure 1.

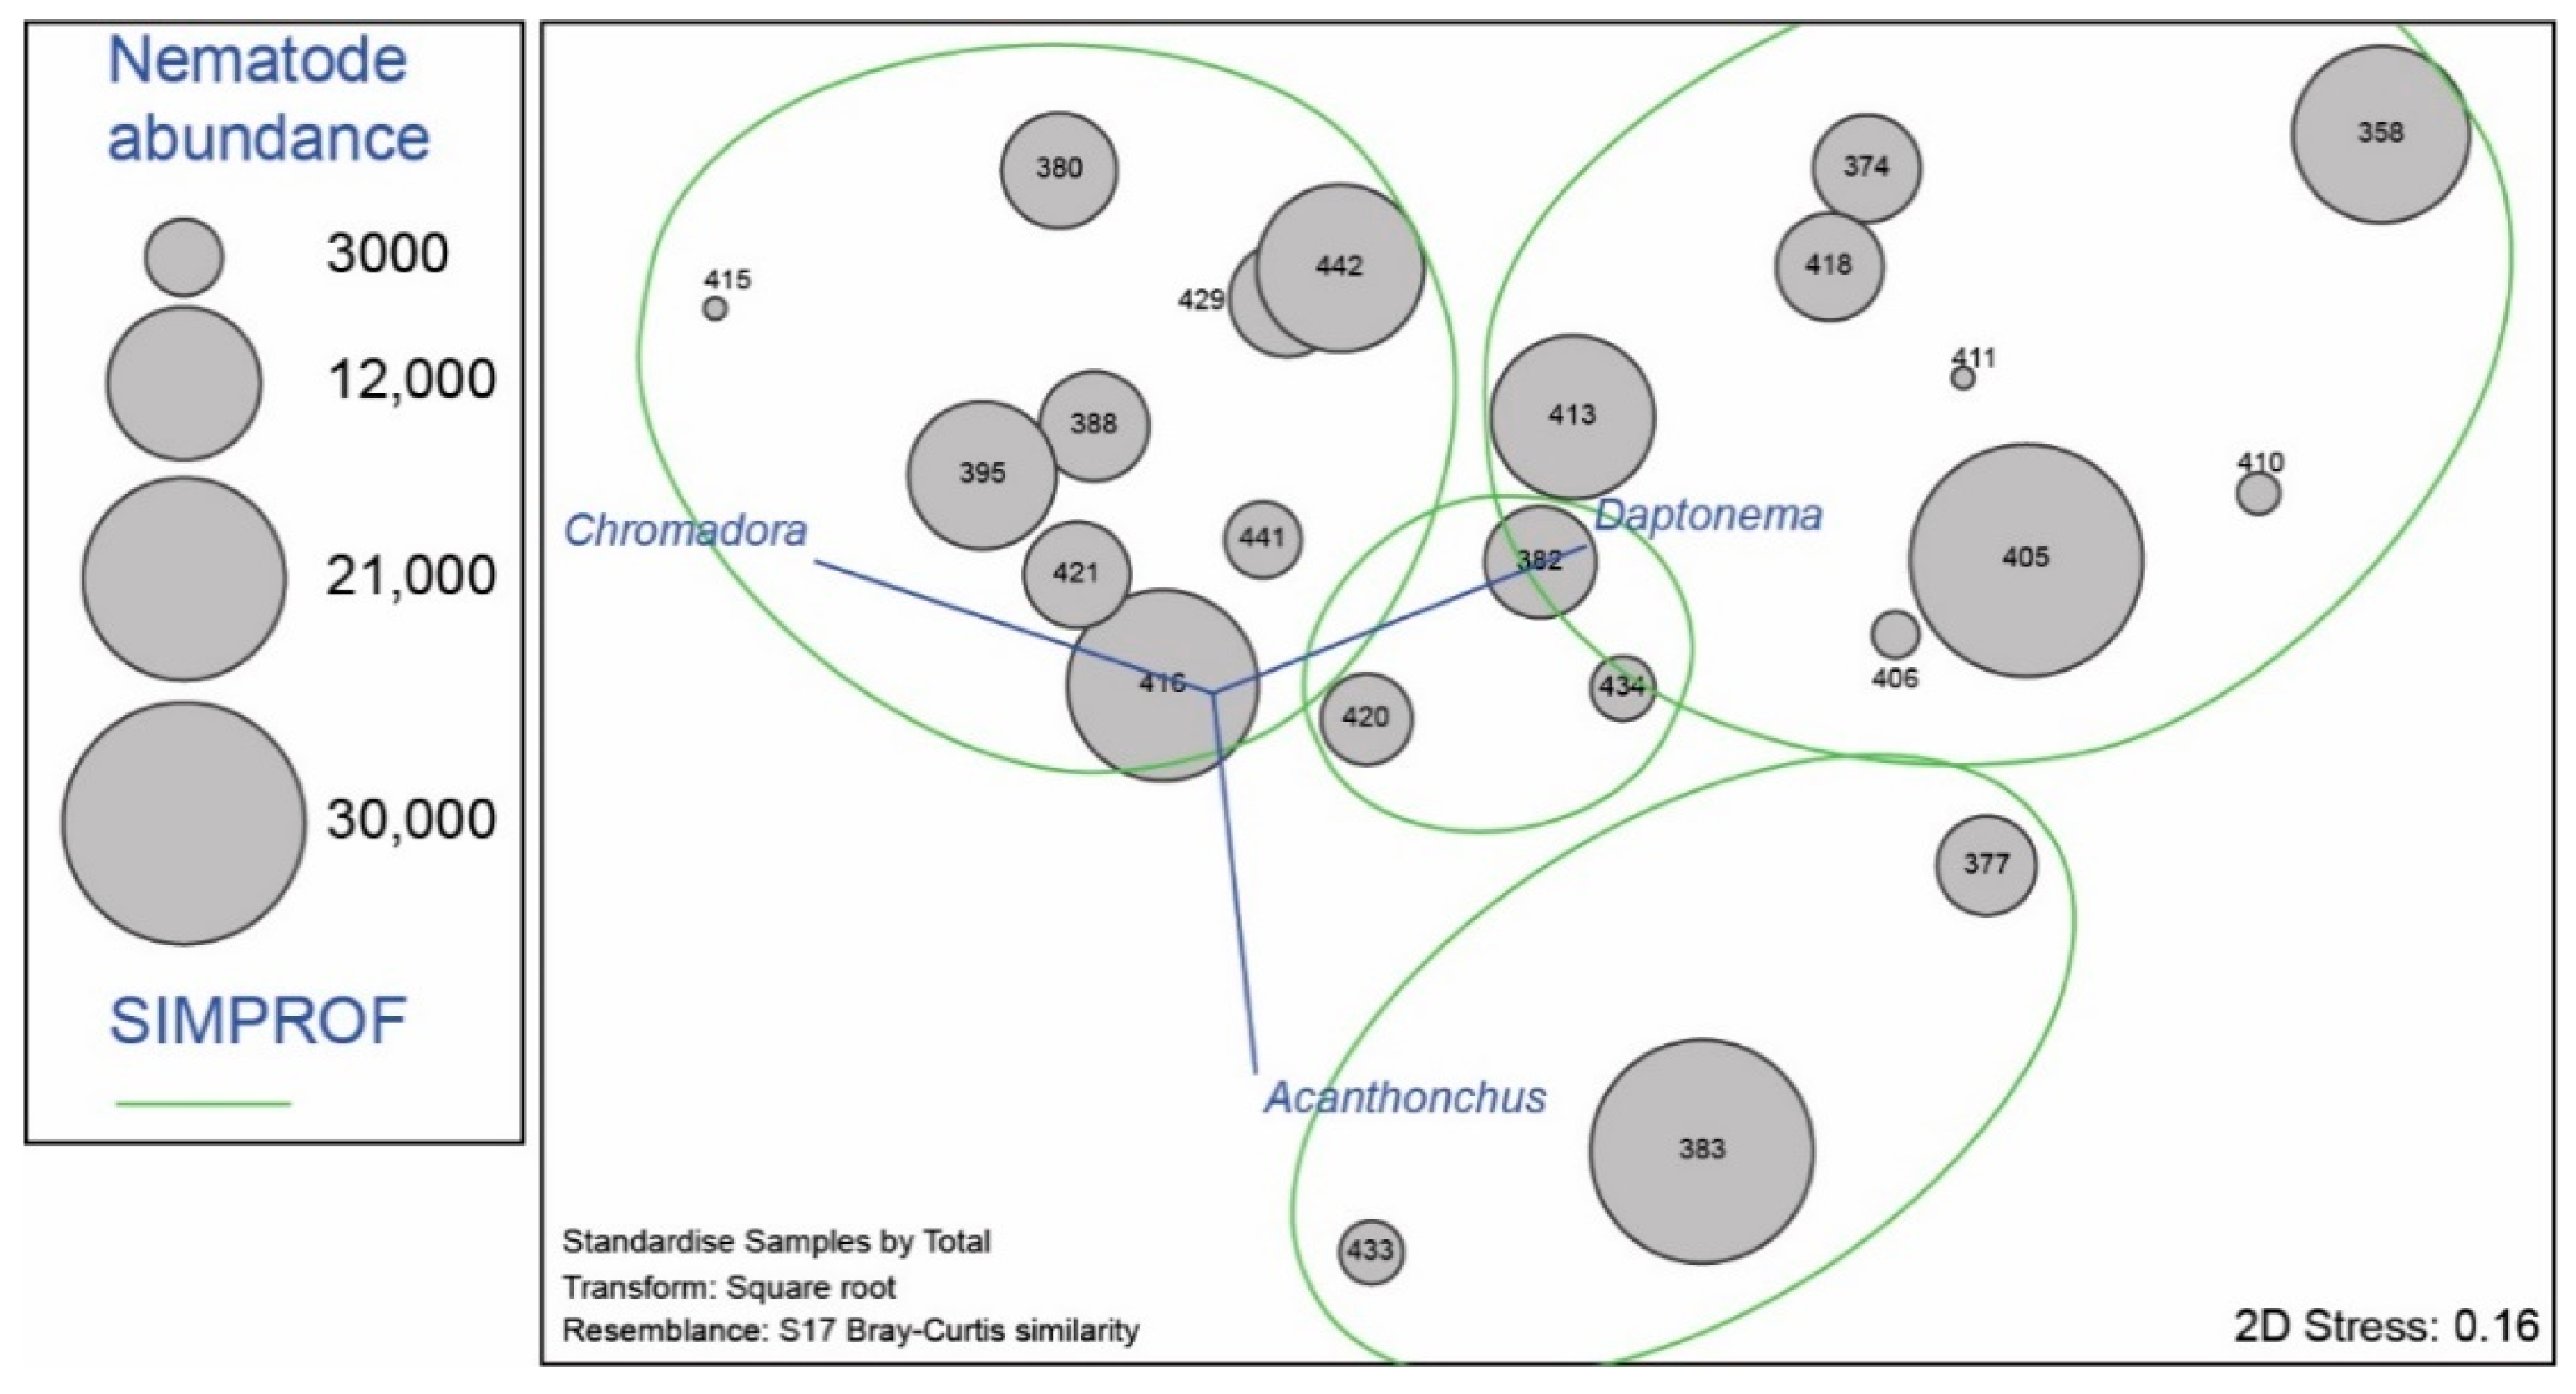
3.2. Nematode Communities

Abundance and density. Nematode abundance ranged 6–15,300 individuals per carapace section (average 2656 ± 3207), while per entire carapace nematode abundance ranged 240–27,600 (average 8152 ± 7549) (Figure 1). A total of 195,648 nematodes were found on loggerhead carapaces. Nematode abundance and density (ind./10 cm2) did not differ significantly between the carapace sections (PERMANOVA, p = 0.561, 0.522, respectively).
Community structure. Nematode community structure differed significantly between the carapace sections (PERMANOVA, p = 0.002), with pairwise tests indicating significant differences between the posterior and anterior sections, as well as between the posterior and middle sections (PERMANOVA, p = 0.001, p = 0.011, respectively). No significant differences were observed between the anterior and middle sections (PERMANOVA, p = 0.411). PERMDISP analyses to assess whether these differences were caused by heterogeneity in dispersions were not significant (p = 0.986). These differences can be observed in Figure 5, where a reduced abundance of Chromadora and Theristus, and increased abundance of Odontanticoma occur in the posterior carapace sections. Coherence curves were calculated to assess genera that exhibited significantly similar patterns among carapace sections. This analysis showed that eight different groups of genera (based on the 30 most important genera only) can be distinguished based on their abundance on different sections (Figure S1). Accordingly, five genera showed highest abundance on anterior sections (Chromadora, Chromadorella, Euchromadora, Theristus and Xyalidae), and a larger number of genera for the posterior sections, such as Araeolaimus, Prochromadorella, Synonema, Desmolaimus, Marylynnia, Oncholaimellus and Paryeurystomina, among others. Only three genera showed highest abundance middle sections, Metachromadora, Metalinhomoeus and Microlaimus.
Nematode genera community cluster analysis indicated four significantly different groups of turtle carapaces (p < 0.05). The nMDS in Figure 6 shows this clustering in relation to genera that have Pearson correlations with the nMDS axes > 0.7 (cf. overlying vectors, size represent strength of correlation), namely Chromadora, Daptonema and Acanthonchus. Stacked bar plots in Figure 7 show the structuring of genus composition across the range of entire carapaces, supported by the cluster analyses. The SIMPER similarity and dissimilarity for each of these groups and their pairwise comparisons is given in Table S2, along with the main genera responsible for the (dis)similarities.
Diversity. A total of 111 nematode genera were observed on loggerhead carapaces. On individual carapace sections, between two and 35 nematode genera were found (average 14.1 ± 8.0), suggesting relatively high turnover between individual samples and carapace sections. The total number of genera on carapace sections were 51, 79 and 92, for anterior, middle and posterior sections, respectively. This suggests greater diversity on posterior sections, as also indicated by: 1) the average genus richness values (Table 1) the cumulative dominance curves, which show evenness and diversity increasing along the anterior, middle, posterior carapace section gradient (Figure S2); and 3) PERMANOVA test (p = 0.001), with pairwise testing showing significant differences (p < 0.05) between all the carapace sections (Table 2; PERMDISP non-significant with p > 0.05).
On entire carapaces, between two and 50 genera were observed (average 26.6 ± 11.0), suggesting a reasonably high turnover between turtle individuals. Only two genera were recovered from the recaptured loggerhead, while the minimum number of nematode genera from newly encountered turtles was 16. Further details on number of nematode genera are given in Table 1. Other diversity indices all show the same trend of increasing diversity and evenness from anterior to middle to posterior carapace sections, supported by main PERMANOVA tests with p < 0.05 and multiple significant pairwise tests (Table 2, Figure 8).

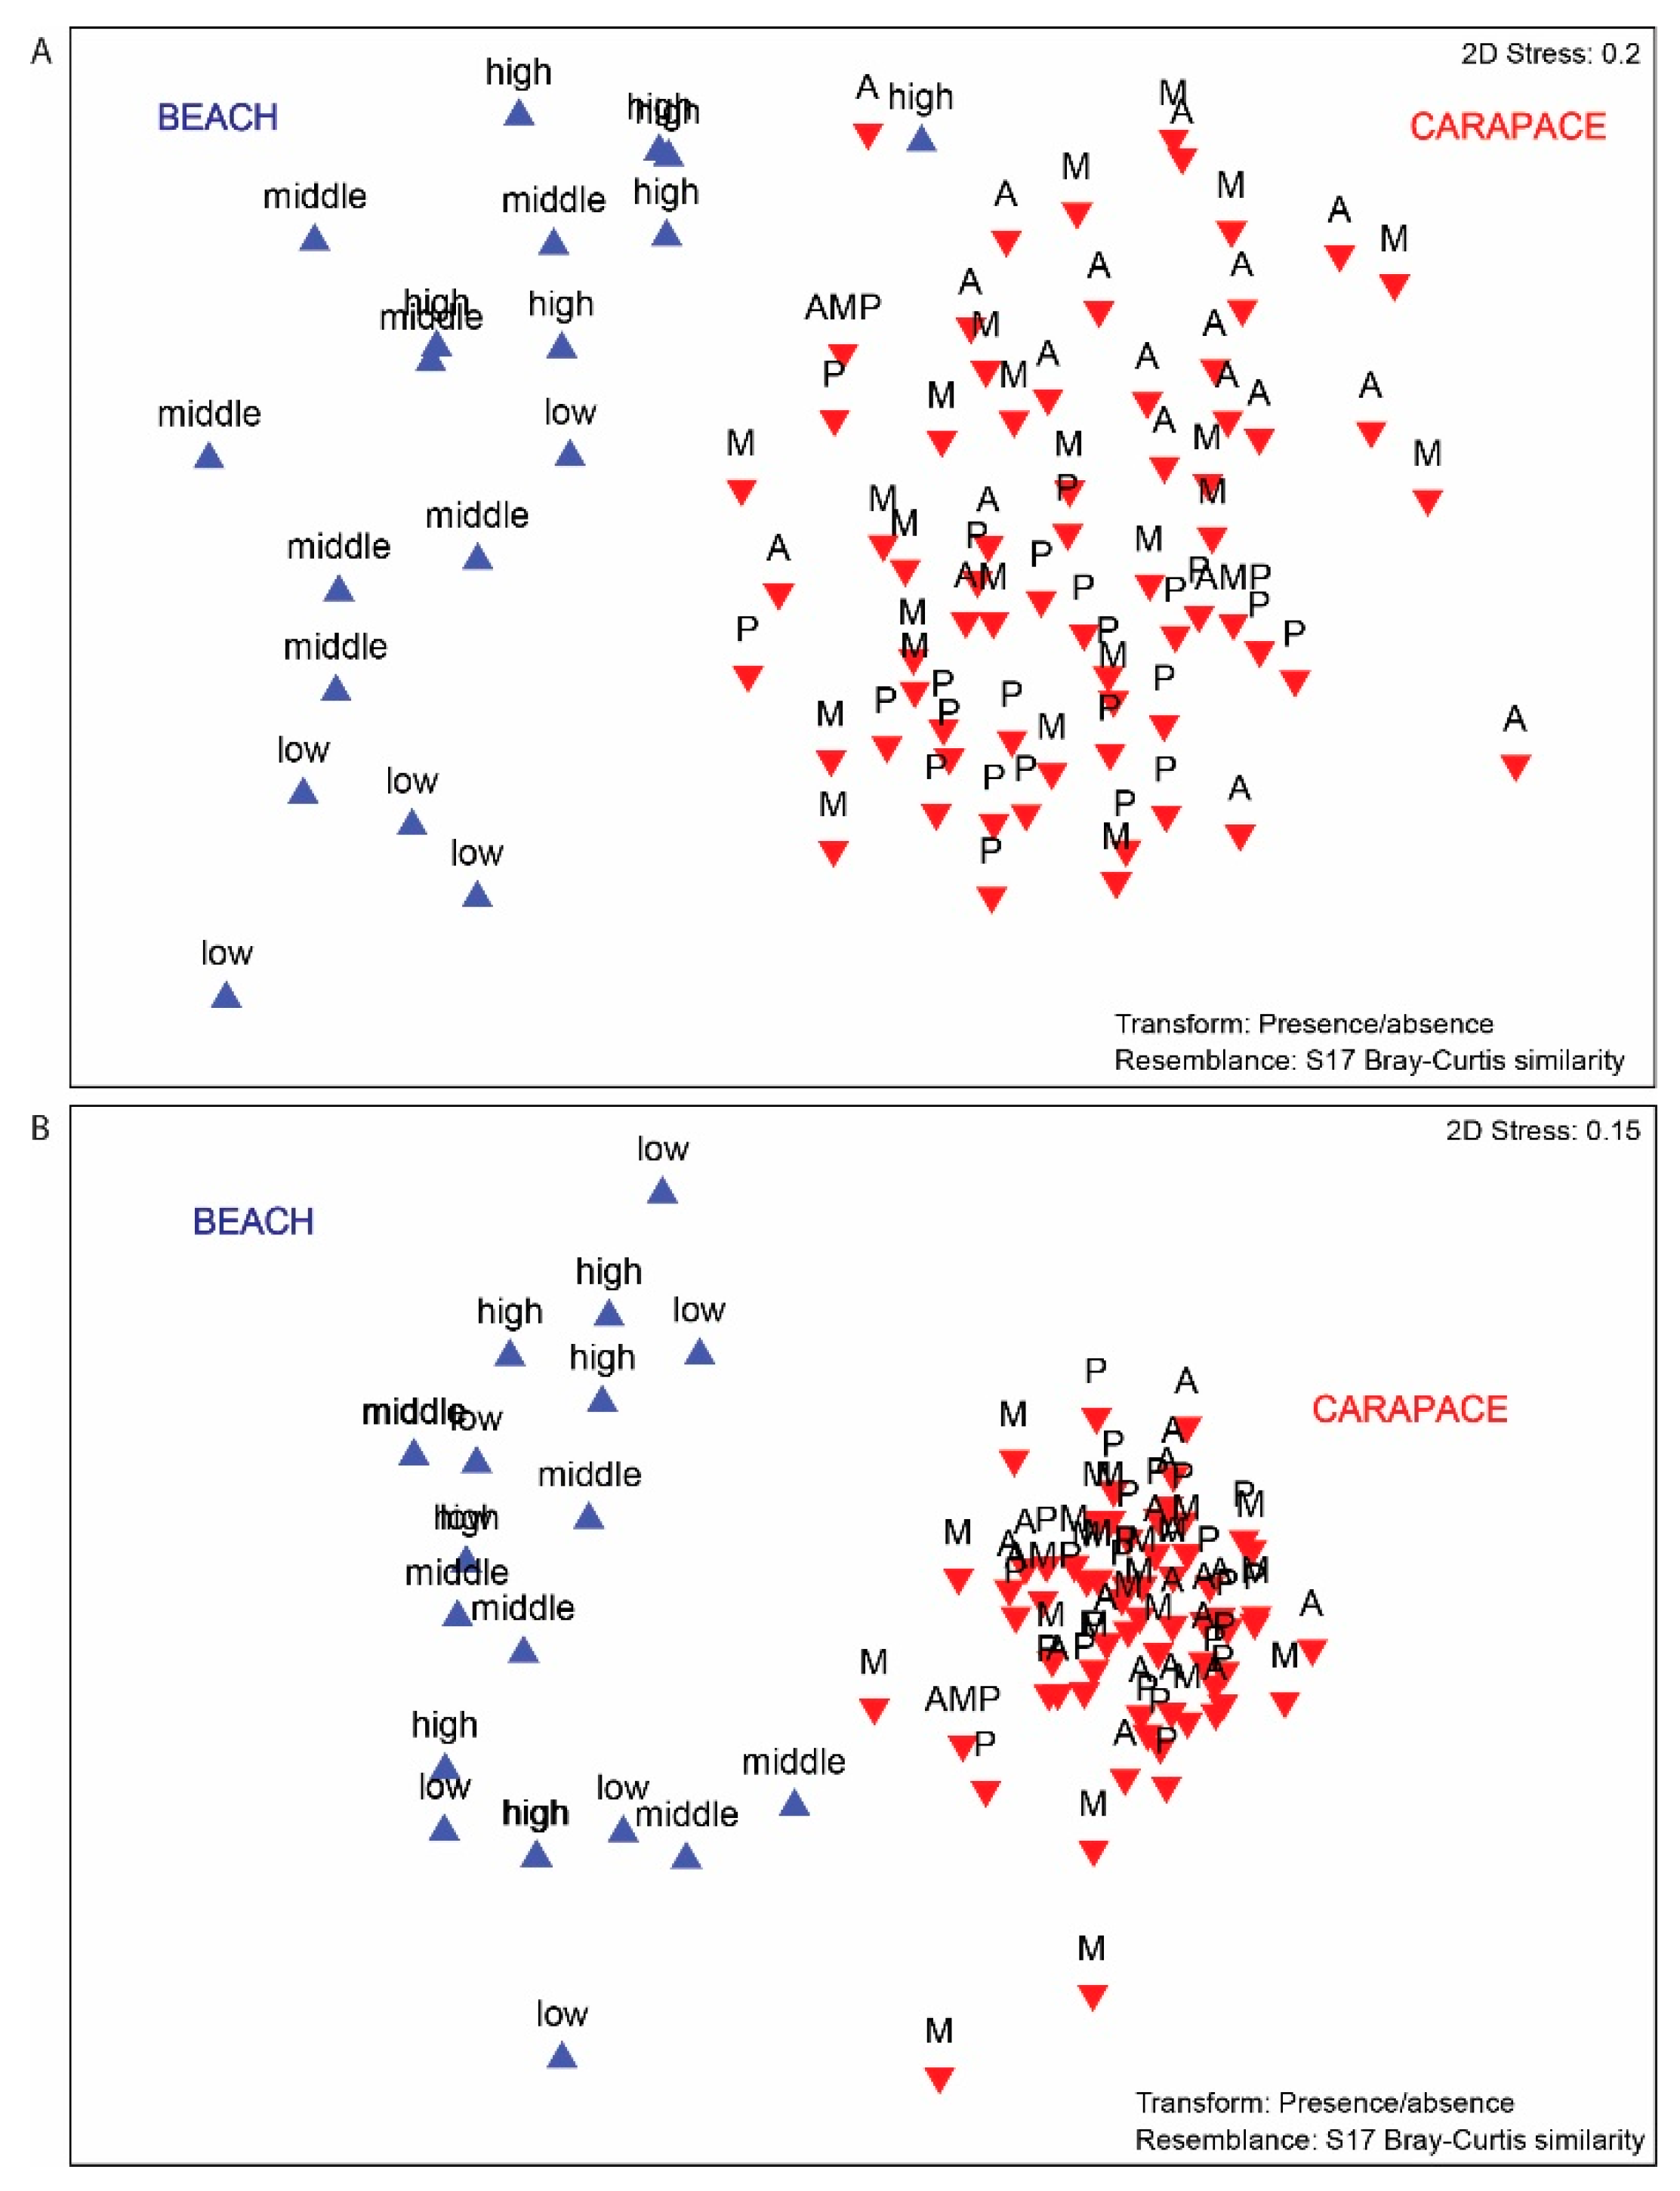
3.3. Beach vs. Carapace Samples

Sand core samples contained minimal meiofauna abundance compared to carapace samples, with 17–889 individuals only, averaging 136.2 individuals per triplicate sample (low beach samples contained more individuals than high beach samples), which is much lower compared to the epibiont meiofauna and nematode abundance values (Table S1). The nMDS results show a clear distinction in meiofauna and nematode community composition between beach and carapace samples (Figure 9), confirmed by PERMANOVA analysis (meiofauna: p = 0.001; nematodes: p = 0.001). Within the beach samples, a clear distinction can be made between low, middle and high beach. It is noticeable that the meiofauna higher taxa communities occupy less Bray-Curtis space in the nMDS for the carapace epibionts, compared to the beach samples (PERMDISP, p = 0.001), suggesting greater similarities between the carapace meiofauna communities than between the beach meiofauna communities. This is not the case for the nematode genera data (PERMDISP, p = 0.64), implying no differences in the nematode community heterogeneity of dispersion between the beach and carapace samples. Carapace samples had a much higher meiofauna diversity and nematode genus richness than the beach samples (20 vs. 11 meiofauna higher taxa, and 111 vs. 25 nematode genera).

4. Discussion

4.1. Diversity and Structure of Meiofauna on Loggerhead Carapaces

From our results, it is clear that loggerhead carapaces are hotspots of meiofauna and nematode diversity; our observations document more than double the species diversity previously observed on loggerhead carapaces [22,36,37]. Two recent epibiont study on meiofauna and nematodes from Brazilian hawksbill turtles (Eretmochelys imbricata) observed 17 meiofauna higher taxa [2] and 80 nematode genera [3], suggesting that loggerheads may harbor between 15% to 30% more diversity than hawksbill turtles. High epibiont diversity for loggerheads has been recorded in other studies (e.g., [22]). For example, dos Santos et al. [3] compared nematode genera richness between hawksbill turtles and non-sedimentary natural and artificial substrates, demonstrating that turtle carapaces are hotspots of meiofauna and nematode biodiversity (Table S3; [45,46,47,48,49,50,51,52,53,54,55,56,57,58,59,60,61,62]). However, it is worth noting the foraging differences between hawksbill and loggerhead sea turtles. Hawksbills are spongivorous [63] and are generally associated with tropical coral reefs, while loggerheads are benthivores, specialized in consuming benthic invertebrates. There are also distinct differences in the way they consume prey, with evidence that hawksbills can exhibit distinct flipper use to leverage, hold or sweep prey, such as sponges, cnidarians, macroalgae and fishes, while loggerheads can use their flippers to dig into the sediment to gain better access to benthic molluscs [64], in a process coined ‘infaunal mining’ [65]. In comparison, loggerheads are able to displace much more sediment and, hence, infaunal invertebrates into the water column during feeding activity [64,65], enabling increased colonization of their carapaces by small invertebrates. The difference in general foraging environments (i.e., coral reefs vs. sedimented habitats) and foraging techniques between these two turtle species certainly suggests that epibiont colonization is influenced differently as well.
A number of factors may affect the distribution of epibionts on loggerhead carapaces (and sea turtle carapaces in general), including different water flow patterns, variable desiccation, food accessibility and abrasion or disturbance [22], but also presence of structure-forming, sessile invertebrate species [2,3]. Pfaller et al. [22] reported highest epibiont densities on the posterior carapace section of loggerheads (and vertebral zones, which we did not distinguish in this study), based on distribution patterns of 18 macro-invertebrate taxa on 18 loggerhead carapaces. We did not find such abundance or density differences for meiofauna and nematodes, but our results reveal increased nematode diversity on the posterior section (Table 1, Figure 1, Figure 2, Figure 3, Figure 4, Figure 5, Figure 6, Figure 7 and Figure 8, Figure S2). Similar to Pfaller et al. [22], our analyses do not allow to discern whether this is consequence of differential colonization or recruitment, or different rates of survival of the epibionts in the different carapace sections. Both are related to complex interactions of processes, including water flow and disturbance or abrasion, turtle behavior and epibiont interactions, as well as the resilience of the epibionts themselves. However, our data suggests that such processes have a limited effect on the abundance and density of meiofauna and nematodes, with no significant difference between the anterior, middle and posterior carapace sections. Dos Santos et al. [3] and Pfaller et al. [22] demonstrated convincingly that the interactions between structure forming macro-invertebrates, such as barnacles, may facilitate an increased abundance/density and diversity of the entire epibiont assemblage, through creating more favorable water flow patterns, increased food settlement and generally providing increased micro-habitat space. Our meiofauna-focused dataset does currently not allow us to answer this question, but we suspect that macrofauna-meiofauna relationships are indeed also facilitative, promoting abundance and diversity as demonstrated for hawksbill epibiont assemblages [3]. Such detailed epibiont ecological interaction studies are few, despite the insights they can provide on colonization processes and dynamics. Future studies should address these ecological relationships between macrofauna and meiofauna epibiont communities on sea turtle carapaces.
With regards to the higher nematode diversity on the posterior loggerhead carapace sections, we follow Pfaller et al.’s [22] reasoning (while necessarily omitting the effect of macrofauna epibiont distributions at this time) that increased flow in the anterior section, and flipper contact with the sides of anterior and middle sections, may affect nematode diversity. In addition, the potential desiccation of the upper middle carapace sections during periods of extended floating at the water surface may have an effect on nematode diversity. Nematode communities respond to many, if not all, types of disturbance, with nematode community shifts likely to occur [8,38], often with reduced diversity and evenness and shifts to more opportunistic species that exhibit greater dominance when conditions deteriorate, or when disturbance precludes the survival or competitiveness of more vulnerable, less resilient species. The much higher abundance of the nematode genus Theristus, known to be an opportunistic colonizer [39], on the anterior carapace section compared to the poster section (Figure 5, Figure S1) would be indicative of a more disturbed environment. This is in line with the increasing diversity and evenness from anterior to posterior, with increased dominance in the anterior section (Figure 8). A more detailed, comprehensive analyses of functional diversity and life histories of meiofauna and nematode taxa may provide better insight into meiofauna distribution patterns and their response to variable disturbance on turtle carapaces. Perhaps more notable is the much higher abundance of nauplii on the posterior section compared to the anterior and middle section (with an inclining gradient from anterior to posterior), supporting the notion of increased flow in the anterior section on meiofauna communities. Nauplii larvae are substantially less equipped than copepodites and adult copepods to deal with increased flow [40]. Nauplii have reduced movement ability compared to copepod adults, which have more developed appendages to attach to substrates. However, we do suspect that macro-epifauna patchiness creates suitable habitats able to protect copepods and other taxa from disturbance to an extent.

4.2. Meiofauna Paradox

The wide distribution of many meiofauna species in combination with the assumption of limited dispersal ability because of a lack of pelagic life stages continues to receive much attention [23,24]. In a recent review, Cerca et al. [24] present a number of reasons to why the meiofauna paradox is likely not paradoxical, mainly because of taxonomic issues, and the incongruence between morphological and molecular information to distinguish between species and populations [20,66,67], and the increasing evidence that dispersal of meiofauna individuals is ubiquitous, instead of rare and intermittent [68]. One process that plays potentially a significant role in explaining meiofauna distribution patterns is rafting or phoresis: the ability of meiofauna to ‘hitch-hike’ with larger organisms, debris or plant material. Other host materials or substrates include macro-algae and microphytobenthos-bacteria mats releasing from the seafloor, or floating ice or sea foam [22,23,24]. Other meiofauna dispersal can be caused by ships (particularly in sands of ballast water, and fouling), and through marine snow, rich biotic aggregates that can carry diverse meiofauna and are known to travel for long distances. Other examples include different types of floating debris, and even large mammals such as whales, or fouling on human structures, mobile or otherwise, but these are rarely quantified or estimated. For a brief review on the topic we refer to [23].
Molecular evidence precludes the notion that widespread meiofauna species distributions are the result of purely geological processes or vicariance. Instead, genetic exchange can occur resulting in genetic similarities across 1000s of kilometers [20,22,69]. In addition, it has been documented that meiofauna can disperse through active emergence and re-entry into the sediments (during which entrainment by currents or flows can occur), and passively, through erosion resuspension, entrainment and subsequent resettlement (the latter can be active or passive, see for example [17,23,70,71]). Disturbance, especially in high-energy coastal environments, is likely one of the main actors in meiofauna dispersal. Based on our results, we support the notion that the widespread distribution of meiofauna species as a result of phoretic dispersal is likely. The potential for rapid colonization is supported by our observations of epibionts on the recaptured loggerhead; one day, after having returned to the ocean, several hundreds of meiofauna individuals were found on the carapace. However, our comparison of meiofauna higher taxa and nematode genera communities (Figure 9) suggest that epibionts on loggerhead carapaces were not contaminated by sand from the nesting beach itself. Instead, we must assume these ‘hitch hikers’ arrive on the carapace during time spent in the water or in close contact with the seafloor, and may have travelled with the turtles over short to long distances, and likely over variable time scales.
Female loggerheads from one nesting assemblage do not migrate to just one foraging area, and individuals may feed at a series of coastal areas en route to resident foraging areas [72]. Distances between loggerhead foraging grounds and their nesting beaches of 100s to 1000s of kilometers have been documented [27,73,74,75,76], and studies from the northeastern Gulf of Mexico have shown that post-nesting loggerheads can remain on the Florida continental shelf, or move to long-distance foraging grounds near Mexico and in the Atlantic [27,28,77]. When long-distance loggerhead migrations are accounted for, the potential for meiofaunal dispersal is vast. Considering that we found, on average, >30,000 meiofauna individuals per carapace, and the current global loggerhead sea turtle population is estimated at 314,000 individuals (midpoint using [78,79], with a range between 91,000 and 536,000), billions of meiofauna organisms are transported by loggerheads on a continuous basis with a high potential for dispersal. All sea turtles carry epibionts to a greater or lesser extent [2,3,4,9,80,81,82], and sea turtle global abundance is estimated at 6,461,000 (total global midpoint abundance estimate), including green turtles, hawksbills, olive ridleys, leatherbacks, Kemp’s ridleys and flatbacks [78,79]. High turtle and meiofauna epibiont numbers, together with the fact that current sea turtle populations, are a fraction of what they were compared to in the 19th century for certain species [83,84,85], and the >100 million years of evolutionary existence of marine turtles [86,87,88], suggest a vast potential for coastal meiofauna species dispersal by means of resuspension and phoresis on an ecological, as well as an evolutionary, time scale.
Without an accurate understanding, however, of the meiofauna colonization processes on carapaces, the genetic structuring of epibiont communities and knowledge of the genetic exchange between meiofauna communities of coastal locations frequented by sea turtles, such numbers remain conjecture. Further insight into the colonization patterns of meiofauna epibionts on sea turtle carapaces may be gained through investigating previously captured, tagged and sampled turtles for epibionts when these return for nesting; for loggerheads, every two to four years [89]. Our sampling effort for two weeks, during the peak of the 2018 nesting season, yielded 23 turtles which returned to the ocean, with carapaces that were entirely cleaned of epibionts. Ideally, we would recapture these (by using their tag numbers) in subsequent seasons, to be able to investigate colonization by epibionts over a fixed period of time. This will help us understand better what type of colonization processes have occurred ab initio at foraging grounds.

4.3. Meiofauna and Nematode Epibiont Community Structure across Turtle Individuals

Our results indicated significant meiofauna and nematode community structure differences between loggerhead individuals. Regarding meiofauna higher taxa, two significantly different groups were recognized (Figure 3 and Figure 4), and with respect to nematode genera, four different groups of epibiont communities could be distinguished (Figure 6 and Figure 7). These communities have distinct features, characterized by different diversities and abundances of particular taxa. Whatever the colonization and environmental or ecological processes are that have shaped these communities, there is a very high likelihood that epibiont members within each of these distinct groups have similar colonization patterns that are related to the origin of these colonizers (e.g., [90]). Colonization is dependent upon a spatial and temporal overlap between turtles and colonizers, which should occur at turtle foraging areas [1]. Epibiont species identification and comparison with global or regional coastal species data sets and distributions, as well as trophic (natural stable isotopes) analyses of the epibionts, may not only give information on the origin of the epibionts, but also on the behavior and movements of the turtle hosts (e.g., [91,92,93]). Few prior studies have attempted to use epibionts to evaluate turtle foraging behaviors, but it proved difficult to distinguish the influence of individual foraging behavior and broad foraging habitat on epibiotic communities [92]. This type of research would be greatly facilitated by molecular analyses on meiofauna epibionts and drawing comparisons between these turtle epibionts and meiofauna from their suspected foraging and breeding areas (as determined via satellite telemetry and stable isotope analysis; see [94]). In the absence of such data, we are reliant on traditional taxonomic identifications, at least for the meiofauna, as we are not aware of molecular meio-epibiont studies for sea turtles. Comprehensive higher-level (e.g., meiofauna higher taxa and nematode genera) taxonomic analyses may reveal clustering patterns and distinguish groups of sea turtles, as is the case in the present study. In a subsequent step, aligning and comparing such epibiont data, as well as their functional diversity and other characteristics with trophic and genetic information from the sea turtles themselves, if available, may reveal corresponding patterns that give insights into the movement of the sea turtles. This would be particularly useful when costly satellite tagging programs are not feasible. Such research could contribute to turtle conservation and management through the identification of the origin of epibiont species or community-types that are likely linked to different sea turtle foraging environments and potentially geographically distinguishable areas.

Supplementary Materials

The following are available online at https://0-www-mdpi-com.brum.beds.ac.uk/1424-2818/12/5/203/s1, Figure S1: Coherence abundance curves for distinct groups of nematodes, Figure S2: Cumulative dominance curves of nematode genera, Table S1: Total abundance of meiofauna higher taxa on loggerhead carapaces, Table S2: Similarity and dissimilarity values for nematode community cluster groups, Table S3: Nematode genus richness on non-sedimentary substrates from previously published studies.

Author Contributions

Conceptualization, J.I., Y.V., M.M.P.B.F., G.A.P.d.S.; Data curation, J.I., I.S.-G., G.A.P.d.S.; Formal analysis, J.I.; Funding acquisition, J.I., I.S.-G., M.M.P.B.F., G.A.P.d.S.; Investigation, J.I., Y.V., L.P.P., A.C.S., P.F.N., G.V.V.C., I.S.-C., A.G., L.H., M.W., C.O., Q.B., J.D., S.S.Z., L.I.A.N., G.A.P.d.S.; Methodology, J.I., Y.V., L.P.P., A.C.S., I.S.-G., M.M.P.B.F., G.A.P.d.S.; Project administration, J.I., I.S.-G., M.M.P.B.F., G.A.P.d.S.; Resources, J.I., Y.V., L.P.P., A.C.S., I.S.-G., M.M.P.B.F., A.G., M.W., Q.B., G.A.P.d.S.; Software, J.I.; Supervision, J.I., Y.V., I.S.-G., M.M.P.B.F., A.G., L.H., M.W., Q.B., J.D., G.A.P.d.S.; Validation, J.I., G.A.P.d.S.; Visualization, J.I.; Writing—original draft, J.I.; Writing—review & editing, J.I., Y.V., I.S.-G., M.M.P.B.F., G.A.P.d.S. All authors have read and agreed to the published version of the manuscript.

Funding

This research was funded by Florida Sea Turtle License Plate Grant Nr. 18-021R and PADI Grant Nr. 33006.

Acknowledgments

We gratefully acknowledge the funding agencies that supported this work (Florida Sea Turtle License Plate Grant Nr. 18-021R; PADI Grant Nr. 33006). We are indebted to a number of people that have helped with the surveys and project logistics, including Matthew Aguiar, Hector Barrios-Garrido, Janice Becker, Emily Drobes, Andres de la Fe, Katherine Glibowski, Andrew Ibarra, Tayla Lovemore, Natalie Montero, Breanna Muszynski, Dylan Nusche, Tara Wah, Barry Walton, Natalie Wildermann.

Conflicts of Interest

The authors declare no conflict of interest. The funders had no role in the design of the study; in the collection, analyses, or interpretation of data; in the writing of the manuscript, or in the decision to publish the results.

References

  1. Frick, M.G.; Pfaller, J.B. Sea Turtle Epibiosis. In The Biology of Sea Turtles, Volume III; CRC Press: Boca Raton, FL, USA, 2013; pp. 399–426. [Google Scholar]
  2. Robinson, N.J.; Figgener, C.; Gatto, C.; Lazo-Wasem, E.A.; Paladino, F.V.; Tomillo, P.S.; Zardus, J.D.; Pinou, T. Assessing potential limitations when characterising the epibiota of marine megafauna: Effect of gender, sampling location, and inter-annual variation on the epibiont communities of olive ridley sea turtles. J. Exp. Mar. Biol. Ecol. 2017, 497, 71–77. [Google Scholar] [CrossRef]
  3. Correa, G.V.V.; Ingels, J.; Valdes, Y.V.; Fonseca-Genevois, V.G.; Farrapeira, C.M.R.; Santos, G.A.P. Diversity and composition of macro- and meiofaunal carapace epibionts of the hawksbill sea turtle (Eretmochelys imbricata Linnaeus, 1822) in Atlantic waters. Mar. Biodivers. 2014, 44, 391–401. [Google Scholar] [CrossRef]
  4. dos Santos, G.A.P.; Corrêa, G.V.V.; Valdes, Y.; Apolônio Silva de Oliveira, D.; Fonsêca-Genevois, V.G.; Silva, A.C.; Pontes, L.P.; Dolan, E.; Ingels, J. Eretmochelys imbricata shells present a dynamic substrate for a facilitative epibiont relationship between macrofauna richness and nematode diversity, structure and function. J. Exp. Mar. Biol. Ecol. 2018, 502, 153–163. [Google Scholar] [CrossRef]
  5. Dodd, C.K., Jr. Synopsis of the Biological Data on the Loggerhead Sea Turtle Caretta caretta (Linnaeus 1758); Florida Cooperative Fish and Wildlife Research Unit: Gainesville, FL, USA, 1988. [Google Scholar]
  6. Dodd, C.K.; Byles, R. Post-nesting movements and behavior of loggerhead sea turtles (Caretta caretta) departing from east-central Florida nesting beaches. Chelonian Conserv. Biol. 2003, 4, 530–536. [Google Scholar]
  7. Frick, M.G.; Williams, K.L.; Bolten, A.B.; Bjorndal, K.A.; Martins, H.R. Foraging ecology of oceanic-stage loggerhead turtles Caretta caretta. Endanger. Species Res. 2009, 9, 91–97. [Google Scholar] [CrossRef] [Green Version]
  8. Carr, A. So Excellent a Fishe: A Natural History of Sea Turtles; University Press of Florida: Ganinesville, FL, USA, 1967. [Google Scholar]
  9. Robinson, N.J.; Majewska, R.; Lazo-Wasem, E.A.; Nel, R.; Paladino, F.V.; Rojas, L.; Zardus, J.D.; Pinou, T. Epibiotic diatoms are universally present on all sea turtle species. PLoS ONE 2016, 11. [Google Scholar] [CrossRef] [Green Version]
  10. Schärer, M.T. A survey of the epibiota of Eretmochelys imbricata (Testudines: Cheloniidae) of Mona Island, Puerto Rico. Rev. Biol. Trop. 2003, 51, 87–90. [Google Scholar]
  11. Schratzberger, M.; Ingels, J. Meiofauna matters: The roles of meiofauna in benthic ecosystems. J. Exp. Mar. Biol. Ecol. 2018, 502, 12–25. [Google Scholar] [CrossRef]
  12. Baguley, J.; Coull, B.; Chandler, G. Meiobenthos. In Encyclopedia of Ocean Sciences; Cochran, J., Bokuniewicz, H., Yager, P., Eds.; Elsevier: Amsterdam, The Netherlands; Academic Press: Cambridge, MA, USA, 2019; Volume 2. [Google Scholar]
  13. Appeltans, W.; Ahyong, S.T.; Anderson, G.; Angel, M.V.; Artois, T.; Bailly, N.; Bamber, R.; Barber, A.; Bartsch, I.; Berta, A.; et al. The Magnitude of Global Marine Species Diversity. Curr. Biol. 2012, 22, 2189–2202. [Google Scholar] [CrossRef]
  14. Lambshead, P.J.D. Recent developments in marine benthic biodiversity research. Oceanis 1993, 19, 5–24. [Google Scholar]
  15. Lambshead, P.J.D. Marine Nematode Biodiversity. In Nematology: Advances and Perspectives Vol. 1: Nematode Morphology, Physiology and Ecology; Chen, Z.X., Chen, S.Y., Dickson, D.W., Eds.; CABI Publishing: London, UK, 2004; Volume 1, pp. 436–467. [Google Scholar]
  16. Lambshead, P.J.D.; Boucher, G. Marine nematode deep-sea biodiversity–hyperdiverse or hype? J. Biogeogr. 2003, 30, 475–485. [Google Scholar] [CrossRef]
  17. Ullberg, J.; Olafsson, E. Free-living marine nematodes actively choose habitat when descending from the water column. Mar. Ecol. Prog. Ser. 2003, 260, 141–149. [Google Scholar] [CrossRef]
  18. Ullberg, J.; Olafsson, E. Effects of biological disturbance by Monoporeia affinis (Amphipoda) on small-scale migration of marine nematodes in low-energy soft sediments. Mar. Biol. 2003, 143, 867–874. [Google Scholar] [CrossRef]
  19. Coomans, A. Nematode systematics: Past, present and future. Nematology 2000, 2, 3–7. [Google Scholar] [CrossRef]
  20. Derycke, S.; Remerie, T.; Backeljau, T.; Vierstraete, A.; Vanfleteren, J.; Vincx, M.; Moens, T. Phylogeography of the Rhabditis (Pellioditis) marina species complex: Evidence for long-distance dispersal, and for range expansions and restricted gene flow in the northeast Atlantic. Mol. Ecol. 2008, 17, 3306–3322. [Google Scholar] [CrossRef] [PubMed]
  21. Bhadury, P.; Austen, M.; Bilton, D.; Lambshead, P.; Rogers, A.; Smerdon, G. Evaluation of combined morphological and molecular techniques for marine nematode (Terschellingia spp.) identification. Mar. Biol. 2008, 154, 509–518. [Google Scholar] [CrossRef]
  22. Worsaae, K.; Kerbl, A.; Vang, Á.; Gonzalez, B.C. Broad North Atlantic distribution of a meiobenthic annelid–against all odds. Sci. Rep. 2019, 9, 1–13. [Google Scholar] [CrossRef] [PubMed] [Green Version]
  23. Giere, O. Meiobenthology: The Microscopic Motile Fauna of Aquatic Sediments, 2nd ed.; Springer: Berlin, Germany, 2009; p. 527. [Google Scholar]
  24. Cerca, J.; Purschke, G.; Struck, T.H. Marine connectivity dynamics: Clarifying cosmopolitan distributions of marine interstitial invertebrates and the meiofauna paradox. Mar. Biol. 2018, 165, 123. [Google Scholar] [CrossRef] [Green Version]
  25. Pfaller, J.B.; Bjorndal, K.A.; Reich, K.J.; Williams, K.L.; Frick, M.G. Distribution patterns of epibionts on the carapace of loggerhead turtles, Caretta caretta. Mar. Biodivers. Rec. 2008, 1. [Google Scholar] [CrossRef] [Green Version]
  26. National Marine Fisheries Service and US Fish and Wildlife Service. Recovery Plan for the Northwest Atlantic Population of the Loggerhead Sea Turtle (Caretta caretta), Second Revision; National Marine Fisheries Service: Silver Spring, MD, USA, 2008. [Google Scholar]
  27. Hart, K.M.; Lamont, M.M.; Fujisaki, I.; Tucker, A.D.; Carthy, R.R. Common coastal foraging areas for loggerheads in the Gulf of Mexico: Opportunities for marine conservation. Biol. Conserv. 2012, 145, 185–194. [Google Scholar] [CrossRef]
  28. Hart, K.M.; Lamont, M.M.; Sartain, A.R.; Fujisaki, I. Migration, Foraging, and Residency Patterns for Northern Gulf Loggerheads: Implications of Local Threats and International Movements. PLoS ONE 2014, 9, e103453. [Google Scholar] [CrossRef] [PubMed]
  29. Shamblin, B.M.; Bolten, A.B.; Abreu-Grobois, F.A.; Bjorndal, K.A.; Cardona, L.; Carreras, C.; Clusa, M.; Monzón-Argüello, C.; Nairn, C.J.; Nielsen, J.T. Geographic patterns of genetic variation in a broadly distributed marine vertebrate: New insights into loggerhead turtle stock structure from expanded mitochondrial DNA sequences. PLoS ONE 2014, 9. [Google Scholar] [CrossRef] [PubMed] [Green Version]
  30. Fuentes, M.M.P.B.; Gredzens, C.; Bateman, B.L.; Boettcher, R.; Ceriani, S.A.; Godfrey, M.H.; Helmers, D.; Ingram, D.K.; Kamrowski, R.L.; Pate, M.; et al. Conservation hotspots for marine turtle nesting in the United States based on coastal development. Ecol. Appl. 2016, 26, 2708–2719. [Google Scholar] [CrossRef] [PubMed]
  31. Bolten, A.B. Techniques for Measuring Sea Turtles. In Research and Management Techniques for the Conservation of Sea Turtles; Eckert, K.L., Bjornal, K.A., Abreu-Grobois, F.A., Donnelly, M., Eds.; IUCN/SSC Marine Turtle Specialist Group Publication No.4: Washington, DC, USA, 1999; pp. 110–114. [Google Scholar]
  32. Yoder, M.; De Ley, I.T.; King, I.W.; Mundo-Ocampo, M.; Mann, J.; Blaxter, M.; Poiras, L.; De Ley, P. DESS: A versatile solution for preserving morphology and extractable DNA of nematodes. Nematology 2006, 8, 367–376. [Google Scholar] [CrossRef]
  33. Somerfield, P.J.; Warwick, R.M. Meiofauna Techniques. In Methods for the Study of Marine Benthos; John Wiley & Sons, Ltd.: Hoboken, NJ, USA, 2013; pp. 253–284. [Google Scholar] [CrossRef]
  34. Higgins, R.P.; Thiel, H. Introduction to the Study of Meiofauna; Smithsonian Institution Press: London, UK, 1988. [Google Scholar]
  35. Somerfield, P.; Warwick, R. Meiofauna in Marine Pollution Monitoring Programmes: A Laboratory Manual; MAFF Directorate of Fisheries Research Technical Series: Lowestoft, UK, 1996; p. 71. [Google Scholar]
  36. Bain, O.; Baldwin, J.G.; Beveridge, I.; Bezerra, T.C.; Braeckman, U.; Coomans, A.; Decraemer, W.; Derycke, S.; Durette-Desset, M.-C.; Fonseca, G. Nematoda; Walter de Gruyter: Berlin, Germany, 2014; Volume 2. [Google Scholar]
  37. Guilini, K.; Bezerra, T.N.; Eisendle-Flöckner, U.; Deprez, T.; Fonseca, G.; Holovachov, O.; Leduc, D.; Miljutin, D.; Moens, T.; Sharma, J.; et al. NeMys: World Database of Free-Living Marine Nematodes. Available online: http://nemys.ugent.be (accessed on 1 May 2018).
  38. Platt, H.M.; Warwick, R.M. Free-Living Marine Nematodes. Part II. British Chromadorids: Pictorial Key to World Genera and Notes for the Identification of British Species. Synop. British Fauna 1988, 38, 502. [Google Scholar]
  39. Hurlbert, S.H. The nonconcept of species diversity: A critique and alternative parameters. Ecology 1971, 52, 577–586. [Google Scholar] [CrossRef]
  40. Hill, M.O. Diversity and evenness: A unifying notation and its consequences. Ecology 1973, 54, 427–432. [Google Scholar] [CrossRef] [Green Version]
  41. Heip, C.; Herman, P.; Soetaert, K. Indices of Diversity and Evenness. Oceanis 1998, 24, 61–87. [Google Scholar]
  42. Clarke, K.R.; Gorley, R.N. PRIMER v7: User Manual/Tutorial; PRIMER-E: Plymouth, UK, 2015; p. 296. [Google Scholar]
  43. Somerfield, P.J.; Clarke, K.R. Inverse analysis in non-parametric multivariate analyses: Distinguishing groups of associated species which covary coherently across samples. J. Exp. Mar. Biol. Ecol. 2013, 449, 261–273. [Google Scholar] [CrossRef] [Green Version]
  44. Anderson, M.J.; Gorley, R.N.; Clarke, K.R. PERMANOVA+ for PRIMER: Guide to Software and Statistical Methods; PRIMER-E Ltd.: Plymouth, UK, 2008; p. 214. [Google Scholar]
  45. De Oliveira, D.A.; Derycke, S.; Da Rocha, C.M.; Barbosa, D.F.; Decraemer, W.; Dos Santos, G.A. Spatiotemporal variation and sediment retention effects on nematode communities associated with Halimeda opuntia (Linnaeus) Lamouroux (1816) and Sargassum polyceratium Montagne (1837) seaweeds in a tropical phytal ecosystem. Mar. Biol. 2016, 163, 102. [Google Scholar] [CrossRef]
  46. Gobin, J.F. Free-living marine nematodes of hard bottom substrates in Trinidad and Tobago, West Indies. Bull. Mar. Sci. 2007, 81, 73–84. [Google Scholar]
  47. Moore, P. The nematode fauna associated with holdfasts of kelp (Laminaria hyperborea) in north-east Britain. J. Mar. Biol. Assoc. U. K. 1971, 51, 589–604. [Google Scholar] [CrossRef]
  48. Kito, K. Phytal marine nematode assemblage on Sargassum muticum Agardh with reference to the structure and seasonal. Mar. Ecol.-Prog. Ser. 1982, 37, 19. [Google Scholar]
  49. Da Rocha, C.M.C.; Venekey, V.; Bezerra, T.N.C.; Souza, J.R.B. Phytal Marine Nematode Assemblages and their Relation with the Macrophytes Structural Complexity in a Brazilian Tropical Rocky Beach. Hydrobiologia 2006, 553, 219–230. [Google Scholar] [CrossRef]
  50. Derycke, S.; Van Vynckt, R.; Vanoverbeke, J.; Vincx, M.; Moens, T. Colonization patterns of Nematoda on decomposing algae in the estuarine environment: Community assembly and genetic structure of the dominant species Pellioditis marina. Limnol. Oceanogr. 2007, 52, 992–1001. [Google Scholar] [CrossRef] [Green Version]
  51. Gwyther, J.; Fairweather, P.G. Colonisation by epibionts and meiofauna of real and mimic pneumatophores in a cool temperate mangrove habitat. Mar. Ecol.-Prog. Ser. 2002, 229, 137–149. [Google Scholar] [CrossRef] [Green Version]
  52. Zhinan, Z. Phytal meiofauna of a rocky shore at the Cape d’Aguilar marine reserve, Hong Kong. Mar. Flora Fauna Hong Kong South. China IV 1997, 4, 205. [Google Scholar]
  53. Atilla, N.; Wetzel, M.A.; Fleeger, J.W. Abundance and colonization potential of artificial hard substrate-associated meiofauna. J. Exp. Mar. Biol. Ecol. 2003, 287, 273–287. [Google Scholar] [CrossRef]
  54. Raes, M.; De Troch, M.; Ndaro, S.G.M.; Muthumbi, A.; Guilini, K.; Vanreusel, A. The structuring role of microhabitat type in coral degradation zones: A case study with marine nematodes from Kenya and Zanzibar. Coral Reefs 2007, 26, 113–126. [Google Scholar] [CrossRef]
  55. Raes, M.; Decraemer, W.; Vanreusel, A. Walking with worms: Coral-associated epifaunal nematodes. J. Biogeogr. 2008, 35, 2207–2222. [Google Scholar] [CrossRef]
  56. Fonsêca-Genevois, V.D.; Somerfield, P.J.; Neves, M.H.B.; Coutinho, R.; Moens, T. Colonization and early succession on artificial hard substrata by meiofauna. Mar. Biol. 2006, 148, 1039–1050. [Google Scholar] [CrossRef] [Green Version]
  57. Copley, J.T.P.; Flint, H.C.; Ferrero, T.J.; Van Dover, C.L. Diversity of meiofauna and free-living nematodes in hydrothermal vent mussel beds on the northern and southern East Pacific Rise. J. Mar. Biol. Assoc. U. K. 2007, 87, 1141–1152. [Google Scholar] [CrossRef] [Green Version]
  58. Jensen, P. Ecology of benthic and epiphytic nematodes in brackish waters. Hydrobiologia 1984, 108, 201–217. [Google Scholar] [CrossRef]
  59. Zekely, J.; Gollner, S.; Van Dover, C.L.; Govenar, B.; Le Bris, N.; Nemeschkal, H.L.; Bright, M. Nematode communities associated with tubeworm and mussel aggregations on the East Pacific Rise. Cah. Biol. Mar. 2006, 47, 477–482. [Google Scholar]
  60. Trotter, D.; Webster, J. Distribution and abundance of marine nematodes on the kelp Macrocystic integrifolia. Mar. Biol. 1983, 78, 39–43. [Google Scholar] [CrossRef]
  61. Coull, B.; Creed, E.; Eskin, R.; Montagna, P.; Palmer, M.; Wells, J. Phytal Meiofauna from the Rocky Intertidal at Murrells Inlet, South Carolina/Colman, J. 1940. On the fauna inhabiting intertidal seaweeds. J. Mar. Biol. Assoc. UK, 24: 129-183. Trans. Am. Microsc. Soc. 1983, 102, 380–389. [Google Scholar] [CrossRef]
  62. Traunspurger, W.; Rothhaupt, K.-O.; Peters, L.; Wetzel, M. Community development of free-living aquatic nematodes in littoral periphyton communities. Nematology 2005, 7, 901–916. [Google Scholar] [CrossRef]
  63. Meylan, A. Spongivory in hawksbill turtles: A diet of glass. Science 1988, 239, 393–395. [Google Scholar] [CrossRef]
  64. Fujii, J.A.; McLeish, D.; Brooks, A.J.; Gaskell, J.; Van Houtan, K.S. Limb-use by foraging marine turtles, an evolutionary perspective. PeerJ 2018, 6, e4565. [Google Scholar] [CrossRef]
  65. Preen, A.R. Infaunal mining: A novel foraging method of loggerhead turtles. J. Herpetol. 1996, 30, 94–96. [Google Scholar] [CrossRef]
  66. Derycke, S.; Backeljau, T.; Moens, T. Dispersal and gene flow in free-living marine nematodes. Front. Zool. 2013, 10, 1. [Google Scholar] [CrossRef] [PubMed] [Green Version]
  67. Derycke, S.; De Ley, P.; Tandingan De Ley, I.; Holovachov, O.; Rigaux, A.; Moens, T. Linking DNA sequences to morphology: Cryptic diversity and population genetic structure in the marine nematode Thoracostoma trachygaster (Nematoda, Leptosomatidae). Zool. Scr. 2010, 39, 276–289. [Google Scholar] [CrossRef]
  68. Boeckner, M.; Sharma, J.; Proctor, H. Revisiting the meiofauna paradox: Dispersal and colonization of nematodes and other meiofaunal organisms in low-and high-energy environments. Hydrobiologia 2009, 624, 91–106. [Google Scholar] [CrossRef]
  69. de Oliveira, D.A.S.; Decraemer, W.; Moens, T.; dos Santos, G.A.P.; Derycke, S. Low genetic but high morphological variation over more than 1000 km coastline refutes omnipresence of cryptic diversity in marine nematodes. BMC Evol. Biol. 2017, 17, 71. [Google Scholar]
  70. Lins, L.; Vanreusel, A.; van Campenhout, J.; Ingels, J. Selective settlement of deep-sea canyon nematodes after resuspension—An experimental approach. J. Exp. Mar. Biol. Ecol. 2013, 441, 110–116. [Google Scholar] [CrossRef] [Green Version]
  71. Ullberg, J.; Zoologiska, I.; Stockholms, U. Dispersal in Free-Living, Marine, Benthic Nematodes: Passive or Active Processes? Zoologiska Institutionen University: Stockholm, Sweden, 2004. [Google Scholar]
  72. Plotkin, P.T.; Spotila, J.R. Post-nesting migrations of loggerhead turtles Caretta caretta from Georgia, USA: Conservation implications for a genetically distinct subpopulation. Oryx 2002, 36, 396–399. [Google Scholar] [CrossRef] [Green Version]
  73. Marcovaldi, M.Â.; Lopez, G.G.; Soares, L.S.; Lima, E.H.; Thomé, J.C.; Almeida, A.P. Satellite-tracking of female loggerhead turtles highlights fidelity behavior in northeastern Brazil. Endanger. Species Res. 2010, 12, 263–272. [Google Scholar] [CrossRef] [Green Version]
  74. Hawkes, L.A.; Witt, M.J.; Broderick, A.C.; Coker, J.W.; Coyne, M.S.; Dodd, M.; Frick, M.G.; Godfrey, M.H.; Griffin, D.B.; Murphy, S.R. Home on the range: Spatial ecology of loggerhead turtles in Atlantic waters of the USA. Divers. Distrib. 2011, 17, 624–640. [Google Scholar] [CrossRef]
  75. Foley, A.M.; Schroeder, B.A.; Hardy, R.; MacPherson, S.L.; Nicholas, M. Long-term behavior at foraging sites of adult female loggerhead sea turtles (Caretta caretta) from three Florida rookeries. Mar. Biol. 2014, 161, 1251–1262. [Google Scholar] [CrossRef] [Green Version]
  76. Griffin, D.B.; Murphy, S.R.; Frick, M.G.; Broderick, A.C.; Coker, J.W.; Coyne, M.S.; Dodd, M.G.; Godfrey, M.H.; Godley, B.J.; Hawkes, L.A. Foraging habitats and migration corridors utilized by a recovering subpopulation of adult female loggerhead sea turtles: Implications for conservation. Mar. Biol. 2013, 160, 3071–3086. [Google Scholar] [CrossRef]
  77. Girard, C.; Tucker, A.D.; Calmettes, B. Post-nesting migrations of loggerhead sea turtles in the Gulf of Mexico: Dispersal in highly dynamic conditions. Mar. Biol. 2009, 156, 1827–1839. [Google Scholar] [CrossRef]
  78. SWOT. The State of the World’s Sea Turtles. 2020, p. 54. Available online: www.seaturtlestatus.org (accessed on 1 April 2020).
  79. Wallace, B.P.; DiMatteo, A.D.; Bolten, A.B.; Chaloupka, M.Y.; Hutchinson, B.J.; Abreu-Grobois, F.A.; Mortimer, J.A.; Seminoff, J.A.; Amorocho, D.; Bjorndal, K.A.; et al. Global Conservation Priorities for Marine Turtles. PLoS ONE 2011, 6, e24510. [Google Scholar] [CrossRef] [PubMed]
  80. Robinson, N.J.; Lazo-Wasem, E.A.; Paladino, F.V.; Zardus, J.D.; Pinou, T. Assortative epibiosis of leatherback, olive ridley and green sea turtles in the Eastern Tropical Pacific. J. Mar. Biol. Assoc. U. K. 2017, 97, 1233–1240. [Google Scholar] [CrossRef] [Green Version]
  81. Pereira, S.; Lima, E.; Ernesto, L.; Mathews, H.; Ventura, A. Epibionts associated with Chelonia mydas from northern Brazil. Mar. Turt. Newsl. 2006, 111, 17–18. [Google Scholar]
  82. Casale, P.; D’Addario, M.; Freggi, D.; Argano, R. Barnacles (Cirripedia, Thoracica) and Associated Epibionts from Sea Turtles in the Central Mediterranean. Crustaceana 2012, 85, 533–549. [Google Scholar] [CrossRef] [Green Version]
  83. Limpus, C. Global overview of the status of marine turtles: A 1995 viewpoint. Biol. Conserv. Sea Turt. 1995, 2, 605–609. [Google Scholar]
  84. Ross, J.P. Historical decline of loggerhead, ridley, and leatherback sea turtles. In Biology and Conservation of Sea Turtles; Smithsonian Institution Press: Washington, DC, USA, 1982; pp. 189–195. [Google Scholar]
  85. Hays, G.C. Good news for sea turtles. Trends Ecol. Evol. 2004, 19, 349–351. [Google Scholar] [CrossRef]
  86. Hirayama, R. Oldest known sea turtle. Nature 1998, 392, 705–708. [Google Scholar] [CrossRef]
  87. Harvey, V.L.; LeFebvre, M.J.; deFrance, S.D.; Toftgaard, C.; Drosou, K.; Kitchener, A.C.; Buckley, M. Preserved collagen reveals species identity in archaeological marine turtle bones from Caribbean and Florida sites. R. Soc. Open Sci. 2019, 6, 191137. [Google Scholar] [CrossRef] [Green Version]
  88. Bowen, B.W.; Nelson, W.S.; Avise, J.C. A molecular phylogeny for marine turtles: Trait mapping, rate assessment, and conservation relevance. Proc. Natl. Acad. Sci. USA 1993, 90, 5574–5577. [Google Scholar] [CrossRef] [Green Version]
  89. Miller, J.D. Reproduction in sea turtles. Biol. Sea Turt. 1997, 1, 51–82. [Google Scholar]
  90. Pfaller, J.B.; Alfaro-Shigueto, J.; Balazs, G.H.; Ishihara, T.; Kopitsky, K.; Mangel, J.C.; Peckham, S.H.; Bolten, A.B.; Bjorndal, K.A. Hitchhikers reveal cryptic host behavior: New insights from the association between Planes major and sea turtles in the Pacific Ocean. Mar. Biol. 2014, 161, 2167–2178. [Google Scholar] [CrossRef]
  91. Hosono, T.; Minami, H. Stable isotope analysis of epibiotic caprellids (Amphipoda) on loggerhead turtles provides evidence of turtle’s feeding history. In New Frontiers in Crustacean Biology; Brill: Leiden, The Netherlands, 2011; pp. 299–309. [Google Scholar]
  92. Reich, K.J.; Bjorndal, K.A.; Frick, M.G.; Witherington, B.E.; Johnson, C.; Bolten, A.B. Polymodal foraging in adult female loggerheads (Caretta caretta). Mar. Biol. 2010, 157, 113–121. [Google Scholar] [CrossRef]
  93. Detjen, M.; Sterling, E.; Gómez, A. Stable isotopes in barnacles as a tool to understand green sea turtle (Chelonia mydas) regional movement patterns. Biogeosci. Discuss. 2015, 12, 4655–4669. [Google Scholar] [CrossRef]
  94. Ceriani, S.A.; Weishampel, J.F.; Ehrhart, L.M.; Mansfield, K.L.; Wunder, M.B. Foraging and recruitment hotspot dynamics for the largest Atlantic loggerhead turtle rookery. Sci. Rep. 2017, 7, 1–13. [Google Scholar] [CrossRef] [Green Version]
Figure 1. Meiofauna and nematode abundance and taxon richness for each carapace section, represented by Box-whisker plots (median, quartiles and ranges) S = taxon richness. (A) Total meiofauna abundance, (B) meiofauna taxa richness, (C) nematode abundance, (D) nematode genera richness.
Diversity 12 00203 g001
Figure 2. Relative abundance of meiofauna higher taxa and larval forms per carapace section. A: anterior section, M: middle section, P: posterior section.
Diversity 12 00203 g002
Figure 3. Non-metric Multi-Dimensional Scaling ordinations (nMDS) based on meiofauna higher taxa on loggerhead carapaces. Each carapace is represented by a bubble pie chart based on the four most indicative taxa (Nauplii, Amphipoda, Caprellidae and Cirripedia) showing their total abundance. Superimposed vectors represent Pearson correlations between these four taxa (correlation coefficient >0.5) and the nMDS axes. Green lines separate two main groups based on significant cluster SIMPROF analysis (p < 0.05).
Diversity 12 00203 g003
Figure 4. Relative abundance of meiofauna higher taxa for each turtle carapace. Red boxes indicate the significant cluster groups (SIMPROF analysis using 5% significance test).
Diversity 12 00203 g004
Figure 5. Relative abundance of nematode genera per carapace section. A: anterior section, M: middle section, P: posterior section. Only the 20 most abundant genera are shown.
Diversity 12 00203 g005
Figure 6. nMDS based on nematode genera on loggerhead carapaces. Each carapace is represented by a bubble representative of total nematode abundance on each carapace. Superimposed vectors represent Pearson correlations between the taxa (correlation coefficient > 0.7) and the nMDS axes, comprising Chromadora, Daptonema and Acanthonchus. Green lines separate four main groups based on significant cluster SIMPROF analysis (p < 0.05).
Diversity 12 00203 g006
Figure 7. Relative abundance of nematode genera for each turtle carapace. Red boxes indicate the significant cluster groups (SIMPROF analysis using 5% significance test). Only the 20 most abundant genera are shown.
Diversity 12 00203 g007
Figure 8. Box and Whisker (median, quartiles and ranges) plots of nematode genera diversity indices for each carapace section. S: nematode genus richness, ES(51): expected number of genera based on 51 individuals, N1: Hill’s index 1, N2: Hill’s index 2, Ninf: Hill’s index inf [40]. A = anterior, M = middle, P = posterior sections.
Diversity 12 00203 g008
Figure 9. nMDS of (A) nematode genera community data and (B) meiofauna higher taxa data. Presence–absence transformation was used to eliminate the large abundance differences between the carapace and beach samples, making the comparison based on community composition only. Carapace samples: A = Anterior, M = Middle, P = Posterior; beach samples: high, middle and low beach.
Diversity 12 00203 g009
Table 1. Summary statistics on the number of nematode genera recovered from samples, sections and entire carapaces collected from loggerhead turtles nesting at St. George Island, Florida during the peak of the 2018 nesting season.
Sample SizeMinimumMaximumAverageSDTotal
Anterior3198.14.551
Middle23414.08.479
Posterior113519.26.592
Entire carapace25026.611.0111
Table 2. Main and pairwise PERMANOVA test results for nematode genera diversity indices. Comparison between carapace sections, cf. Figure 8. Df: degrees of freedom; SS: sums of squares, MS: means of squares, perm(s): permutation(s), A: anterior, M: middle, P: posterior, mc: Monte Carlo values when the number of permutations were low. Significant values are given in bold.
dfSSMSPseudo-FP(Perm)PermsPairwise GroupstP(Perm)Perms
S-sections21285.3642.6613.9330.001883A, M2.73040.009/0.01 (mc)124
Residual622859.746.124 A, P6.30760.001/0.001 (mc)125
M, P2.35290.021/0.027 (mc)73
ES(51)-sections2408.78204.3911.7130.002999A, M2.4410.017998
Residual621081.917.45 A, P5.28550.001995
M, P2.3550.024998
N1-sections2295.65147.837.49290.001999A, M2.2520.017996
Residual621223.219.729 A, P3.77250.001998
M, P1.91650.059996
N2-sections2108.6954.3435.63090.009999A, M1.87120.073998
Residual62598.359.6508 A, P3.09950.001998
M, P1.81110.078997
Ninf-sections215.9597.97944.32420.013999A, M1.51880.153998
Residual62114.411.8453 A, P2.76450.004998
M, P1.6110.109997

