Trait-Based Investigation Reveals Patterns of Community Response to Nutrient Enrichment in Coastal Mesic Grassland


1
Integrative Life Sciences Doctoral Program, Virginia Commonwealth University, 1000 West Cary Street, Richmond, VA 23284, USA
2
Department of Biology, Virginia Commonwealth University, 1000 West Cary Street, Richmond, VA 23284, USA
*
Author to whom correspondence should be addressed.
Diversity 2021, 13(1), 19; https://0-doi-org.brum.beds.ac.uk/10.3390/d13010019
Submission received: 17 November 2020
/
Revised: 16 December 2020
/
Accepted: 30 December 2020
/
Published: 6 January 2021
(This article belongs to the Special Issue Biodiversity in Coastal Ecosystems)
Abstract
:Despite recent advances, we still do not understand how chronic nutrient enrichment impacts coastal plant community structure and function. We aimed to clarify such impacts by testing for differences in ecosystem productivity and multiple community metrics in response to fertilization. We established plots in 2015 consisting of control (C), nitrogen (N), phosphorus (P), and nitrogen + phosphorus (NP) treatments in a mid-Atlantic coastal grassland. In 2017 we collected aboveground biomass, functional traits, and species abundance for each plot. Our findings indicate a synergistic co-limitation, such that NP plots were more productive than all other treatments. A combination of traits responsible for competition and nutrient uptake (i.e., height and δ15N) caused trait-based divergence of N and NP plots from C and P plots. Functional trait-based composition patterns differed from species composition and lifeform abundance patterns, highlighting complexities of community response to nutrient enrichment. While trait-based functional alpha-diversity did not differ among nutrient treatments, it was positively correlated with biomass production, suggesting nutrients may impact functional alpha-diversity indirectly through increased productivity. Increased functional alpha-diversity could be a mechanism of co-existence emerging as productivity increases. These results have important implications for understanding how plant communities in low-productivity coastal systems are altered by fertilization.
1. Introduction
Global scale research has revealed effects of nutrient additions on productivity, species diversity/composition, and functional trait expressions of plant communities [1,2,3,4]. It is recognized that anthropogenic activity alters global nutrient availability and deposition, most notably nitrogen (N) and phosphorus (P) [5,6]. Anthropogenic sources now surpass any natural process contributing to nutrient deposition [1,7,8]. Rapidly increasing rates of N and P addition through anthropogenic sources result in the emergence of questions regarding the effects nutrients, both individually and synergistically, have on the plant community and ecosystem dynamics.
Elser et al. [9] and Fay et al. [1] detail synergistic effects of N and P, demonstrating that in terrestrial ecosystems, simultaneous addition of N and P (NP) causes a larger response than either nutrient does individually. Studies have shown increased deposition affects more than just productivity. For example, increases in vegetative biomass after three years of nutrient addition cause subsequent decreases in sub-canopy light availability [4,10], often resulting in plant species loss [11,12,13,14]. Studies investigating plant community response to nutrient additions indicate that nutrient enrichment can change community spatial and temporal variability, as well as alter succession patterns and community structure [15,16,17]. La Pierre and Smith [3] found that species experiencing chronic fertilization express differences in functional traits compared to species in ambient conditions. These previous works highlight the importance of investigating plant traits to understand mechanisms altering community structure in response to chronic nutrient enrichment [18,19,20]. Although the aforementioned research has laid the foundation regarding potential effects of nutrient enrichment on global change, gaps remain. For example, a number of studies have investigated trait-based community patterns in response to nutrient enrichment [21,22], but uncertainties still remain regarding effects of nutrient enrichment on functional trait-based diversity (i.e., diversity of traits).
Limitations using species diversity to express plant diversity have increased interest in quantifying functional trait-based diversity (functional diversity) to answer questions regarding plant community organization, species interactions, and response to disturbances [23,24]. Functional diversity has become an important metric for understanding how species, as dynamic parts of a community, change organismal traits through interactions with the environment, which can impact ecosystem functioning [25,26]. Functional diversity metrics are indicators of community structural response to environmental perturbations [27] and can be measured across multiple scales [28]. Both functional alpha- and beta-diversity are computed using quantitative functional trait data collected on members of the plant community. Here we define functional beta-diversity as the site-to-site variation among functional trait defined communities, while functional alpha-diversity is defined as functional trait diversity at the local-scale (i.e., within a plot). These diversity metrics, along with analysis of specific differences in functional trait expression, can help decipher mechanisms of altered trait-based community structure in response to nutrient enrichment and increased productivity. Current research focusing on functional diversity does not identify unified patterns of plant communities in response to nutrient enrichment, suggesting that responses may be dependent on combinations of nutrient treatments and regional or local pressures [29,30,31].
Most prominent nutrient enrichment studies have been conducted in agroecosystems or prairie grasslands with different soil profiles than coastal grasslands. Coastal grassland soils are characterized by their highly leached sandy composition resulting in low nutrient content and low water holding capacity [32]. Increased N deposition is expected to occur in coastal ecosystems [33,34], and previous work has highlighted the need to understand how nutrients influence coastal plant communities [35,36]. Focusing on the coastal system response to nutrient accumulation will identify mechanisms altering coastal plant community function, leading to improved predictions of community trajectory and future functional change [34,35]. This is especially true for barrier island systems, where plant communities are tied closely to disturbance response [37].
Barrier islands are coastal systems occurring along 15% of coastlines globally with most occurring in the northern hemisphere [38]. Geographic areas where barrier islands are common coincide with areas expected to experience increased synthetic fertilizer use [33,39]. By 2100, N enrichment in the continental U.S. is expected to increase by 19%, with the Atlantic coast experiencing the largest regional increase [39]. High nutrient enrichment from run-off and atmospheric deposition is a major influence on barrier island plant communities given the prominence of sandy-soil compositions and high N limitation [32,36]. Nutrient enrichment studies on coastal dune systems show that N addition causes long-term plant community change [36], yet P has not been identified as a limiting nutrient in terrestrial coastal systems [40,41]. Patterns revealing NP synergistic co-limitation at global scales necessitates investigation of both nutrients in coastal systems [1,9]. We build upon previous research by investigating effects of nutrient enrichment on trait-based communities of a mid-Atlantic coastal mesic grassland.
Our goal was twofold. First, we tested how chronic (3 year) nutrient addition affects trait-based community structure and function. Specifically, we tested whether N, P, and NP enrichment increases community-level biomass and/or modifies specific functional trait expressions. We hypothesize that, due to N limitation in coastal systems, biomass will show notable increase under N and NP treatments, with NP prompting a co-limitation effect such that biomass produced after NP fertilization will be significantly higher than biomass produced by N or P alone. Furthermore, we predict that functional traits promoting resource acquisition (e.g., height, specific leaf area, and leaf N traits) will be expressed in N and NP treatments, due to increased competition for light in nutrient-rich environments. Second, we investigated community-level functional trait change using trait-based community composition and trait diversity (functional alpha- and beta-diversity). We hypothesize that N and NP treatments will alter trait-based community composition and that such changes will be accompanied by increased functional alpha- and beta-diversity. Furthermore, we expect that functional alpha- and beta-diversity will have a significant relationship with biomass productivity. Identifying how nutrients impact productivity, specific functional trait expressions, and trait-based community composition and diversity may improve predictions of trait-based vegetation change in sand-based coastal grasslands as global change drivers like nutrient enrichment persist.
2. Materials and Methods
2.1. Study Site
Hog Island (37.417 N, 75.686 W) is one of 13 barrier islands in the Virginia Coast Reserve (VCR) Long-Term Ecological Research site along the US Atlantic coast. The VCR is experiencing shrub encroachment by Morella cerifera on a landscape scale [42]. M. cerifera is a N-fixing shrub that dominates later successional swales and may be facilitated by the presence of a grass canopy [43,44]. Due to extensive shrub cover on the northern end of Hog Island, plots were established on the southern end in a recently developed swale (i.e., dune slack) composed of perennial grass and annual/biennial forb species. Dominant graminoids at our grassland site included Spartina patens, Setaria parvifolia, Andropogon virginicus, and Ammophila breviligulata, which is a common dune grass in this region but also occurs frequently in swales [43]. Other graminoid species like Fimbrystylis castanea and Cyperus esculentes were less abundant but were also found at the site. Forb species were generally less dominant but included Solidago sempervirens and Conyza canadensis. Soils at our nutrient enrichment plots are sandy and well-drained, and relatively young due to high overwash occurrence in the early 2000s. Untreated areas indicate that %N in the soils ranged from 0.02–0.03%, while P ranged from 6–10 ppm.
2.2. Plot Establishment and Nutrient Application
Nutrient enrichment plots were installed on Hog Island in 2015 [45]. Plots followed a randomized design modified from the Nutrient Network (https://nutnet.org/) to include three treatments (N = nitrogen, P = phosphorus, NP = nitrogen + phosphorus, and C = Control), replicated five times per treatment (N = 20 total experimental units, n = 5 per treatment). Each unit was 3 m2 with 1 m walkways, which were not recognized as usable plot space. Units were subdivided into four 1 m2 subplots. Nutrient applications were completed twice per growing season (May and June) from 2015-2017. Annual N and P application totaled 10 g m−2 yr−1, while NP plots totaled 20 g m−2 yr−1 (10 g m−2 of N and 10 g m−2 of P). Phosphorus was applied as triple super phosphate, while N was applied as ammonium nitrate in particulate solid form.
2.3. Biomass and Species Composition Sampling
Biomass was defined as all aboveground vegetation at the end of the 2017 growing season (September 2017) and was collected to assess ecosystem productivity. Aboveground vegetation was harvested from one subplot to ground level within a haphazardly placed 0.1 × 1 m frame and extrapolated to represent plot level productivity (g m−2). Samples were oven-dried for 72 h at 60 °C and weighed (g). Species composition was sampled using areal cover estimation (%) of each species, bare ground, and dead plant material, such that total cover of each plot summed to 100%. In July of 2017, species cover was assessed in a subplot that had not previously been used for destructive sampling. For logistical purposes, the five most abundant species in each plot were used for trait sampling. The top five species accounted for ~75% of the relative vegetation cover in all plots. Spartina patens and A. breviligulata were consistently the most dominant species in each plot. The annual forb C. canadensis had top five abundance in C and N plots but not in P or NP plots. This was the only difference in lifeform of the top five species as all other species were graminoids.
2.4. Functional Trait Selection and Sampling
Functional traits were selected to best understand the mechanisms of plant response to ecological dynamics including environmental and biotic interactions. Aboveground traits we selected highlight some trade-offs between rapid growth and resource conservatism. Investigating plant traits that exist on a resource use spectrum aids in understanding mechanisms of survival for plants in areas of different limiting factors [46]. Maximum height was selected as a competitive trait, as it likely indicates plant response to low light from shading during increased biomass productivity [47]. Height covaries with other plant growth traits including photosynthetic rate, relative growth rate, and leaf lifespan [48]. Leaf traits including specific leaf area (SLA) leaf nitrogen content (%N), and leaf carbon content (%C) indicate trade-offs between rapid growth and resource conservation in highly productive and resource-limited communities [49,50]. Last, 15N:14N (δ15N) was selected to investigate mechanisms of nutrient uptake or fixation through symbiotic relationships [51,52,53].
Maximum height was measured in cm before harvesting by extending the longest leaf of the three tallest individuals for each species. Aboveground samples were harvested for one randomly selected individual for each of the top five species in each plot. Samples were immediately wrapped in the moist paper towel, stored in a plastic bag, and were stored in a dark refrigerator while processing took place. One leaf from each plant was re-hydrated and used to measure SLA using a computer scanning method to digitize leaf samples and capture projected leaf area (cm2). Leaf samples were then oven-dried at 60 °C for 72 h and weighed (g). Dried leaf samples were ground into powder with a Wiley Mini-Mill and shipped to the Cornell Isotope Laboratory (COIL, Ithaca, New York, USA) for carbon and nitrogen elemental analysis (%C and %N) and isotope analysis (δ15N). All samples for aforementioned foliar traits were collected in the summer of 2017. Species abundance was used to calculate community-weighted means (CWMs) for each functional trait:
where R is the number of samples, pi is the relative abundance of species i, and ti is the mean trait value of species i [54].
2.5. Statistical Analysis
All analyses conducted as part of this study were performed using R (R Core Team, v. 3.5.0, 2018). To determine the effect of nutrient enrichment on plot scale productivity, we performed a one-way ANOVA on mean biomass production in 2017 (α = 0.05). Tukey HSD was performed to test for pairwise differences among treatments. Similarly, after confirming assumptions of normality and equal variance, we used ANOVAs to determine whether any CWM functional traits differed among treatment groups (α = 0.05). When significant differences existed between groups, Tukey HSD was used as a post-hoc test to determine which treatments differed significantly.
Principal components analysis (PCA) ordination was used to visualize how nutrient enrichment affected community-level variation in CWM functional trait profiles (solution checked using scree plot). CWM traits were standardized to a mean of zero and unit variance to ensure no single trait would over-influence plot relationships in the trait space. We used the envfit function in vegan to create a vector overlay of CWM trait values indicating how specific traits are influencing plot position in trait space [55]. Centroids were calculated for each of the convex hulled treatment groups.
Species community composition was visualized using non-metric multidimensional scaling (NMDS) ordination. We utilized Bray–Curtis distance measure to calculate a distance matrix of relative species abundance for each treatment replicate. The NMDS was run to a minimized stress value (stress < 0.2) using 3 dimensions (maximum iteration = 999). We performed the ordination in the vegan R package [55]. For purposes of interpretation, a PCA rotation was applied to the finalized NMDS, such that NMDS axis 1 and 2 represent maximum variation of the data.
For both trait and species composition analysis, treatment groups were tested using a permutational MANOVA (PERMANOVA) to determine if nutrient enrichment significantly changed CWM trait and/or species composition [56] (max iteration = 999; α = 0.05). PERMANOVA makes no assumptions about the distribution of response variables or dissimilarities and is robust to assess heterogeneity of variances when used on balanced designs [56]. Post-hoc pairwise testing was conducted to determine which treatments significantly differed in CWM trait composition (α = 0.05, FDR adjustment).
To satisfy assumptions of normality and variance we log transformed our cover data prior to performing a two-way ANOVA on % cover of graminoid and forb lifeforms among nutrient treatments (α = 0.05) to determine whether lifeform abundance differed among communities receiving different nutrient treatments. We found no significant lifeform x treatment interaction, and thus proceeded to testing for significant differences of main effects. Tukey HSD was used as a post-hoc test when appropriate (α = 0.05).
Functional alpha-diversity was calculated as Rao’s quadratic entropy (FDQ). We selected FDQ because it handles multiple trait variables and aims to estimate species dispersion in multidimensional trait space at the plot level, weighting solutions by relative abundance [57,58]. Functional alpha-diversity indices were calculated using the FD package [59]. Functional beta-diversity was calculated using betadisper in the R vegan package which calculates beta dispersion, or the distance of each plot to the mean center of each treatment group [55]. Beta dispersion tests for homogeneity of group dispersion and is a common quantitative metric of beta-diversity [60,61]. We used ANOVA (with Tukey HSD post-hoc) and simple linear regression analysis (α = 0.05) to determine the impact of nutrients on functional diversity and the relationship between functional diversity and biomass, respectively.
3. Results
3.1. Biomass Response to Nutrients
Biomass production significantly differed among nutrient treatments (Figure 1; F3, 16 = 18.5, p < 0.0001). Of all the nutrient treatment groups, NP had the highest biomass production with the lowest biomass production occurring in C and P plots (Figure 1). NP plots were significantly more productive than both P and N plots (Figure 1), suggesting a nutrient synergistic co-limitation. Although N plots produced lower biomass than NP plots, we found that mean biomass was still significantly higher than P and C plots, with mean productivity approximately three to four times higher (Figure 1).
3.2. Community-Level Trait Response
3.2.1. Individual Trait Differences Among Treatments
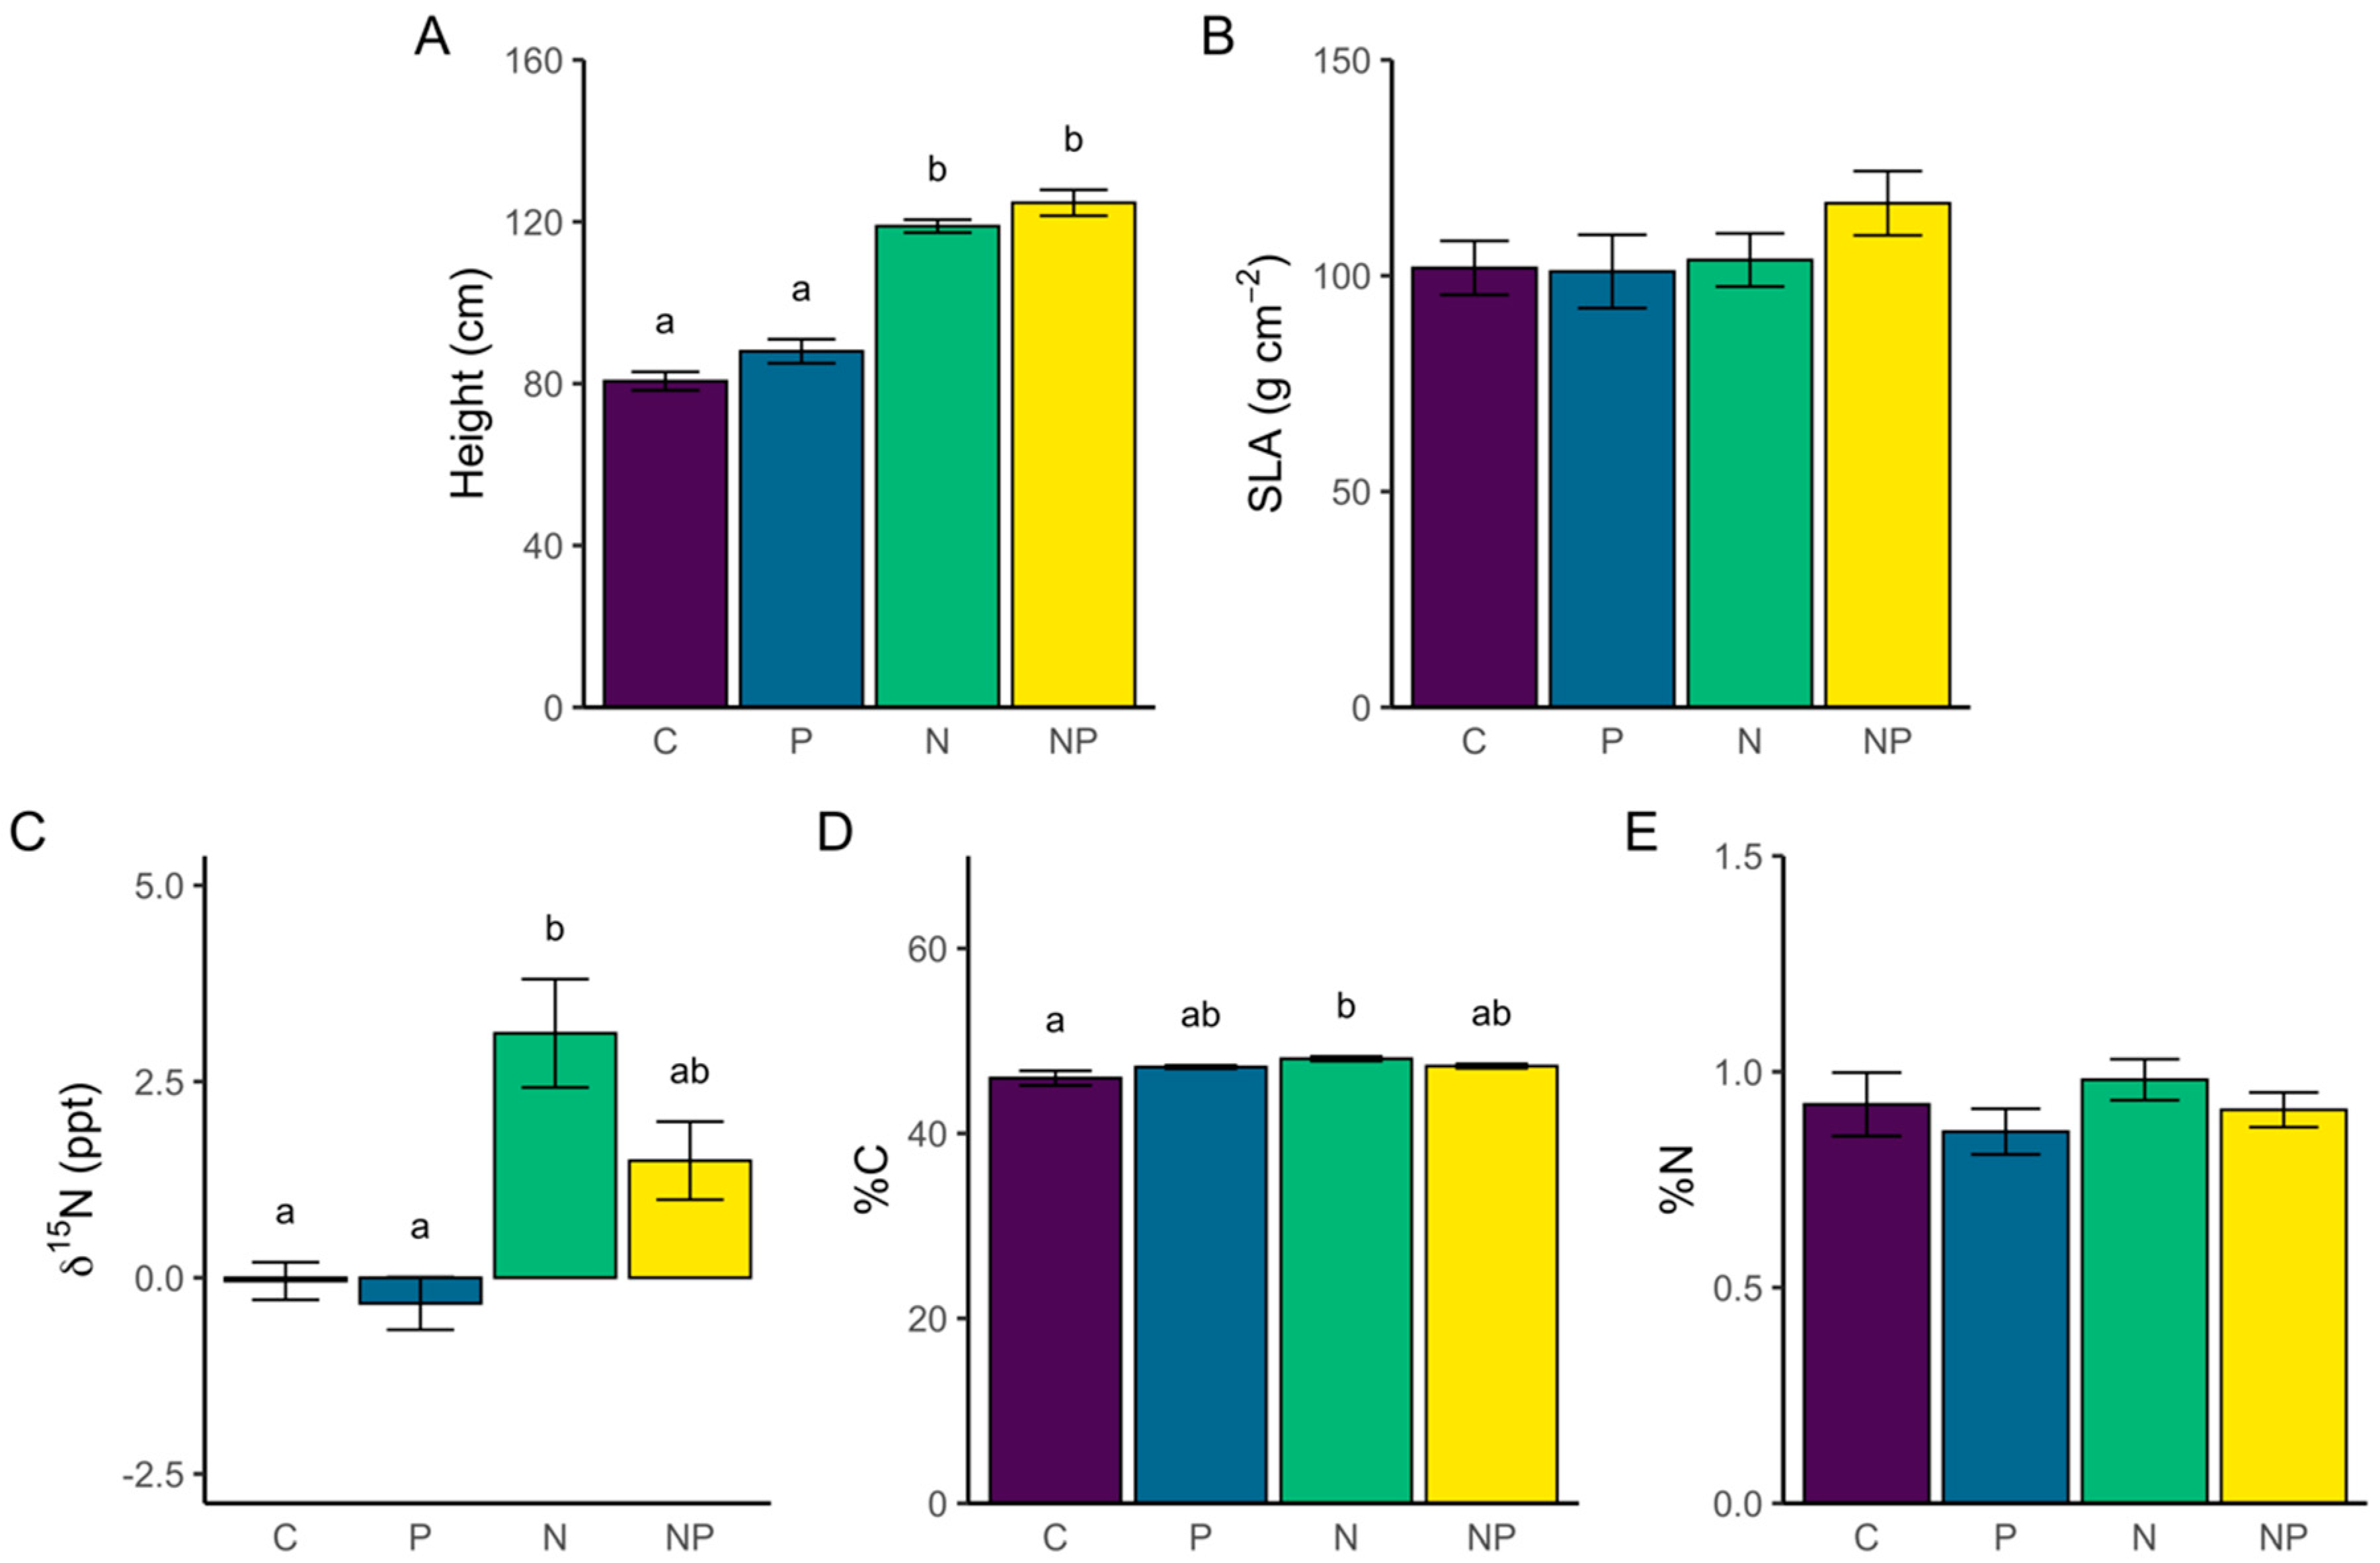
Community-weighted functional traits varied across nutrient treatments. Community-weighted height was significantly different among nutrient treatments (F3, 16 = 72.2, p < 0.0001), with N and NP plots having the tallest communities on average (Figure 2A). We found that N and NP fertilization increased community-weighted plant height between 34–55% compared to P and C plots. There was no significant treatment effect on SLA (Figure 2B). Although aboveground tissue in NP plots was enriched in 15N isotope, the difference was not significant compared to C and P plots (Figure 2C). Aboveground tissues in N plots had enriched 15N isotope levels compared to C and P plots, shifting δ15N from below 0 to above 3 ppt (Figure 2C). Values of foliar %C showed a small but significant increase in N plots compared to C plots (+4.6%, Figure 2D). Leaf %N did not differ among treatments (Figure 2E).
3.2.2. Trait, Species, and Lifeform Composition
A total of 68.9% of the variation in our data was explained by the functional trait metrics used in the PCA (PC1 = 40.9%, PC2 = 28.0%). We found that nutrient treatments resulted in significantly different trait-based community composition (Figure 3, PERMANOVA: F3, 16 = 4.65, p < 0.001). Trait-based communities of N and NP plots occupied significantly different functional trait space compared to C and P plots, primarily diverging along PC1 (Figure 3, Table 1). All traits were significantly correlated with PC1 and/or PC2 and can be used to indicate how nutrients drive trait-based community position in trait space (Table S1). For example, height, δ15N, and %C, were strongly correlated with PC1, indicating plots treated with N/NP are separate from C/P-treated plots because N- and NP-treated communities are taller and have higher levels of foliar δ15N and %C (Table S1, Figure 3). Our multivariate analysis shows more clearly how traits like foliar δ15N and %C impact the dissimilarity of N/NP communities and C/P communities compared to investigations of these traits using univariate analysis alone. Likewise, SLA had a strong positive correlation with PC2, while %N and %C had negative correlations with PC2, influencing separation of N and NP plots in trait space (Table S1, Figure 3), a pattern that is not as clear after investigating univariate trait response of SLA, %N, and %C.
Differences in species composition were also found among treatments (Figure S1, PERMANOVA: F3, 16 = 4.52, p < 0.001). Species composition was significantly different among all treatments, despite the similarities we find in functional composition of N/NP and C/P communities (Table S2). We also found that, across all treatments, mean graminoid cover was significantly higher than mean forb cover (Figure S2, ANOVA: F3, 16 = 77.65, p < 0.0001). However, abundance of lifeforms did not differ among communities experiencing different nutrient enrichment treatments (Figure S2; ANOVA: F1, 16 = 0.53, p > 0.05). For example, graminoid abundance did not differ among treatment groups. These results indicate that trait, species, and lifeform composition provide different perspectives regarding community-level response to nutrient addition in a coastal mesic grassland.
3.2.3. Trait-Based Alpha and Beta Diversity
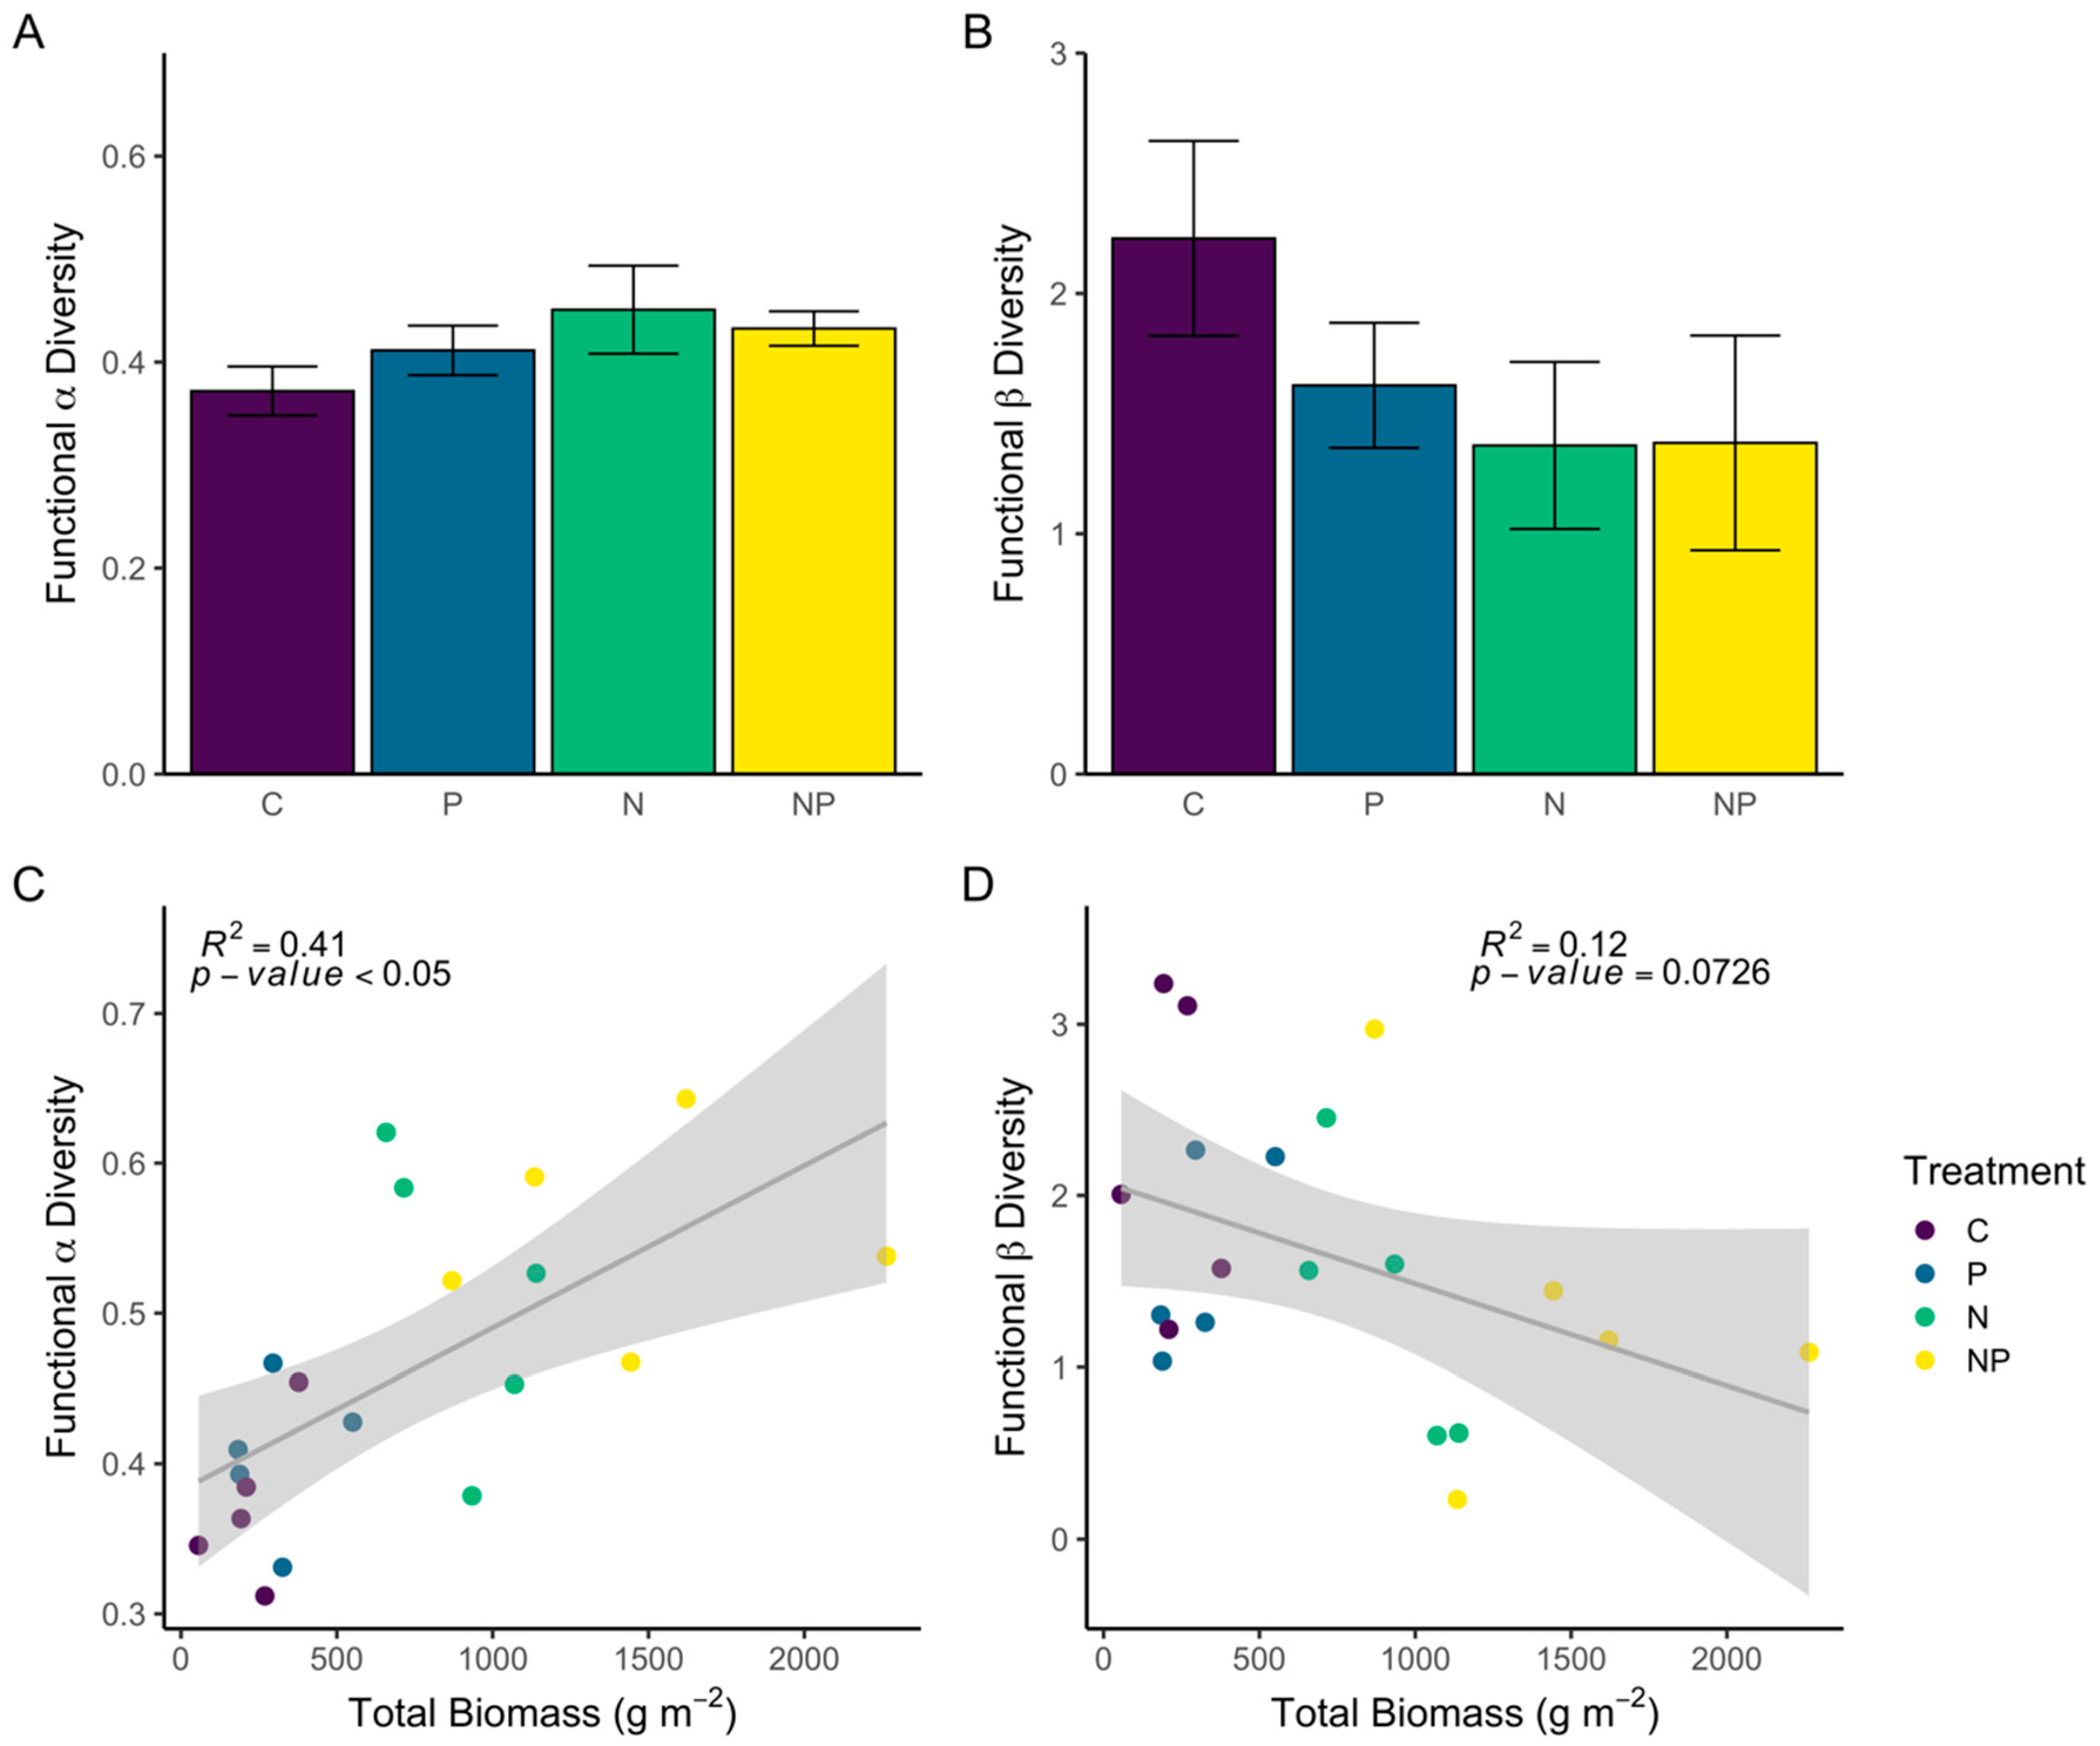
Neither functional alpha- nor beta-diversity of trait-based communities were significantly different based on nutrient treatment (Figure 4A,B, ANOVA: F3, 16 = 1.42, p = 0.2746 and F3, 16 = 1.91, p = 0.1693, respectively). However, there was a significant positive correlation between aboveground biomass and functional alpha-diversity (Figure 4C), while the relationship between functional beta-diversity and biomass was weak and non-significant (Figure 4D). This pattern indicates that functional alpha-diversity is not so much influenced by nutrient treatment as it is linked to biomass production in each plot, which is significantly higher in N and NP plots (Figure 4C).
4. Discussion
We show the influence of chronic (3 year) nutrient enrichment on community-level biomass, specific functional trait expressions, and trait-based community composition and diversity in a coastal grassland. It is clear that N enrichment had significant impacts on community biomass production. NP exhibited a synergistic co-limitation effect on biomass production such that NP treatments produced higher biomass than either N or P treatments individually. These findings are consistent with previous studies showing synergistic nutrient effects in other terrestrial systems [1,9]. However, it is interesting that P alone had no effect on productivity because it has been shown to increase productivity in other grassland systems [1]. This is particularly surprising at our grassland site because, according to our NMDS results, P alters community species composition, even without evidence of causing differences in productivity or functional trait-based composition. We found that biomass production in N and NP plots are on average four and seven times higher than C plots, respectively. This follows global scale trends which indicate that N and NP deposition increases biomass production by, on average, 18% and 40% compared to C plots, respectively [1]. Considering the extent of coastal grassland distribution worldwide, our findings emphasize the importance of including more coastal grasslands when investigating response to nutrient enrichment at the global scale.
Our investigation of specific functional traits shows that some functional trait expressions associated with competition and altered nutrient acquisition (i.e., height and δ15N) were significantly higher in N and NP plots, similar to other nutrient enrichment studies [20,62]. Differences in plant height are likely driven by increased competition for light, as N and NP increase aboveground biomass production [20,62]. It is important to note that increased height can also be a result of higher N acquisition, allowing for species to grow more prolifically than if they were in an N-limited environment. We found that other traits remained unchanged among nutrient enrichment treatments (i.e., %N and SLA), indicating that certain traits are conserved in coastal systems regardless of nutrient additions. These trait responses stray from what global patterns have shown, such as those found by Firn et al. [19], which identify leaf N content as an important indicator of nutrient inputs. As leaf N was not affected by fertilization, investigating root traits in future studies may inform aboveground responses. Previous research highlights that increased N acquisition by roots may affect other functional traits, like δ15N, which correlates with leaf N content [63].
Foliar δ15N is traditionally used as the primary metric for whole plant δ15N and varies as a result of multiple environmental changes including N deposition [64]. Increased availability and uptake of N can result in δ15N enrichment in plant tissues [63,65,66], most typically through mechanisms of decreasing plant dependence on fungal and microbial associates to capture and fix N [52,67]. In our study, we found that CWM δ15N values in C plots was ~0 ppt, which could suggest plants in untreated communities rely on N2 fixation through symbiotic rhizosphere relationships, a mechanism found in the dominant coastal shrub M. cerifera [68,69]. Symbiotic relationships are an important N acquisition strategy in N-limited coastal systems [70] and may be disrupted by N additions. While we did not specifically test for changes in microbial communities associated with plant root systems, increased δ15N enrichment has been linked to plant dissociation from N-fixing bacteria, mycorrhizal fungi, or both when N becomes more readily available during fertilization [71,72,73]. Previous research has also shown that soil microbial communities can be directly affected by nutrient inputs [74,75]. If microbial community changes occur in a way that effectively decreases microbial support to plants, functional trait differences could emerge as plants compensate for the loss of microbial relationships. Further studies are necessary to understand how nutrient enrichment impacts microbial communities and their plant associations in coastal soils.
Surprisingly, we found that different patterns emerged depending on whether we analyzed trait-based composition, species composition, or lifeform abundance. As hypothesized, trait-based community analysis provided evidence that N and NP treatments filter trait combinations that favor survival when biomass is high (i.e., in biotically competitive scenarios). Directional divergence of communities experiencing different nutrient enrichment treatments (in multivariate trait space) indicates the importance of incorporating multiple aboveground trait combinations when investigating drivers of trait-based community composition. In contrast with these trait-based patterns, we uncovered distinct differences in species composition among our nutrient treatments, such that all communities were significantly different from one another, while abundance of different lifeforms in each treatment community exhibit yet another pattern, in which all treatments were similar in relative forb and graminoid cover. Contrasting patterns between trait, species, and lifeform response presents an important complexity that has lacked focus in nutrient enrichment studies. It is critical to determine how each type of community investigation technique contributes to our understanding of plant community response to nutrient enrichment. While we did not specifically test why these community-level analyses differ in their response to nutrient enrichment, we recognize that contrasting patterns among trait, species, and lifeform analyses could be relevant to questions that are currently being pursued in other investigations of plant community response to nutrient enrichment. For this reason, we highlight two possible explanations for such community responses below and encourage future work emphasizing these points.
First, these patterns could indicate that nutrient enrichment influences functional traits, species composition, and lifeform abundance independently. For example, it is possible that functional trait responses would not match species composition changes if nutrient treatments are not causing complete species turnover. Global change drivers like nutrient enrichment can influence species composition in a plethora of ways including species rank and evenness changes [76]. If differences in species composition among nutrient treatments are caused by reordering of subordinate species or increased dominance of the most abundant species, we may not see differences reflected in community level functional traits because the dominant species still contribute most to the community functional trait expression.
Second, to fully understand how nutrient additions impact plant communities, it is of interest to determine whether altered functional trait expressions lead to changes in species composition, or vice versa. In our coastal grassland system, it is possible that functional traits, species composition, and lifeform abundance may change sequentially. Such a phenomenon could exist because nutrient additions play a critical role in increasing biomass production which consequentially changes plant competitive interactions through modified functional traits of community members. This mechanism leads to competitive exclusion of certain species under a new highly productive community, resulting in altered species composition. However, the inverse relationship could also be true. Nutrients could reorganize species abundances by opening a niche space for species that would otherwise be unable to germinate and colonize a given resources space, resulting in new plant species contributing to community-level functional trait compositions. Given these complexities, we encourage the use of other community-level functional trait metrics to disentangle changes in functional trait compositions, like functional alpha- and beta-diversity which we tested at our coastal grassland site.
We did not find that functional alpha-diversity varied significantly among nutrient treatments. However, we did find a significant positive correlation signifying that functional alpha-diversity is coupled with increased biomass production which is caused by N and NP enrichment. The coupled response of biomass and functional alpha-diversity response is likely a critical piece in identifying mechanisms of local-scale co-existence. In this case, when biomass is high, competitive interactions result in dissimilar trait values for co-occurring species at the alpha-level [77]. However, it is surprising that the pattern of increased alpha-diversity was only seen in relation to biomass and not among different nutrient enrichment treatments. This pattern may indicate an indirect influence of nutrient enrichment on functional diversity at the alpha-level. For example, nutrient enrichment may have an influence on specific functional trait responses, but the diversity of traits at the plot level are more influenced by biomass productivity. This information supports that functional diversity at the alpha-level can help determine how modified functional trait expressions influence species compositions as varying nutrient treatments increase biomass production. Similar findings have been found in other grassland communities [47].
Conclusions and Implications for Coastal Systems
Combined deposition of N and P effectively releases plant communities from an environmental filter (i.e., an abiotic factor influencing species success/establishment) and drives feedbacks between altered plant functional trait expressions and community productivity. As biomass increased with nutrient enrichment, we found functional alpha-diversity also increased. The positive relationship between functional alpha-diversity and aboveground biomass may be evidence of a species co-occurrence mechanism stemming from limiting functional trait similarity among species [47]. Limiting similarity of functional traits between co-occurring species in relatively high productivity environments is a common mechanism promoting species co-existence [78]. The increase in functional diversity at the local scale in our system can contribute to our understanding of processes governing community assembly (i.e., competition vs. environmental filtering), which has not been comprehensively investigated through manipulation experiments in high-disturbance, low-productivity coastal systems. Functional alpha-diversity can also specify how environmental perturbations relevant to coastal systems (i.e., nutrient enrichment) influence community structure and ecosystem functions like productivity and resilience [27,78].
It is important to recognize that while certain individual functional trait responses may be more unified in response to nutrient enrichment at global scales, others are likely driven by overarching environmental variability specific to certain ecosystem types. For example, we find certain traits (e.g., plant height) follow patterns uncovered in many other systems [79,80,81], but traits like leaf N content, SLA, and others, do not follow patterns seen in other systems or at global scales [3,19,20]. Recognition of site-specific influences on functional trait expressions emphasizes the importance of continued nutrient enrichment studies across multiple spatial scales.
Understanding mechanisms of trait-based community change by investigating diversity metrics and specific functional trait expressions sheds light on how low-productivity coastal systems are affected by recurring nutrient enrichment. Such mechanisms feedback to vegetative biomass, leading to increased productivity in N and NP plots that are four to six times higher than C plots. Understanding mechanisms of change and subsequent effects of nutrient enrichment is especially important in these low-production coastal systems, as models project increased nutrient loading by 2100 which will increase overall productivity and ultimately increase coastal resistance at large scales [39,82]. We acknowledge barrier islands are unique systems and respond individualistically to long- and short-term environmental forcings across varying spatial scales [37]. However, coastal systems are increasingly vulnerable to climate-associated disturbance, making it critical to understand plant community change in response to nutrient enrichment. In order to test our results in other regions, we encourage the establishment of more nutrient manipulation studies in low-nutrient coastal grasslands around the globe, especially those located in other barrier island systems. A higher focus on these areas will lead to better predictions of vegetation change as nutrient enrichment continues.
Supplementary Materials
The following are available online at https://0-www-mdpi-com.brum.beds.ac.uk/1424-2818/13/1/19/s1, Figure S1: Species composition NMDS, Figure S2: Lifeform abundance, Table S1: Functional trait PCA correlations and permutation test results, Table S2: PERMANOVA results of species composition NMDS.
Author Contributions
Author contributions to the article are as follows: Conceptualization: J.K.B. and J.C.Z.; methodology: J.C.Z.; formal analysis: J.K.B.; investigation: J.K.B. and J.C.Z.; data curation: J.K.B. and J.C.Z.; writing—original draft preparation: J.K.B.; writing—review and editing: J.C.Z.; visualization: J.K.B.; supervision: J.C.Z.; project administration: J.C.Z.; funding acquisition: J.C.Z. All authors have read and agreed to the published version of the manuscript.
Funding
This research was funded by National Science Foundation, grant number 1237733 and Virginia Commonwealth University.
Data Availability Statement
Data for this project are available on the Virginia Coast Reserve data portal: Brown, J. and J. Zinnert. 2017. Functional Trait Data for a Nutrient Experiment on Hog Island, VA 2017. Virginia Coast Reserve Long-Term Ecological Research Project Data Publication knb-lter-vcr.310.2 (http://www.vcrlter.virginia.educgi-bin/showDataset.cgi?docid=knb-lter-vcr.310.2). Zinnert, J., Brown, J. and A. Moulton. 2018. Long-Term Fertilization Plots in Swale Vegetation on Hog Island, VA 2015. Virginia Coast Reserve Long-Term Ecological Research Project Data Publication knb-lter-vcr.311.3 (http://doi:10.6073/pasta/eeb59ddf840c51b93c4bc7b765d4d59f).
Acknowledgments
We extend thanks to The Nature Conservancy, Virginia Coast Reserve, the University of Virginia Coastal Research Center, and the Nutrient Network for permitting, logistical, and research support. Valuable field assistance and editorial feedback was provided by Ashley Moulton, Rima Franklin, J. Anthony Stallins, and the students and post-docs of the Coastal Plant Ecology Lab at Virginia Commonwealth University.
Conflicts of Interest
The authors declare no conflict of interest.
References
- Fay, P.A.; Prober, S.M.; Harpole, W.S.; Knops, J.M.H.; Bakker, J.D.; Borer, E.T.; Lind, E.M.; MacDougall, A.S.; Seabloom, E.W.; Wragg, P.D.; et al. Grassland productivity limited by multiple nutrients. Nat. Plants 2015, 1. [Google Scholar] [CrossRef] [PubMed]
- Harpole, W.S.; Sullivan, L.L.; Lind, E.M.; Firn, J.; Adler, P.B.; Borer, E.T.; Chase, J.; Fay, P.A.; Hautier, Y.; Hillebrand, H.; et al. Addition of multiple limiting resources reduces grassland diversity. Nature 2016, 537, 93–96. [Google Scholar] [CrossRef] [PubMed]
- La Pierre, K.J.; Smith, M.D. Functional trait expression of grassland species shift with short- and long-term nutrient additions. Plant. Ecol. 2015, 216, 307–318. [Google Scholar] [CrossRef]
- Borer, E.T.; Seabloom, E.W.; Gruner, D.S.; Harpole, W.S.; Hillebrand, H. Herbivores and nutrients control grassland plant diversity via light limitation. Nature 2014, 508, 517–520. [Google Scholar] [CrossRef]
- Mahowald, N.; Jickells, T.D.; Baker, A.R.; Artaxo, P.; Benitez-Nelson, C.R.; Bergametti, G.; Bond, T.C.; Chen, Y.; Cohen, D.D.; Herut, B.; et al. Global distribution of atmospheric phosphorus sources, concentrations and deposition rates, and anthropogenic impacts. Glob. Biogeochem. Cycles 2008, 22, 1–19. [Google Scholar] [CrossRef] [Green Version]
- Vitousek, P.M.; Aber, J.D.; Howarth, R.H.; Likens, G.E.; Matson, P.A.; Schindler, D.W.; Schlesinger, W.H.; Tilman, D.G. Human alteration of the global nitrogen cycle: Source and consequences. Ecol. Appl. 1997, 7, 737–750. [Google Scholar] [CrossRef] [Green Version]
- Galloway, J.N.; Aber, J.D.; Erisman, J.W.; Seitzinger, S.P.; Howarth, R.W.; Cowling, E.B.; Cosby, B.J. The Nitrogen Cascade. Bioscience 2003, 53, 341–356. [Google Scholar] [CrossRef]
- Rockström, J.; Steffen, W.; Noone, K.; Persson, Å.; Chapin, F.S.; Lambin, E.; Lenton, T.M.; Scheffer, M.; Folke, C.; Schellnuber, H.J.; et al. Planetary Boundaries: Exploring the Safe Operating Space for Humanity. Ecol. Soc. 2009, 14, 32. [Google Scholar] [CrossRef]
- Elser, J.J.; Bracken, M.E.S.; Cleland, E.E.; Gruner, D.S.; Harpole, W.S.; Hillebrand, H.; Ngai, J.T.; Seabloom, E.W.; Shurin, J.B.; Smith, J.E. Global analysis of nitrogen and phosphorus limitation of primary producers in freshwater, marine and terrestrial ecosystems. Ecol. Lett. 2007, 10, 1135–1142. [Google Scholar] [CrossRef] [Green Version]
- Harpole, W.S.; Sullivan, L.L.; Lind, E.M.; Firn, J.; Adler, P.B.; Borer, E.T.; Chase, J.; Fay, P.A.; Hautier, Y.; Hillebrand, H.; et al. Out of the shadows: Multiple nutrient limitations drive relationships among biomass, light and plant diversity. Funct. Ecol. 2017, 31, 1839–1846. [Google Scholar] [CrossRef] [Green Version]
- Wilson, S.D.; Tilman, D. Interactive effects of fertilization and disturbance on community structure and resource availability in an old-field plant community. Oecologia 1991, 88, 61–71. [Google Scholar] [CrossRef] [PubMed]
- Clark, C.M.; Cleland, E.E.; Collins, S.L.; Fargione, J.E.; Gough, L.; Gross, K.L.; Pennings, S.C.; Suding, K.N.; Grace, J.B. Environmental and plant community determinants of species loss following nitrogen enrichment. Ecol. Lett. 2007, 10, 596–607. [Google Scholar] [CrossRef] [PubMed]
- Hautier, Y.; Niklaus, P.A.; Hector, A. Competition for light causes plant biodiversity loss after eutrophication. Science 2009, 324, 636–638. [Google Scholar] [CrossRef] [PubMed] [Green Version]
- Demalach, N.; Kadmon, R. Light competition explains diversity decline better than niche dimensionality. Funct. Ecol. 2017, 31, 1834–1838. [Google Scholar] [CrossRef]
- Carson, W.P.; Barrett, G.W. Succession in Old-Field Plant Communities: Effects of Contrasting Types of Nutrient Enrichment. Ecology 1988, 69, 984–994. [Google Scholar] [CrossRef]
- Clark, C.M.; Tilman, D. Loss of plant species after chronic low-level nitrogen deposition to prairie grasslands. Nature 2008, 451, 712–715. [Google Scholar] [CrossRef]
- Koerner, S.E.; Avolio, M.L.; La Pierre, K.J.; Wilcox, K.R.; Smith, M.D.; Collins, S.L. Nutrient additions cause divergence of tallgrass prairie plant communities resulting in loss of ecosystem stability. J. Ecol. 2016, 104, 1478–1487. [Google Scholar] [CrossRef] [Green Version]
- Suding, K.N.; Collins, S.L.; Gough, L.; Clark, C.; Cleland, E.E.; Gross, K.L.; Milchunas, D.G.; Pennings, S. Functional- and abundance-based mechanisms explain diversity loss due to N fertilization. Proc. Natl. Acad. Sci. USA 2005, 102, 4387–4392. [Google Scholar] [CrossRef] [Green Version]
- Firn, J.; McGree, J.M.; Harvey, E.; Flores-Moreno, H.; Schütz, M.; Buckley, Y.M.; Borer, E.T.; Seabloom, E.W.; La Pierre, K.J.; MacDougall, A.M.; et al. Leaf nutrients, not specific leaf area, are consistent indicators of elevated nutrient inputs. Nat. Ecol. Evol. 2019, 3, 400–406. [Google Scholar] [CrossRef] [Green Version]
- Tatarko, A.R.; Knops, J.M.H. Nitrogen addition and ecosystem functioning: Both species abundances and traits alter community structure and function. Ecosphere 2018, 9, e02087. [Google Scholar] [CrossRef]
- Ceulemans, T.; Merckx, R.; Hens, M.; Honnay, O. A trait-based analysis of the role of phosphorus vs. nitrogen enrichment in plant species loss across North-west European grasslands. J. Appl. Ecol. 2011, 48, 1155–1163. [Google Scholar] [CrossRef]
- Zhang, D.; Peng, Y.; Li, F.; Yang, G.; Wang, J.; Yu, J.; Zhou, G.; Yang, Y. Trait identity and functional diversity co-drive response of ecosystem productivity to nitrogen enrichment. J. Ecol. 2019, 107, 2402–2414. [Google Scholar] [CrossRef]
- Hu, G.; Jin, Y.; Liu, J.; Yu, M. Functional diversity versus species diversity: Relationships with habitat heterogeneity at multiple scales in a subtropical evergreen broad-leaved forest. Ecol. Res. 2014. [Google Scholar] [CrossRef]
- Kraft, N.J.B.; Valencia, R.; Ackerly, D.D. Functional traits and niche-based tree community assembly in an Amazonian forest. Science 2008. [Google Scholar] [CrossRef] [PubMed] [Green Version]
- Calow, P. Towards a Definition of Functional Ecology. Funct. Ecol. 1987. [Google Scholar] [CrossRef]
- Laureto, L.M.O.; Cianciaruso, M.V.; Samia, D.S.M. Functional diversity: An overview of its history and applicability. Nat. Conserv. 2015, 13, 112–116. [Google Scholar] [CrossRef] [Green Version]
- Mouillot, D. Niche-assembly vs. dispersal-assembly rules in coastal fish metacommunities: Implications for management of biodiversity in brackish lagoons. J. Appl. Ecol. 2007, 44, 760–767. [Google Scholar] [CrossRef]
- Carmona, C.P.; de Bello, F.; Mason, N.W.H.; Lepš, J. Traits without Borders: Integrating Functional Diversity across Scales. Trends Ecol. Evol. 2016, 31, 382–394. [Google Scholar] [CrossRef]
- Mason, N.W.H.; Richardson, S.J.; Peltzer, D.A.; de Bello, F.; Wardle, D.A.; Allen, R.B. Changes in coexistence mechanisms along a long-term soil chronosequence revealed by functional trait diversity. J. Ecol. 2012, 100, 678–689. [Google Scholar] [CrossRef] [Green Version]
- Niu, K.; Choler, P.; de Bello, F.; Mirotchnick, N.; Du, G.; Sun, S. Fertilization decreases species diversity but increases functional diversity: A three-year experiment in a Tibetan alpine meadow. Agric. Ecosyst. Environ. 2014, 182, 106–112. [Google Scholar] [CrossRef]
- Helsen, K.; Ceulemans, T.; Stevens, C.J.; Honnay, O. Increasing Soil Nutrient Loads of European Semi-natural Grasslands Strongly Alter Plant Functional Diversity Independently of Species Loss. Ecosystems 2014, 17, 169–181. [Google Scholar] [CrossRef]
- Ehrenfeld, J.G. Dynamics and processes of barrier island vegetation. Rev. Aquat. Sci. 1990, 2, 437–480. [Google Scholar]
- Seitzinger, S.P.; Kroeze, C.; Bouwman, A.F.; Caraco, N.; Dentener, F.; Styles, R.V. Global patterns of dissolved inorganic and particulate nitrogen inputs to coastal systems: Recent conditions and future projections. Estuaries 2002, 25, 640–655. [Google Scholar] [CrossRef]
- Aggenbach, C.J.S.; Kooijman, A.M.; Fujita, Y.; van der Hagen, H.; van Til, M.; Cooper, D.; Jones, L. Does atmospheric nitrogen deposition lead to greater nitrogen and. Biol. Conserv. 2017, 212, 416–422. [Google Scholar] [CrossRef] [Green Version]
- Pakeman, R.J.; Alexander, J.; Brooker, R.; Cummins, R.; Fielding, D.; Gore, S.; Hewison, R.; Mitchell, R.; Moore, E.; Orford, K.; et al. Long-term impacts of nitrogen deposition on coastal plant. Environ. Pollut. 2016, 212, 337–347. [Google Scholar] [CrossRef]
- Day, F.P.; Conn, C.; Crawford, E.; Stevenson, M. Long-term effects of nitrogen fertilization on plant community structure on a coastal barrier island dune chronosequence. J. Coast. Res. 2004, 20, 722–730. [Google Scholar] [CrossRef]
- Zinnert, J.C.; Stallins, J.A.; Brantley, S.T.; Young, D.R. Crossing scales: The complexity of barrier-island processes for predicting future change. Bioscience 2017, 67, 39–52. [Google Scholar] [CrossRef]
- Stutz, M.L.; Pilkey, O.H. A Review of Global Barrier Island Distribution. J. Coast. Res. 2001, 34, 15–22. [Google Scholar]
- Sinha, E.; Michalak, A.M.; Balaji, V. Eutrophication will increase during the 21st century as a result of precipitation changes. Science 2017, 357, 1–5. [Google Scholar] [CrossRef] [Green Version]
- Smith, V.H.; Tilman, G.D.; Nekola, J.C. Eutrophication: Impacts of excess nutrient inputs on freshwater, marine, and terrestrial ecosystems. Environ. Pollut. 1999, 100, 179–196. [Google Scholar] [CrossRef]
- Osgood, D.T.; Zieman, J.C. Factors controlling aboveground Spartina alterniflora (Smooth cordgrass) tissue element composition and production in different-age barrier island marshes. Estuaries 1993, 16, 815–826. [Google Scholar] [CrossRef]
- Zinnert, J.C.; Shiflett, S.A.; Via, S.; Bissett, S.; Dows, B.; Manley, P.; Young, D.R. Spatial–Temporal Dynamics in Barrier Island Upland Vegetation: The Overlooked Coastal Landscape. Ecosystems 2016, 19, 685–697. [Google Scholar] [CrossRef]
- Young, D.R.; Brantley, S.T.; Zinnert, J.C.; Vick, J.K. Landscape position and habitat polygons in a dynamic coastal environment. Ecosphere 2011, 2. [Google Scholar] [CrossRef]
- Sinclair, M.N.; Woods, N.N.; Zinnert, J.C. Seasonal facilitative and competitive trade-offs between shrub seedlings and coastal grasses. Ecosphere 2020. [Google Scholar] [CrossRef]
- Moulton, A. Short-Term Effects of Nutrients on a Barrier Island Grassland Community; Virginia Commonwealth University: Richmond, VA, USA, 2017. [Google Scholar]
- Funk, J.L.; Larson, J.E.; Ames, G.M.; Butterfield, B.J.; Cavender-Bares, J.; Firn, J.; Laughlin, D.C.; Sutton-Grier, A.E.; Williams, L.; Wright, J. Revisiting the Holy Grail: Using plant functional traits to understand ecological processes. Biol. Rev. 2016, 92, 1156–1173. [Google Scholar] [CrossRef] [PubMed]
- Laliberté, E.; Norton, D.A.; Scott, D. Contrasting effects of productivity and disturbance on plant functional diversity at local and metacommunity scales. J. Veg. Sci. 2013, 24, 834–842. [Google Scholar] [CrossRef]
- Wright, I.J.; Reich, P.B.; Westoby, M.; Ackerly, D.D.; Baruch, Z.; Bongers, F.; Cavender-Bares, J.; Chapin, T.; Cornellssen, J.H.C.; Diemer, M.; et al. The worldwide leaf economics spectrum. Nature 2004, 428, 821–827. [Google Scholar] [CrossRef]
- Poorter, H.; De Jong, R. A comparison of specific leaf area, chemical composition and leaf construction costs of field plants from 15 habitats differing in productivity. New Phytol. 1999, 143, 163–176. [Google Scholar] [CrossRef] [Green Version]
- Díaz, S.; Hodgson, J.G.; Thompson, K.; Cabido, M.; Cornelissen, J.H.C.; Jalili, A.; Montserrat-Martí, G.; Grime, J.P.; Zarrinkamar, F.; Asri, Y.; et al. The plant traits that drive ecosystems: Evidence from three continents. J. Veg. Sci. 2004, 15, 295–304. [Google Scholar] [CrossRef] [Green Version]
- Liu, X.; Xu, G.; Wu, Y.; Ma, L.; Gao, J.; Zhang, Y.; Liu, P. Leaf characters of Ulmus elongata in fragmented habitats: Implications for conservation. Acta Ecol. Sin. 2017, 37, 346–353. [Google Scholar] [CrossRef]
- Hobbie, E.A.; Högberg, P. Nitrogen isotopes link mycorrhizal fungi and plants to nitrogen dynamics. New Phytol. 2012, 196, 367–382. [Google Scholar] [CrossRef] [PubMed]
- Kleinebecker, T.; Hölzel, N.; Prati, D.; Schmitt, B.; Fischer, M.; Klaus, V.H. Evidence from the real world:15N natural abundances reveal enhanced nitrogen use at high plant diversity in Central European grasslands. J. Ecol. 2014, 102, 456–465. [Google Scholar] [CrossRef]
- Garnier, E.; Cortez, J.; Billès, G.; Navas, M.L.; Roumet, C.; Debussche, M.; Laurent, G.; Blanchard, A.; Aubry, D.; Bellmann, A.; et al. Plant functional markers capture ecosystem properties during secondary succession. Ecology 2004, 85, 2630–2637. [Google Scholar] [CrossRef]
- Oksanen, J.; Blanchet, F.G.; Friendly, M.; Kindt, R.; Legendre, P.; Mcglinn, D.; Minchin, P.R.; O’hara, R.B.; Simpson, G.L.; Solymos, P.; et al. Vegan: Community Ecology Package. R Package Version 2.5-4. 2019. Available online: https://cran.r-project.org/web/packages/vegan/index.html (accessed on 15 April 2020).
- Anderson, M.J. Permutational Multivariate Analysis of Variance (PERMANOVA). In Wiley StatsRef: Statistics Reference Online; 2017; Available online: https://0-onlinelibrary-wiley-com.brum.beds.ac.uk/doi/full/10.1002/9781118445112.stat07841 (accessed on 19 September 2020).
- Botta-Dukát, Z. Rao’s quadratic entropy as a measure of functional diversity based on multiple traits. J. Veg. Sci. 2005, 16, 533–540. [Google Scholar] [CrossRef]
- Laliberte, E.; Legendre, P. A distance-based framework for measuring functional diversity from multiple traits. Ecology 2010, 91, 299–305. [Google Scholar] [CrossRef]
- Laliberté, E.; Legendre, P.; Shipley, B. FD: Measuring Functional Diversity from Multiple Traits, and other Tools for Functional Ecology. R Package. 2015. Available online: https://cran.r-project.org/web/packages/FD/FD.pdf (accessed on 15 April 2020).
- Anderson, M.J.; Ellingsen, K.E.; McArdle, B.H. Multivariate dispersion as a measure of beta diversity. Ecol. Lett. 2006, 9, 683–693. [Google Scholar] [CrossRef]
- Anderson, M.J. Distance-based tests for homogeneity of multivariate dispersions. Biometrics 2006, 62, 245–253. [Google Scholar] [CrossRef]
- Siefert, A.; Ritchie, M.E. Intraspecific trait variation drives functional responses of old-field plant communities to nutrient enrichment. Oecologia 2016, 181, 245–255. [Google Scholar] [CrossRef]
- Hobbie, E.A.; Macko, S.A.; Williams, M. Correlations between foliar δ15N and nitrogen concentrations may indicate-plant-mycorrhizal interactions. Oecologia 2000, 122, 273–283. [Google Scholar] [CrossRef]
- Craine, J.M.; Brookshire, E.N.J.; Cramer, M.D.; Hasselquist, N.J.; Koba, K.; Marin-Spiotta, E.; Wang, L. Ecological interpretations of nitrogen isotope ratios of terrestrial plants and soils. Plant. Soil 2015, 396, 1–26. [Google Scholar] [CrossRef] [Green Version]
- Jung, K.; Gebauer, G.; Gehre, M.; Hofmann, D.; Weißflog, L.; Schüürmann, G. Anthropogenic impacts on natural nitrogen isotope variations in Pinus sylvestris stands in an industrially polluted area. Environ. Pollut. 1997, 97, 175–181. [Google Scholar] [CrossRef]
- Michelsen, A.; Quarmby, C.; Sleep, D.; Jonasson, S. Vascular plant 15N natural abundance in heath and forest tundra ecosystems is closely correlated with presence and type of mycorrhizal fungi in roots. Oecologia 1998, 115, 406–418. [Google Scholar] [CrossRef] [PubMed]
- Högberg, P.; Johannisson, C.; Yarwood, S.; Callesen, I.; Näsholm, T.; Myrold, D.D.; Högberg, M.N. Recovery of ectomycorrhiza after “nitrogen saturation” of a conifer forest. New Phytol. 2011, 189, 515–525. [Google Scholar] [CrossRef] [PubMed]
- Robinson, D. δ15N as an integrator of the nitrogen cycle. Trends Ecol. Evol. 2001, 16, 153–162. [Google Scholar] [CrossRef]
- Bond, G. Fixation of Nitrogen by Higher Plants Other than Legumes. Annu. Rev. Plant. Physiol. 1967. [Google Scholar] [CrossRef]
- Young, D.R.; Sande, E.; Peters, G.A. Spatial relationships of Frankia and Myrica cerifera on a Virginia, USA Barrier Island. Symbiosis 1992, 12, 209–220. [Google Scholar]
- Craine, J.M.; Elmore, A.J.; Aidar, M.P.M.; Bustamante, M.; Dawson, T.E.; Hobbie, E.A.; Kahmen, A.; MacK, M.C.; McLauchlan, K.K.; Michelsen, A.; et al. Global patterns of foliar nitrogen isotopes and their relationships with climate, mycorrhizal fungi, foliar nutrient concentrations, and nitrogen availability. New Phytol. 2009, 183, 980–992. [Google Scholar] [CrossRef]
- Johnson, N.C.; Rowland, D.L.; Corkidi, L.; Egerton-Warburton, L.M.; Allen, E.B. Nitrogen enrichment alters mycorrhizal allocation at five mesic to semiarid grasslands. Ecology 2003, 84, 1895–1908. [Google Scholar] [CrossRef]
- Grman, E.; Robinson, T.M.P. Resource availability and imbalance affect plant-mycorrhizal interactions: A field test of three hypotheses. Ecology 2013, 94, 62–71. [Google Scholar] [CrossRef]
- Chen, W.; Xu, R.; Wu, Y.; Chen, J.; Zhang, Y.; Hu, T.; Yuan, X.; Zhou, L.; Tan, T.; Fan, J. Plant diversity is coupled with beta not alpha diversity of soil fungal communities following N enrichment in a semi-arid grassland. Soil Biol. Biochem. 2018, 116, 388–398. [Google Scholar] [CrossRef]
- Zhang, N.; Wan, S.; Li, L.; Bi, J.; Zhao, M.; Ma, K. Impacts of urea N addition on soil microbial community in a semi-arid temperate steppe in northern China. Plant. Soil 2008, 311, 19–28. [Google Scholar] [CrossRef]
- Avolio, M.L.; Carroll, I.T.; Collins, S.L.; Houseman, G.R.; Hallett, L.M.; Isbell, F.; Koerner, S.E.; Komatsu, K.J.; Smith, M.D.; Wilcox, K.R. A comprehensive approach to analyzing community dynamics using rank abundance curves. Ecosphere 2019. [Google Scholar] [CrossRef] [Green Version]
- Swenson, N.G.; Erickson, D.L.; Mi, X.; Bourg, N.A.; Forero-Montana, J.; Ge, X.; Howe, R.; Lake, J.K.; Liu, X.; Ma, K.; et al. Phylogenetic and functional alpha and beta diversity in temperate and tropical tree communities. Ecology 2012, 93. [Google Scholar] [CrossRef] [PubMed]
- Schwilk, D.W.; Ackerly, D.D. Limiting similarity and functional diversity along environmental gradients. Ecol. Lett. 2005, 8, 272–281. [Google Scholar] [CrossRef]
- Li, W.; Cheng, J.M.; Yu, K.L.; Epstein, H.E.; Guo, L.; Jing, G.H.; Zhao, J.; Du, G.Z. Plant functional diversity can be independent of species diversity: Observations based on the impact of 4-yrs of nitrogen and phosphorus additions in an alpine meadow. PLoS ONE 2015, 10, e0136040. [Google Scholar] [CrossRef] [PubMed] [Green Version]
- Nogueira, C.; Nunes, A.; Bugalho, M.N.; Branquinho, C.; McCulley, R.L.; Caldeira, M.C. Nutrient addition and drought interact to change the structure and decrease the functional diversity of a Mediterranean grassland. Front. Ecol. Evol. 2018, 6. [Google Scholar] [CrossRef] [Green Version]
- DeMalach, N.; Zaady, E.; Kadmon, R. Light asymmetry explains the effect of nutrient enrichment on grassland diversity. Ecol. Lett. 2017, 20, 60–69. [Google Scholar] [CrossRef] [PubMed]
- Storm, C.; Süss, K. Are low-productive plant communities responsive to nutrient addition? Evidence from sand pioneer grassland. J. Veg. Sci. 2008, 19, 343–354. [Google Scholar] [CrossRef]
Figure 1.
Total biomass (mean ± SE) for each nutrient treatment (C = control, P = phosphorus, N = nitrogen, and NP = nitrogen + phosphorus) on a barrier island grassland community. Letters indicate significant differences based on Tukey HSD pairwise comparison results. Bars with different letters are significantly different (p < 0.05).

Figure 2.
Mean ± SE of community-weighted height (A), specific leaf area (B), leaf nitrogen isotope ratio (C), leaf carbon content (D), and leaf nitrogen content (E) for each nutrient treatment (C = control, P = phosphorus, N = nitrogen, and NP = nitrogen + phosphorus) on a barrier island grassland community. Connecting letters indicate significant differences based on Tukey HSD pairwise comparison results. Bars that do not share the same letter are significantly different (p < 0.05).

Figure 3.
Principal components analysis (PCA) of trait-based community composition grouped in convex hulls by nutrient treatment type on a barrier island grassland community. Points represent individual experimental plots in functional trait space with asterisks indicating centroids for each group. Colors and symbols are matched to nutrient treatment (C = control, P = phosphorus, N = nitrogen, and NP = nitrogen + phosphorus). Centroids can be viewed as mean trait-based community composition. Vectors indicate functional trait correlations with each axis. Vectors are labeled with the functional trait they represent, and lengths indicate goodness of fit (Table S1).

Figure 4.
(A,B): Mean (± SE) of functional alpha (FDQ) and beta-diversity (beta-dispersion) for each nutrient treatment (C = control, P = phosphorus, N = nitrogen, and NP = nitrogen + phosphorus). (C,D)—relationship between total aboveground biomass and functional alpha-diversity (C) and functional beta-diversity. Regression coefficients and p-value are reported at the top of each panel.


Table 1.
Pairwise comparisons via PERMANOVA results for trait-based communities between nutrient enrichment treatments on coastal grassland. Bold indicates p < 0.05, using FDR correction.
Table 1.
Pairwise comparisons via PERMANOVA results for trait-based communities between nutrient enrichment treatments on coastal grassland. Bold indicates p < 0.05, using FDR correction.
| Comparison | F-Value | p-Value |
|---|---|---|
| C vs. P | 0.9 | 0.5260 |
| C vs. N | 6.8 | 0.0135 |
| C vs. NP | 5.2 | 0.0135 |
| P vs. N | 7.4 | 0.0135 |
| P vs. NP | 5.4 | 0.0135 |
| N vs. NP | 2.4 | 0.1236 |
Publisher’s Note: MDPI stays neutral with regard to jurisdictional claims in published maps and institutional affiliations. |
© 2021 by the authors. Licensee MDPI, Basel, Switzerland. This article is an open access article distributed under the terms and conditions of the Creative Commons Attribution (CC BY) license (http://creativecommons.org/licenses/by/4.0/).
Share and Cite
MDPI and ACS Style
Brown, J.K.; Zinnert, J.C. Trait-Based Investigation Reveals Patterns of Community Response to Nutrient Enrichment in Coastal Mesic Grassland. Diversity 2021, 13, 19. https://0-doi-org.brum.beds.ac.uk/10.3390/d13010019
AMA Style
Brown JK, Zinnert JC. Trait-Based Investigation Reveals Patterns of Community Response to Nutrient Enrichment in Coastal Mesic Grassland. Diversity. 2021; 13(1):19. https://0-doi-org.brum.beds.ac.uk/10.3390/d13010019
Chicago/Turabian StyleBrown, Joseph K., and Julie C. Zinnert. 2021. "Trait-Based Investigation Reveals Patterns of Community Response to Nutrient Enrichment in Coastal Mesic Grassland" Diversity 13, no. 1: 19. https://0-doi-org.brum.beds.ac.uk/10.3390/d13010019
Note that from the first issue of 2016, this journal uses article numbers instead of page numbers. See further details here.