Article

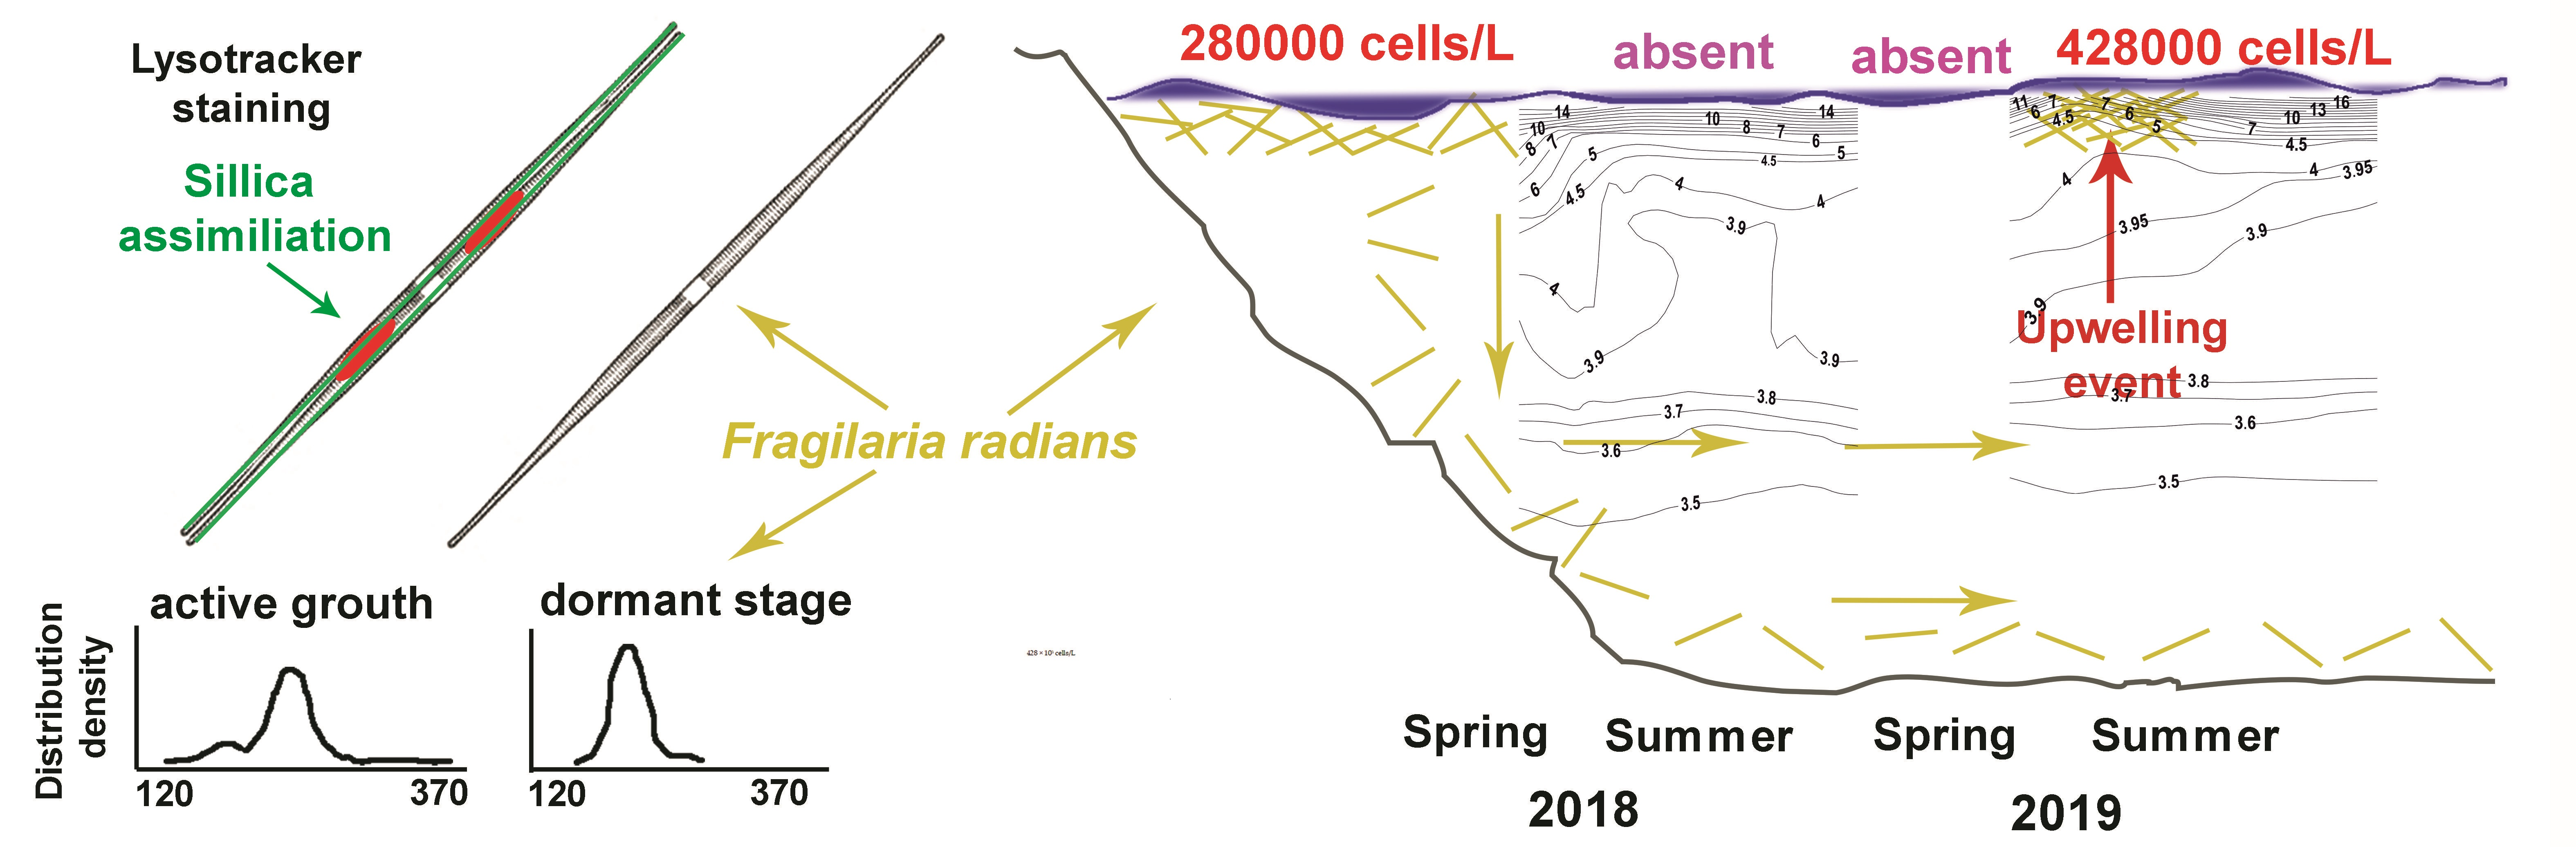
Is a High Abundance of Spring Diatoms in the Photic Zone of Lake Baikal in July 2019 Due to an Upwelling Event?

Laboratories of Genosystematics and Hydrophysics, Department of Cell Ultrastructure, Limnological Institute, Siberian Branch of the Russian Academy of Sciences, 664033 Irkutsk, Russia
*
Author to whom correspondence should be addressed.
Submission received: 16 September 2021 / Revised: 9 October 2021 / Accepted: 12 October 2021 / Published: 19 October 2021
(This article belongs to the Special Issue Freshwater Siliceous Microeukaryotes)

Abstract

:
A high abundance of planktonic microalgae is typically thought to be related to their ‘bloom’, that is, to active population growth. Diatom blooms in the photic zone of Lake Baikal generally occur during hydrological spring (April–June); when the summer arrives and the surface water temperature increases, diatoms are replaced by other microalgae. In July 2019, we found a concentration of the diatom Fragilaria radians at a station in South Baikal that was extremely high for that season. This species generally blooms in spring, but in spring (May) of 2019, this alga was nearly absent from the phytoplankton population. Microscopic analysis of the sample taken in July 2019 revealed that the cells were in a dormant stage. The species composition of microalgae in phytoplankton samples from May 2018 and July 2019 was similar. According to the temperature profile analysis, a summer upwelling event from a depth of ca. 100 m occurred in 2019. We hypothesised that this event caused the resuspension of microalgae, including Fragilaria radians, which were deposited on the slopes of the lake in 2018. Hence, the high abundance is not always a ‘bloom’ or an active growth.

Graphical Abstract

1. Introduction

Bloom formation is characteristic for many different microalgae species in the ocean and large lakes. Microalgae are able to quickly build up high cell concentrations and biomass if conditions (nutrients and light) become favourable. Most microalgae form seasonal blooms in the spring and autumn, which fuel the entire marine food web. The significance of this seasonal process on a global scale, which is even visible from space, has led many different groups worldwide to work for decades to better understand how these blooms are formed [1,2,3,4].
Phytoplankton blooms in Lake Baikal have a seasonal pattern. In the spring, starting from the under-ice period (March–April) and continuing into June, a bloom of Aulacoseira skvortzowii (O. Müller) Simonsen, Aulacoseira baicalensis (K. Meyer) Simonsen, Fragilaria radians (Kützing) D.M. Williams and Round, Nitzschia graciliformis Lange-Bertalot and Simonsen, Lindavia baicalensis (Skvortsov and K.I. Meyer) Nakov, Guillory, M.L. Julius, E.C. Theriot, and A.J. Alverson occurred, which contributed to the primary production of the lake [5,6,7,8]. The abundance of dominant species can vary from year to year (for a review, see Figure 3.1.4 in [9]). In the summer (July and August), the abundance of diatoms is small, and the primary production depends on cyanoprokaryotes of the genera Synechocystis and Synechococcus [10,11,12]. During September–October, a second peak of total diatoms is observed; the main species in autumn is Lindavia minuta (Skvortsov) T. Nakov, et al. 2015 [5,6,7,8]. The presence of ‘spring’ species, such as Lindavia baicalensis, which appeared in July (p. 50 in [8]), was reported in the composition of summer phytoplankton, but the reason for these phenomena is not yet known. The literature does not mention the mass grows of ‘spring’ species of diatom phytoplankton (A. baicalensis, F. radians, N. graciliformis, or L. baicalensis) in the summer (from late June to late August). In summer, these species stop increasing their cell biomass and actively dividing [5,6,7,8]; the cells gradually settle to the bottom or into deeper layers of the water, and they are also consumed by organisms of the next trophic link of the food web in Lake Baikal.
Lake Baikal is characterised by a set of hydrological phenomena that favour rapid horizontal and vertical water mixing. These include wind mixing, circulation currents, and upwelling and downwelling events [13,14,15]. Lake Baikal is similar to the ocean and other large lakes because of a variety of hydrophysical processes [16,17,18,19,20]. Vertical water mixing is particularly important for Lake Baikal; during upwelling events, nutrient-enriched deep-water masses ascend to the surface layer, causing phytoplankton blooms [21,22]. Wind action leads to the mixing and upwelling of the top 100–150 m of surface water of the lake. Such upwelling events were recorded in different seasons across the entire lake [14]. Upwellings can play a considerable role in the life of phytoplankton, delivering nutrients to algae and lifting cells from deep layers to the surface.
During expeditionary work in July 2019 at a station 7 km from Marituy in South Baikal, we found an abnormally high concentration of cells of the spring diatom species F. radians (428 × 103 cells/L). Such a high concentration of cells of this species in the summer had never been recorded previously. Our study aimed to explain the phenomenon of ultrahigh concentrations of F. radians in the summer by comparing various biological, hydrological, and hydrochemical environmental conditions in the study area of South Baikal.

2. Materials and Methods

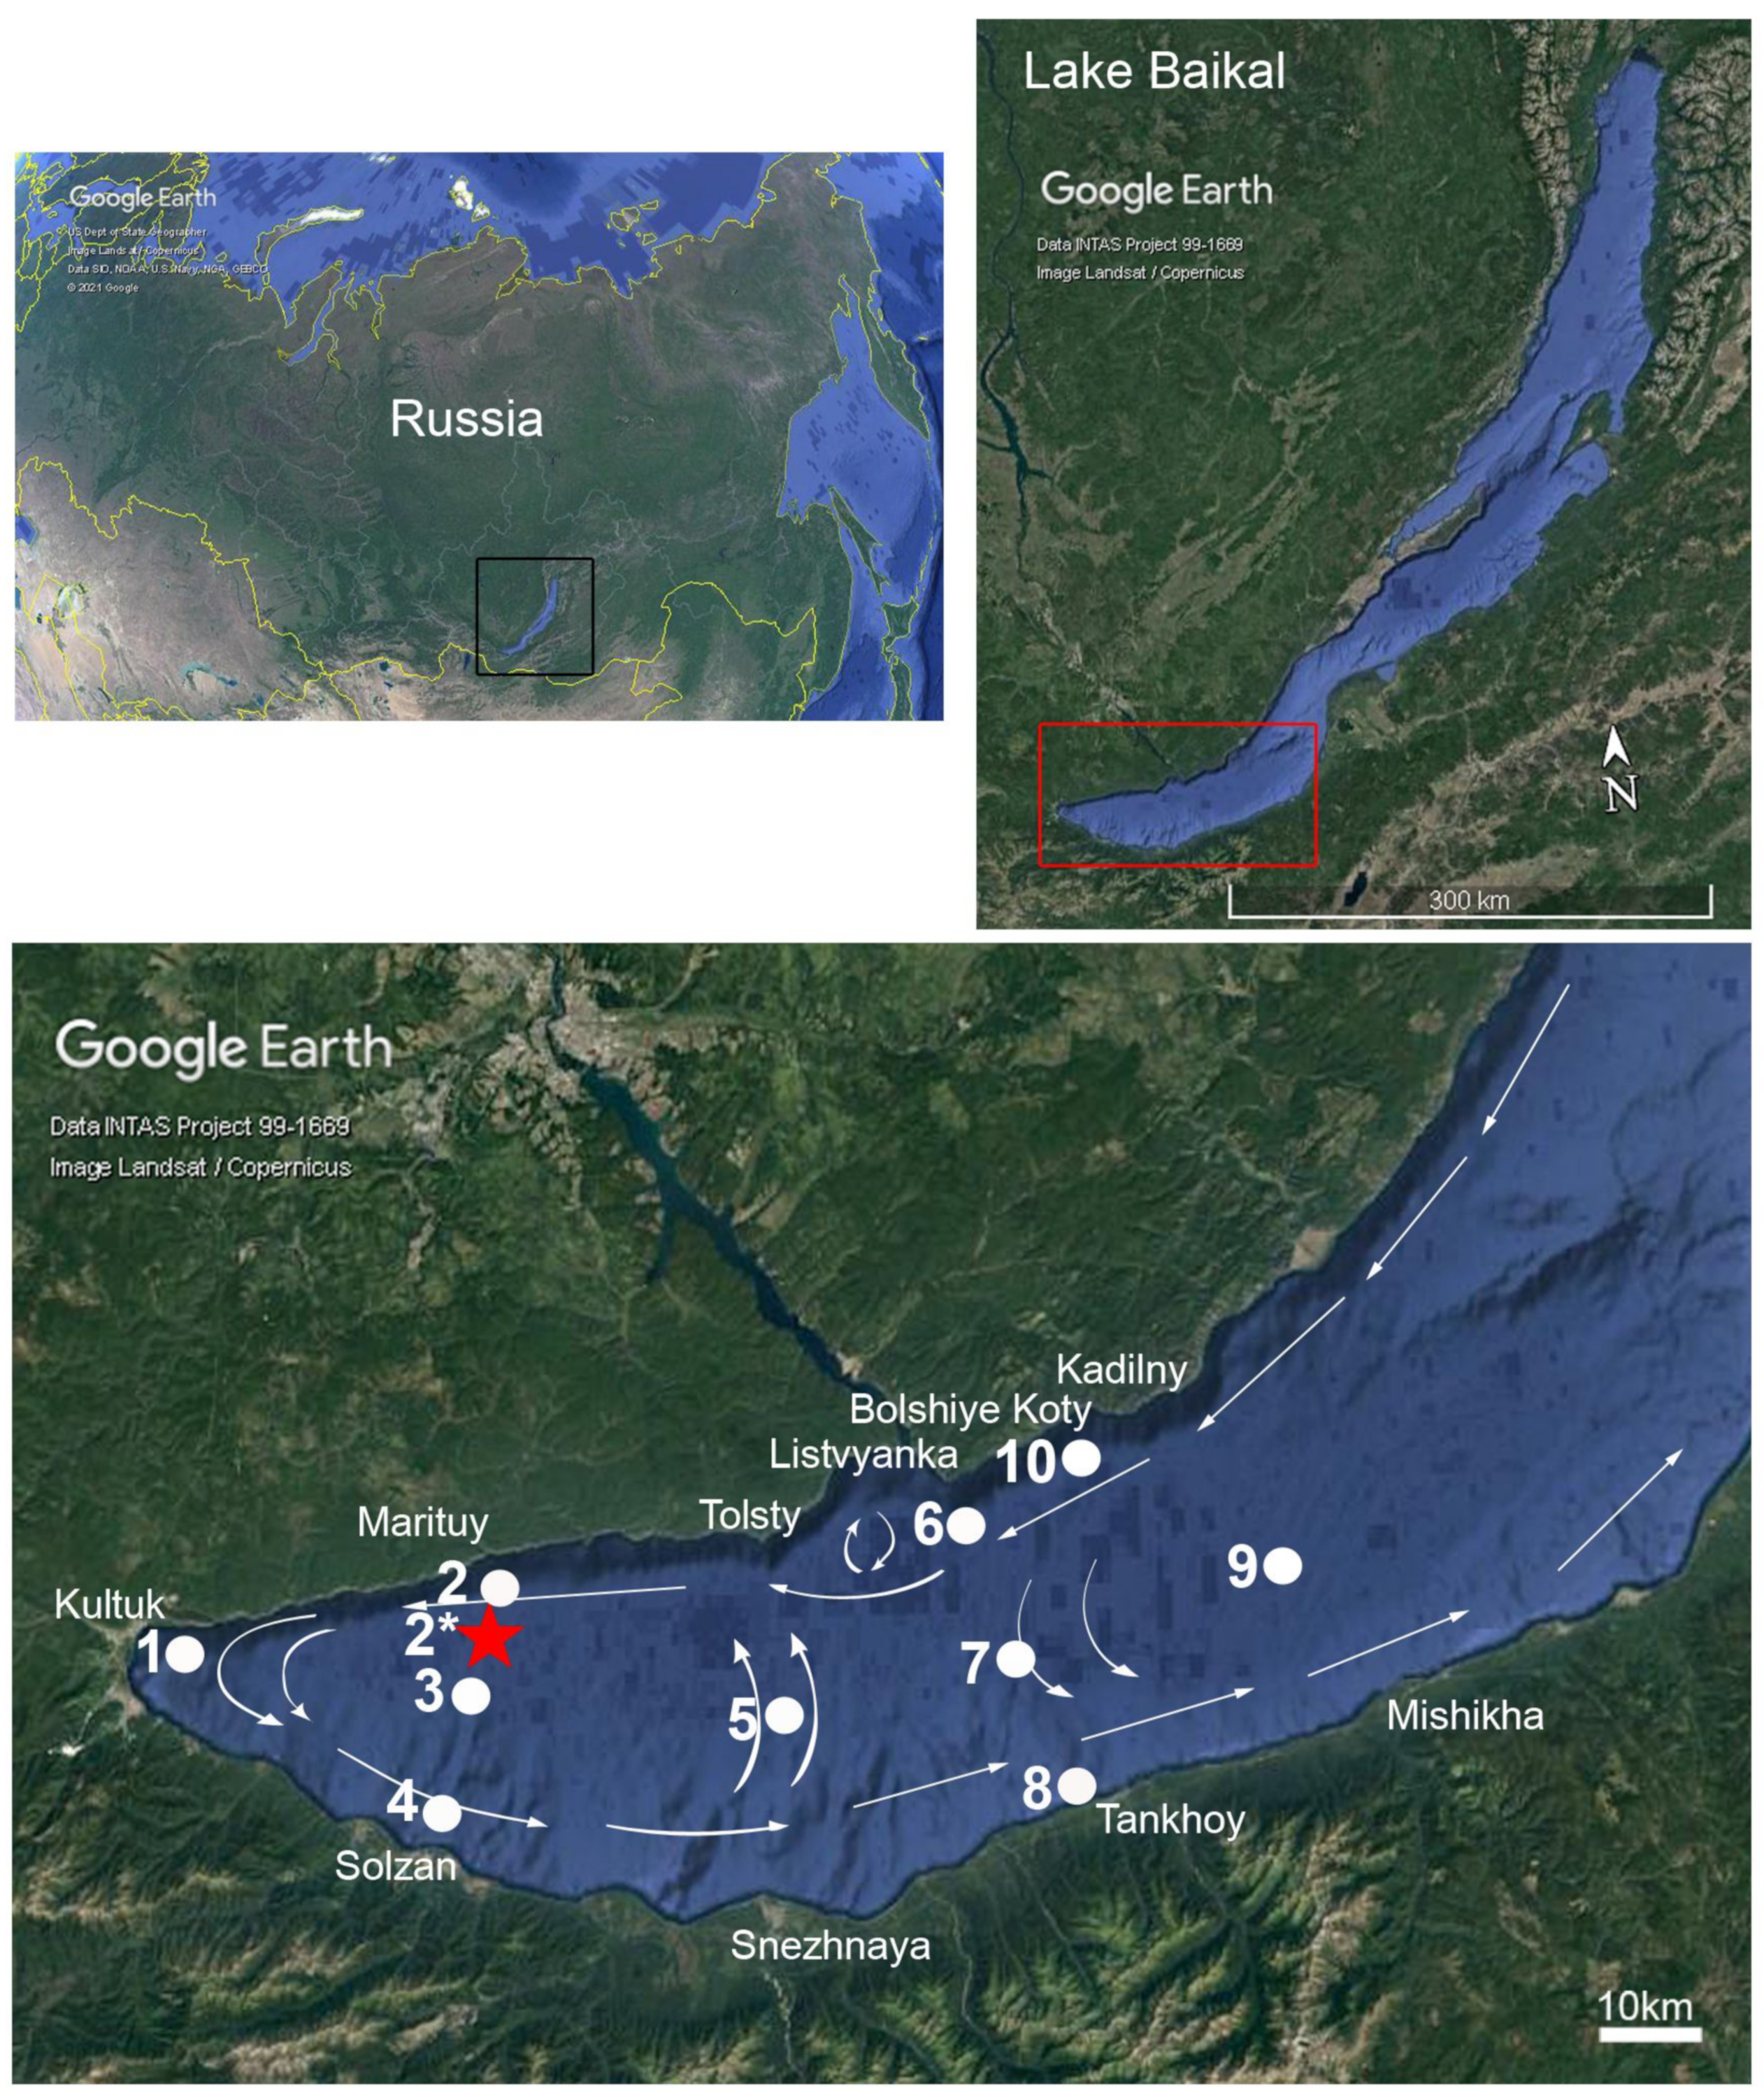
2.1. Study Area and Sampling

The study was conducted in South Baikal at 10 stations during three seasons: spring (the end of May), summer (the end of July to the beginning of August), and autumn (the middle of September) of 2018 and 2019 (Figure 1; Supplementary Materials Table S1). In total, 36 integral samples were analysed to assess the number of algal cells, the physiological parameters of the cells, and the hydrogeological and hydrochemical parameters of the water.
Phytoplankton samples for quantitative analysis were taken from the research vessel «G. Yu. Vereshchagin» using the SBE 32 Carousel Water Sampler (Sea-Bird Electronics, Bellevue, WA, USA). Samples were collected from the photic layer at 1, 5, 10, 15, 20, and 25 m, combined into an integrated water sample (total volume of 1.2 L), and fixed with Lugol’s solution [24,25,26]. For a qualitative analysis of the species composition, samples were taken from 25 m using an Apstein net [27] (27 µm mesh size) and were fixed with 70% ethanol.
At Point 10, near Bolshiye Koty village, sampling was carried out during the ice period in March 2019. Samples from this point were used to assess the rate of accumulation of silicon dissolved in the water by diatom cells.

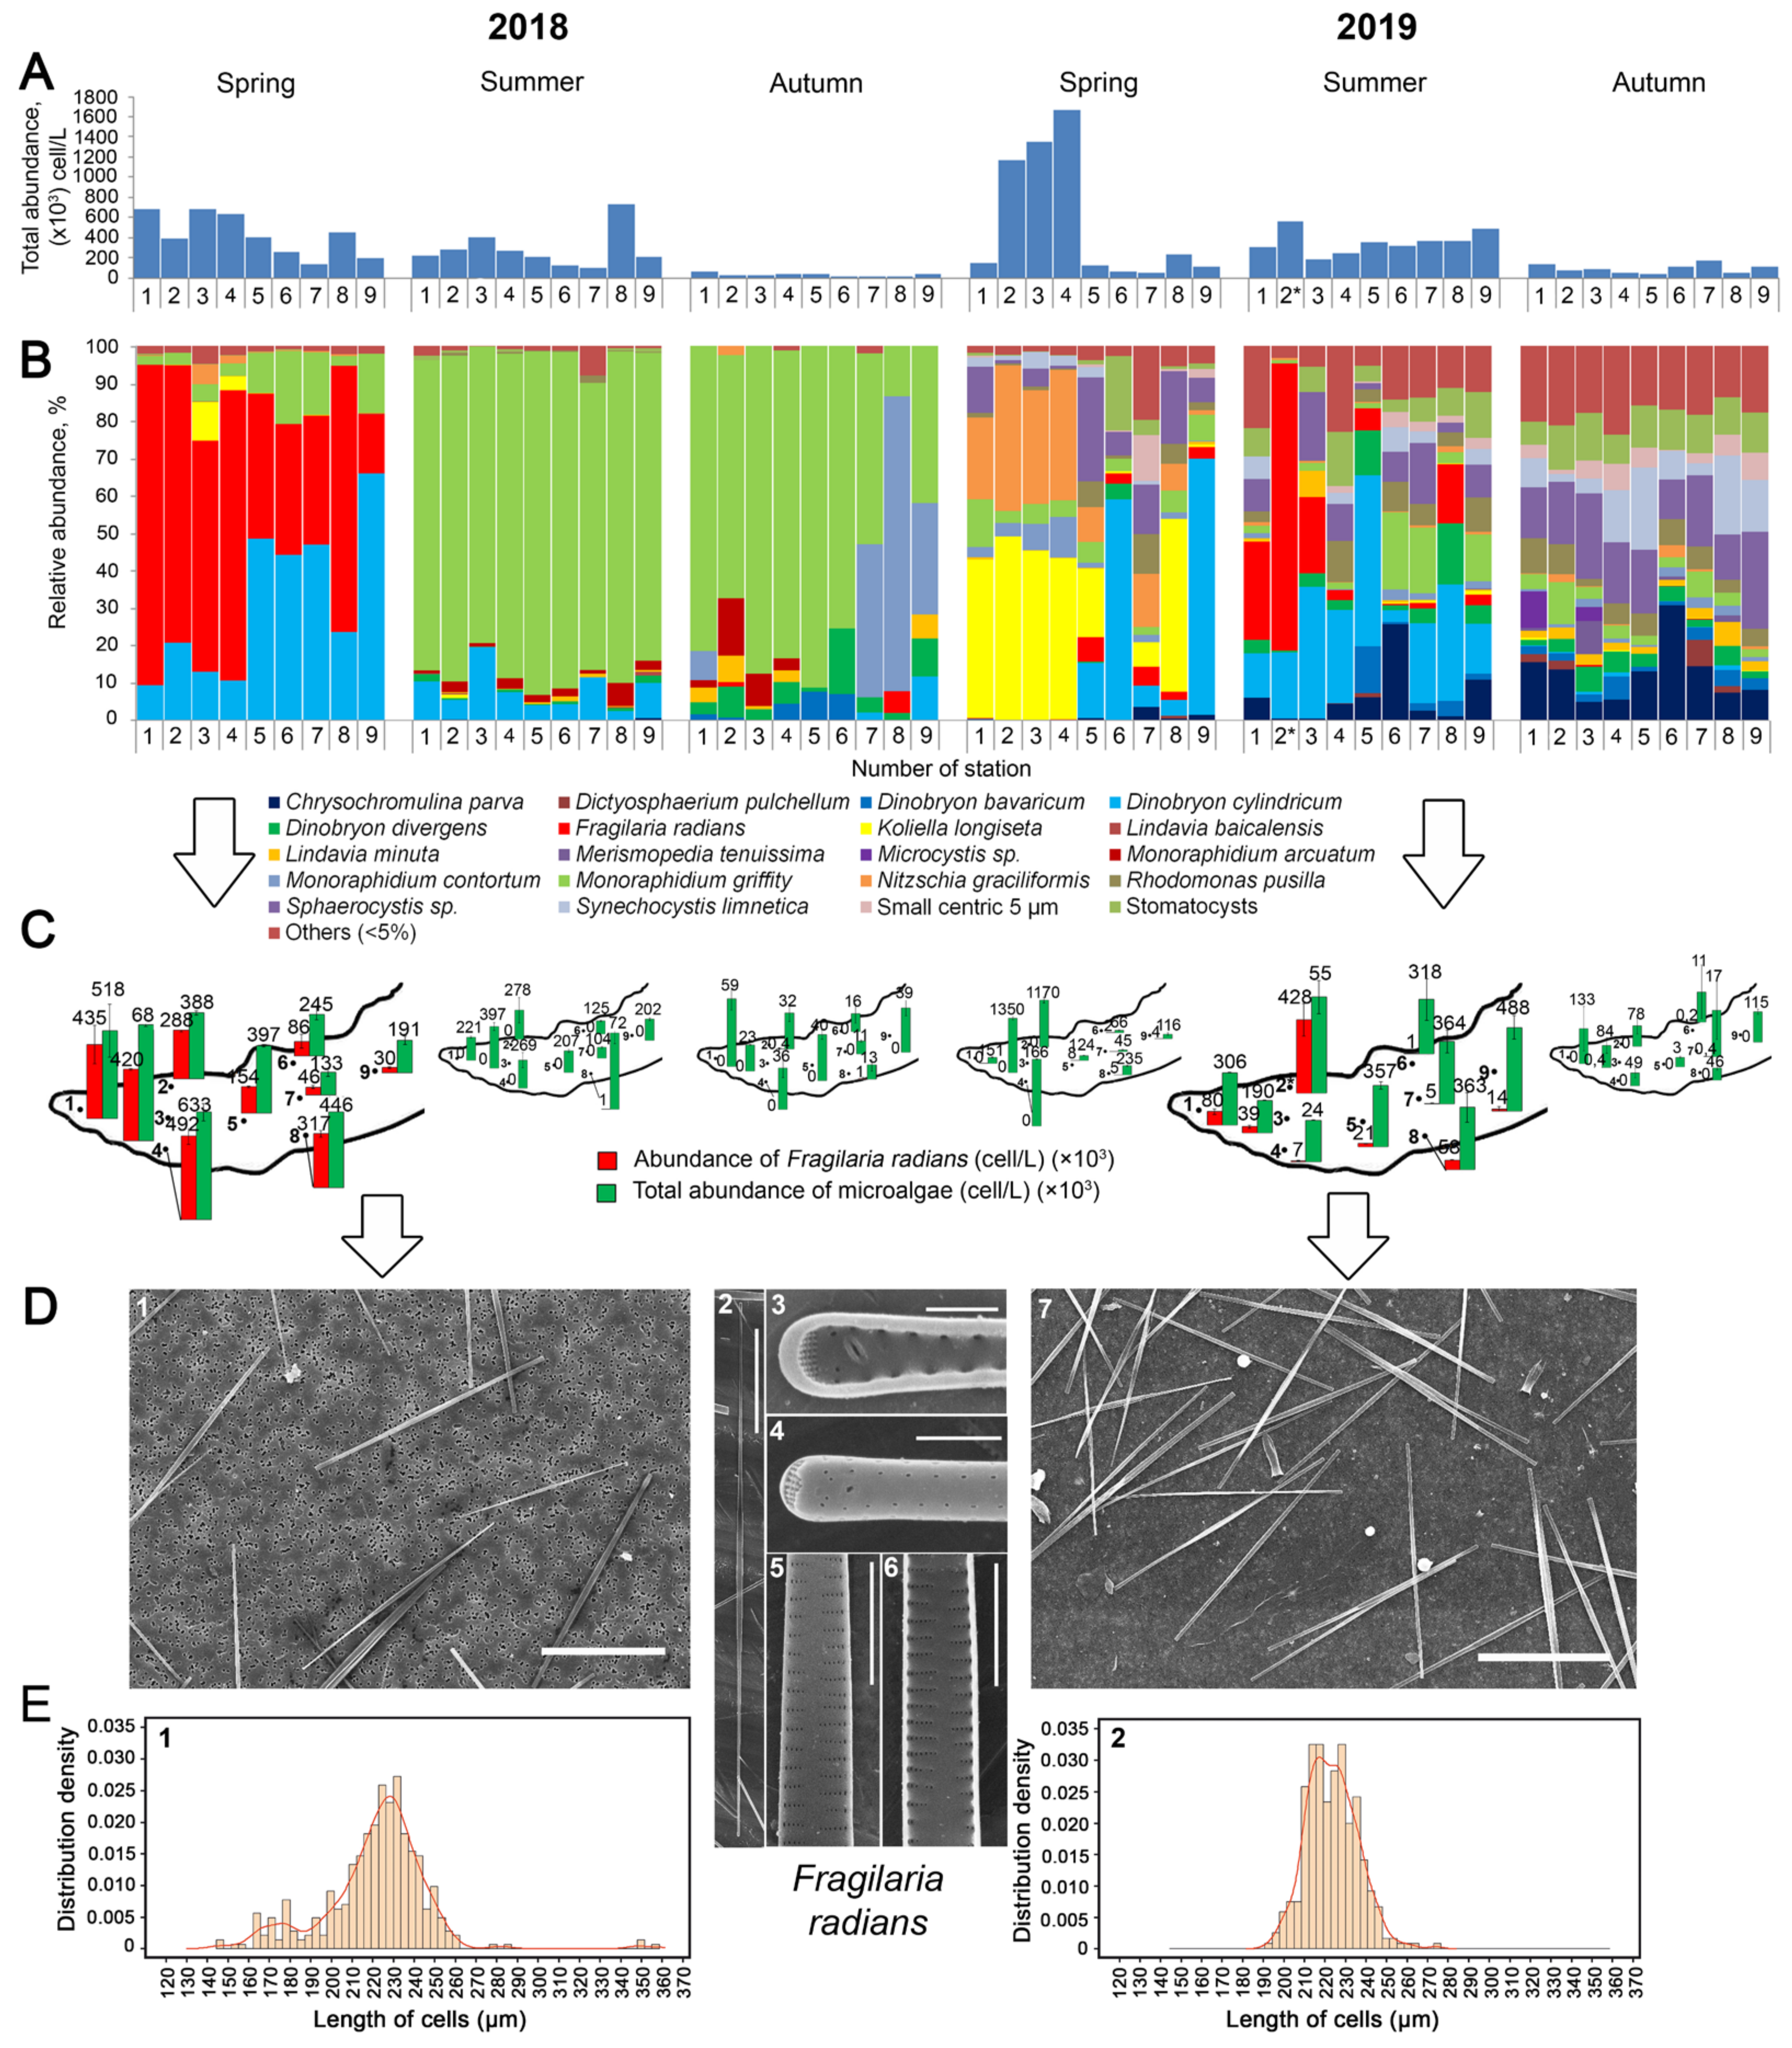
2.2. Enumeration of the Number of Microalgae and Cell Length Measurement

To identify and quantify phytoplankton species, integrated samples were concentrated by settling and siphonage methods [28]. Microalgae were counted using an Axiostar Plus light microscope (Zeiss, Jena, Germany). The abundance of microalgae was quantified using the method described in [29]. The mean values and confidence intervals (CIs) using the Student’s t-distribution were determined using Microsoft Excel 2010 and were based on repeated counts.
For scanning electron microscope (SEM) analysis, 20 mL of integrated samples were precipitated using syringe filtration to 0.8 μm polycarbonate filters and placed on SEM stubs. For a more detailed analysis of the structure of diatom cells, samples fixed with 70% ethanol were prepared as previously described [30]. The samples were analysed using an FEI Quanta 200 SEM (FEI Company, Hillsboro, OR, USA). Cell lengths of at least 300 cells were measured for each sample. The estimate of difference reliability between the samples by the cell length distribution was performed with the Kolmogorov–Smirnov test [31], implemented in the R programming language.

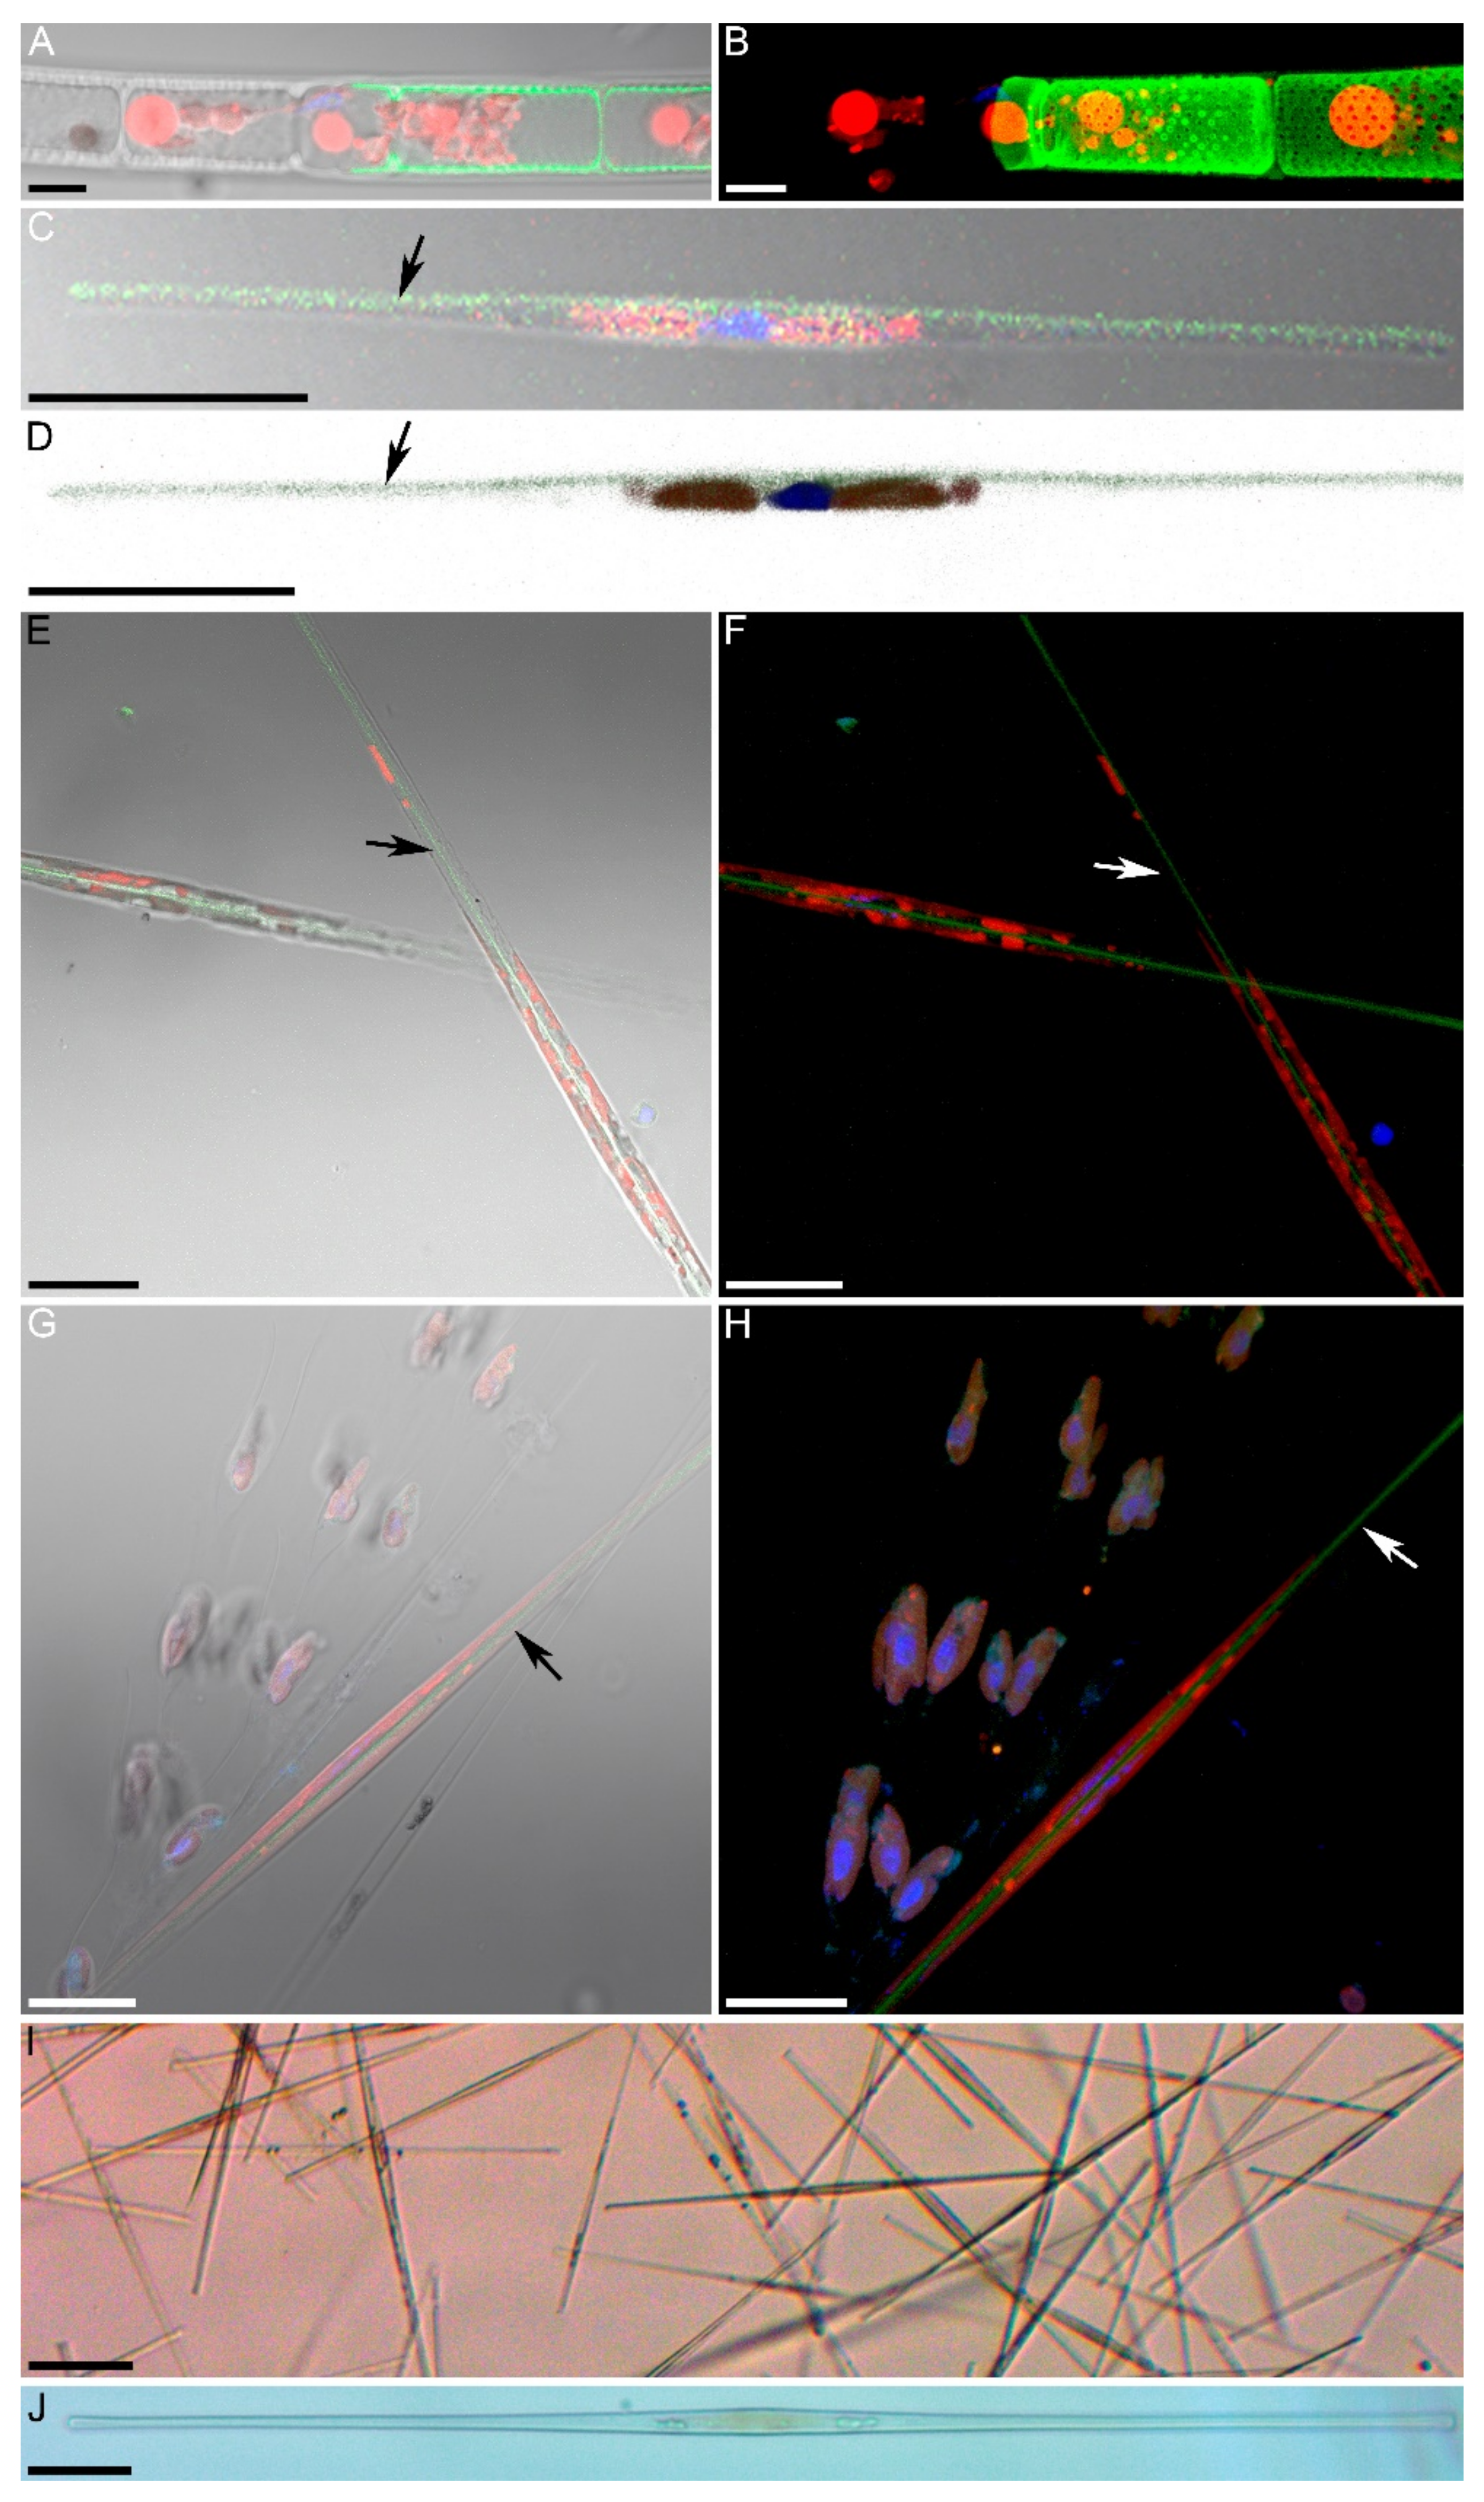
2.3. Determination of Silicon Assimilation Activity in Diatom Cells

Lysotracker Yellow HCK-123 dye (Thermo Fisher Scientific, Waltham, MA, USA) was applied as a marker of assimilation of silicon, which diatoms use for the synthesis of their siliceous frustules. This dye is incorporated into elements of the frustules (valves and girdle rims) [32]. Earlier, we tested this technique on laboratory cultures of the diatom Aulacoseira islandica (cells for cultivation were taken from Lake Baikal) to determine the rate at which algae cells accumulated silica from silicon dissolved in the water [33]. The dye was added to 0.5 μL of the Apstein net sample until reaching a concentration of 3 µM. Samples were fixed with 4% paraformaldehyde after 24 h of incubation at 6 °C and then analysed. An epifluorescence Axiovert 200 microscope (Zeiss, Jena, Germany) equipped with a blue 546 nm wavelength filter was used to enumerate the cells. The enumeration was performed among 100 random cells in triplicate. The calculation results were used to determine the total proportion of cells in the natural sample, which actively included silicon marked with Lysotracker Yellow HCK-123 fluorescent dye in the shell composition. The mean value for the cell proportion and the Student’s t-distribution confidence intervals (CIs) for the mean were determined using Microsoft Excel 2010 with repeated counts.
Confocal microscope analysis was used for more accurate visualisation of the staining results on a small number of analysed cells. Before the confocal microscope analysis, cells were rinsed with phosphate buffer (0, 1M, pH 7.2), their nuclei were stained with DAPI (10 μg/mL) (Thermo Fisher Scientific, Waltham, MA, USA) for 10 min, and the cells were then rinsed again in phosphate buffer and covered with Prolong Gold (Sigma-Aldrich, St. Louis, MI, USA) (samples of 2018) or Mowiol (Sigma-Aldrich, St. Louis, MI, USA) (samples of 2019). The slides were studied on an LSM 710 laser scanning microscope (Zeiss, Jena, Germany) equipped with a Plan-Apochromat 63x/1.40 Oil DIC M27 immersion lens (Zeiss, Jena, Germany). The Lysotracker Yellow H-123 fluorescence was induced with a 488 nm laser, and the emission was recorded in the range of 496–647 nm. The DAPI fluorescence was induced with a 405 nm laser, and the emission was recorded in the range of 410–492 nm. The chloroplast fluorescence was induced with a 561 nm laser, and the emission was recorded in the range of 650–723 nm.
To compare the intensity of cell multiplication, samples were obtained from the water column under the ice using an Apstein net near the village of Bolshiye Koty (Station 10, 1 km from the coast) in March 2019.

2.4. Analysis of Environmental Parameters

The water temperature was measured at the stations using a high-precision SBE-25 probe (Sea-Bird Electronics, Bellevue, WA, USA) starting from the surface to the bottom with a frequency of two measurements per second (or two measurements per metre). The accuracy of this temperature sensor is 0.002 °C.
Nitrate was determined by a spectrophotometric method using sulfosalicylic acid [34]. A method based on the measurement of the intensity of yellow silicomolybdic heteropolyacid colouring was used to detect silicic acid [35]. A spectrophotometric method based on the formation of phosphomolybdic heteropolyacid was used to measure phosphate concentrations [36]. Confidence intervals (CIs) for the mean values of the dissolved nutrient concentrations were estimated using the Student’s t-distribution. The significance of differences between the mean values was assessed using the Wilcoxon–Mann–Whitney test.
Water transparency was determined during daylight hours using a Secchi disk.

2.5. The Bathymetry Map of the South Baikal Slope

The bathymetry map of the South Baikal slope was built using data obtained by the multibeam echosounders ELACSeaBeam 1050 (in 2009) and Kongsberg EM 710S (in 2015–2017). These data allowed the building of a slope relief model with a 30 × 30 m resolution up to a depth of ~1400 m [37]. Bathymetric data obtained within INTAS project no. 99-1669 (http://www.lin.irk.ru/insta/index.html (accessed on 29 April 2021)), and topographic data from Airbus WorldDEM (https://www.intelligence-airbusds.com/en/8703-worlddem (accessed on 29 April 2021)) were used to draw the littoral and coastal land. The GIS processing method and technique for the construction of the digital relief model is described in [38].

3. Results and Discussion

3.1. Determination of the Species Composition of the Alga, Morphometric of Cells, and Analysis of the Absorption of Silicon by Cells

The phytoplankton monitoring in 2018–2019 revealed a seasonal succession of species (Figure 2A) corresponding to previously published data [6,7,8].
Because individual dominating diatom species are known to bloom every 2 to 7 years in interannual dynamics [8,9], the abundance of F. radians from South Baikal in the spring of 2018, and the absence of this species in the following spring of 2019 was not surprising. An additional study was required to explain the extremely high abundance of F. radians (Figure 2B,C) (428 × 103 cells/L) in the summer phytoplankton at Station 2*, situated 7 km from Marituy, in 2019 (Supplementary Table S1).
The cells of diatoms have several stages of development. When they divide, they reduce their size because the valves of daughter cells are formed inside the mother cells. The cells recover their size during sexual reproduction when small cells form gametes, which in turn form a zygote and an initial cell that are 2–3 times larger (Figure 55 in [39]). Measurements of the average size of F. radians cells (Figure 2D,E) of spring phytoplankton in 2018 revealed that they were at the sexual reproduction stage [40], as revealed by the presence both of small and large cells (Figure 2E1), unlike the summer 2019 sample (Figure 2E2), in which the cell length distribution was unimodal with an average value of 215–225 μm, indicating that gametal and initial cells were absent. The Kolmogorov–Smirnov test revealed a reliable difference among these samples by cell length distribution (p = 0.0014), thus demonstrating that the absence of gametal and initial cells in the summer sample from 2019 was not a selective statistical error.
Diatoms synthesise the details of the silica frustule at specific stages of the cell cycle: a valve is formed immediately after division and cytokinesis, and girdle bands are formed during interphase [39]. Staining with various fluorescent dyes (Rhodamine G, PDMPO, and Lysotracker Yellow HCK-123), which are incorporated into the deposited silica, allows the visualisation of the valve and girdle band formation. Previously, we applied this method of visualising the forming parts of the frustule to natural populations [32,41] and tested it in experiments with the laboratory culture Aulacoseira islandica [33]. We demonstrated that actively dividing phytoplankton cells are usually found in the surface layers of the water [41].
The use of Lysotracker HCK-123 in this study allowed the staining of both thick-walled (Figure 3A,B) and thin-walled (Figure 3C,D) forming valves in different species in natural populations. The cells of F. radians assimilated the Lysotracker Yellow HCK-123 fluorescent dye during their growth and division. We observed the most active incorporation of the dye into cells in under-ice samples; 24.3 ± 8.15% of the cells in the March 2019 sample formed new valves (Figure 3E,F). In May 2019, F. radians was almost absent from samples taken from Southern Baikal (Supplementary Table S1); however, the law percent of cells at some stations divided and incorporated the dye (Figure 3G,H). Microscopic analysis of the sample taken in July 2019 at Station 2* (Figure 1, red star), where an unusually high abundance of the species for this season was observed, revealed that the majority of F. radians cells contained chloroplasts, but they did not multiply (Figure 3I,J) and did not assimilate the Lysotracker Yellow HCK-123 fluorescent dye. In other words, not only did the cells not divide, but they also did not form girdle bands, that is, they did not mature or increase in volume. Thus, we may conclude that the spring species F. radians found in July 2019 at Station 2* was in the dormant stage.
We re-examined the species composition of the studied phytoplankton populations and noted that the composition and relative abundance of species in the samples taken in spring 2018 and summer 2019 at Stations 2 and 2* were identical (Figure 4A).

3.2. Lake Observations

The results of the hydrochemical analysis (Supplementary Table S2) demonstrate that in the spring of 2019, the average concentrations of dissolved nutrients in the southern basin of Lake Baikal were as follows: silicon (Si), 0.54 mg L−1 (95% CI: 0.52–0.55); nitrates (NO3), 0.4 mg L−1 (95% CI: 0.36–0.44); and phosphates (PO43−), 0.02 mg L−1 (95% CI: 0.017–0.023). In the summer (Supplementary Table S2), the concentrations of dissolved biogenic elements in the southern basin of Lake Baikal were as follows: silicon (Si), 0.5 mg L−1 (95% CI: 0.42–0.55); nitrates (NO3), 0.16 mg L−1 (95% CI: 0.13–0.2); phosphates (PO43−), 0.01 mg L−1 (95% CI: 0.007–0.013). The Wilcoxon–Mann–Whitney test revealed that the mean concentrations of silicon in spring and summer did not differ significantly (p = 0.77), whereas the mean concentrations of nitrates and phosphates were significantly different (p = 0.0013 and p = 0.0025, respectively). This analysis allows us to conclude that the average concentration of silicon in the phatic layer of the pelagic zone of Southern Baikal did not change significantly, while the concentration of nitrates and phosphates decreased. Previous hydrochemical studies of Lake Baikal reported a negative correlation between the concentration of nutrients (silicon, nitrogen, and phosphorus) dissolved in water and the number of cells of diatom phytoplankton [42,43,44]. With an increase in the concentration of diatom cells in the water, the concentration of nutrients decreases because they are consumed for the construction of organic matter via photosynthesis. In our case, we only observed a drop in the concentration of nitrates and phosphates. These nutrients were absorbed by other phytoplankton species that did not accumulate silicon during the spring and summer of 2019. Silicon-accumulating organisms (including diatoms) were less active because the concentration of the dissolved silicon in the water did not change over this period. The observed pattern in July 2019 suggests that the cells of the diatom F. radians in the area 7 km from the Marituy (Station 2*) did not absorb nutrients from the water (i.e., they did not absorb dissolved silicon), indicating that it was in the dormant stage. The hydrochemical parameters of the water confirm the conclusions regarding the absence of algal cell metabolic activity obtained by microscopy with the fluorescent dye Lysotracker Yellow HCK-123.
The results of water analysis on the Secchi disk (Supplementary Table S3) revealed low transparency (5.5–7.5 m) for July 2019 in the entire southern basin of Lake Baikal. This figure was lower than that observed in the spring of 2018 (10–16 m) when intense flowering of F. radians was observed. This may indirectly indicate that the transparency of water in July 2019 was falling not only because of the high concentration of diatom cells but also because of the presence of other suspended solids. The suspended matter could have been lifted from the bottom of the lake by currents.
The results of water temperature distribution at the transect of Marituy and Solzan (Figure 1) during sampling in the summers of 2018 and 2019 indicated that the surface water temperature varied between 10 and 15–17 °C up to a depth of 8 m (Figure 4B). At nearly all the stations in Southern Baikal, the surface water temperature averaged approximately 16 °C (and varied from 14 to 18 °C), whereas at Station 2*, it decreased to 7 °C. According to the analysis of temperature profiles, there were upwelling events [14] in the summers of 2018 and 2019 (Figure 4B). However, in the summer of 2018, cold water was only present up to a depth of 40 m below the surface (Figure 4B, left), whereas in the summer of 2019, it penetrated the warm surface water layer, as revealed by the dome configuration of temperature isolines at the water surface (Figure 4B, right).
Such a temperature profile is observed in Baikal in upwelling zones because of the formation of a circulation cell (vertical flow caused by wind) [14,15]. The rotation of water masses leads to decreasing pressure inside this vertical structure and can draw matter from the water column on its way up to the water’s surface, similar to a vortex. We proposed that the diatoms, which had already finished their annual life cycle and sunk from the photic zone, returned to the photic zone via rotating water masses [15].
Our results demonstrated that the species Fragilaria radians was absent from the phytoplankton in the spring of 2019 (Figure 2B,C), the composition and the relative abundance of the species in the summer of 2019 and spring of 2018 at Stations 2 and 2* were nearly identical (Figure 4A), and water mixing and upwelling from a depth of 100 m reached 20 m (Figure 4B); therefore, we propose that the source of the diatoms in summer 2019 was the cells that sank to the lake slope after the termination of their bloom in the spring of 2018 (Figure 4C). Figure 4C demonstrates that the slope is steep, but it is crossed by almost horizontal shelves. Any movement of water masses can rise, carrying with it deposited material. We infer that in our case, material that was residing at the slope in the mixing zone for over a year—from spring 2018 until summer 2019—was carried over into the photic zone.
The formation of circulation cells and rotation of water masses could be a result of relaxation after coastal upwelling events when there is an offshore wind. The upwelling zone in South Baikal, with an average width 5–13 km from shore, can be up to 60–100 km long [14]. The general character of the long-shore transport of water masses corresponds to the cyclonic circulation [23] (Figure 1). The intensification zone (maximum velocity) of horizontal long-shore currents is located 3–7 km from the shore [45]. Very similar upwelling events were demonstrated for Lake Tahoe (USA), where the hydrodynamic response of the lake to strong wind events was described in detail, using current, temperature, and water quality measurements. Persistent winds cause upwelling at the lee shore, with upward excursions of deep water exceeding 70 m for the strongest event [20].
A high abundance of the spring species F. radians in the summer cannot be explained by a shift of blooming, as was proposed for A. baicalensis [3], because this species appeared and matured under the ice, whereas the event that led to the emergence of a high abundance of the species occurred 2.5 months after the ice melted. In addition, the observed phenomenon cannot be explained as a consequence of fires (i.e., when smoke from a forest fire causes a large increase in lake primary production [4]) because it occurred locally and not throughout South Baikal.

4. Conclusions

In this study, we determined the species composition and the abundance of microalgae at 10 stations in South Baikal in different seasons (spring, summer, and autumn) in 2018 and 2019. We measured the cell sizes of F. radians that characterised a stage of population development and determined the silica assimilation by the diatom cells (i.e., their ability to divide in spring and summer) using Lysotracker Yellow HCK-123 dye and fluorescence microscopy. We also determined and compared temperature profiles from the shore to the station up to a depth of 500 m in the summers of 2018 and 2019. In addition, we estimated the concentrations of dissolved biogenic elements necessary for the growth of the alga cells. Our results revealed that the cells of the species, despite their high abundance in the summer of 2019, did not multiply. We propose that this high abundance of cells in the photic zone at the monitoring station in 2019 was due to an upwelling event that lifted cells from 2018 from underwater slopes.
Our data agree with a previously demonstrated relationship between upwelling and the increasing concentration and changing composition of microalgae, including the appearance of toxic species in the photic zone [46,47,48]. In this study, the appearance of F. radians at high concentrations in the photic zone due to summer upwelling did not cause the growth of this spring species. This could indicate that the high abundance of cells is not always a ‘bloom’ or active growth. By not only counting the cells of diatoms but also determining their life stages and cell cycle, as well as determining their physiological state, it is possible to obtain new explanations for unusual phenomena in aquatic ecosystems. We hope that the methodological approaches we applied in our study will be useful for explaining atypical phenomena in other large lakes.

Supplementary Materials

The following are available online at https://0-www-mdpi-com.brum.beds.ac.uk/article/10.3390/d13100504/s1, Table S1: Sampling stations and concentration of phytoplankton cells in the photic zone (1–25 m) of South Baikal in 2018–2019. Table S2: Concentration of nutrients in the phatic water layer of Lake Baikal during the 2019 season. Table S3: Characteristics of water transparency in the lake. Baikal.

Author Contributions

Conceptualisation, Y.Z.; methodology, M.G.; data preparation, Y.Z., Y.B. (Yurij Bukin), E.B., V.B., O.K. (Oxana Kamshilo), L.T., A.F., M.S. and O.K. (Oleg Khlystov); data analysis, Y.Z., Y.B. (Yekaterina Bedoshvili) and M.B.; writing—original draft preparation, M.G., Y.B. (Yurij Bukin) and V.B.; writing—the final version of manuscript, M.G.; editing of the final version of manuscript, Y.B. (Yurij Bukin), V.B., Y.Z., Y.B. (Yekaterina Bedoshvili) and M.B. All authors have read and agreed to the published version of the manuscript.

Funding

This work was supported by Ministry of Science and Higher Education of Russian Federation under projects: No. 0279-2021-0004 (temperature measurements), 0279-2021-0008 (sampling and microscopy), 0279-2021-0009 (staining experiments and cells measurement), and 0279-2021-0014 (hydrochemical analysis).

Institutional Review Board Statement

Not applicable.

Data Availability Statement

The data presented in this study (Supplementary Materials) are openly available in FigShare repository at the https://0-doi-org.brum.beds.ac.uk/10.6084/m9.figshare.16802251 (accessed on 29 April 2021).

Acknowledgments

The present study was conducted at the Center “Electron Microscopy” of the joint usage facilities “Ultramicroanalys” of the Limnological Institute. The authors are thankful to I.S. Mikhailov and K.Yu. Arsentyev for their assistance in sampling.

Conflicts of Interest

The authors declare no conflict of interest.

References

  1. Furnas, M.J. In situ growth rates of marine phytoplankton: Approaches to measurement, community and species growth rates. J. Plan. Res. 1990, 12, 1117–1151. [Google Scholar] [CrossRef]
  2. Winder, M.; Cloern, J.E. The annual cycles of phytoplankton biomass. Philos. Trans. R. Soc. 2010, 365, 3215–3226. [Google Scholar] [CrossRef] [PubMed]
  3. Katz, S.L.; Izmest’eva, L.R.; Hampton, S.E.; Ozersky, T.; Shchapov, K.; Moore, M.V.; Shimaraeva, S.V.; Silow, E.A. The “Melosira years” of Lake Baikal: Winter environmental conditions at ice onset predict under-ice algal blooms in spring. Limnol. Oceanogr. 2015, 60, 1950–1964. [Google Scholar] [CrossRef]
  4. Scordo, F.; Chandra, S.; Suenaga, E.; Kelson, S.J.; Culpepper, J.; Scaf, L.; Tromboni, F.; Caldwell, T.J.; Seitz, C.; Fiorenza, J.E.; et al. Smoke from regional wildfires alters lake ecology. Sci. Rep. 2021, 11, 10922. [Google Scholar] [CrossRef] [PubMed]
  5. Izmest’eva, L.R.; Moore, M.V.; Hampton, S.E.; Silow, E.A. Seasonal dynamics of common phytoplankton in Lake Baikal. Proc. Russ. Acad. Sci. Cent. 2006, 8, 191–196. [Google Scholar]
  6. Pomazkina, G.V.; Belykh, O.I.; Domysheva, V.M.; Sakirko, M.V.; Gnatovsky, R.Y. Structure and dynamics of phytoplankton of Southern Baikal (Russia). Int. J. Algae 2010, 12, 64–79. [Google Scholar] [CrossRef]
  7. Popovskaya, G.I.; Usol’tseva, M.V.; Domysheva, V.M.; Sakirko, M.V.; Blinov, V.V.; Khodzher, T.V. The spring phytoplankton in the pelagic zone of Lake Baikal during 2007–2011. Geogr. Nat. Resour. 2015, 36, 253–262. [Google Scholar] [CrossRef]
  8. Popovskaya, G.I.; Genkal, S.I.; Likhoshway, Y.V. Diatoms of the Plankton of Lake Baikal. Atlas and Key, 2nd ed.; Trifonova, I.S., Grawford, R.M., Eds.; Nauka: Novosibirsk, Russia, 2016. [Google Scholar]
  9. Grachev, M.A. About the Current State of the Ecological System of Lake Baikal; Publishing House of SB RAS: Novosibirsk, Russia, 2002. (In Russian) [Google Scholar]
  10. Popovskaya, G.I. Ecological monitoring of phytoplankton in Lake Baikal. Aquat. Ecosyst. Health 2000, 3, 215–225. [Google Scholar] [CrossRef]
  11. Popovskaya, G.I.; Belykh, O.I. Stages of the study of autotrophic picoplankton of Lake Baikal. Hydrobiol. J. 2003, 39, 12–24. [Google Scholar] [CrossRef]
  12. Belykh, O.I.; Pomazkina, G.V.; Tikhonova, I.V.; Tomberg, I.V. Characteristics of Lake Baikal summer phytoplankton and autotrophic picoplankton. Int. J. Algae 2007, 9, 247–263. [Google Scholar] [CrossRef]
  13. Sherstyankin, P.P.; Kuimova, L.N.; Minenko, R.E. Dynamic conditions of frontogenesis and vortex genesis in Lake Baikal. Dokl. Akad. Nauk 1995, 345, 251–255. (In Russian) [Google Scholar]
  14. Shimaraev, M.N.; Troitskaya, E.S.; Blinov, V.V.; Ivanov, V.G.; Gnatovsky, R.Y. Upwellings in Lake Baikal. Dokl. Earth Sci. 2012, 442, 272–276. [Google Scholar] [CrossRef]
  15. Troitskaya, E.; Blinov, V.; Ivanov, V.; Zhdanov, A.; Gnatovsky, R.; Sutyrina, E.; Shimaraev, M. Cyclonic circulation and upwelling in Lake Baikal. Aquat. Sci. 2015, 77, 171–182. [Google Scholar] [CrossRef] [Green Version]
  16. Boyarinov, M.P.; Petrov, P.M. Thermal Regime Forming Processes of Deep Fresh Water Reservoirs; Nauka: Moscow, Russia, 1991. (In Russian) [Google Scholar]
  17. Shimaraev, M.N.; Verbolov, V.I.; Granin, N.G.; Sherstyankin, P.P. Physical Limnology of Lake Baikal: A Review; Shimaraev, M.N., Oruda, S., Eds.; Baikal International Center for Ecological Research: Irkutsk, Russia, 1994; p. 81. (In Russian) [Google Scholar]
  18. Shimaraev, M.N.; Gnatovskii, R.Y.; Blinov, V.V.; Ivanov, V.G. Renewal of deep waters of Lake Baikal revisited. Dokl. Earth Sci. 2011, 438, 652–655. [Google Scholar] [CrossRef]
  19. Piccolroaz, S.; Toffolon, M. The fate of Lake Baikal: How climate change may alter deep ventilation in the largest lake on Earth. Clim. Change 2018, 150, 181–194. [Google Scholar] [CrossRef] [Green Version]
  20. Roberts, D.C.; Egan, G.C.; Forrest, A.L.; Largier, J.L.; Bombardelli, F.A.; Laval, B.E.; Monismith, S.G.; Schladow, G. The setup and relaxation of spring upwelling in a deep, rotationally influenced lake. Limnol. Oceanogr. 2021, 66, 1168–1189. [Google Scholar] [CrossRef]
  21. Müller, B.; Maerki, M.; Schmid, M.; Vologina, E.G.; Wehrli, B.; Wüest, A.; Sturm, M. Internal carbon and nutrient cycling in Lake Baikal: Sedimentation, upwelling, and early diagenesis. Glob. Planet. Change 2005, 46, 101–124. [Google Scholar] [CrossRef]
  22. Moore, M.V.; Hampton, S.E.; Izmest’Eva, L.R.; Silow, E.A.; Peshkova, E.V.; Pavlov, B.K. Climate change and the world’s “sacred sea”—Lake Baikal, Siberia. BioScience 2009, 59, 405–417. [Google Scholar] [CrossRef] [Green Version]
  23. Verbolov, V.I. Currents and water exchange in Lake Baikal. Russ. Water Res. 1996, 23, 381–391. [Google Scholar]
  24. Utermöl, H. Zur Vervollkommnung der quatitativen Phytoplankton-Methodik: Mit 1 Tabelle und 15 abbildungen im Text und auf 1 Tafel. Int. Ver. Theor. Angew. Limnol. Mitt. 1958, 9, 1–38. [Google Scholar]
  25. Guseva, K.A. The methodology of phytoplankton accounting. Tr. Inst. Biol. Vodokhranilisch 1959, 2, 44–51. [Google Scholar]
  26. Sadchikov, A.P. Methods for Studying Freshwater Phytoplankton; Publishing House “University and School”: Moscow, Russia, 2003. (In Russian) [Google Scholar]
  27. Wiebe, P.H.; Benfield, M.C. From the Hensen net toward four-dimensional biological oceanography. Prog. Oceanogr. 2003, 56, 7–136. [Google Scholar] [CrossRef]
  28. Abakumov, V.A. Manual for Biological Monitoring of Freshwater Ecosystems; Gidrometeoizdat: St. Petersburg, Russia, 1992. (In Russian) [Google Scholar]
  29. Kuzmin, G.V. Phytoplankton. Species composition and abundance. In Techniques for Studying Biogeocenoses of Inland Water Bodies; Nauka: Moscow, Russia, 1975. (In Russian) [Google Scholar]
  30. Bedoshvili, Y.D.; Volokitina, N.A.; Marchenkov, A.M. Valve morphogenesis and silicon dynamics in the synchronized culture of Ulnaria danica. Limnol. Freshw. Biol. 2019, 5, 297–301. [Google Scholar] [CrossRef] [Green Version]
  31. Marsaglia, G.; Tsang, W.W.; Wang, J. Evaluating Kolmogorov’s distribution. J. Statist. Soft. 2003, 8, 1–4. [Google Scholar] [CrossRef]
  32. Descles, J.; Vartanian, M.; Harrak, A.E.; Quinet, M.; Bremond, N.; Sapriel, G.; Bibette, J.; Lopez, P.J. New tools for labeling silica in living diatoms. New Phytol. 2008, 177, 822–829. [Google Scholar] [CrossRef] [PubMed]
  33. Bedoshvili, Y.; Gneusheva, K.; Popova, M.; Morozov, A.; Likhoshway, Y. Anomalies in the valve morphogenesis of the centric diatom alga Aulacoseira islandica caused by microtubule inhibitors. Biol. Open 2018, 7, bio035519. [Google Scholar] [CrossRef] [Green Version]
  34. ISO 7890-3:1988 Water quality—Determination of nitrate—Part 3: Spectrometric method using sulfosalicylic acid. 1988. Available online: https://www.iso.org/obp/ui/#iso:std:iso:7890:-3:ed-1:v1:en (accessed on 29 April 2021).
  35. Wetzel, R.G.; Likens, G.E. Limnological Analyses; Springer: Berlin/Heidelberg, Germany, 2013. [Google Scholar] [CrossRef]
  36. ISO 6878:2004 Water Quality—Determination of Phosphorus—Ammonium Molybdate Spectrometric Method. 2004. Available online: https://www.iso.org/obp/ui/#iso:std:iso:6878:ed-2:v1:en (accessed on 29 April 2021).
  37. Khlystov, O.M.; Kononov, E.E.; Minami, H.; Khabuev, A.V.; Gubin, N.A.; Chenskii, A.G. New evidence on the relief of the southern underwater slope in the South Baikal Basin. Geogr. Nat. Resour. 2018, 39, 33–38. [Google Scholar] [CrossRef]
  38. Kononov, E.E.; Khlystov, O.M.; Kazakov, A.V.; Khabuev, A.V.; De Batist, M.; Naudts, L.; Minami, H. The lake floor morphology of the Southern Baikal rift basin as a result of Holocene and Late Pleistocene seismogenic and gravitational processes. Quat. Int. 2019, 524, 115–121. [Google Scholar] [CrossRef]
  39. Round, F.E.; Crawford, R.M.; Mann, D.G. Diatoms: Biology and Morphology of the Genera; Cambridge University Press: Cambridge, UK, 1990. [Google Scholar]
  40. Podunay, Y.; Davidovich, N.A.; Kulikovskiy, S.; Gusev, E.S. Features of sexual reproduction and mating system of Ulnaria acus (Bacillariophyta). J. Sib. Fed. Univ.-Biol. 2018, 11, 75–87. (In Russian) [Google Scholar] [CrossRef] [Green Version]
  41. Saxton, M.A.; D’souza, N.A.; Bourbonniere, R.A.; McKay, R.M.L.; Wilhelm, S.W. Seasonal Si:C ratios in Lake Erie diatoms—Evidence of an active winter diatom community. J. Great Lakes Res. 2012, 38, 206–211. [Google Scholar] [CrossRef]
  42. Domysheva, V.M.; Pestunov, D.A.; Sakirko, M.V.; Shamrin, A.M.; Panchenko, M.V. Carbon dioxide, oxygen, and biogenic elements in subglacial water in the littoral zone of southern Baikal (2004–2016). Atmos. Ocean. Opt. 2017, 30, 277–283. [Google Scholar] [CrossRef]
  43. Khodzher, T.V.; Domysheva, V.M.; Sorokovikova, L.M.; Sakirko, M.V.; Tomberg, I.V. Current chemical composition of Lake Baikal water. Inland Waters 2017, 7, 250–258. [Google Scholar] [CrossRef]
  44. Mikhailov, I.S.; Zakharova, Y.R.; Bukin, Y.S.; Galachyants, Y.P.; Petrova, D.P.; Sakirko, M.V.; Likhoshway, Y.V. Co-occurrence networks among bacteria and microbial eukaryotes of Lake Baikal during a spring phytoplankton bloom. Microb. Ecol. 2019, 77, 96–109. [Google Scholar] [CrossRef]
  45. Zhdanov, A.A.; Granin, N.G.; Gnatovsky, R.Y.; Blinov, V.V. Horizontal macroturbulent exchange and dissipation rate of turbulent energy in the pelagic zone of Lake Baikal. Russ. Geogr. Nat. Res. 2009, 30, 30–34. [Google Scholar] [CrossRef]
  46. Tilstone, G.H.; Míguez, B.M.; Figueiras, F.G.; Fermín, E.G. Diatom dynamics in a coastal ecosystem affected by upwelling: Coupling between species succession, circulation and biogeochemical processes. Mar. Ecol. Prog. Ser. 2000, 205, 23–41. [Google Scholar] [CrossRef] [Green Version]
  47. Schnetzer, A.; Jones, B.H.; Schaffner, R.A.; Cetinic, I.; Fitzpatrick, E.; Miller, P.E.; Seubert, E.L.; Caron, D.A. Coastal upwelling linked to toxic Pseudo-nitzschia australis blooms in Los Angeles coastal waters, 2005–2007. J. Plankton Res. 2013, 35, 1080–1092. [Google Scholar] [CrossRef] [Green Version]
  48. Anglès, S.; Jordi, A.; Henrichs, D.W.; Campbell, L. Influence of coastal upwelling and river discharge on the phytoplankton community composition in the northwestern Gulf of Mexico. Prog. Oceanogr. 2019, 173, 26–36. [Google Scholar] [CrossRef]
Figure 1. Map of the study area (South Baikal). Numbers: sampling stations (see Supplementary Table S1); the star marks the station at which the high diatom abundance was observed in summer 2019. The arrows show a scheme of the average currents in the 15–50 m layer during the ice-free period [23]. Maps were taken from the «Google Earth Pro» software (https://www.google.com/intl/ru/earth/versions/#earth-pro, accessed on 29 April 2021). «Inkscape» (https://inkscape.org/, accessed on 29 April 2021) free graphics editor was used to edit images and apply additional marks to maps.
Diversity 13 00504 g001
Figure 2. Fragilaria radians in phytoplankton of Southern Baikal in 2018–2019. (A) Total abundance of species in seasonal dynamics; (B) relative abundance of different species of microalgae in seasonal dynamics; (C) F. radians (red) compared with the total abundance of microalgae (green); (D) scanning electron microscopy of F. radians in May 2018 (1), July 2019 (7), and fine valve structure of the species (2: a valve; 3: an apex, inside view; 4: an apex, outside view; 5: striae, outside view; 6: striae, inside view); (E) cell length distribution in May 2018 (1) and July 2019 (2). (A–C): for station numbers, see Figure 1 and Supplementary Table S1. Scale bars: D1—100 μm; D2—50 μm; D3 and D4—2 μm; D5 and D6—5 μm; D7—100 μm.
Diversity 13 00504 g002
Figure 3. Visualisation of silica deposition in diatom cells by Lysotracker Yellow HCK-123 staining. (A,B) Formation of thick valves of Aulacoseira baicalensis, spring (May) 2018, Station 5; (C,D) formation of thin valves of Nitzschia graciliformis, May 2019, Station 3; (EI) Fragilaria radians; (G,H) left: Dinobryon cylindricum; (E,F) under-ice sample from Station 10, March 2019; (G,H): May 2019, Station 5; (I) light microscopy; (AH) laser confocal scanning microscopy, optical section, and 3D reconstruction, respectively. Green—fluorescence Lysotracker incorporated into forming valves (arrows); red—autofluorescence of chloroplasts; blue—DAPI-stained DNA. Scale bars: (A,B,EH,J)—20 μm; (C,D)—10 μm; (I)—50 μm.
Diversity 13 00504 g003
Figure 4. Was the high abundance of spring diatoms in the photic zone of Lake Baikal in July 2019 due to an upwelling event? (A) Species composition and relative abundance of microalgae at Stations 2 and 2* located near Marituy, where a high abundance of Fragilaria radians was observed in July 2019; (B) Baikal water temperature profiles at the transect of Marituy and Solzan at the moment of phytoplankton sampling in late July to early August in 2018 and 2019 (arrow—7 km from Marituy, Station 2*); (C) digital relief model of the South Baikal slope (red line shows the A-A′ bathymetric profile given in the sidebar).
Diversity 13 00504 g004
Publisher’s Note: MDPI stays neutral with regard to jurisdictional claims in published maps and institutional affiliations.

