Article

Five Independent Lineages Revealed by Integrative Taxonomy in the Dendropsophus nanusDendropsophus walfordi Species Complex

by
Karin Regina Seger
1,*,
Bernardo Franco da Veiga Teixeira
2,
Fabiane Santana Annibale
3,
Denise de Cerqueira Rossa-Feres
3,
Albertina Pimentel Lima
4,
Gilda Vasconcellos Andrade
5,
Ariovaldo Antonio Giaretta
2 and
Luciana Bolsoni Lourenço
1
1
Departamento de Biologia Estrutural e Funcional, Instituto de Biologia, Universidade Estadual de Campinas (UNICAMP), Campinas 13086-863, SP, Brazil
2
Laboratório de Taxonomia, Sistemática e Ecologia Comportamental de Anuros Neotropicais, Faculdade de Ciências Integradas do Pontal, Universidade Federal de Uberlândia (UFU), Rua 20 no 1.600, Bairro Tupã, Ituiutaba 38304-402, MG, Brazil
3
Departamento de Ciências Biológicas, Instituto de Biociências, Letras e Ciências Exatas, Universidade Estadual Paulista (UNESP), São José do Rio Preto 15054-000, SP, Brazil
4
Coordenadoria de Pesquisas em Ecologia, Instituto Nacional de Pesquisas da Amazônia (INPA), Manaus 69011-970, AM, Brazil
5
Departamento de Biologia, Centro de Ciências Biológicas e da Saúde, Universidade Federal do Maranhão (UFMA), Campus do Bacanga, São Luís 65080-040, MA, Brazil
*
Author to whom correspondence should be addressed.
Submission received: 2 September 2021 / Revised: 25 September 2021 / Accepted: 12 October 2021 / Published: 23 October 2021
(This article belongs to the Special Issue Biodiversity and Conservation of Tree Frogs)

Abstract

:
One of the many taxonomic challenges found in the Dendropsophus microcephalus species group is the Dendropsophus walfordi distinction from D. nanus. Recent phylogenetic inferences have indicated the paraphyly of these species, although they were not designed to assess this issue. To contribute to the delimitation of these species, we analyzed the 12S, 16S and COI mitochondrial genes, the morphological traits, and the advertisement calls of specimens from northern Amazonia to Argentina, including the type localities of D. nanus and D. walfordi. Paraphyly of D. nanus with respect to D. walfordi was inferred by maximum-parsimony and Bayesian analyses, and five major clades exhibiting nonoverlapping geographic distributions were recognized. The bPTP and ABGD analyses supported the existence of five independently evolving lineages in this complex. Acoustic and morphological data clearly distinguished the clade that included the topotypes of D. walfordi from the others, corroborating the validity of this species. To avoid the paraphyly of D. nanus with respect to D. walfordi, we recognize the clade distributed from central-southern Brazil to Argentina as D. nanus, the clade distributed in Amazonia as D. walfordi, and discuss the existence of unnamed cryptic species closely related to D. nanus and D. walfordi.

Graphical Abstract

1. Introduction

The Neotropics harbor a great diversity of frogs, and the recognition of valid species can be very challenging. Phylogenetic approaches are powerful tools for species delimitation [1,2], and DNA sequence analysis has allowed a significant improvement in this context, either by revealing previously undescribed species (e.g., [3,4,5,6]) or supporting synonymizations (e.g., [7]). Such DNA-based analyses, however, are accessory tools in taxonomic studies and should not be taken separately from other sources of data, including acoustic and morphological ones (for a review, see [8]).
The hylid frogs Dendropsophus nanus (Boulenger, 1889) [9] and D. walfordi (Bokermann, 1962) [10] show relevant taxonomic issues and are good candidates for comprehensive research that combines DNA-based analyses with morphological and acoustic studies. In previous studies, Jansen and colleagues [11] and Schulze and colleagues [12] suggested the presence of unnamed species related to D. nanus in Bolivia, and phylogenetic analyses based on DNA sequences have recovered D. nanus as paraphyletic with respect to D. walfordi [4,13]. Although the phylogenetic analysis conducted by Medeiros et al. [13] comprised specimens of D. nanus and D. walfordi from 55 localities, including the type locality of D. walfordi (i.e., Forte Príncipe da Beira, in the city of Costa Marques, state of Rondônia, Brazil [10]), a more comprehensive specimen sample including exemplars from the type locality of D. nanus (i.e., Colonia Resistencia, Chaco, Argentina [9]) is still necessary for proper evaluation of the genetic variation in this group. Furthermore, an integrative analysis of the phylogenetic inferences and morphological/acoustic data for these frogs is also lacking.
Morphological and acoustic studies of Dendropsophus nanus and D. walfordi are scarce and fragmentary. These species are morphologically very similar, which led Lutz [14] to consider D. walfordi a junior synonym of D. nanus. Langone and Basso [15], however, mentioned personal communication from Adão J. Cardoso about the advertisement call of D. walfordi specimens from Rondônia-Brazil, supporting D. walfordi as a valid species and suggested the revision of D. nanus and D. walfordi throughout their geographic distribution. The advertisement call of topotypes of D. nanus has been described [16], but the call of D. walfordi remains unreported. Although a single advertisement call was previously assigned to D. walfordi by De la Riva et al. [17], a reanalysis conducted by the authors [18] proved that this call belonged to Dendropsophus tritaeniatus.
In this study, we revisited the taxonomic questions concerning Dendropsophus nanus and D. walfordi using an integrative approach that combines analyses of acoustic and morphological traits with a genetic/phylogenetic analysis based on improved molecular character sampling and expanded sampling areas.

2. Materials and Methods

We used mitochondrial DNA sequences to infer the phylogenetic relationships and genetic diversity in the Dendropsophus nanusD. walfordi species complex and to run two tests of delimitation of independently evolving lineages. We analyzed the acoustic and morphological variation in this species complex in an attempt to identify putative traits that could differentiate any of the candidate species inferred from the DNA-based tests. Finally, we proposed some taxonomic decisions using an integrative taxonomy approach.

2.1. Taxon Sampling

Currently, Dendropsophus nanus is considered to be widely distributed in South America, occurring from northeastern Brazil, Surinam and French Guiana to extreme southern Brazil, Argentina, central Paraguay, extreme northwestern Uruguay and eastern Bolivia, whereas D. walfordi is considered to occur in the central and northern Amazon basins [18,19]. In our phylogenetic analysis, we included 56 specimens of the Dendropsophus nanusD. walfordi species complex, including type localities of D. nanus and D. walfordi. In addition, we included a specimen from Taperinha, Santarém, in the Brazilian state of Pará, which is the type locality of D. minimus (Ahl, 1933) [20]. To compose the outgroup, we included all the species of the D. microcephalus group for which nucleotide sequences were available and D. elegans as a representative species of the D. leucophyllatus group (which was inferred as the sister group of the D. microcephalus group by [21]) (Table S1). In the genetic distance analyses, we also included 51 DNA sequences assigned to D. nanus or D. walfordi consisting of only a short fragment of the 16S rRNA gene. These samplings included sequences of specimens from Bolivia, Argentina and French Guiana and were obtained from GenBank (for details, see Table S1).
In the acoustic analysis, we compared the advertisement calls of 160 specimens of the D. nanusD. walfordi complex from 33 localities. In the morphometric analysis, we compared 71 specimens of the D. nanusD. walfordi complex from 12 localities. For the analyses concerning body shape and color, a total of 456 specimens were included (for details, see Table S1).
Fieldwork was carried out between 2011 and 2017, and specimens were collected under a permit issued by the Chico Mendes Institute for Biodiversity Conservation/Biodiversity Authorization and Information System (ICMBio/SISBIO, permit number 50672). The specimens were anesthetized with lidocaine, which was applied to the skin (50 mg of 2% lidocaine per gram of body mass). Liver, muscle and intestine samples were extracted and preserved in 95% ethanol. The animals were deposited in the amphibian collection of the Museum of Zoology “Adão José Cardoso” at the Institute of Biology–University of Campinas (ZUEC). This protocol was approved by the Committee for Ethics in Animal Use of the University of Campinas (CEUA/UNICAMP, permit number 3453-1).

2.2. Molecular Data

2.2.1. DNA Extraction, Amplification and Sequencing

We used the same protocol employed by Medeiros et al. [13] to obtain genomic DNA from fragments of liver or muscle or from intestinal cell suspensions available in the cytogenetic and tissue collection housed at the Laboratory of Chromosome Studies (LabEsC) of the University of Campinas. PCR was performed in a 25 μL volume of reaction buffer containing 10 mM Tris-HCl, pH 9, 50 mM KCl, 1.5 mM MgCl2, 200 μM dNTPs, each primer at 0.4 mM, 1 unit of Taq DNA polymerase (Invitrogen) and 400 to 1000 ng of genomic DNA. The mitochondrial 12S and 16S rRNA genes and the intervening tRNA-val region were amplified by PCR using the primer pairs MVZ59(L) [22]/TitusI(H) [23] and 12L13(L) [24]/16Sbr(H) [25]. For amplification of a fragment of the mitochondrial gene cytochrome oxidase 1 (COI), we used the primers AnF1 and AnR1 [26].
The amplified products were purified using a DNA purification kit (Promega) or the enzyme ExoSAP-IT system (Affymetrix). Purified fragments were sequenced in both directions using the aforementioned primers. To sequence the H1 fragment (which includes fragments of the 12S, 16S and tRNA-val genes), we also used the primers MVZ 50 [22], Titus I, 16L2a, 16SH10 and 16Sar [25,27]. The Big Dye Terminator kit (Applied Biosystems) was used to perform sequencing reactions according to the manufacturer’s protocol. The nucleotide sequences were generated by the DNA Sequencing Service (SSDNA)-IQUSP or the Central Laboratory of High-Performance Technologies in Life Sciences (LaCTAD)–UNICAMP and edited using BioEdit v.7.0.1. [28].

2.2.2. Phylogenetic Inferences

The nucleotide sequences were aligned using Muscle [29]. The H1 fragment and COI sequences were concatenated in a matrix composed of 123 sequences and 3117 characters (Matrix 1).
Phylogenetic relationships were inferred according to the maximum-parsimony criterion using the software TNT v.1.1 [30] and through Bayesian analysis in the program MrBayes v.3.1.2 [31]. In the maximum-parsimony analyses, alignment gaps were treated as the fifth character state. The most parsimonious trees were obtained using the heuristic search method with the xmult command, which combines driven searches, ratchet, tree drifting and tree fusing, and also performs the exchange of branches using tree bisection and reconnection (TBR). The best length was hit 100 times, and branch supports were evaluated by bootstrap resampling test [32] based on 1000 pseudoreplicates using a traditional search in TNT.
For the Bayesian analysis of the H1 and COI partitions, the GTR + I + G and SYM + G evolutionary models were used, respectively, as estimated by MrModeltest v.2.3 [33]. Two simultaneous analyses were performed with four chains each (three heated and one cold). Ten million generations were run in each analysis, with one tree sampled every 100 generations. A consensus topology with the posterior probability for each node was produced after discarding 25% of the initial trees that were generated. The average standard deviation of split frequencies (ASDSF) value was lower than 0.01, and the potential scale reduction factor (PSRF) value was approximately 1.000. The stabilization of posterior probabilities was checked using Tracer v.1.6 [34] considering ESS (effective sample size) values above 200 as acceptable.
A matrix with H1 fragments was used to estimate the time of divergence of the major lineages in BEAST v.1.8.4 [35]. In this analysis, a mutation rate of 0.0028 mutations/site/million years [36] and four independent runs were used, with parameters and trees being sampled every 2500 generations. The convergence of the runs was evaluated in Tracer v.1.6 [34] considering ESS (effective sample size) values above 200 as acceptable. The results were summarized with TreeAnnotator v.1.8.3.

2.2.3. Analyses of Genetic Divergence

We compared the short fragments of the 16S rRNA gene (segment delimited by the abovementioned primers 16Sar and 16Sbr) previously obtained by other authors [4,11,12,37,38] for specimens of Dendropsophus nanus (Table S1) with the mitochondrial DNA sequences from our sampling. For this, we constructed a second matrix (Matrix 2) with 107 sequences (outgroup excluded) and 457 characters. In this matrix, we also added ten 16Sar-16Sbr fragments we obtained in this work, which were not included in Matrix 1 because they were shorter than the H1 fragments obtained for the other samples. We used Matrix 2 in Mega v.6 [39] to generate a neighbor-joining tree and to estimate genetic distances (p-distances) between the five major genetic lineages inferred in the phylogenetic analyses. Alignment gaps were not considered in the pairwise comparisons. The genetic distances between the D. nanusD. walfordi lineages were also calculated from the H1 fragments of Matrix 1 (used in the phylogenetic analysis) after excluding the outgroup, the COI partition and the sites that corresponded to gaps in all the remaining sequences. This procedure resulted in Matrix 3, with 56 sequences and 2472 characters.
The genetic structure of the Dendropsophus nanusD. walfordi complex was evaluated via hierarchical analysis of molecular variance (AMOVA) [40] with Arlequin v.3.5.1.2. We used the Kimura 2p distance to estimate genetic distances [41] based on the concatenated matrix with all mitochondrial genes (Matrix 1) without the outgroup. Haplotype networks were constructed with the same matrix using the median joining method (MJN, median joining) [42] implemented in the program Network v.4.6.1.2 (http://www.fluxus-engineering.com, accessed on 22 July 2021).

2.2.4. Delimitation of Independently Evolving Lineages Based on DNA Sequences

We used the DNA sequences from Matrix 1 (H1 and COI concatenated) to run one tree-based test (using the Poisson tree processes, PTP method) [43] and one distance-based test (automatic barcode gap discovery, ABGD) [44] of lineage delimitation. A Bayesian PTP analysis (bPTP) was conducted on the bPTP webserver (http://species.h-its.org/ptp accessed on 10 March 2018) with the tree inferred in the Bayesian analysis. For this analysis, we excluded D. werneri (which is the most distant outgroup in our taxon sampling), used 500,000 Markov chain Monte Carlo generations and set the burn-in to 0.25 and the thinning to 100. The ABGD analysis was conducted at the ABGD webserver (http://wwwabi.snv.jussieu.fr/public/abgd/abgdweb.html, accessed on 10 March 2018) using p-distances, initial partitions with a range of prior intraspecific divergence (P) varying from 0.001 to 0.01, steps = 10, Nb bins = 6 and setting the minimum gap width to 1.0.

2.3. Acoustic Analyses

Advertisement calls were recorded using either an M-Audio Microtrack II, a Marantz PMD 671 or an Ediroll R-09HR recorder set at a sampling rate of 48 kHz and an amplitude resolution of 16 bits. The recorders were coupled to either a Sennheiser ME66/K6, a K6/ME67 or a ME66/K3U directional microphone. The recordings were deposited in the sound collection Fonoteca Neotropical Jacques Vielliard (FNJV) of the Museum of Zoology “Adão José Cardoso” (at the University of Campinas, Brazil) or in the herpetological collection of the Museu de Biodiversidade do Cerrado (at the Federal University of Uberlândia, Brazil) (Table S2).
We selected five acoustic traits from the advertisement calls to be analyzed: note duration, number of pulses per note, pulse duration, pulse rate and dominant frequency. These traits were selected because of their importance to reproduction (mate choice) and competition (territoriality) (see [45,46,47,48]). We analyzed a variety of notes from each advertisement call to obtain the values of each acoustic variable. To represent each male, we used the mean values of each measured variable.
We analyzed the acoustic traits using Raven Pro v.1.5 for Windows from the Cornell Lab of Ornithology (Bioacoustic Research Program 2012). Raven settings were as follows: window type = Hann, window size = 1024 samples, 3 dB filter bandwidth = 270 Hz, overlap = 85%, hop size = 0.792, DFT size = 1024 samples and grid spacing = 46.9 Hz. All other settings followed the ‘defaults’ of Raven software. We obtained sound figures with the Seewave package v.2.0.2 [49] on the R platform (v.3.2.2) [50] with the following settings: Hanning window, 256 samples (FFT) and 85% overlap. The terminology used to describe the calls followed Köhler et al. [51]. Voucher specimens and their respective localities are presented in Table S1.
We implemented Breiman’s random forest algorithm (RF, package v.4.6-12 [51] in R) to discriminate partitions considering call features. The RF algorithm constructs classification trees using bootstrap samples of the data (each node is split using the best among a subset of predictors randomly chosen at that node) and then generates classifiers and aggregates results by voting to classes [52]. The RF results included an estimate of the distances between the objects, which were subjected to multidimensional scaling analysis (MDS) and displayed graphically with the rfPermute package on the R platform.
Because RF analysis discriminated two different advertisement calls among the analyzed specimens, we analyzed both calls (named call I and call II) using two additional approaches. We first tested, for each call, whether the introductory notes differed from the secondary notes using Welch’s t-tests. We used each acoustic parameter as a response variable and the note type (introductory or secondary) as a factor. We log transformed the dominant frequency and pulse rate data of call II to meet the assumptions of homogeneity and heteroscedasticity of the test. We used the nonparametric Mann–Whitney–Wilcoxon test when transformation of data still violated the assumptions of the analysis. These data included note duration and pulse rate for call I and pulse duration for both calls. We met the assumptions of the test with all the other acoustic variables.
We also tested whether each note (introductory or secondary) differed between both calls using multivariate analysis of variance (MANOVA). As such, we performed four MANOVAs to compare: (1) introductory notes of both calls, (2) introductory notes of call I and secondary notes of call II, (3) secondary notes of call I and introductory notes of call II, and (4) secondary notes of both calls. For each MANOVA, we included all the acoustic variables of each note type as response variables and the calls (I or II) as factors.

2.4. Morphological Analyses

Adult males were measured using an ocular micrometer coupled to a stereomicroscope. Measurements larger than 10 mm were taken with calipers accurate to 0.1 mm. We measured snout–vent length (SVL), head length (HL), head width (HW), tympanum diameter (TD), eye diameter (ED), shank length (SL) (= tibia length) and foot length (FL) following Duellman [53]. Thigh length (TL) and hand length (HAL) were measured as proposed by Heyer et al. [54], and the eye–nostril distance (END) was measured following Napoli and Caramaschi [55].
To investigate whether the five genetic lineages recognized in the D. nanus–D. walfordi species complex could be differentiated by morphological traits, we compared 71 males (65 of them collected from sites also sampled for phylogenetic/genetic analyses; see Table S1). We analyzed whether they differed in body size (SVL) using permutation ANOVA. For this, we used the lmp function from the lmPerm package in R software v.2.1.0 [56]. As we performed multiple comparisons, we adjusted the p-value with the Holm method using the p.adjust function in R software.
We performed a principal component analysis (PCA) [57] to detect patterns of morphological variation among the five major clades inferred in the phylogenetic analyses. To reduce the effect of body size on the morphological measures, we conducted PCA with morphometric ratios (HW/HL, TD/ED, FL/TL, TD/HL, TL/SVL, HW/SVL, FL/SVL, HAL/SVL and SL/FL). We used a correlation matrix and performed PCA using the dudi.pca function of the package ade4 [58] in R software. We then used analyses of variance (ANOVA) to verify the significance of the morphological patterns. We used the first two principal components (PCs) of the PCA as response variables for each ANOVA, as these axes explained the greatest proportion of the morphological variation among the analyzed specimens. We also used the five lineages as the independent variable and set α = 0.05. All assumptions of ANOVA were met. The ANOVAs were also performed using R software or SYSTAT software v.8 [59].

3. Results

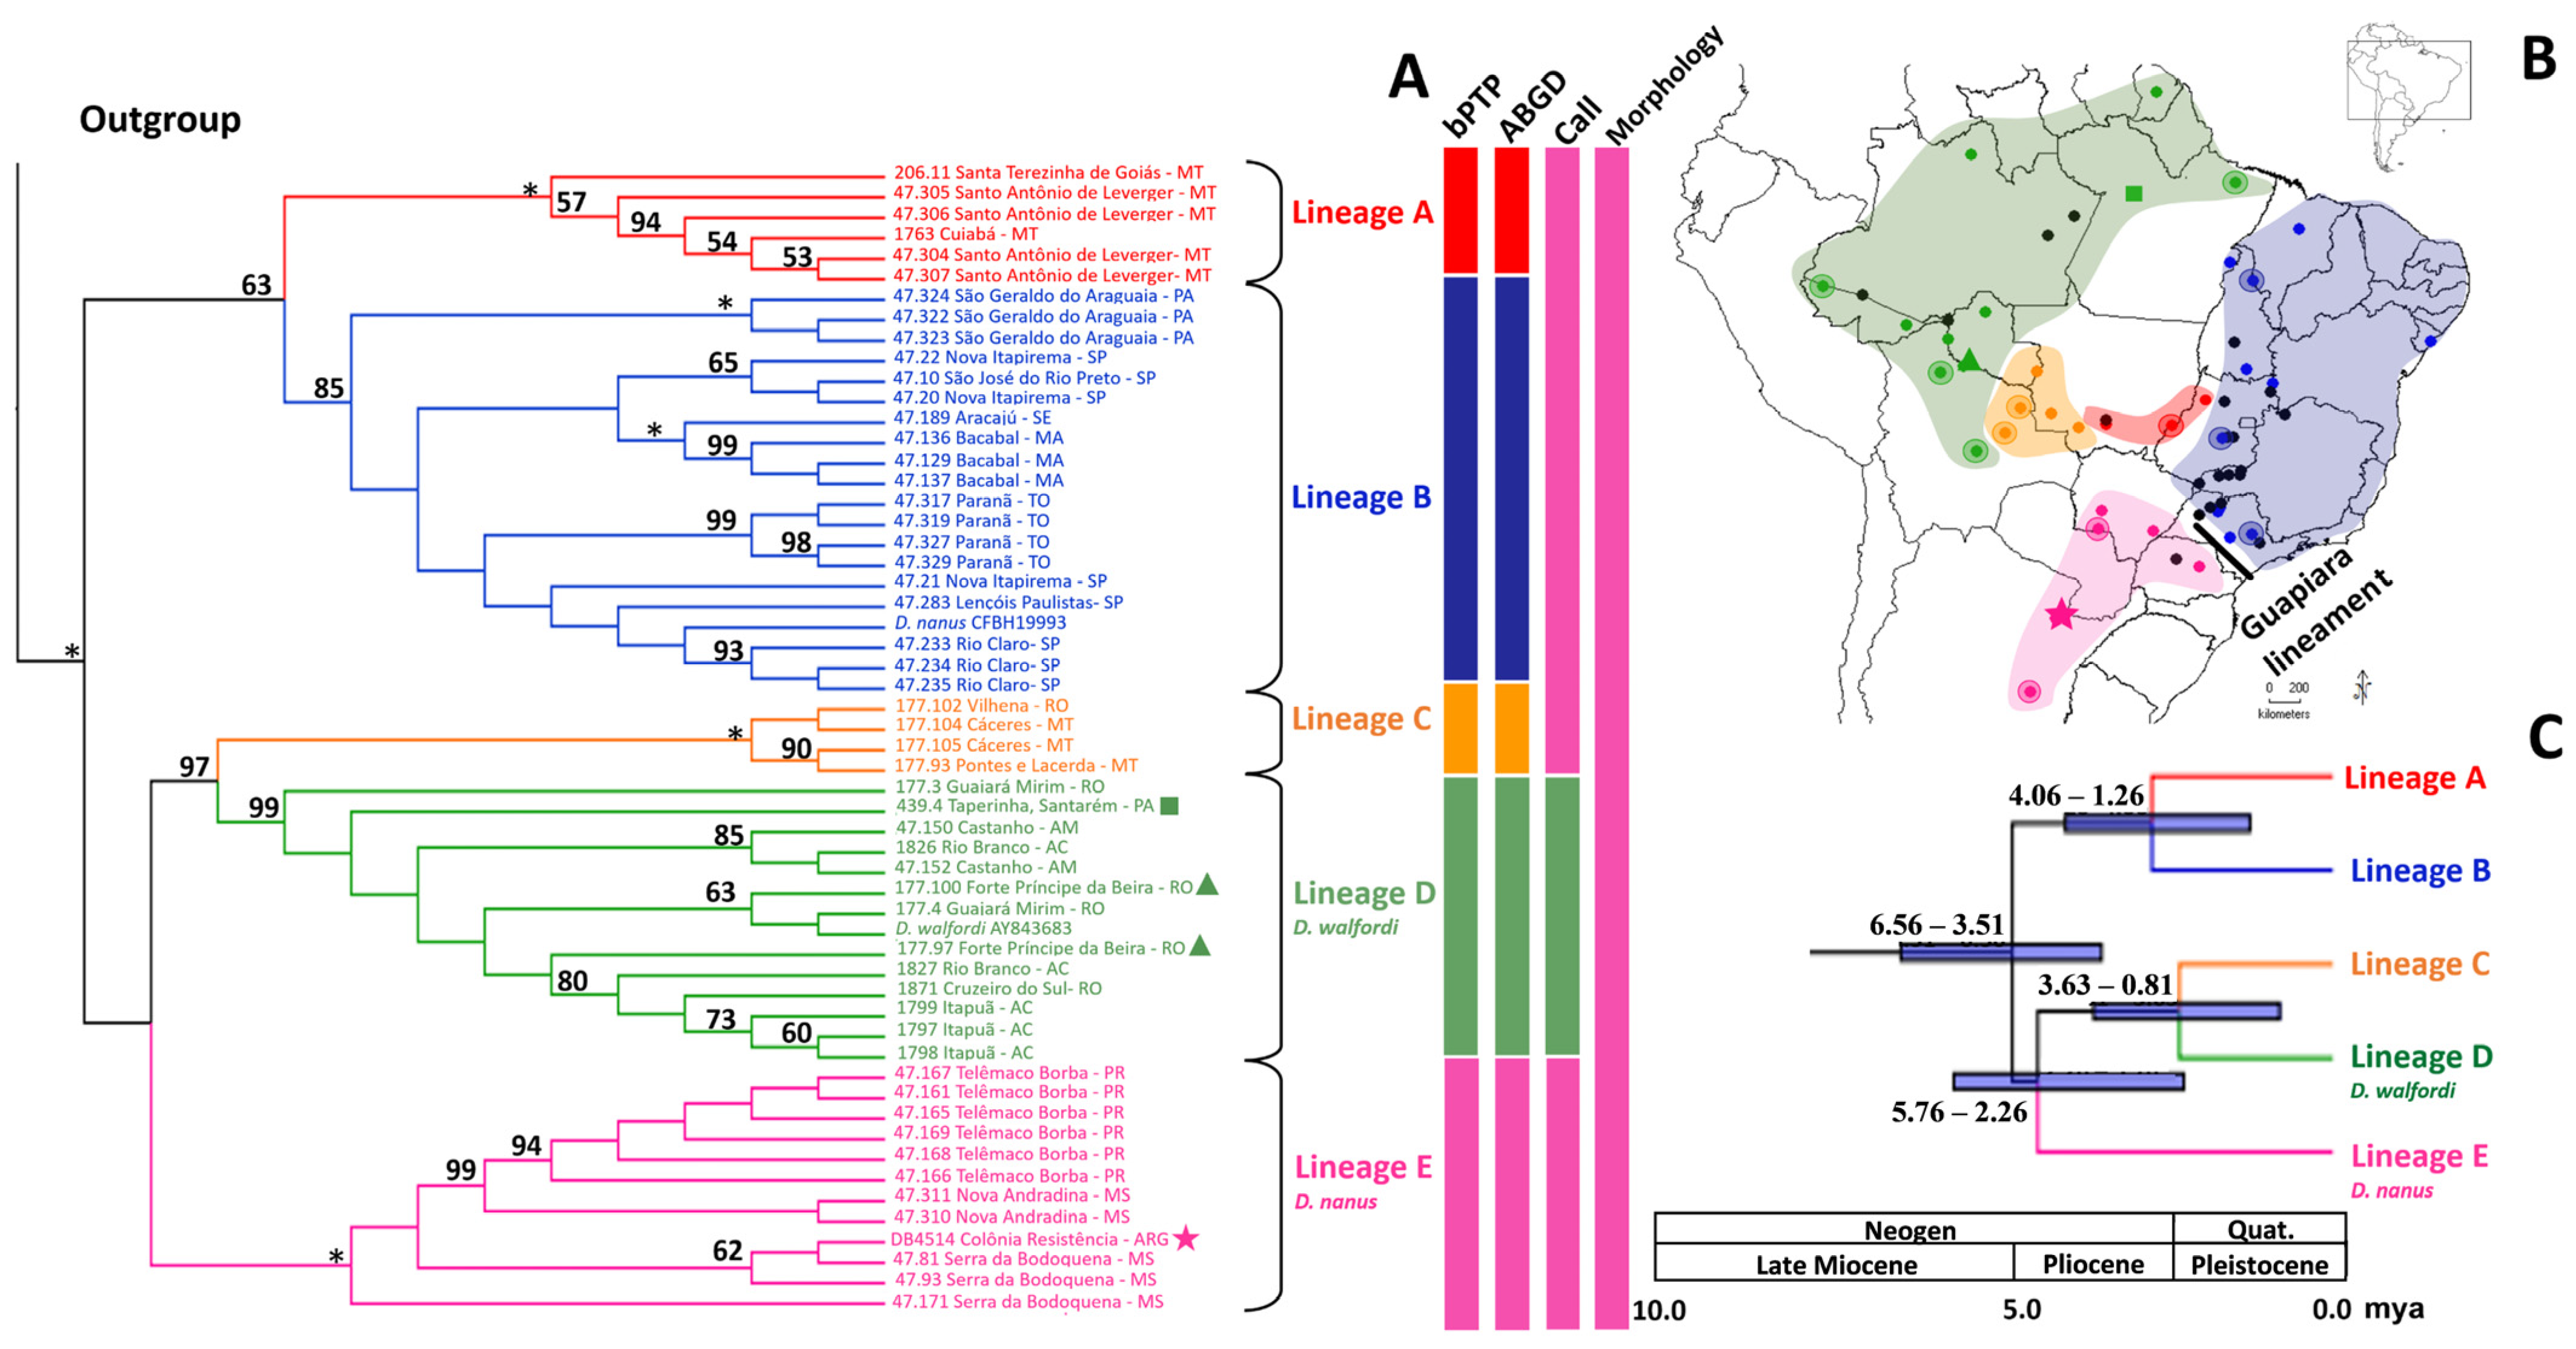
3.1. Phylogenetic Inferences

In the Bayesian, maximum-parsimony and BEAST analyses, the specimens of the Dendropsophus nanusD. walfordi species complex were grouped into five major clades, named Lineages A–E, distributed over distinct geographic areas (Figure 1 and Figures S1–S3). Lineage A was composed of specimens from central Brazil, whereas Lineage B was distributed from southeastern to northeastern Brazil. Lineage C included specimens from eastern Bolivia and midwestern Brazil. Lineage D exhibited specimens distributed throughout the Amazonian Forest from French Guiana to Bolivia. Lineage E was composed of specimens from Argentina, the Brazilian state of Paraná and the southern portion of the Brazilian state of Mato Grosso do Sul (Figure 1). It is worth noting that the two specimens of D. walfordi from the type locality (Forte Príncipe da Beira, Costa Marques, state of Rondônia, Brazil) were recovered in Lineage D, and the specimen of D. nanus from the type locality (Colonia Resistencia, Chaco, Argentina) was nested in Lineage E. The specimen from Taperinha, Santarém, state of Pará, Brazil, which is the type locality of D. minimus, was nested within Lineage D (Figure 1 and Figures S1–S3).
The relationships between Lineages A–E were congruent among all the phylogenetic analyses (Figure 1 and Figures S1–S3), with the clade (Lineage C, Lineage D) being supported by high value of posterior probability (Figure S2) or bootstrap (Figure 1 and Figure S1). The clade (Lineage A, Lineage B) was also strongly supported in the Bayesian analysis (Figure S2).
In the BEAST analysis, the divergence between Lineages A and B and the split between Lineages C and D were estimated to be the early Pliocene (approximately 3 mya). The divergence of Lineage E from the clade composed of Lineages C and D was estimated to have occurred at approximately 4 mya, and the most common ancestor of the Dendropsophus nanusD. walfordi complex was dated to 5 mya (Figure 1 and Figure S3).

3.2. Genetic Diversity and Sequence-Based Species Delineation

The neighbor-joining analysis of Matrix 2, which also included DNA sequences of Bolivian specimens, clustered the sequences assigned by Jansen et al., 2011 [12] and Schulze et al., 2015 [12] as “D. nanus A” and “Dendropsophus cf. nanus” together with those included in Lineages C and D, respectively (Figure S4).
The genetic distances between Lineages A–E estimated from Matrix 3 (with 2472 characters of the H1 fragment) were all approximately 3%, except for the distance between Lineages A and B, which was 1.7%. The genetic diversity within each of these lineages was lower than 0.7% (Table 1). We found significant variation between Lineages A–E (AMOVA, Fst = 0.950), with 79.31% of the genetic variation found in the D. nanusD. walfordi species complex being due to the difference between the lineages. The variation between populations within the lineages was estimated to account for 15.62% of the total variation, and 5.08% of the variation was due to differences within the populations.
The H1 sequence of the topotype of Dendropsophus minimus was very similar to the sequences from the topotypes of Dendropsophus walfordi, with a distance of only 0.04% between them.
The calculated genetic distances based on Matrix 2 (composed of the 16Sar-16Sbr fragment of the 16S gene, 457 characters) were lower than those observed in the analysis of Matrix 3 (composed of 2472 characters of the H1 fragment) (Table 1). The distance inferred between Lineages D and E, for example, was 1.1% based on the 16Sar-16Sbr fragment and 2.5% based on the H1 fragment matrix (Table 1). An even greater difference was observed in the distance values between Lineages C and E (1.3% and 3.1% using the 16Sar-16Sbr and H1 fragments, respectively; Table 1).
The haplotype network constructed from the H1 fragments allowed the recognition of five groups that coincided with Lineages A–E inferred in the phylogenetic analyses, and none of the haplotypes was shared between these groups (Figure S5). The delimitation of independently evolving lineages also supported the recognition of five putative species among our sample of the Dendropsophus nanusD. walfordi species complex. The bPTP analysis using the maximum likelihood solution recognized five entities (Figure S6), and the ABGD test showed the same number of candidate species in the recursive partition.

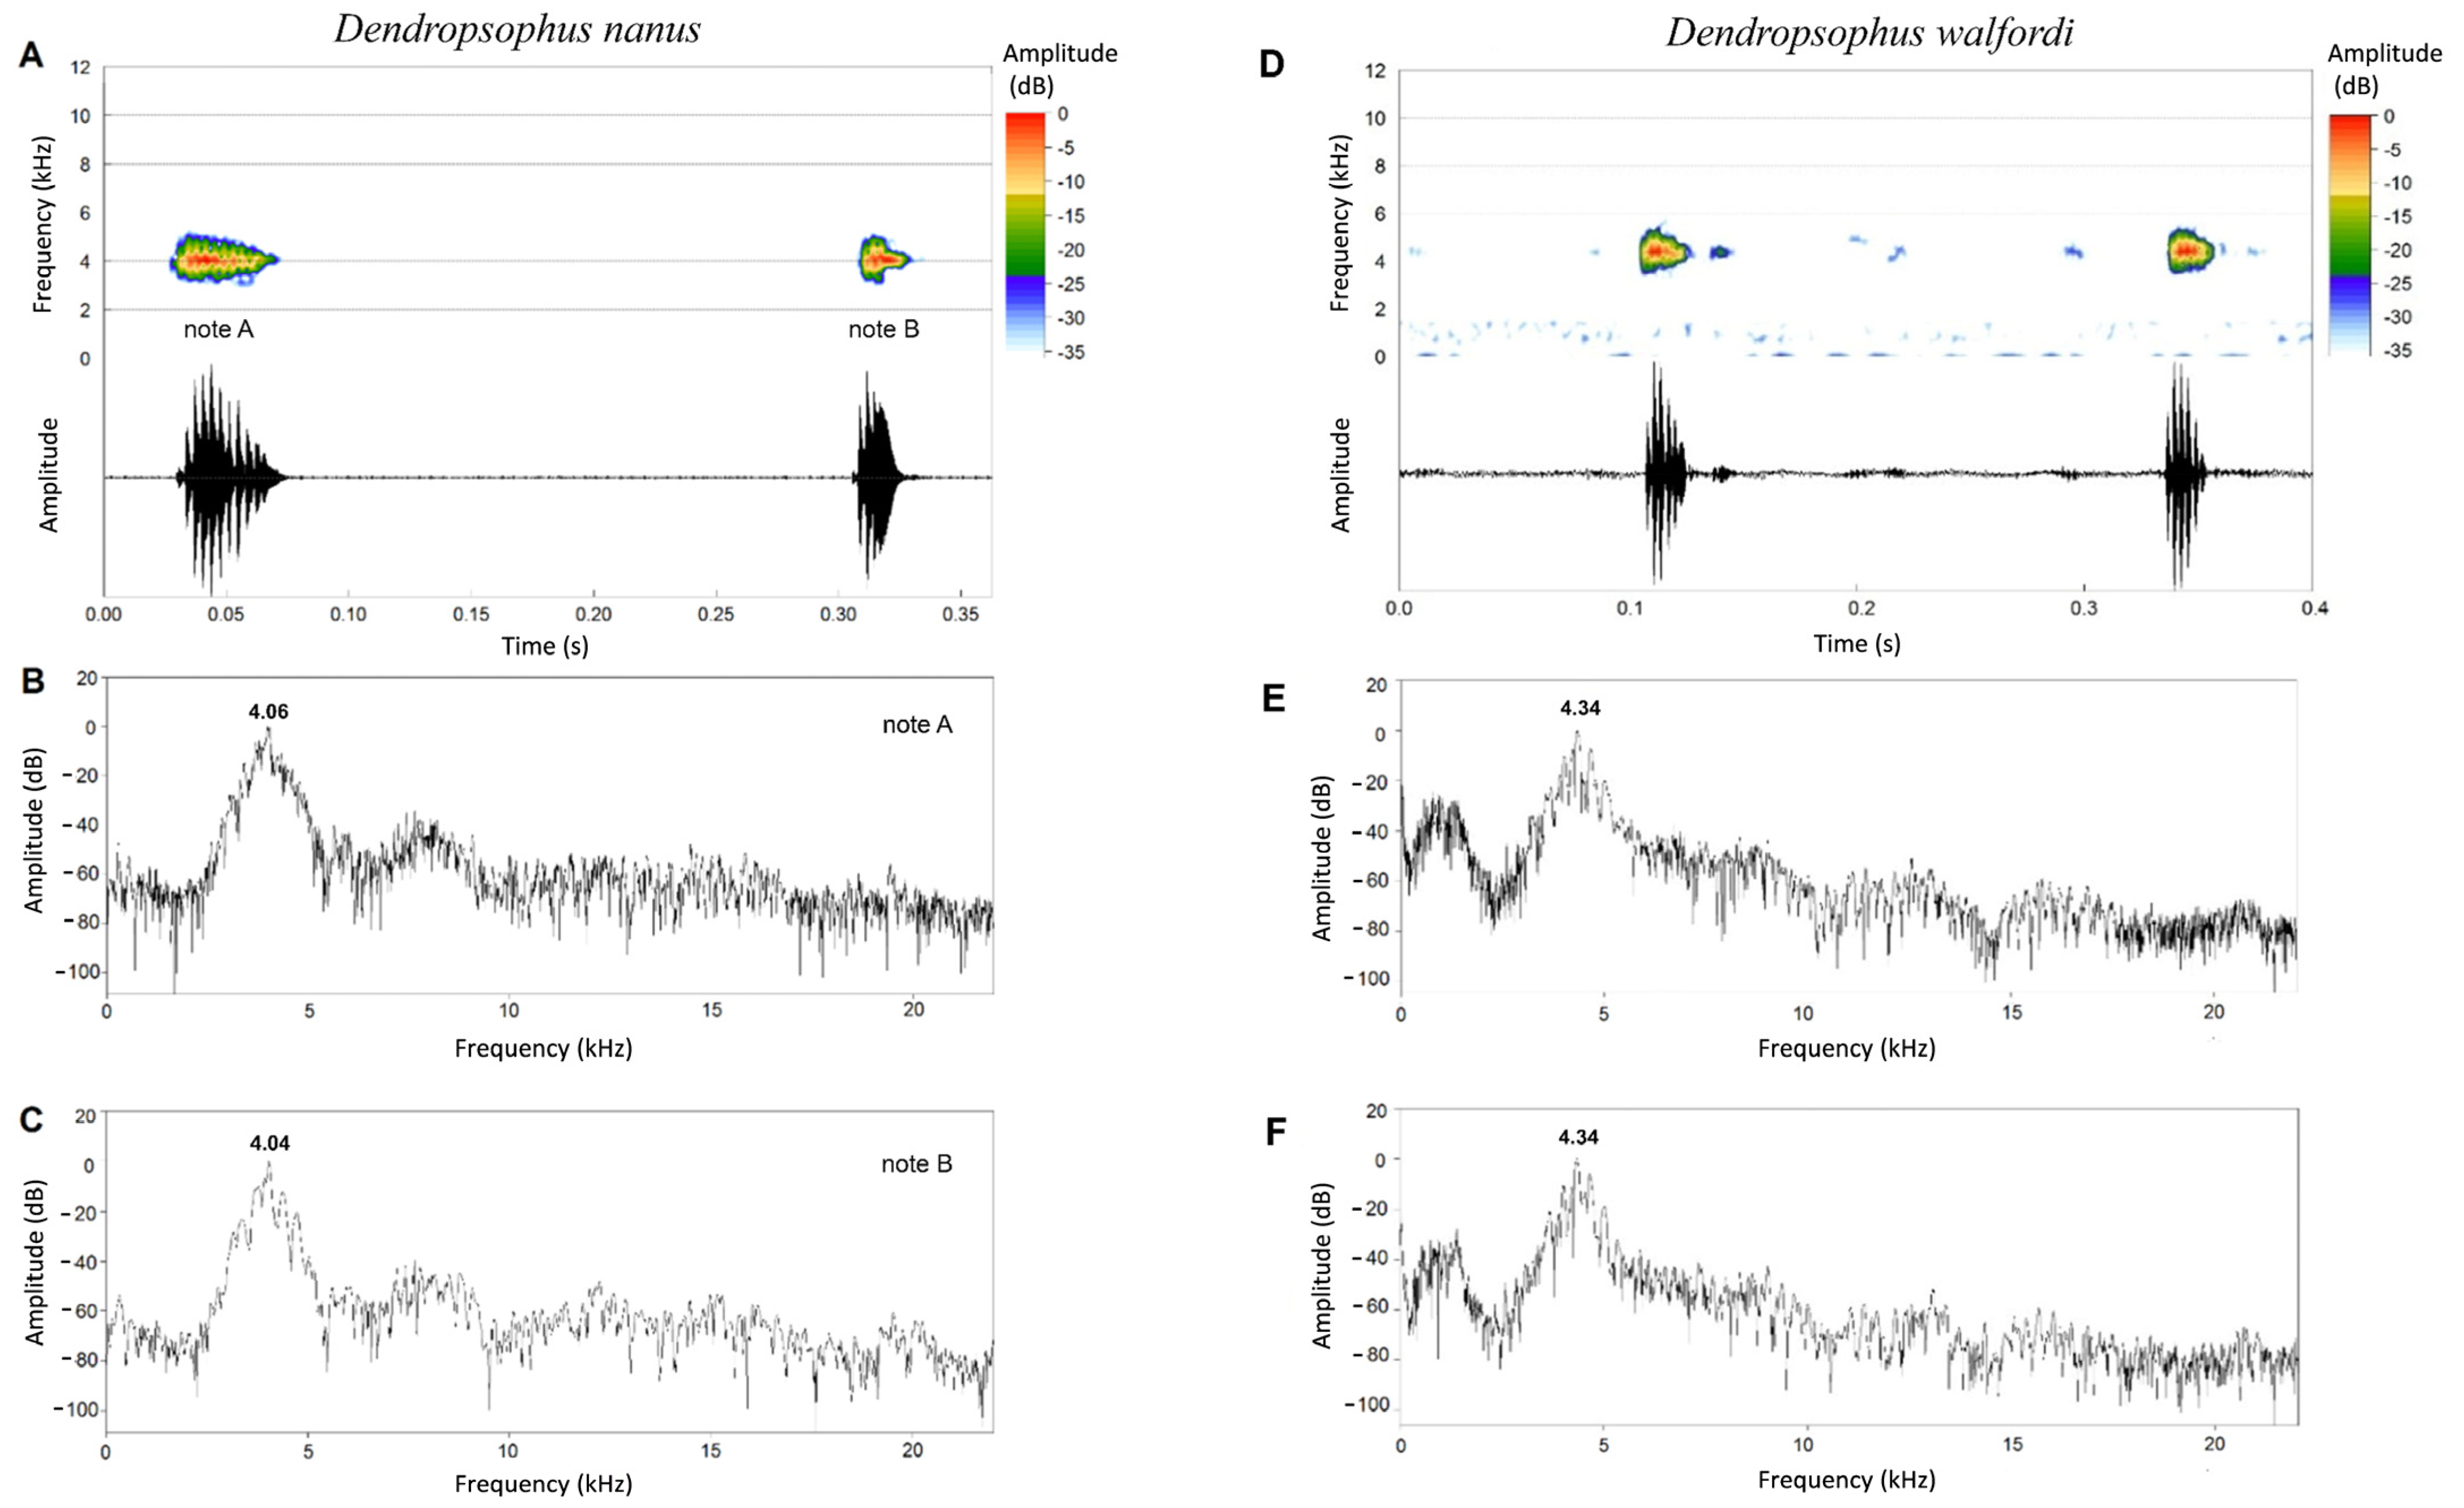
3.3. Advertisement Calls

The advertisement call of Dendropsophus nanus specimens (Figure 2) from the type locality (Colonia Resistencia, Chaco, Argentina) (N = 10 recorded males) was composed of two types of pulsed notes, referred to herein as notes A (long note) and B (short note) (following [60]), both with similar dominant frequencies. Calls were often emitted in a series of 2 to 6 notes (mean 2.4; SD = 0.4; N series of notes = 236, N males = 10) consisting of 1 note A followed by 1 to 5 B notes (e.g., AB, ABB or ABBB). A note was emitted alone or in series, whereas note B was only emitted in series. When in a series (e.g., ABB), the notes were emitted at a rate of 2.63 to 4.73 per second (mean 3.8; SD = 0.3; N series of notes = 86). The interval between the notes within the series ranged from 165 to 320 ms (mean 221.8; SD = 18.6; N note interval = 117). The amplitude modulation in notes A and B was incomplete, and the pulse envelope varied; in note B, the last pulse was longer than the other pulses.
The note A duration ranged from 29 to 56 ms (mean = 41.2 ms; SD = 4.4; N notes = 145). These notes were formed by 7 to 15 pulses (mean = 10.9; SD = 1.3; N notes = 124). The pulse duration ranged from 2 to 11 ms (mean = 3.7 ms; SD = 0.2; N pulses = 163), and the pulse rate ranged from 194 to 351 pulses per second (mean = 265.8; SD = 20.9; N notes = 124). The dominant frequency ranged from 3703 to 4546 Hz (mean = 4246 Hz; SD = 165.2; N notes = 145). The note B duration ranged from 13 to 31 ms (mean = 21.1 ms; SD = 2.7; N notes = 134). These notes were formed by 3 to 9 pulses (mean = 4.9; SD = 1.0; N notes = 111). The pulse duration ranged from 2 to 14 ms (mean = 4.2 ms; SD = 0.7; N pulses = 113), and the pulse rate ranged from 143 to 360 pulses per second (mean = 244.5; SD = 34.9; N notes = 113). The dominant frequency ranged from 3937 to 4593 Hz (mean = 4259 Hz; SD = 135.4; N notes = 134).
The advertisement calls of 133 other specimens from 27 Brazilian localities were similar to the call described for the topotypes of D. nanus (for details on the specimen localities and calls, see Tables S1 and S2, respectively). Most of the analyzed calls had a conserved structural difference in amplitude modulation between notes A and B. However, it is worth noting that, in some cases, this difference was not completely clear due to the great variation in the amplitude modulation of notes emitted by the specimens. Five out of the ten specimens from the 27 analyzed localities were included in the genetic diversity or phylogenetic analysis and were nested within clades A, B, C and E. All analyzed calls were very similar in their temporal and spectral value traits.
The advertisement call of topotypes of Dendropsophus walfordi (Forte Príncipe da Beira, state of Rondônia, Brazil) (N = 9 recorded males) was composed of one type of pulsed note, emitted as isolated notes or in a series (Figure 3). The calls were often emitted in a series of 2 to 26 notes (mean = 6.3; SD = 3.8; N notes = 65). The note duration ranged from 8 to 30 ms (mean = 15.5 ms; SD = 2.7; N notes = 140). Notes were formed by 1 to 9 pulses (mean = 4.6; SD = 1.6; N notes = 140). The pulse duration ranged from 1 to 20 ms (mean = 4.2 ms; SD = 1.8; N pulses = 253), and the pulse rate ranged from 50 to 462 pulses per second (mean = 293.4; SD = 88.1; N notes = 140). The dominant frequency ranged from 4078 to 4734 Hz (mean = 4425 Hz; SD = 212; N notes = 140). The amplitude modulation of the notes was incomplete, and the pulse envelope was extremely variable.
For 18 specimens from five other localities in the Brazilian Amazon, the advertisement call was composed of one type of note and was similar in its temporal and spectral features to the call of the topotypes of Dendropsophus walfordi (for details on the specimen localities and calls, see Table 1 and Table S2, respectively). However, the first note of each series differed significantly from the following notes of the same series in terms of both note duration (p = 0.001; t = 3.38; df = 52; SD = 0.001) and number of pulses (p = 0.001; t = 3.35; df = 52; SD = 0.35). Specimens from two of these localities were also included in the phylogenetic analysis and nested within the clade corresponding to Lineage D (see Table S1).

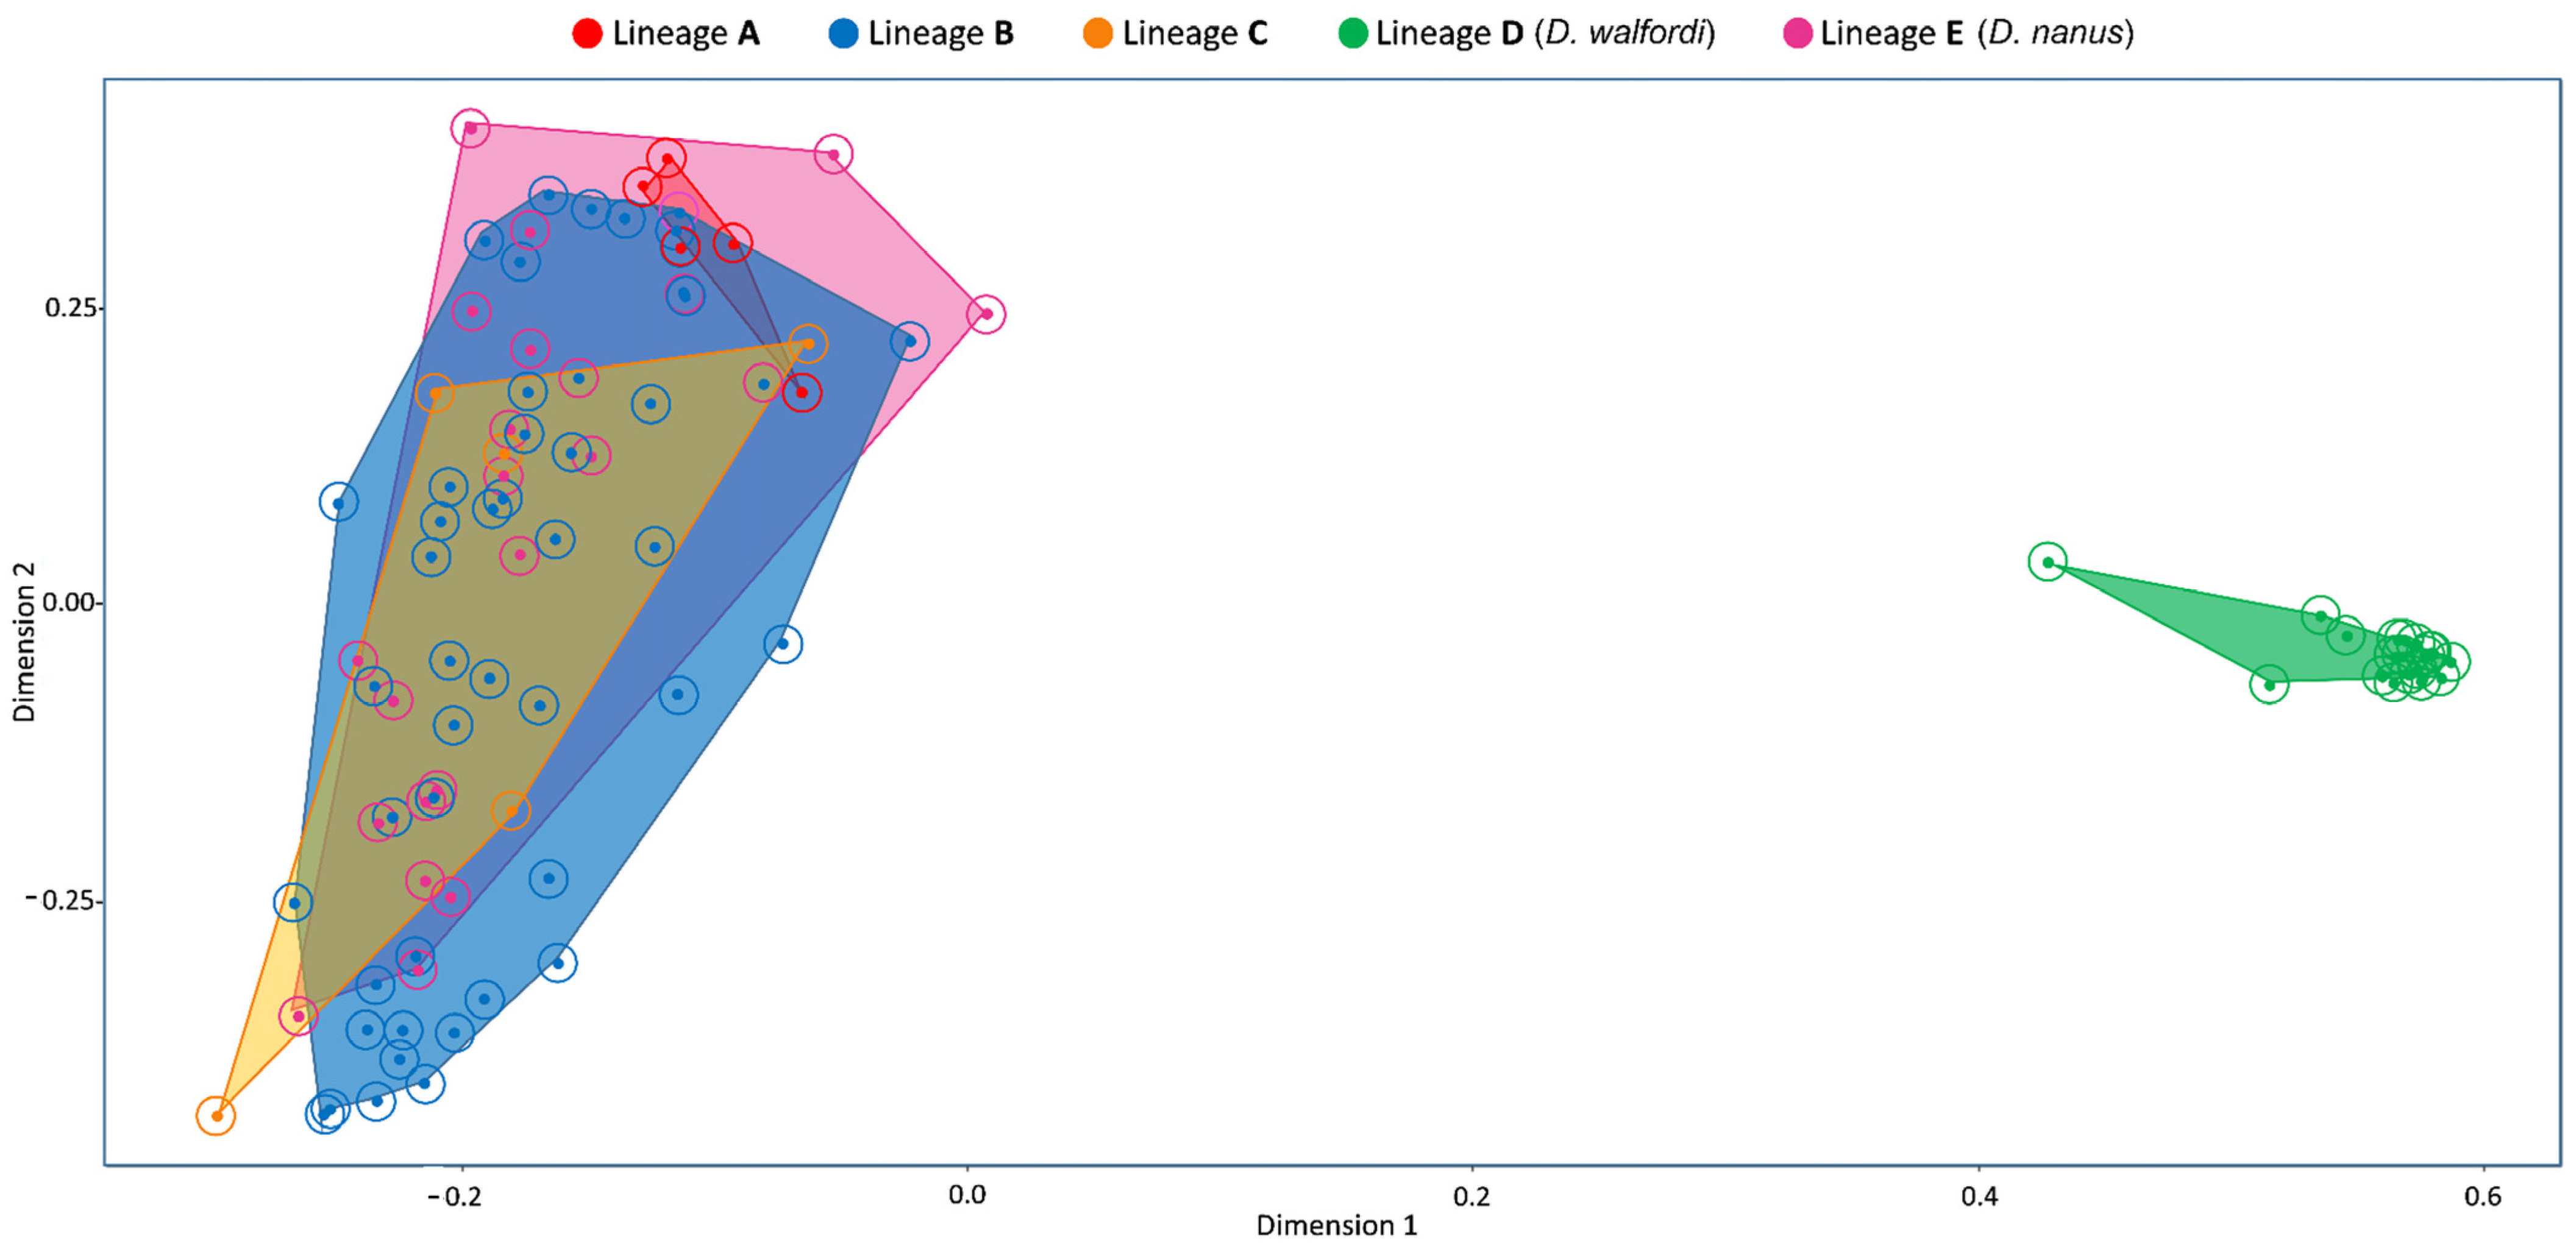
3.4. Comparative Acoustic Analyses
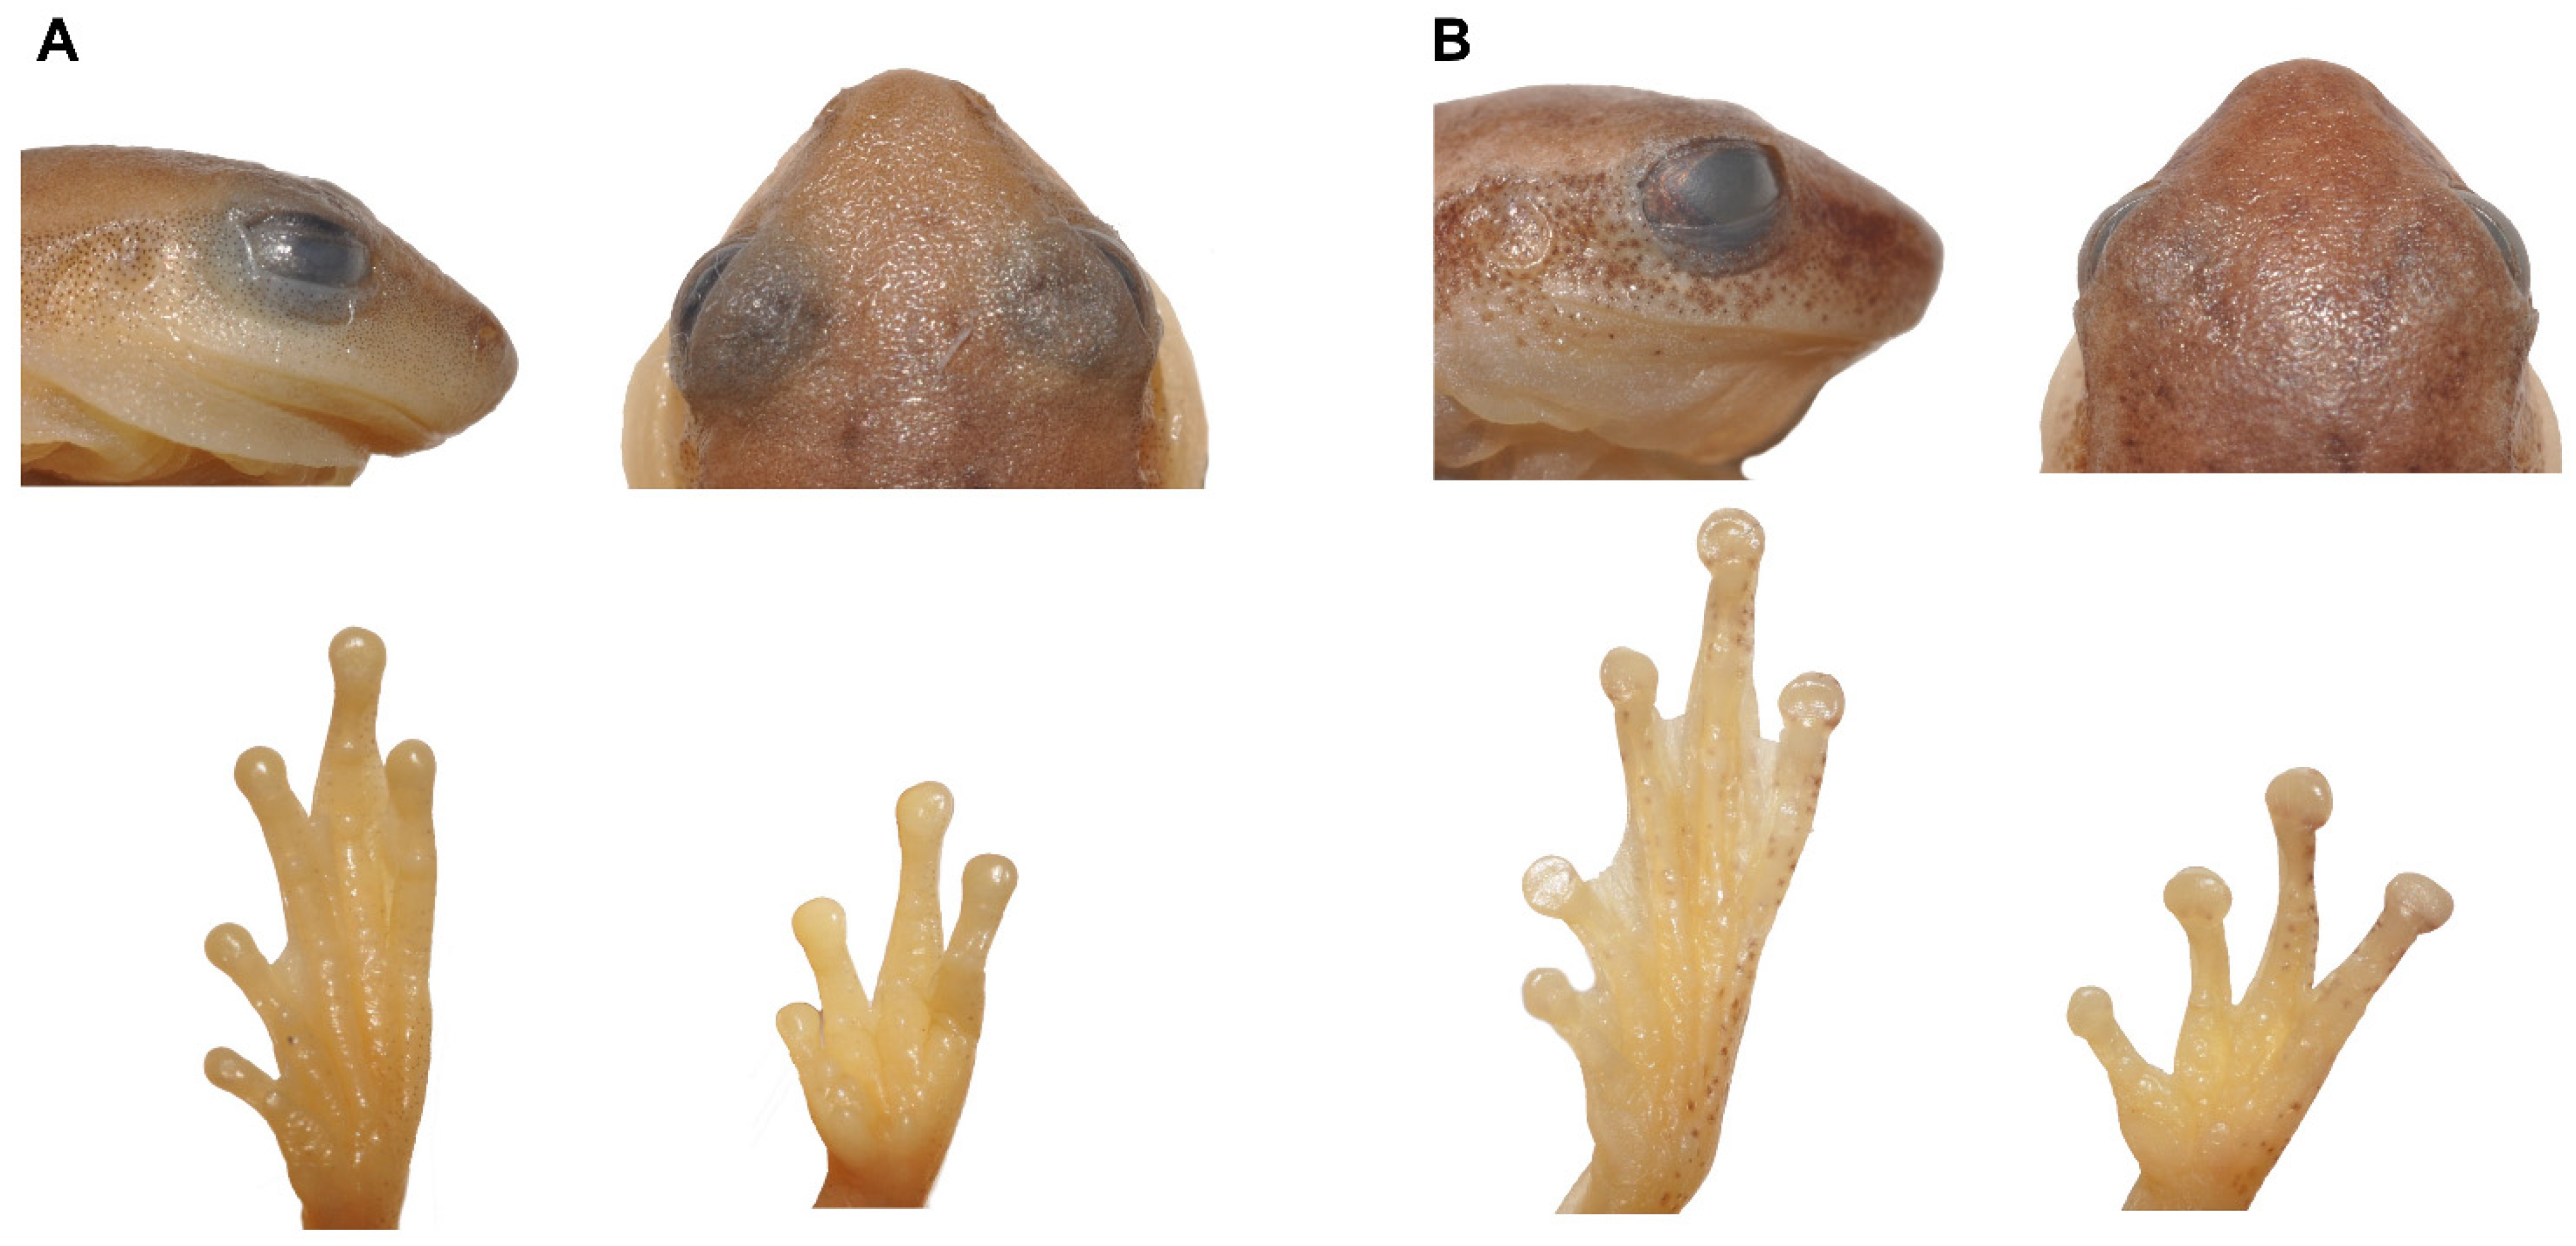
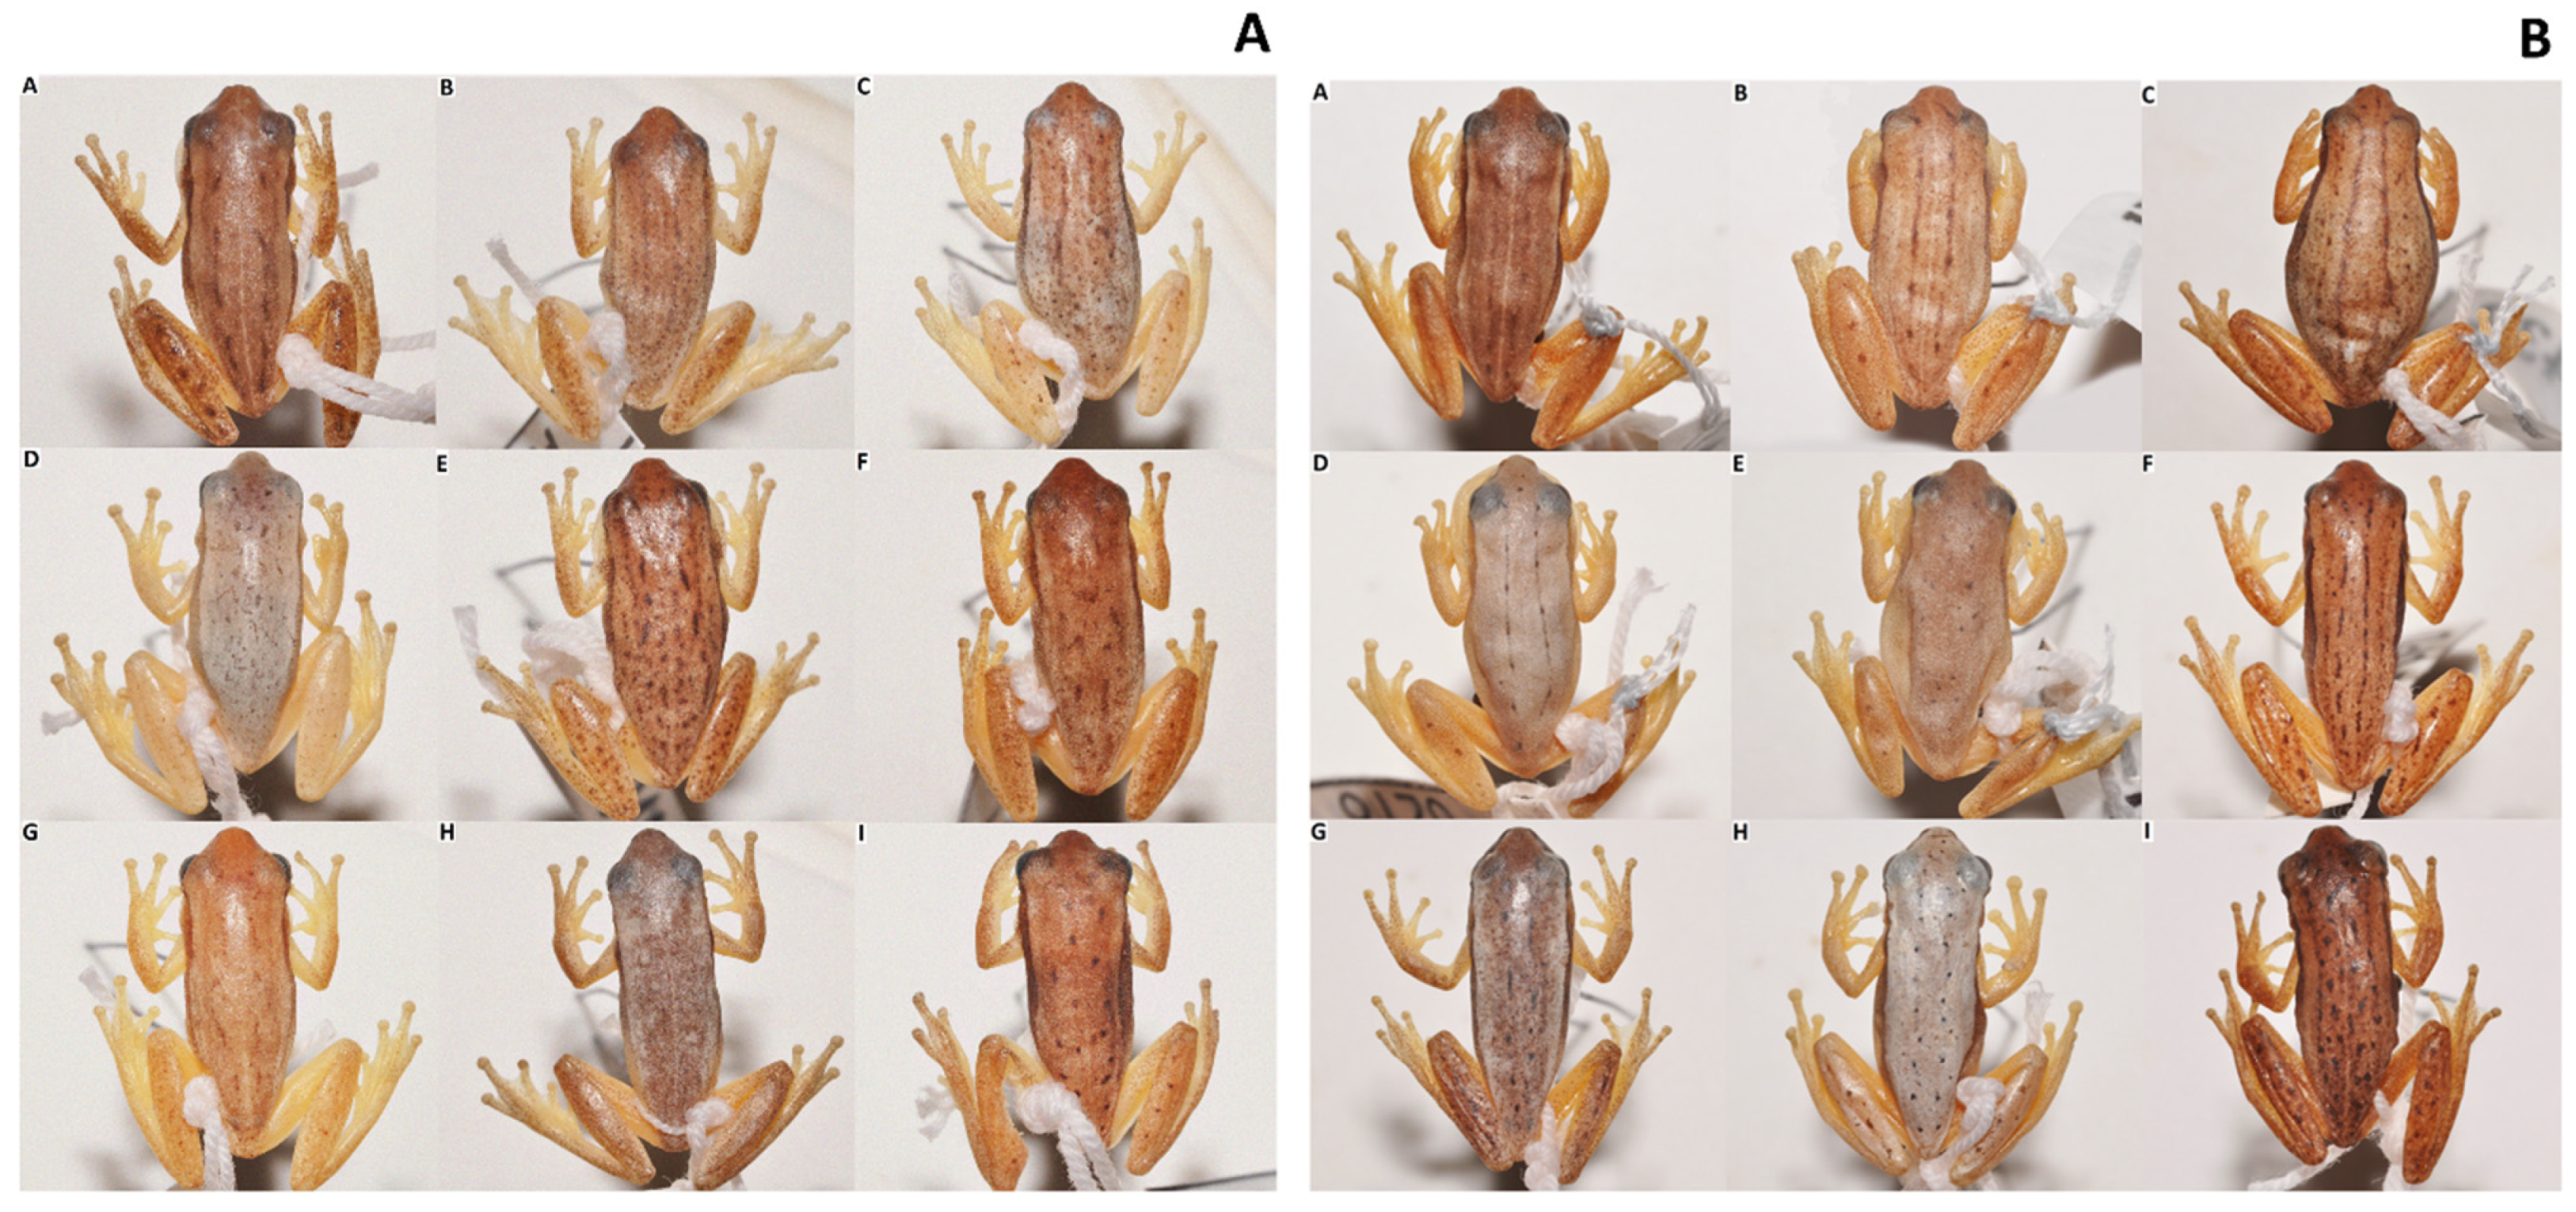
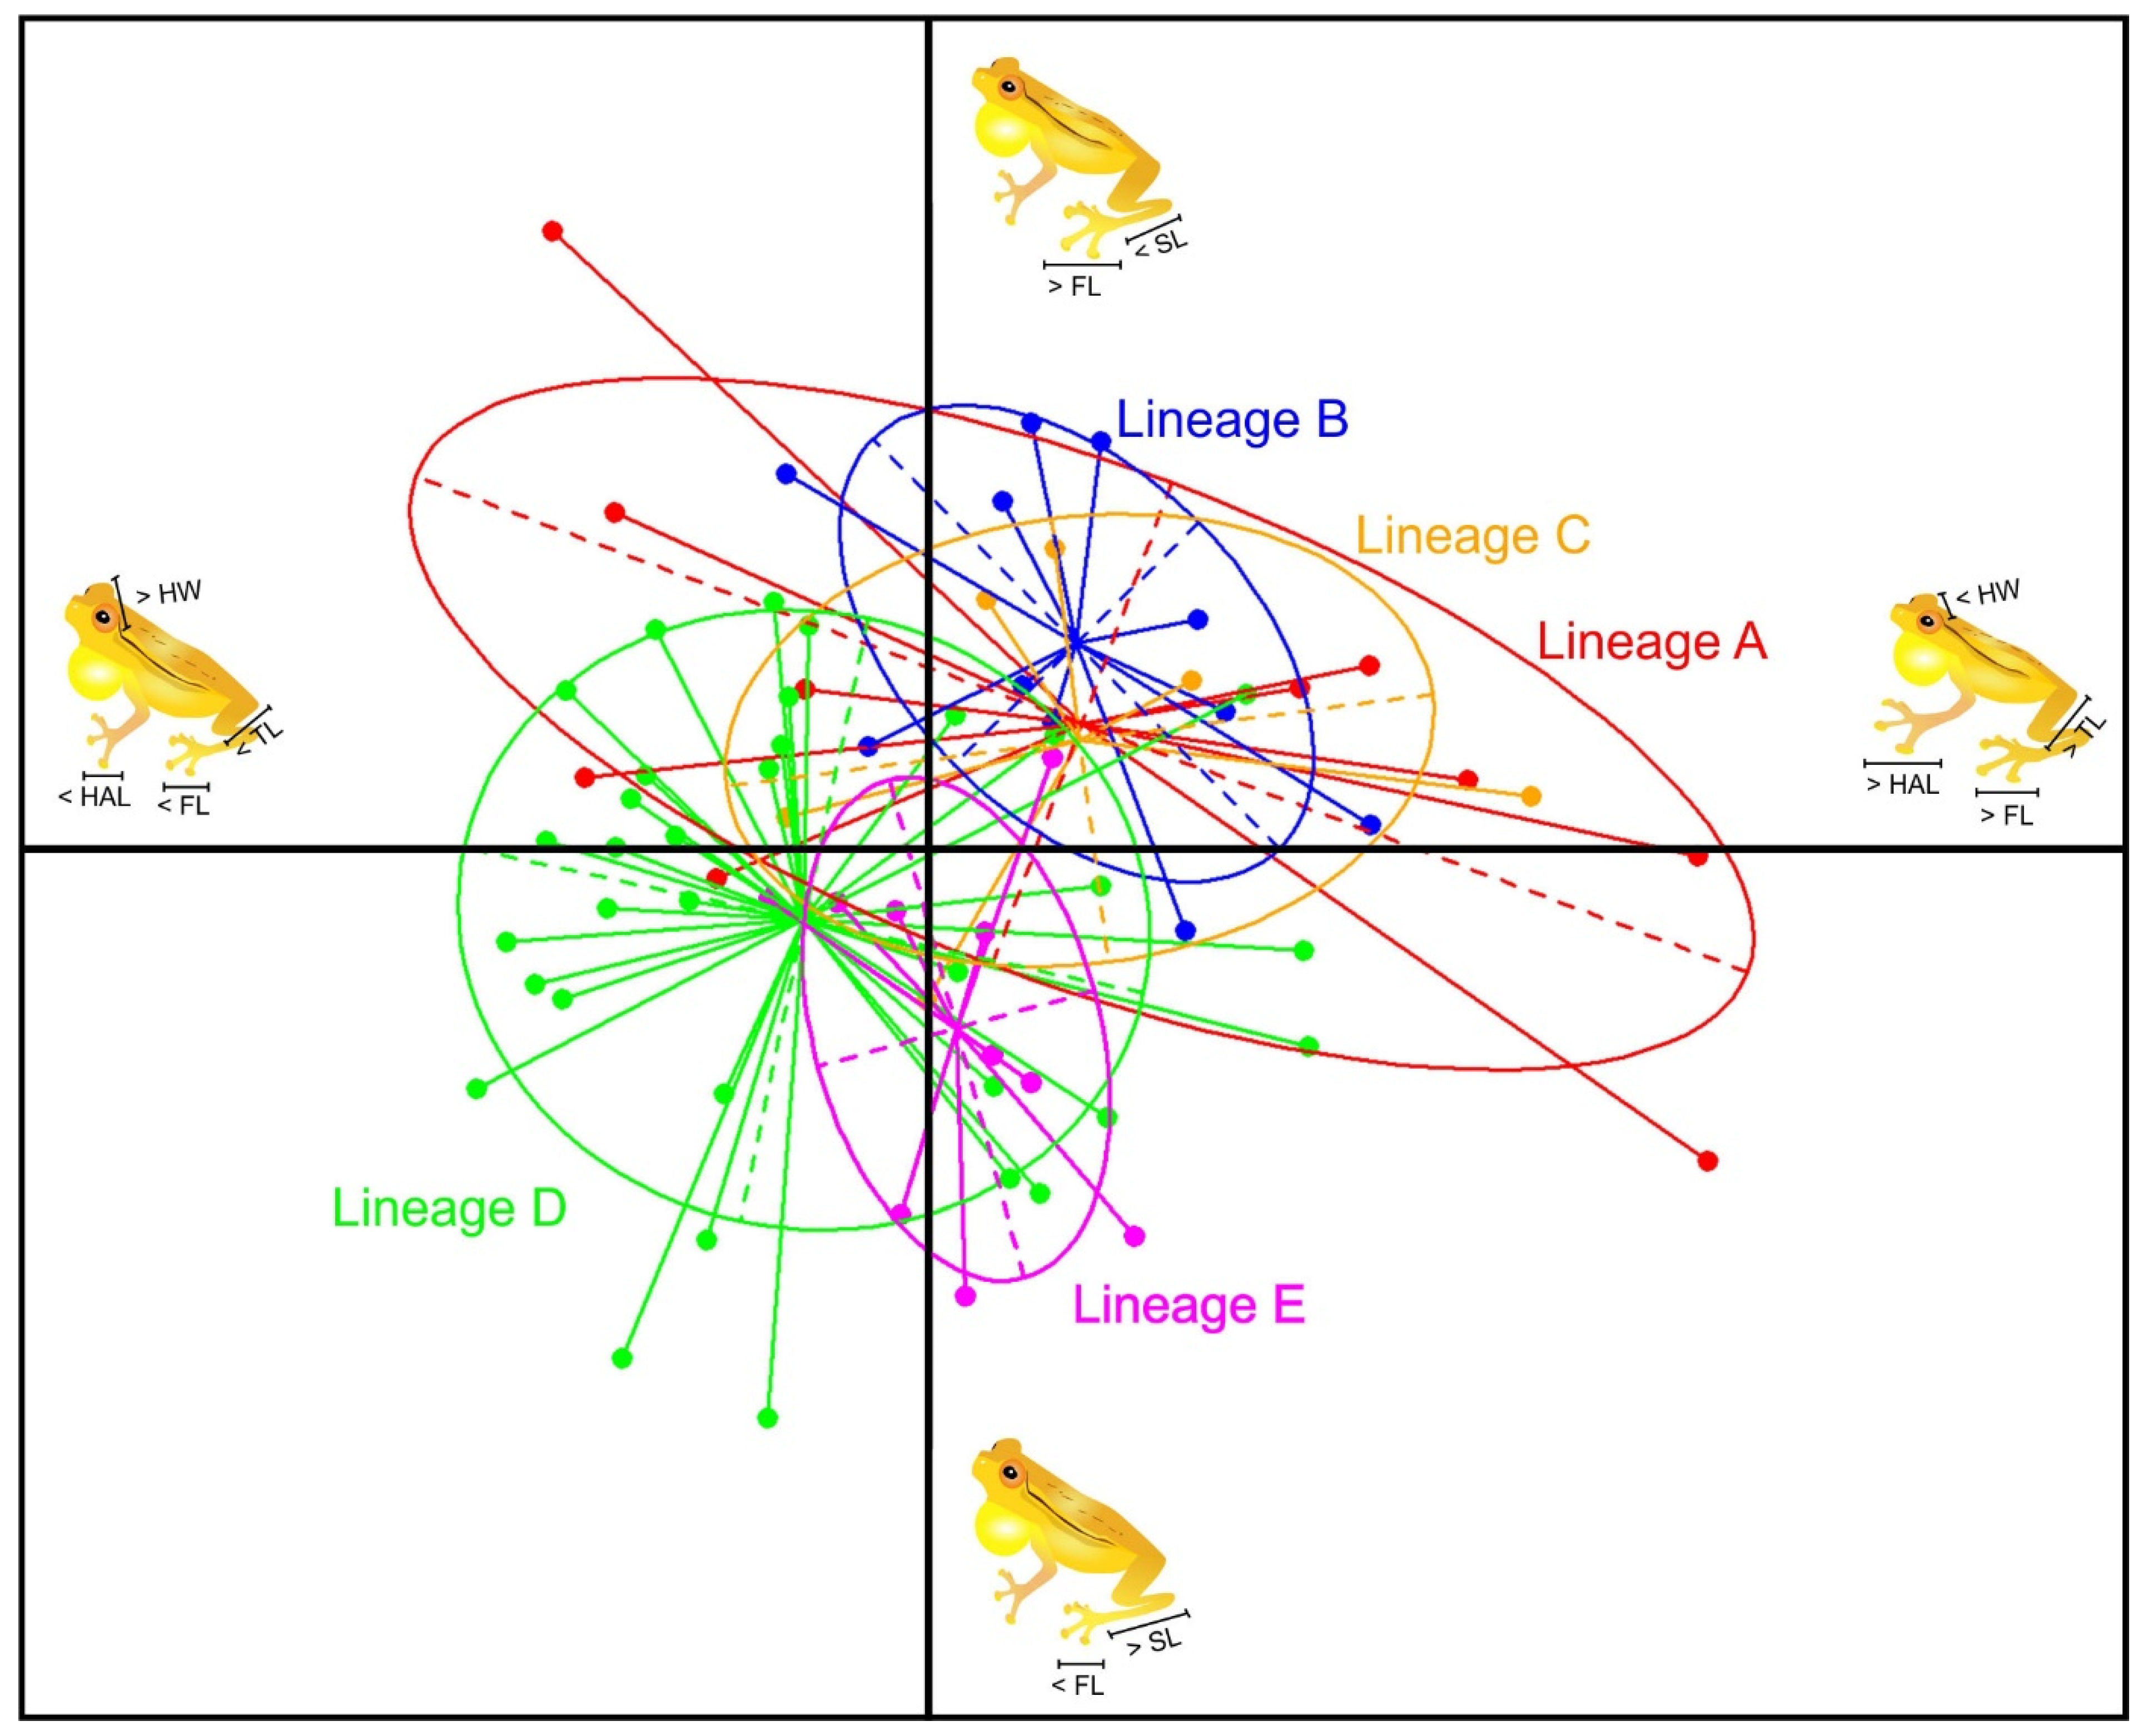
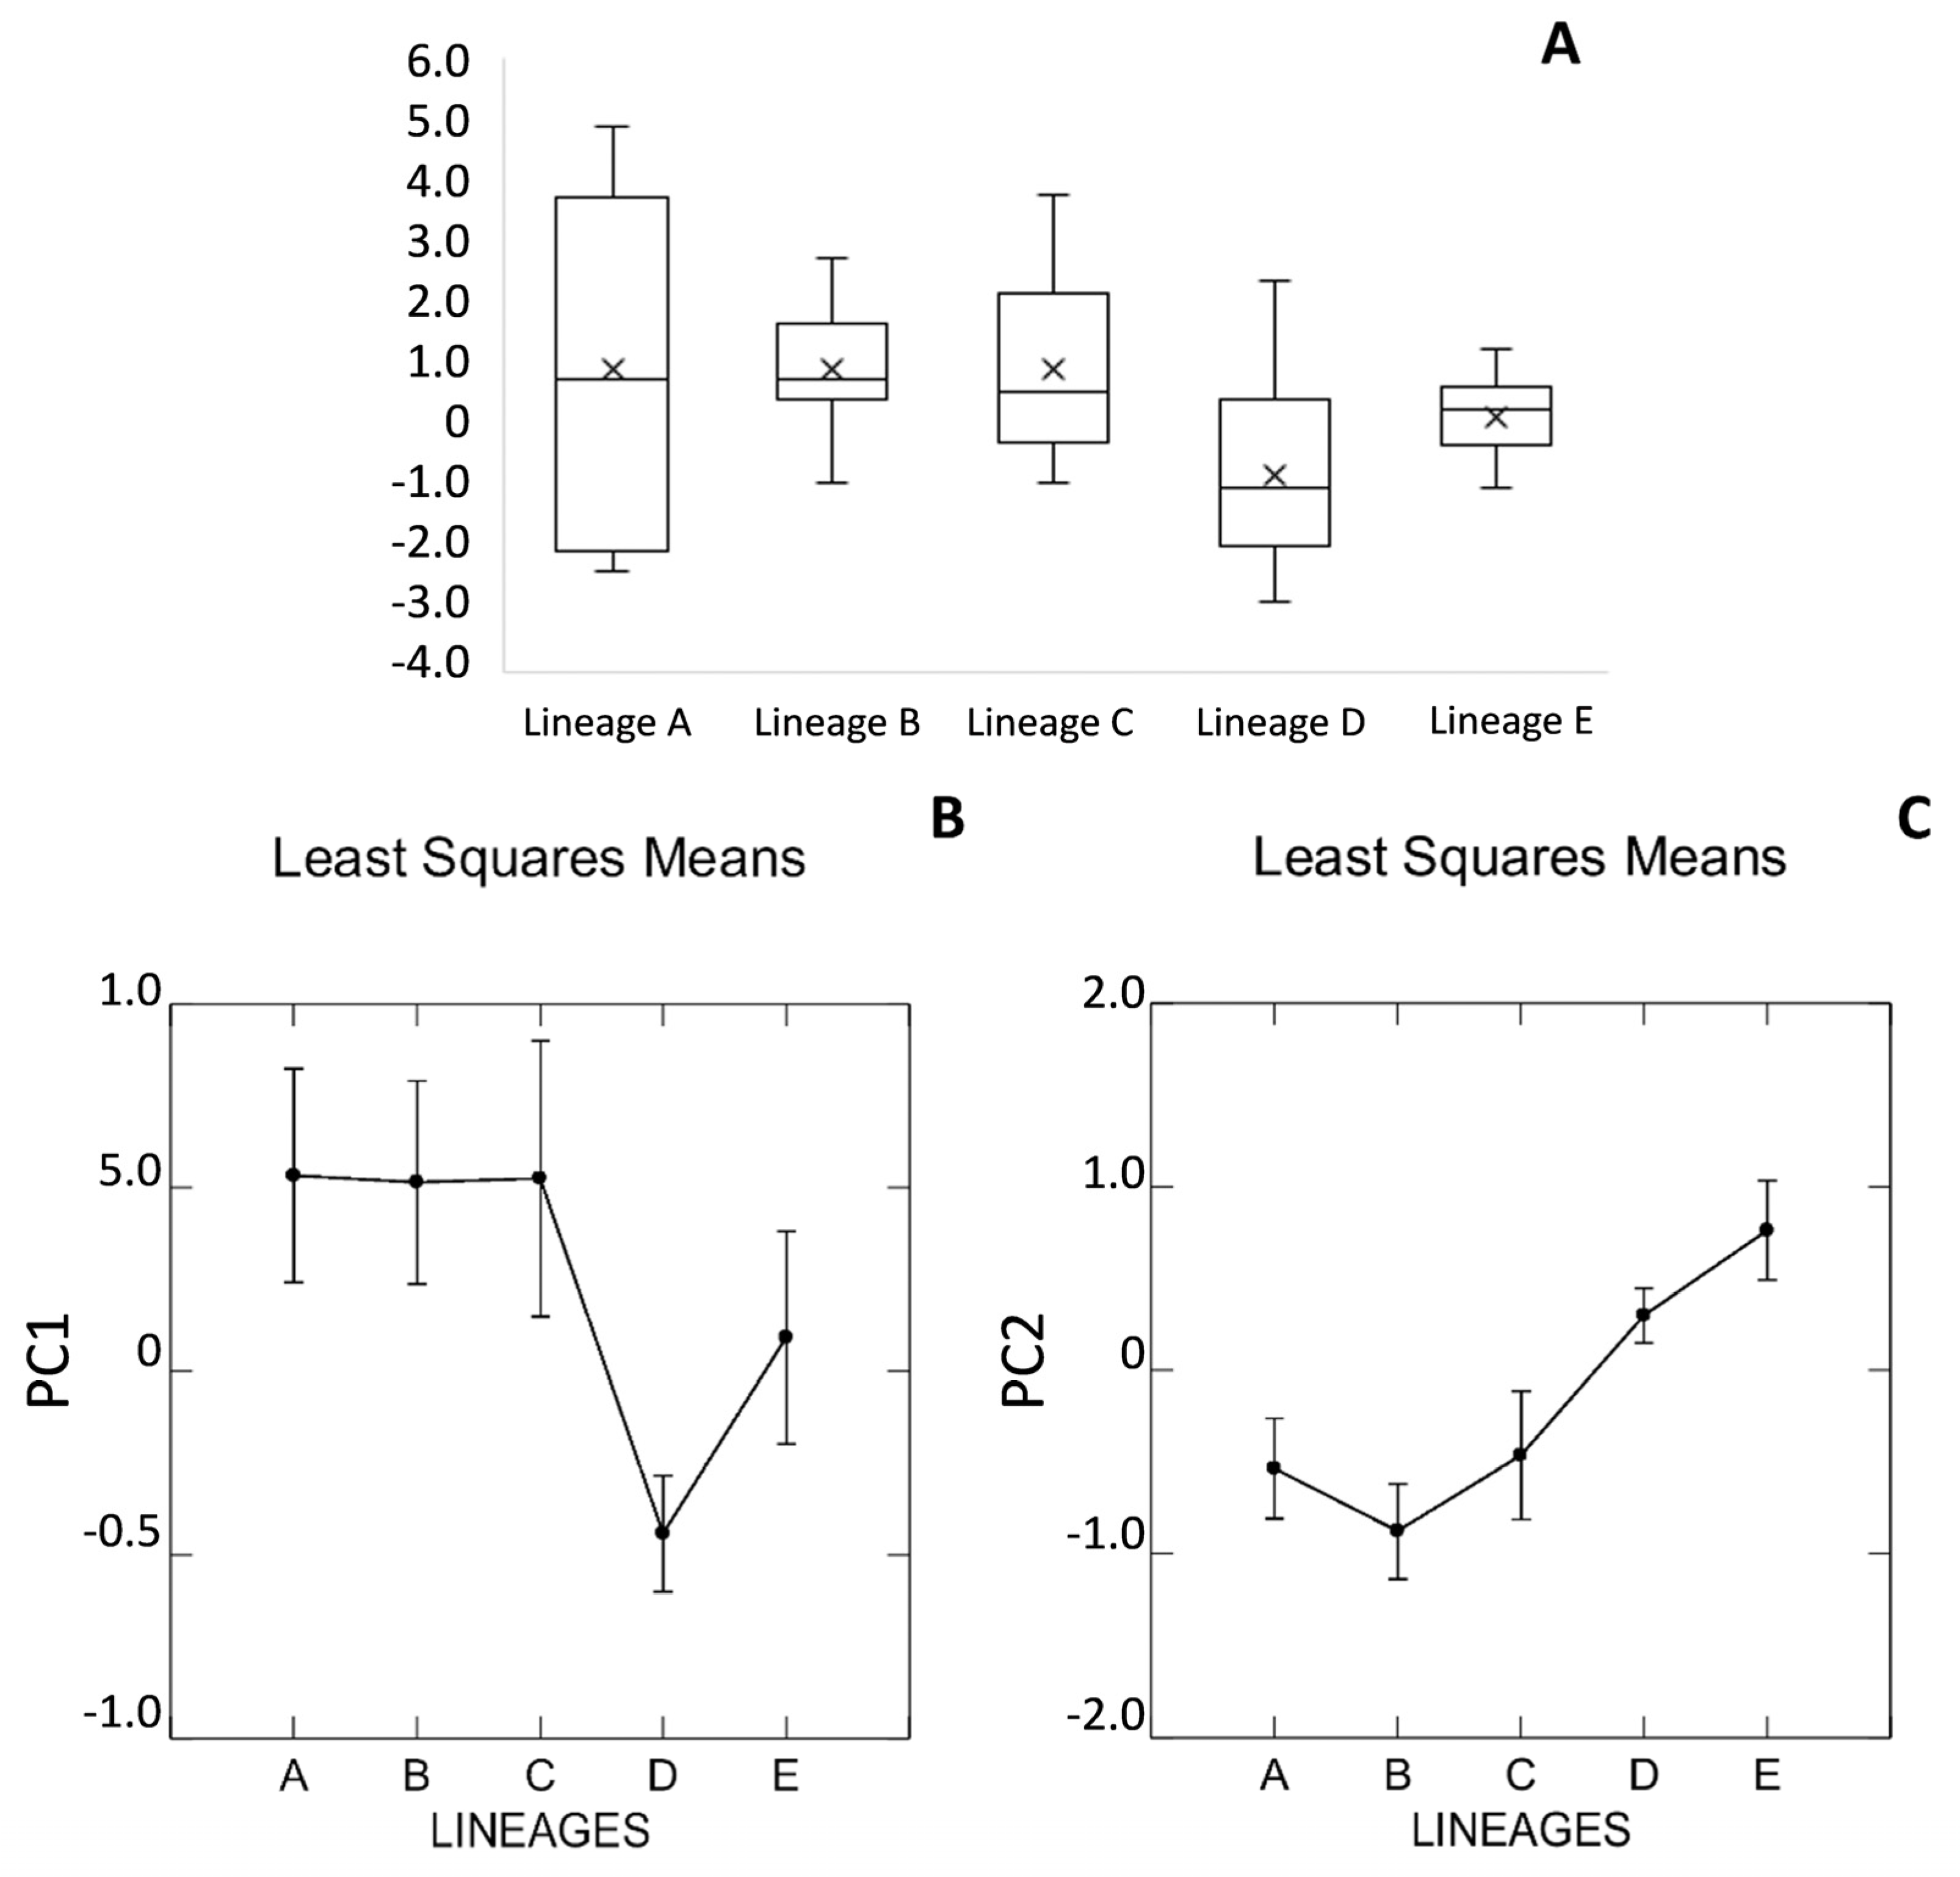
The random forest analysis showed a great distinction between the two types of advertisement calls, call I and call II, of the analyzed specimens (Figure 3), mainly in terms of note duration and number of pulses. Call I was observed in specimens assigned to Lineages A, B, C and E, including topotypes of D. nanus. Call II was observed in topotypes of D. walfordi and in other specimens also assigned to Lineage D.
In call I, the introductory notes differed from the secondary notes in amplitude modulation and all acoustic variables, except dominant frequency (Table 2). Additionally, the last pulse of type B notes was longer than the other pulses (Figure 2). Because these notes were so different, we describe this advertisement call as composed of an introductory note (type A notes) followed by secondary notes (type B notes) repeated in series. In call II, the introductory notes differed from the secondary notes only in note duration and pulse number (Table 2) but not in any other acoustic parameters or amplitude modulation (Figure 2). As such, we considered that call II is composed of a single type of note emitted in series.
In a comparison between calls I and II, we noticed that both the introductory and the secondary notes of call I differed statistically from the notes of call II (Table 3).

3.5. Morphology

We did not identify any remarkable morphological characteristics that could differentiate the five major lineages recognized in the DNA-based analyses. Even topotypes of D. nanus and topotypes of D. walfordi were very similar in external morphology (Figure 4). Body color and distribution of dorsal spots varied among the analyzed specimens, even among those collected from the type locality of D. nanus (Figure 5 A(A–E)) and among the topotypes of D. walfordi (Figure 5 B(C–I)). In general, the analyzed specimens had a brown to yellow dorsal coloration with multiple spots, which were distributed from the posterior part of the head toward the sacral region (Figure 5). However, these spots were absent or barely visible in some individuals. As such, the qualitative analysis of morphology did not allow us to differentiate the individuals of the five genetic lineages.
On the other hand, morphometric data allowed us to detect morphological variation among lineages, especially between Lineages D and E, and between them and Lineages A, B, and C. Male SVL varied significantly among lineages (F4.73 = 6.17; p < 0.001), as Lineage A differed from Lineages B (p = 0.002) and C (p = 0.004), and Lineage C differed from Lineage E (p = 0.027) (Figure S7). Based on morphometric ratios (Table S3), PCA explained 58% of the data variation (Figure 6), with the first axis explaining 35% and the second axis explaining 23% of the data variation. PC1 showed a partial differentiation between individuals of Lineages D and E. The more important morphometric ratios that explained the variation captured by PC1 were, in descending order of importance, the relative foot length (FL/SVL), hand length (HAL/SVL), thigh length (TL/SVL) and head width (HW/SVL). PC2 evidenced two groups, one constituted by individuals of Lineages A, B and C in the upper quadrants, and another constituted by Lineages D and E in the lower quadrants. The variation captured by PC2 was explained by the ratios foot length/thigh length (FL/TL) and shank length/foot length (SL/FL) (Table 4).
Individuals of Lineages A, B and C presented greater relative foot length, smaller relative shank length and smaller head width than individuals of Lineages D (which included topotypes of D. walfordi) and E (which included topotypes of D. nanus). Individuals of Lineages D and E presented a morphological overlap, but the centroids of each lineage differed in position in the biplot: the centroid of Lineage E was in the lower right quadrant, and the centroid of Lineage D was in the lower left quadrant (Figure 6). These different positions of the centroids indicate some morphological differentiation between these lineages, as individuals of Lineage D presented smaller relative foot, hand and tight lengths and smaller head widths than those of Lineage E (Figure 6; Table 4). The distribution of PC1 scores for individuals of each genetic lineage (Figure 7A) evidenced the same results: a great overlap among Lineages A, B, C and E and a differentiation between individuals of Lineage D (which includes topotypes of D. walfordi) and Lineage E (which includes topotypes of D. nanus). In fact, individuals of Lineage D tended to differ morphometrically from those of all the remaining lineages. The results from ANOVAs confirmed the morphological pattern that we observed in PCA. In both analyses, with PC1 and PC2, we found no morphological difference among individuals of lineages A, B and C, but those from lineages D and E differed from each other and from the other lineages (Figure 7B,C).

4. Discussion

In all our phylogenetic inferences, the specimens assigned to the D. nanusD. walfordi species complex were grouped into five major clades (Lineages A–E), which exhibited nonoverlapping geographic distributions. Both the ABGD and bPTP analyses supported the existence of five independently evolving lineages in this complex, which coincided with the aforementioned Lineages A–E.
When analyzing the 16S gene fragment proposed by Vences et al. [61,62] and Fouquet et al. [4] as a good marker for amphibian barcoding, we found low genetic distances (1.0–1.9%) between the five lineages of the D. nanusD. walfordi complex. In contrast, when we analyzed the COI fragment, most of the lineages were differentiated from each other by genetic distances higher than 6%, which is the threshold suggested by Lyra et al. [26] to distinguish valid species. Lower distances in COI were found only between Lineages A and B (4%) and between Lineages C and D (3.9). According to Lyra et al. [26], 3% divergence in the 16Sar-16Sbr fragment (which was proposed as the threshold for flagging candidate species [4]) corresponds to approximately 6% in the COI fragment. In our group of interest, the divergence values of approximately 6% observed for the COI fragment (6.7%) corresponded to 1.9% in the 16S fragment, which is much below the 3% threshold value.
We also noticed that in the D. nanusD. walfordi complex, the rate of change in the 16Sar-16Sbr fragment was lower than that observed for an extended fragment that included almost the entire 16S rRNA gene, the tRNA-val gene and part of the 12S rRNA gene. Based on this partial H1 fragment, the distances estimated between the five lineages varied from 1.7 to 3.1%, with only the distance between Lineages A and B being under 2.4% (see Table 1). These values were similar to those found by Guarnizo et al. [6] between species of the Dendropsophus labialis group (D. luddeckei, D. labialis and D. meridensis) using the H1 fragment, which varied from 2.2 to 2.8%. The genetic divergence inferred from DNA sequences helped Guarnizo and colleagues describe D. luddeckei, which is morphologically cryptic in relation to D. labialis, although differs from it in acoustic traits. It is worth mentioning that if only the end of the 16S gene is analyzed, the estimated genetic distance between the three valid species analyzed by Guarnizo et al. [6] varies from 1.3% to 2.5% (Table S4). Therefore, at least for the analysis of Dendropsophus species, it is not only the 16Sar-16Sbr fragment but also the H1 fragment that seems to be informative. Additionally, the analysis of this larger fragment showed high variability between Lineages A to E of the D. nanusD. walfordi complex. The topotypes of D. walfordi and D. nanus were recovered within Lineage D and Lineage E, respectively, between which the average genetic distance for COI was high (7.2%) and that of the H1 fragment was 2.5%, which was very similar to that used by Guarnizo et al. [6] to distinguish D. luddeckei from D. labialis.
A further point to note is that the specimen from Taperinha, which is the type locality of Dendropsophus minimus (Ahl, 1933) [20], was recovered in Lineage D, together with topotypes of D. walfordi. The analyzed specimen from Taperinha may be assigned to D. minimus according to the original description of this species, but we have to take into account that D. minimus was briefly described based solely on the holotype [20] and, moreover, that the species in the D. microcephalus group are morphologically very similar to each other. Therefore, although we suspect that D. walfordi is in fact a junior synonym of D. minimus, further analyses of additional individuals from Taperinha are still necessary to properly assess this question.
In an attempt to better evaluate the taxonomic status of Lineages A–E, we compared all these lineages with respect to acoustic and morphological features. Such an integrative approach is particularly relevant in this case because the genetic distinctiveness among the five lineages is not high (see discussion about genetic distances above), although they support the recognition of five species (as inferred from the bPTP and ABGD tests).
The analysis of the advertisement call revealed important differences between Lineages D and E. The advertisement call of D. walfordi topotypes and other specimens recovered in Lineage D had notes with similar acoustic features (except for note duration and number of pulses) and similar amplitude modulation. On the other hand, the call of the remaining specimens (Lineages A, B, C and E), including the D. nanus topotypes, had two types of notes (notes A and B), which differed from each other in terms of amplitude modulation and other acoustic traits (e.g., note duration). The analyses of morphometric ratios showed great similarity among Lineages A, B and C and the differentiation of Lineages D and E. Interestingly, most of the variation among these groups was due to individuals of Lineage D. This is because males of Lineage D tend to have shorter thighs, foot and hand lengths than those of Lineage E and smaller relative foot lengths and greater relative shank lengths than those of Lineages A, B and C.
The advertisement call is subjected to different neutral and selective pressures that drive speciation in anurans, such as random drift and sexual selection [63,64], and has even supported the description of cryptic species (e.g., [65,66]). As such, the acoustic differences that discriminate Lineage D from the other genetic lineages were of fundamental importance to help us recognize Dendropsophus walfordi (Lineage D) as a valid species distinct from D. nanus.
Once Lineage D corresponds to D. walfordi, we proceeded to analyze the remaining lineages, as the simple assignment of specimens from Lineages A–C and E to D. nanus would render D. nanus paraphyletic with respect to D. walfordi (see Figure 1). The advertisement call of specimens included in Lineage C, which is the sister group to Lineage D (assigned to Dendropsophus walfordi), was similar to that presented by the topotypes of D. nanus (included in Lineage E). However, the morphometric analyses distinguished Lineages D and E, and the ABGD and bPTP analyses suggested that they represent distinct species, with a high genetic distance being observed between them (2.5% for the H1 fragment and 7.2% for COI). The neighbor-joining analysis of the 16Sar-16Sbr fragment showed high similarity between Lineage C and specimens from Bolivia referred to as Dendropsophus nanus A by Jansen et al. [11] and Schulze et al. [12]. The Bolivian specimens referred to as Dendropsophus cf. nanus by those authors were clustered within our Lineage D (D. walfordi). Jansen et al. [11] and Schulze et al. [12] recognized differences between D. nanus A and D. cf. nanus, especially in their tadpoles and advertisement calls, which reinforced the divergence between these groups. Taking these data together, to avoid paraphyly between D. nanus and D. walfordi, we propose that Lineage C identified herein is considered an unconfirmed candidate species until further studies are performed. Our morphometric analysis agrees with this proposal, as specimens of Lineage C differ from individuals of Lineage D by presenting a narrower head and, consequently, a smaller tympanum distance, characteristics that make them more similar to individuals of Lineages A and B.
In accordance with morphometric analysis, the advertisement calls of the specimens included in Lineages A and B were also similar to those presented by the topotypes of D. nanus (included in Lineage E), but the taxonomic assignment of the specimens included in Lineages A and B should be considered with caution.
A remarkable finding that must be noted when considering Lineages B and E is the discontinuous genetic variation observed between specimens from Telêmaco Borba in the Brazilian state of Paraná (clustered within Lineage E) and Lençóis Paulista in the Brazilian state of São Paulo (clustered within Lineage B). Geographically, these two sites are very close, being only 266 km apart from each other. However, the genetic distance inferred from the COI fragment between specimens collected from these localities was 7% (which is above the threshold for flagging candidate species [26]). Additionally, the genetic variation within each of these lineages was very low (up to 0.7% for the H1 fragment and 1.4% for COI), although some specimens included in the same lineage came from very distant sites, with distances of up to 2090 km for Lineage B and 902 km for Lineage E.
The area that separates Lineages B and E coincides with an ancient fault zone known as the Guapiara lineament (see Figure 1). Genetic breaks coincident with the Guapiara lineament have been reported for many groups, such as the toad Rhinella crucifer [67], the bee Melipona quadrifasciata [68] and the wasps Synoeca cyanea and Synoeca aff. septentrionalis [69]. In our analyses, the split between the most recent common ancestral (MRCA) of Lineages B and A and the MRCA of Lineages C–E was estimated to have occurred ~5 mya. The Guapiara lineament may have played a role in such divergence, as this fault, despite being active mainly during the Mesozoic, had its most recent movement dated to the Quaternary (<1.6 mya) [70]. In this context, it is also noteworthy that in our phylogenetic analyses, Lineage E, which is distributed south of the Guapiara lineament, is more closely related to the clade (Lineage C, Lineage D), which is widespread in the Amazon basin, than to Lineage B, which occurs north of the Guapiara lineament. This result is consistent with previous studies that show close phylogenetic relationships between species from the Amazonian and southern Atlantic Forests and support past contact between these areas [71,72,73].
Another event that may have influenced the early divergence between the MRCA of Lineages B and A and the MRCA of Lineages C–E is the uplift of the central Brazil Plateau, as the last stage of this geological event was estimated to have occurred ~5 mya [74]. At last, the marine regression in South America dated to late Miocene–early Pliocene, which deeply changed the exposed continental area [75], may also have played a role in the evolution of this group. Both the uplift of the central Brazil Plateau and the marine regression of the Paranaense sea were previously invoked to explain the origin of two clades of snakes of the Bothropsneuwiedi group: the East–West clade, which occurs from midwestern to northeastern Brazil, and the West–South clade, distributed from midwestern to southeastern Brazil [76]. It is worth noting that the geographical distributions of these clades resemble, respectively, the distribution areas of Lineages A and B and Lineages C–E of the D. nanusD. walfordi complex.
Further analyses, which should include nuclear markers, are still needed to assess the phylogeographic issues regarding the lineages in the study, but until they are available and based on the discussion above, we advocate that specimens of Lineage B should not be assigned to D. nanus.

4.1. Comments on Advertisement Call

Here, we have described the call of Dendropsophus walfordi for the first time, based on the analysis of specimens from six localities, including the type locality. Although morphological differences are subtle between these species, the advertisement call of D. walfordi can be clearly distinguished from that of D. nanus, which is composed of two distinct note types. This finding is especially important because call differentiation can cause and maintain reproductive isolation between species [63,64,77]. The pronounced differences in the advertisement calls that we found between D. nanus and D. walfordi may play a crucial role in the differentiation of these closely related species.
In the D. microcephalus group, monophasic calls with differences in note duration between the first and the following notes of the series, as described here for D. walfordi, were previously reported for D. joannae [78] and D. juliani [79]. Even though these notes are relatively similar, slight differences in temporal and spectral features of call notes are known to produce neurological responses in conspecific females [80]. Therefore, these subtle differences between notes should be investigated in further studies to help us better understand the intraspecific communication among anurans and the evolution of variation between notes in the advertisement call.
In addition to D. nanus, seven other species of the D. microcephalus group (D. anataliasiasi [81], D. gryllatus [82], D. microcephalus [53], D. rhodopeplus [83], D. phlebodes, D. robertmertensi and D. sartori [84]) exhibit advertisement calls composed of two note types. However, none of these seven species had differences in the modulation of the amplitude between the two types of notes, as observed in D. nanus.
The measurements presented here for the advertisement call of D. nanus are in accordance with those described by Martins and Jim [60] for a population from the Municipality of Botucatu, state of São Paulo, Brazil, and by Teixeira et al. [16] for topotypical specimens. Basso et al. [85] examined calls from Argentinian specimens, and Márquez et al. [86] performed an analysis of specimens from Bolivia and did not recognize the two different types of notes in the call of D. nanus. However, our measurements of the spectral and temporal traits of the D. nanus call encompass those presented by these authors.
For some species of the D. microcephalus group, both notes of the advertisement call seem to be important for conspecific interactions. It was previously reported that males of D. nanus, D. ebraccatus, D. microcephalus and D. phlebodes emit introductory notes in response to interactions between males [87,88,89]. In the case of D. nanus, for example, the introductory notes are related to the spacing between males when in aggregations [48]. Introductory notes may also be important for attracting females. Males of D. ebraccatus emit these notes in response to the approach of non-calling specimens [90] and males of D. nanus emit notes similar to the A notes of the advertisement call in the courtship call [16]. Secondary notes can also influence interactions between males [87,88,89] and may be important for attracting females. For instance, females of D. ebraccatus, D. microcephalus, and D. phlebodes prefer complex calls composed of either introductory or aggressive notes followed by secondary notes [87,88,89]. However, although all these intraspecific interactions have been studied for D. ebraccatus, D. microcephalus and D. phlebodes, the particular function of each note of the advertisement call of D. nanus and other species of the D. microcephalus group remains unclear and should therefore be tested. Such studies are necessary because they can help us better understand the selective forces that result in differentiation between call notes as well as the role of call divergence in the evolution of the D. nanus–D. walfordi species complex.

4.2. Comments on Cytogenetic Data

Cytogenetic data have been very useful in studies about Dendropsophus since this genus was resurrected to accommodate the Neotropical hylid species known or suspected to have a diploid chromosome number 2n = 30 [38]. This diploid chromosome number was confirmed as a synapomorphy for Dendropsophus [91] and the number of telocentric chromosomes has been useful for interspecific comparisons [13,92]. In some cases, classical cytogenetic techniques have revealed interesting interspecific differences (such as in the case of D. nanus and D. sanborni, which differ in the number of telocentric chromosomes [13]), although in others, the cytogenetic data do not help to distinguish between valid species (such as in the case of D. jimi and D. sanborni). Moreover, in some cases, cytogenetic differences were revealed only after the employment of molecular cytogenetic techniques, as observed for D. seniculus and D. soaresi, whose karyotypes could be differentiated by the presence of het-ITSs (heterochromatic internal telomeric sequences) exclusively in the D. soaresi karyotype [92].
Cytogenetic information based on classical cytogenetic techniques is available in the literature for several specimens assigned to D. nanus or D. walfordi ([13] and references therein). Some of the sampled sites and even some of the specimens cytogenetically analyzed by Medeiros et al. [13] were included in our present work, which allowed us to note that cytogenetic data are available in the literature for Lineages B, D and E of the D. nanus–D. walfordi species complex. No cytogenetic differences were noted among these lineages, as all the described karyotypes had 30 chromosomes, heterochromatic bands restricted to centromeric regions and NOR located in the long arm of chromosome 13 [13]. The same karyotype was found in specimens from Lineage A (data not shown). This similarity, however, does not contradict our taxonomic decisions since distinct species do not necessarily have distinct karyotypes, as already pointed out above. For the D. nanus–D. walfordi species complex, only a few cytogenetic markers are available, and further molecular cytogenetic studies are still needed.

5. Conclusions

Five independent genetic lineages in the D. nanus–D. walfordi species complex (or D. nanusD. minimus, if our hypothesis in the first part of the Discussion is correct) with nonoverlapping geographical distributions were recovered in our study. The advertisement call of the specimens included in Lineage E was distinguished from that of the specimens allocated to Lineage D, leading to the recognition of D. nanus and D. walfordi. In addition to these two species, up to three unnamed cryptic species are suspected to exist in the studied group.

Supplementary Materials

The following are available online at https://0-www-mdpi-com.brum.beds.ac.uk/article/10.3390/d13110522/s1. Figure S1: Maximum parsimony tree inferred from the H1 and COI fragments. Figure S2: Bayesian topology inferred from the H1 and COI fragments. Figure S3: Divergence time estimates for the Dendropsophus microcephalus group. The numbers on the nodes are the average divergence with the 95% highest posterior density (95% HPD). The corresponding timescale is shown below the cladogram. Figure S4: Neighbor-joining topology based on the matrix constructed with the 16Sar-16Sbr fragment (Matrix 2; 457 bp). We did not include the GenBank sequence JF790086 because it apparently contains sequencing errors. Figure S5: Haplotype network inferred by median joining based on H1 and COI sequences. Figure S6: Delimitation of independently evolving lineages estimated in the maximum likelihood solution of bPTP analysis. Numbers on the branches indicate posterior delimitation probabilities. Figure S7: Variation in size among males of Lineages A–E of Dendropsophus. Box plot of SVL of adult males assigned to the five Dendropsophus lineages recognized in our study. Table S1: Specimens used in each analysis of this study, their locality and voucher number and the identification of the tissue samples used to obtain nucleotide sequences (in bold) or accession number of nucleotide sequences previously available in GenBank. Table S2: Advertisement call values (mean ± standard deviation) obtained from 160 specimens of Lineages A–C,E, including the topotype of D. nanus (*), and six specimens of Lineage D, including the topotype of D. walfordi (**). Table S3: Morphometric values (mean ± standard deviation) obtained from 37 specimens of Lineages A–C,E, including the topotype of D. nanus (*), and 34 specimens of Lineage D, including the topotype of D. walfordi (**). Table S4: Uncorrected p-distances (%) estimated from the 16Sar-16Sbr fragment between the lineages of the D. nanus–D. walfordi species complex recognized in this work (Lineages A–E) and the Dendropsophus species analyzed by Guarnizo et al. (2012).

Author Contributions

All the authors contributed to the development of this work. K.R.S. acquired most of the DNA sequences and conducted all the phylogenetic analyses. L.B.L. conceived the study, acquired some of the DNA sequences and helped in the phylogenetic analyses. B.F.d.V.T., A.A.G., D.d.C.R.-F., G.V.A., A.P.L. and F.S.A. conducted the acoustic and morphological analyses. K.R.S., D.d.C.R.-F. and L.B.L. drafted the manuscript. All authors have read and agreed to the published version of the manuscript.

Funding

This research was funded by the Brazilian agencies Coordenação de Aperfeiçoamento de Pessoal de Nível Superior—Programa de Apoio à Pós-Graduação (CAPES-PROAP), Fundação de Amparo à Pesquisa do Estado de São Paulo (FAPESP #2010/12600-4) and Conselho Nacional de Desenvolvimento Científico e Tecnológico (CNPq #446935/2014-0, #300903/2015-4, #305169/2019-0 and # 302328/2017-3). CAPES provided fellowships to K.R.S. (1143326) and B.F.d.V.T. (Finance Code 001).

Institutional Review Board Statement

The study was conducted according to the guidelines of and approved by Committee for Ethics in Animal Use of the University of Campinas (CEUA/UNICAMP; protocol code 3453-1/08 September 2014).

Data Availability Statement

The DNA sequences we generated during the study is available in GenBank and their accession numbers are provided in Table S1.

Acknowledgments

The authors thank Célio Fernando Baptista Haddad, Diego Baldo, and Victor Zaracho for the loan of tissues; Mariana Lyra, who kindly provided the primers for the COI fragment; André Pansonato, for his help in collecting and recording specimens; Itamar Alves Martins, for helping discriminate some advertisement calls; and the following scientific collections or museums: AAG-UFU, CFBH, DZSJRP, INPA-H MLP DB, MNK, MTR, MZUSP, SMRP, ZUEC and ZUFG.

Conflicts of Interest

The authors declare no conflict of interest. The funders had no role in the design of the study; in the collection, analyses, or interpretation of data; in the writing of the manuscript; or in the decision to publish the results.

References

  1. Wiens, J.J.; Penkrot, T.A. Delimiting species using DNA and morphological variation and discordant species limits in spiny lizards (Sceloporus). Syst. Biol. 2002, 51, 69–91. [Google Scholar] [CrossRef]
  2. De Queiroz, K. The general lineage concept of species, species criteria, and the process of speciation: A conceptual unification and terminological recommendations. In Endless Forms: Species and Speciation; Howard, D.J., Berlocher, S.H., Eds.; Oxford University Press: Oxford, UK, 1998; pp. 57–75. [Google Scholar]
  3. Bruschi, D.P.; Lucas, E.M.; Garcia, P.C.; Recco-Pimentel, S.M. Molecular and morphological evidence reveals a new species in the Phyllomedusa hypochondrialis group (Hylidae, Phyllomedusinae) from the Atlantic Forest of the highlands of southern Brazil. PLoS ONE 2014, 9, e105608. [Google Scholar]
  4. Fouquet, A.; Noonan, B.P.; Blanc, M.; Orrico, V.G.D. Phylogenetic position of Dendropsophus gaucheri (Lescure and Marty 2000) highlights the need for an in-depth investigation of the phylogenetic relationships of Dendropsophus (Anura: Hylidae). Zootaxa 2011, 3035, 59–67. [Google Scholar] [CrossRef] [Green Version]
  5. Funk, W.C.; Caminer, M.; Ron, S.R. High levels of cryptic species diversity uncovered in Amazonian frogs. Proc. R. Soc. B Biol. Sci. 2012, 279, 1806–1814. [Google Scholar] [CrossRef] [Green Version]
  6. Guarnizo, C.E.; Escallón, C.; Cannatella, D.; Amézquita, A. Congruence between acoustic traits and genealogical history reveals a new species of Dendropsophus (Anura: Hylidae) in the high Andes of Colombia. Herpetologica 2012, 68, 523–540. [Google Scholar] [CrossRef]
  7. Cocca, W.; Andreone, F.; Belluardo, F.; Rosa, G.M.; Randrianirina, J.E.; Glaw, F.; Crottini, A. Resolving a taxonomic and nomenclatural puzzle in mantellid frogs: Synonymization of Gephyromantis azzurrae with G. corvus, and description of Gephyromantis kintana sp. nov. from the Isalo Massif, western Madagascar. ZooKeys 2020, 951, 133–157. [Google Scholar] [CrossRef] [PubMed]
  8. Padial, J.M.; Miralles, A.; De la Riva, I.; Vences, M. The integrative future of taxonomy. Front. Zool. 2010, 7, 16. [Google Scholar] [CrossRef] [PubMed]
  9. Boulenger, G. On a collection of batrachians made by Prof. Charles Spegazzini at Colonia Resistencia, South Chaco, Argentine Republic. Ann. Mus. Civ. Stor. Nat. Genova Ser. 2 1889, 7, 246–249. [Google Scholar]
  10. Bokermann, W. Nova espécie de Hyla de Rondônia, Brasil (Amphibia, Salientia). Atas Soc. Biol. Rio Jan. 1962, 6, 52–55. [Google Scholar]
  11. Jansen, M.; Bloch, R.; Schulze, A.; Pfenninger, M. Integrative inventory of Bolivia’s lowland anurans reveals hidden diversity. Zool. Scr. 2011, 40, 567–583. [Google Scholar] [CrossRef]
  12. Schulze, A.; Jansen, M.; Köhler, G. Tadpole diversity of Bolivia’s lowland anuran communities: Molecular identification, morphological characterisation, and ecological assignment. Zootaxa 2015, 4016, 1–111. [Google Scholar] [CrossRef] [Green Version]
  13. Medeiros, L.R.; Lourenço, L.B.; Rossa-Feres, D.C.; Lima, A.P.; Andrade, G.V.; Giaretta, A.A.; Egito, G.T.; Recco-Pimentel, S.M. Comparative cytogenetic analysis of some species of the Dendropsophus microcephalus group (Anura, Hylidae) in the light of phylogenetic inferences. BMC Genet. 2013, 14, 59. [Google Scholar] [CrossRef] [Green Version]
  14. Lutz, B. Brazilian Species of Hyla, 1st ed.; University of Texas Press: Austin, TX, USA, 1973; pp. 1–265. [Google Scholar]
  15. Langone, J.; Basso, N. Distribución geográfica y sinonimia de Hyla nana Boulenger, 1889 y de Hyla sanborni Schmidt, 1944 (Anura, Hylidae) y observaciones sobre formas afines. Comun. Zoológicas Mus. Hist. Nat. Montev. 1987, 11, 1–17. [Google Scholar]
  16. Teixeira, B.F.V.; Zaracho, V.H.; Giaretta, A.A. Advertisement and courtship calls of Dendropsophus nanus (Boulenger, 1889)(Anura: Hylidae) from its type locality (Resistencia, Argentina). Biota Neotrop. 2016, 16, e20160183. [Google Scholar] [CrossRef] [Green Version]
  17. De la Riva, I.; Márquez, R.; Bosch, J. Description of the advertisement calls of some South American Hylidae (Amphibia: Anura): Taxonomic and methodological consequences. Bonn. Zool. Beitr. 1997, 47, 175–186. [Google Scholar]
  18. De la Riva, I.; Köhler, J.; Lötters, S.; Reichle, S. Ten years of research on Bolivian amphibians: Updated checklist, distribution, taxonomic problems, literature and iconography. Rev. Española Herpetol. 2000, 14, 19–164. [Google Scholar]
  19. Frost, D.R. Amphibian Species of the World: An Online Reference, Version 6.1; American Museum of Natural History: New York, NY, USA; Available online: http://research.amnh.org/herpetology/amphibia/index.html (accessed on 10 February 2020).
  20. Ahl, E. Über einige neue Frösche aus Brasilien. Zool. Anz. 1933, 104, 25–30. [Google Scholar]
  21. Orrico, V.G.; Grant, T.; Faivovich, J.; Rivera-Correa, M.; Rada, M.A.; Lyra, M.L.; Cassini, C.S.; Valdujo, P.H.; Schargel, W.E.; Machado, D.J.; et al. The phylogeny of Dendropsophini (Anura: Hylidae: Hylinae). Cladistics 2021, 37, 73–105. [Google Scholar] [CrossRef]
  22. Graybeal, A. Phylogenetic relationships of bufonid frogs and tests of alternate macroevolutionary hypotheses characterizing their radiation. Zool. J. Linn. Soc. 1997, 119, 297–338. [Google Scholar] [CrossRef]
  23. Titus, T.A. A phylogenetic Analysis of the Desmognathinae (Caudata: Plethodontidae): Evolutionary Patterns Inferred from Mitochondrial DNA Sequences. Ph.D. Thesis, University of Kansas, Lawrence, KS, USA, 1992. [Google Scholar]
  24. Feller, A.E.; Hedges, S.B. Molecular evidence for the early history of living amphibians. Mol. Phylogenetics Evol. 1998, 9, 509–516. [Google Scholar] [CrossRef] [PubMed] [Green Version]
  25. Palumbi, S.; Martin, A.; Romano, S.; McMillan, W.; Stice, L.; Grabowski, G. The Simple Fool’s Guide to PCR, Version 2.0; Department of Zoology and Kewalo Marine Laboratory, University of Hawaii: Honolulu, HI, USA, 1991; Available online: http://palumbilab.stanford.edu/SimpleFoolsMaster.pdf (accessed on 12 July 2020).
  26. Lyra, M.L.; Haddad, C.F.; de Azeredo-Espin, A.M.L. Meeting the challenge of DNA barcoding Neotropical amphibians: Polymerase chain reaction optimization and new COI primers. Mol. Ecol. Resour. 2017, 17, 966–980. [Google Scholar] [CrossRef]
  27. Hedges, S.B. Molecular evidence for the origin of birds. Proc. Natl. Acad. Sci. USA 1994, 91, 2621–2624. [Google Scholar] [CrossRef] [PubMed] [Green Version]
  28. Hall, T.A. BioEdit: A user-friendly biological sequence alignment editor and analysis program for Windows 95/98/NT. Nucleic Acids Symp. Ser. 1999, 41, 95–98. [Google Scholar]
  29. Edgar, R.C. MUSCLE: Multiple sequence alignment with high accuracy and high throughput. Nucleic Acids Res. 2004, 32, 1792–1797. [Google Scholar] [CrossRef] [PubMed] [Green Version]
  30. Goloboff, P.; Farris, J.; Nixon, K. TNT: Tree Analysis Using New Technologies. 2003. Available online: http://www.zmuc.dk/public/phylogeny (accessed on 12 July 2020).
  31. Ronquist, F.; Teslenko, M.; Van Der Mark, P.; Ayres, D.L.; Darling, A.; Höhna, S.; Larget, B.; Liu, L.; Suchard, M.A.; Huelsenbeck, J.P. MrBayes 3.2: Efficient Bayesian phylogenetic inference and model choice across a large model space. Syst. Biol. 2012, 61, 539–542. [Google Scholar] [CrossRef] [PubMed] [Green Version]
  32. Felsenstein, J. Confidence limits on phylogenies: An approach using the bootstrap. Evolution 1985, 39, 783–791. [Google Scholar] [CrossRef]
  33. Nylander, J. MrModeltest v2. Program Distributed by the Author; Evolutionary Biology Centre, Uppsala University: Uppsala, Sweden, 2004. [Google Scholar]
  34. Rambaut, A.; Suchard, M.A.; Xie, D.; Drummond, A.J. Tracer v.1.6. 2015. Available online: http://beast.bio.ed.ac.uk/Tracer (accessed on 13 September 2020).
  35. Drummond, A.J.; Suchard, M.A.; Xie, D.; Rambaut, A. Bayesian phylogenetics with BEAUti and the BEAST 1.7. Mol. Biol. Evol. 2012, 29, 1969–1973. [Google Scholar] [CrossRef] [Green Version]
  36. Lemmon, E.M.; Lemmon, A.R.; Cannatella, D.C. Geological and climatic forces driving speciation in the continentally distributed trilling chorus frogs (Pseudacris). Evolution 2007, 61, 2086–2103. [Google Scholar] [CrossRef]
  37. Fouquet, A.; Gilles, A.; Vences, M.; Marty, C.; Blanc, M.; Gemmell, N.J. Underestimation of species richness in Neotropical frogs revealed by mtDNA analyses. PLoS ONE 2007, 2, e1109. [Google Scholar] [CrossRef]
  38. Faivovich, J.; Haddad, C.F.; Garcia, P.C.; Frost, D.R.; Campbell, J.A.; Wheeler, W.C. Systematic review of the frog family Hylidae, with special reference to Hylinae: Phylogenetic analysis and taxonomic revision. Bull. Am. Mus. Nat. Hist. 2005, 2005, 1–240. [Google Scholar] [CrossRef] [Green Version]
  39. Tamura, K.; Stecher, G.; Peterson, D.; Filipski, A.; Kumar, S. MEGA6: Molecular evolutionary genetics analysis version 6.0. Mol. Biol. Evol. 2013, 30, 2725–2729. [Google Scholar] [CrossRef] [PubMed] [Green Version]
  40. Excoffier, L.; Smouse, P.E.; Quattro, J.M. Analysis of molecular variance inferred from metric distances among DNA haplotypes: Application to human mitochondrial DNA restriction data. Genetics 1992, 131, 479–491. [Google Scholar] [CrossRef] [PubMed]
  41. Kimura, M. A simple method for estimating evolutionary rates of base substitutions through comparative studies of nucleotide sequences. J. Mol. Evol. 1980, 16, 111–120. [Google Scholar] [CrossRef] [PubMed]
  42. Bandelt, H.-J.; Forster, P.; Röhl, A. Median-joining networks for inferring intraspecific phylogenies. Mol. Biol. Evol. 1999, 16, 37–48. [Google Scholar] [CrossRef]
  43. Zhang, J.; Kapli, P.; Pavlidis, P.; Stamatakis, A. A general species delimitation method with applications to phylogenetic placements. Bioinformatics 2013, 29, 2869–2876. [Google Scholar] [CrossRef] [PubMed] [Green Version]
  44. Puillandre, N.; Lambert, A.; Brouillet, S.; Achaz, G. ABGD, Automatic Barcode Gap Discovery for primary species delimitation. Mol. Ecol. 2012, 21, 1864–1877. [Google Scholar] [CrossRef] [PubMed]
  45. Narins, P.M.; Capranica, R.R. Communicative significance of the two-note call of the treefrog Eleutherodactylus coqui. J. Comp. Physiol. 1978, 127, 1–9. [Google Scholar] [CrossRef]
  46. Gerhardt, H.C. Multiple messages in acoustic signals. Semin. Neurosci. 1992, 4, 391–400. [Google Scholar] [CrossRef]
  47. Welch, A.M.; Semlitsch, R.D.; Gerhardt, H.C. Call duration as an indicator of genetic quality in male gray tree frogs. Science 1998, 280, 1928–1930. [Google Scholar] [CrossRef] [Green Version]
  48. Sousa, V.T.T. Efeitos do Canto de Anúncio e do Tamanho Corporal no Espaçamento Entre Machos em Agregações de Dendropsophus nanus (Anura, Hylidae). Master’s Thesis, São Paulo State University, São Paulo, Brazil, 2012. Available online: https://repositorio.unesp.br/handle/11449/87621 (accessed on 16 December 2020).
  49. Sueur, J.; Aubin, T.; Simonis, C. Seewave, a free modular tool for sound analysis and synthesis. Bioacoustics 2008, 18, 213–226. [Google Scholar] [CrossRef]
  50. Team, R.C. R: A Language and Environment for Statistical Computing; R Foundation for Statical Computing: Vienna, Austria, 2015; Available online: https://www.R-project.org/ (accessed on 16 December 2020).
  51. Köhler, J.; Jansen, M.; Rodriguez, A.; Kok, P.; Toledo, L.; Emmrich, M.; Glaw, F.; Haddad, C.; Rödel, M.; Vences, M. The use of bioacoustics in anuran taxonomy: Theory, terminology, methods and recommendations for best practice. Zootaxa 2017, 4251, 1–124. [Google Scholar] [CrossRef] [PubMed] [Green Version]
  52. Liaw, A.; Wiener, M. Classification and regression by randomForest. R News 2002, 2, 18–22. [Google Scholar]
  53. Duellman, W.E. The Hylid Frogs of Middle America; Natural History Museum of the University of Kansas: Ithaca, NY, USA, 1970. [Google Scholar]
  54. Heyer, W.R.; Rand, A.S.; da Cruz, C.A.G.; Peixoto, O.L.; Nelson, C.E. Frogs of Boracéia. Arq. Zool. 1990, 31, 231–410. [Google Scholar]
  55. Napoli, M.; Caramaschi, U. Duas novas espécies de Hyla Laurenti, 1768 do Brasil central afins de H. tritaeniata Bokermann, 1965 (Amphibia, Anura, Hylidae). Bol. Mus. Nac. Nova Sér. Zool. 1998, 391, 1–12. [Google Scholar]
  56. Wheeler, B. Package ‘lmPerm’. R Package Version 2.1.0. 2016. Available online: https://cran.r-project.org/web/packages/lmPerm/lmPerm.pdf (accessed on 16 January 2021).
  57. Legendre, P.; Legendre, L.F. Numerical Ecology; Elsevier: Amsterdam, The Netherlands, 2012. [Google Scholar]
  58. Dray, S.; Dufour, A.-B. The ade4 package: Implementing the duality diagram for ecologists. J. Stat. Softw. 2007, 22, 1–20. [Google Scholar] [CrossRef] [Green Version]
  59. Wilkinson, L. Systat Statistical Package; Systat Inc.: Evanston, IL, USA, 1984. [Google Scholar]
  60. Martins, I.A.; Jim, J. Bioacoustic analysis of advertisement call in Hyla nana and Hyla sanborni (Anura, Hylidae) in Botucatu, São Paulo, Brazil. Braz. J. Biol. 2003, 63, 507–516. [Google Scholar] [CrossRef]
  61. Vences, M.; Thomas, M.; Van der Meijden, A.; Chiari, Y.; Vieites, D.R. Comparative performance of the 16S rRNA gene in DNA barcoding of amphibians. Front. Zool. 2005, 2, 5. [Google Scholar] [CrossRef] [Green Version]
  62. Vences, M.; Thomas, M.; Bonett, R.M.; Vieites, D.R. Deciphering amphibian diversity through DNA barcoding: Chances and challenges. Philos. Trans. R. Soc. B Biol. Sci. 2005, 360, 1859–1868. [Google Scholar] [CrossRef] [PubMed] [Green Version]
  63. Boul, K.E.; Chris Funk, W.; Darst, C.R.; Cannatella, D.C.; Ryan, M.J. Sexual selection drives speciation in an Amazonian frog. Proc. R. Soc. B Biol. Sci. 2006, 274, 399–406. [Google Scholar] [CrossRef] [Green Version]
  64. Reinhold, K. Variation in acoustic signalling traits exhibits footprints of sexual selection. Evolution 2010, 65, 738–745. [Google Scholar] [CrossRef]
  65. Simões, P.I.; Lima, A.P.; Farias, I. The description of a cryptic species related to the pan-Amazonian frog Allobates femoralis. Zootaxa 2010, 2406, 1–28. [Google Scholar] [CrossRef]
  66. De Carvalho, T.R.; Giaretta, A.A. Taxonomic circumscription of Adenomera martinezi (Bokermann, 1956) (Anura: Leptodactylidae: Leptodactylinae) with the recognition of a new cryptic taxon through a bioacoustic approach. Zootaxa 2013, 3701, 207–237. [Google Scholar] [CrossRef] [PubMed]
  67. Thome, M.T.C.; Zamudio, K.R.; Haddad, C.F.B.; Alexandrino, J. Barriers, rather than refugia, underlie the origin of diversity in toads endemic to the Brazilian Atlantic Forest. Mol. Ecol. 2014, 23, 6152–6164. [Google Scholar] [CrossRef]
  68. Batalha-Filho, H.; Waldschmidt, A.M.; Campos, L.A.; Tavares, M.G.; Fernandes-Salomão, T.M. Phylogeography and historical demography of the neotropical stingless bee Melipona quadrifasciata (Hymenoptera, Apidae): Incongruence between morphology and mitochondrial DNA. Apidologie 2010, 41, 534–547. [Google Scholar] [CrossRef] [Green Version]
  69. Menezes, R.S.; Brady, S.G.; Carvalho, A.F.; Del Lama, M.A.; Costa, M.A. The roles of barriers, refugia, and chromosomal clines underlying diversification in Atlantic Forest social wasps. Sci. Rep. 2017, 7, 7689. [Google Scholar] [CrossRef] [PubMed] [Green Version]
  70. Saadi, A.; Machette, M.N.; Haller, K.M.; Dart, R.L.; Bradley, L.; Souza, A. Map and Database of Quaternary Faults and Lineaments in Brazil; US Geological Survey: Reston, VA, USA, 2003. [Google Scholar]
  71. Costa, L.P. The historical bridge between the Amazon and the Atlantic Forest of Brazil: A study of molecular phylogeography with small mammals. J. Biogeogr. 2003, 30, 71–86. [Google Scholar] [CrossRef] [Green Version]
  72. Batalha-Filho, H.; Fjeldså, J.; Fabre, P.-H.; Miyaki, C.Y. Connections between the Atlantic and the Amazonian forest avifaunas represent distinct historical events. J. Ornithol. 2013, 154, 41–50. [Google Scholar] [CrossRef]
  73. Prates, I.; Melo-Sampaio, P.R.; Drummond, L.O.; Teixeira, M.; Rodrigues, M.T.; Carnaval, A.C. Biogeographic links between southern Atlantic Forest and western South America: Rediscovery, re-description, and phylogenetic relationships of two rare montane anole lizards from Brazil. Mol. Phylogenetics Evol. 2017, 113, 49–58. [Google Scholar] [CrossRef]
  74. Werneck, F.P. The diversification of eastern South American open vegetation biomes: Historical biogeography and perspectives. Quat. Sci. Rev. 2011, 30, 1630–1648. [Google Scholar] [CrossRef]
  75. Le Roux, J.P. A review of Tertiary climate changes in southern South America and the Antarctic Peninsula. Part 2: Continental conditions. Sediment. Geol. 2012, 247, 21–38. [Google Scholar] [CrossRef]
  76. Machado, T.; Silva, V.X.; Silva, M.J.D.J. Phylogenetic relationships within Bothrops neuwiedi group (Serpentes, Squamata): Geographically highly-structured lineages, evidence of introgressive hybridization and Neogene/Quaternary diversification. Mol. Phylogenetics Evol. 2014, 71, 1–14. [Google Scholar] [CrossRef] [PubMed]
  77. Pröhl, H.; Koshy, R.A.; Mueller, U.; Rand, A.S.; Ryan, M.J. Geographic variation of genetic and behavioral traits in northern and southern túngara frogs. Evolution 2006, 60, 1669–1679. [Google Scholar] [CrossRef]
  78. Köhler, J.; Lötters, S. A new species of minute Hyla from the southwestern Amazon basin (Amphibia, Anura, Hylidae). Stud. Neotrop. Fauna Environ. 2001, 36, 105–112. [Google Scholar] [CrossRef]
  79. Moravec, J.; Aparicio, J.; Koehler, J. A new species of tree frog, genus Dendropsophus (Anura: Hylidae), from the Amazon of northern Bolivia. Zootaxa 2006, 1327, 23–40. [Google Scholar] [CrossRef] [Green Version]
  80. Yue, X.; Fan, Y.; Xue, F.; Brauth, S.E.; Tang, Y.; Fang, G. The First Call Note Plays a Crucial Role in Frog Vocal Communication. Sci. Rep. 2017, 7, 10128. [Google Scholar] [CrossRef] [Green Version]
  81. Teixeira, B.F.V.; Giaretta, A.A. Setting a fundament for taxonomy: Advertisement calls from the type localities of three species of the Dendropsophus rubicundulus group (Anura: Hylidae). Salamandra 2015, 51, 137–146. [Google Scholar]
  82. Lynch, J.D.; Duellman, W.E. A review of the centrolenid frogs of Ecuador, with descriptions of new species. Occas. Pap. Mus. Nat. Hist. Univ. Kans. 1973, 16, 1–66. [Google Scholar]
  83. Duellman, W.E. South American frogs of the Hyla rostrata group (Amphibia, Anura, Hylidae). Zool. Meded. 1972, 47, 177–192. [Google Scholar]
  84. Duellman, W.E. The genera of Phyllomedusine frogs (Anura: Hylidae). Univ. Kans. Publ. Mus. Nat. Hist. 1968, 18, 1–10. [Google Scholar] [CrossRef]
  85. Basso, N.G.; Perí, S.I.; di Tada, I.E. Revalidación de Hyla sanborni Schmidt, 1944 (Anura: Hylidae). Cuad. Herpetol. 1985, 1, 1–11. [Google Scholar]
  86. Márquez, R.; De la Riva, I.; Bosch, J. Advertisement calls of bolivian species of Hyla (Amphibia, Anura, Hylidae). Biotropica 1993, 426–443. [Google Scholar] [CrossRef]
  87. Schwartz, J.J. The importance of spectral and temporal properties in species and call recognition in a neotropical treefrog with a complex vocal repertoire. Anim. Behav. 1987, 35, 340–347. [Google Scholar] [CrossRef]
  88. Schwartz, J.J.; Wells, K.D. Interspecific acoustic interactions of the neotropical treefrog Hyla ebraccata. Behav. Ecol. Sociobiol. 1984, 14, 211–224. [Google Scholar] [CrossRef]
  89. Schwartz, J.J.; Wells, K.D. Vocal behavior of the neotropical treefrog Hyla phlebodes. Herpetologica 1984, 40, 452–463. [Google Scholar]
  90. Wells, K.D.; Greer, B.J. Vocal responses to conspecific calls in a neotropical hylid frog, Hyla ebraccata. Copeia 1981, 1981, 615–624. [Google Scholar] [CrossRef]
  91. Suárez, P.; Cardozo, D.; Baldo, D.; Pereyra, M.O.; Faivovich, J.; Orrico, V.G.; Catroli, G.F.; Grabiele, M.; Bernarde, P.S.; Nagamachi, C.Y.; et al. Chromosome evolution in Dendropsophini (Amphibia, Anura, Hylinae). Cytogenet. Genome Res. 2013, 141, 295–308. [Google Scholar] [CrossRef] [PubMed]
  92. Teixeira, L.S.; Seger, K.R.; Targueta, C.P.; Orrico, V.G.; Lourenço, L.B. Comparative cytogenetics of tree frogs of tree frogs of the Dendropsophus marmoratus (Laurenti 1768) group: Conserved karyotypes and interstitial telomeric sequences. Comp. Cytogenet. 2016, 10, 753–767. [Google Scholar]
Figure 1. (A). Phylogenetic relationships, species delimitation hypotheses and geographical distribution of the Dendropsophus nanus–Dendropsophus walfordi species complex. The cladogram shows the strict consensus of the 6 most parsimonious trees (with 1397 steps) inferred by TNT from Matrix 1. The terminals are identified by their specimen voucher number (see Table S1) and locality. The outgroup is not shown. Bootstrap values greater than 50% are shown at the nodes. Asterisks indicate a bootstrap value of 100%. The delimitation of independently evolving lineages inferred by the tree-based method (bPTP), the distance-based method (ABGD) and the call and morphology analyses are represented by colored bars. (B). Geographical distribution of the genetic lineages shown in A. The lineages are identified by the same colors used in the cladogram. Star: type locality of D. nanus. Triangle: type locality of D. walfordi. Square: type locality of D. minimus. Black dots in the map represent sites sampled only for morphological or acoustic analyses. Circled dots in the map indicate sites included in the genetic analyses based on the 16Sar-16Sbr fragment but not in the phylogenetic analyses (see text for details). (C). Divergence time estimates for the Dendropsophus nanusDendropsophus walfordi species complex. The bars on the nodes indicate 95% highest posterior density (95% HPD) intervals. The corresponding timescale is shown below the cladogram. Mya: million years ago.
Diversity 13 00522 g001
Figure 2. Advertisement calls of topotypical individuals of Dendropsophus nanus (AC) and Dendropsophus walfordi (DF). (A,D): Spectrogram (top) and oscillogram (bottom) of two notes in the advertisement call of D. nanus (A) and D. walfordi (D). (A) shows two different notes for D. nanus, the introductory (type A) and the secondary (type B) notes. (D) shows an introductory and a secondary note in the advertisement call of D. walfordi, which we considered a single type of note, as they do not differ in acoustic parameters or amplitude modulation (see Results). (B,C): Power spectrum of notes A (B) and B (C) of D. nanus. (E,F): Power spectrum of the introductory (E) and secondary (F) notes of D. walfordi. Sound files: Dendrop_nanus_Resistencia_AR_1a_BFVT_Mtc; Dendrop_walfordiCostaMarquesRO12aAAGm671.
Diversity 13 00522 g002
Figure 3. Multidimensional scale scatter of random forest results on acoustic variables. Plots of the first two axes of a multidimensional scale analysis of the acoustic data of Lineages A–E of the D. nanus–D. walfordi species complex. Topotypes of D. walfordi are included in Lineage D (green), and topotypes of D. nanus are comprised in Lineage E (pink).
Diversity 13 00522 g003
Figure 4. Morphological characteristics of preserved topotypes of Dendropsophus nanus (A) and Dendropsophus walfordi (B). Lateral and dorsal views of the head (top); palmar and plantar views of the foot and the hand (bottom) of topotypes of D. nanus (UNEC 12429) and D. walfordi (AAG-UFU 5311).
Diversity 13 00522 g004
Figure 5. Preserved specimens assigned to Lineages B and E. Note the variation in color pattern and distribution of spots on the dorsum. (A) (AE): Specimens UNEC 12433–37 collected from the type locality of D. nanus (Colonia Resistencia, Chaco, Argentina). (FI): Specimens AAG-UFU 921–24 collected from Brejinho de Nazaré, Brazil. (B) (A,B): Specimens AAG-UFU 3252 and AAG-UFU 3254 from Belém, Pará, Brazil. (CI): Specimens AAG-UFU 5306, AAG-UFU 5307, AAG-UFU 5309–11 and AAG-UFU 5342 from the type locality of D. walfordi (Forte Príncipe da Beira, Costa Marques, Rondônia, Brazil).
Diversity 13 00522 g005
Figure 6. PCA of morphometric ratios. PCA scatter diagrams of nine morphometric ratios obtained from 71 individuals of the 5 lineages recognized in the DNA-based analyses. Each color represents a lineage: red = Lineage A, blue = Lineage B, brown = Lineage C, green = Lineage D and pink = Lineage E.
Diversity 13 00522 g006
Figure 7. (A). Box plot of the scores of PC1 of the nine morphometric ratios obtained from 71 individuals of each genetic lineage recognized in the DNA-based analyses. X represents the mean, the bottom and top lines represent the 25th and 75th percentiles, respectively, and the bottom and top dashes represent the minimum and maximum values, respectively. (B). PC1 and (C). PC2 represent the first two axes obtained in the PCA (see Materials and Methods for details). Points represent mean values, and the bars represent standard errors.
Diversity 13 00522 g007
Table 1. Uncorrected p-distances (%) between Lineages A–E of the D. nanusD. walfordi species complex. In the lower triangle, values estimated from H1 fragments (2472 bp) (left) and from the 16Sar-16Sbr fragment of the 16S rRNA gene (right); in the upper triangle, values inferred from the COI fragment (645 bp). The diagonal line (in bold) presents uncorrected p-distances identified within each species or lineage based on the H1 (left) and COI (right) fragments. The hash mark denotes that only one sequence is available.
12345
1. Lineage A0.5/0.64.09.38.07.4
2. Lineage B1.7/1.00.6/1.47.06.77.0
3. Lineage C3.0/1.33.0/1.80.7/#3.98.0
4. Lineage D2.8/1.92.6/1.92.6/1.70.5/1.17.2
5. Lineage E2.7/1.42.4/1.43.1/1.32.5/1.10.4/1.0
Table 2. Mean and standard deviation (SD) of each note’s acoustic variables and results from Welch’s t-tests comparing the introductory and secondary notes of the advertisement calls of each species. Bolded p-values correspond to significant results with α = 0.05.
Mean ± SDWelch’s t-Test
SpeciesAcoustic ParameterIntroductory NotesSecondary Notestp
D. nanusNote duration (ms)39.1 ± 7.419.6 ± 3.85928 *<0.001
Pulse duration (ms)3.4 ± 0.53.9 ± 1.11952.5 *<0.001
Pulse number11.6 ± 1.65.1 ± 1.028.6<0.001
Dominant frequency (Hz)4350.8 ± 272.44338.7 ± 268.20.30.8
Pulse rate293.3 ± 39.9268.6 ± 57.43851.5 *0.001
D. walfordiNote duration (ms)15.4 ± 2.713.0 ± 2.53.20.003
Pulse duration (ms)3.8 ± 1.34.6 ± 2.1241 *0.3
Pulse number 4.4 ± 1.33.3 ± 1.03.30.002
Dominant frequency (Hz)4492.4 ± 253.84483.9 ± 246.60.10.9
Pulse rate295.3 ± 108.7262.4 ± 92.11.20.2
* Mann-Whitney-Wilcoxon test.
Table 3. Results of MANOVA tests comparing each note (introductory and/or secondary) of the two types of advertisement calls (calls I and II) distinguished by random forest analysis. Bolded p-values correspond to significant results with α = 0.05.
Notes in Comparison SourceDfPillai’s TraceFp
Type A notesCalls (I and II)10.880.7<0.001
Residuals99
Type B notesCalls (I and II)10.520.1<0.001
Residuals99
Type A notes of call I and type B notes of call IICalls (I and II)10.899.7<0.001
Residuals99
Type B notes of call I and type A notes of call IICalls (I and II)10.26.4<0.001
Residuals99
Table 4. Loadings of nine morphometric ratios on the first two principal components (PC1 and PC2) generated by a principal component analysis based on 71 individuals assigned to Lineages A–E. SVL: snout–vent length. HL: head length. HW: head width. TD: tympanum diameter. ED: eye diameter. SL: shank length (= tibia length). FL: foot length. TL: thigh length. HAL: hand length.
Morphometric RatiosPC1PC2
HW/HL−0.497 −0.251
TD/ED−0.412−0.440
FL/TL−0.0670.791
TL/SVL0.717−0.616
HW/SVL0.690−0.363
FL/SVL0.8570.031
HAL/SVL0.793−0.192
SL/FL−0.300−0.675
TD/HL−0.523−0.491
Publisher’s Note: MDPI stays neutral with regard to jurisdictional claims in published maps and institutional affiliations.

