
An MPA Design Approach to Benefit Fisheries: Maximising Larval Export and Minimising Redundancy


1
School of Biological Sciences, University of Queensland, Brisbane, QLD 4072, Australia
2
Institute for Marine and Antarctic Studies, University of Tasmania, Hobart, TAS 7001, Australia
3
Department of Economics, University of Sydney, Sydney, NSW 2006, Australia
*
Authors to whom correspondence should be addressed.
Diversity 2021, 13(11), 586; https://0-doi-org.brum.beds.ac.uk/10.3390/d13110586
Submission received: 17 September 2021
/
Revised: 1 November 2021
/
Accepted: 8 November 2021
/
Published: 17 November 2021
(This article belongs to the Special Issue Ecological Connectivity among Tropical Coastal Ecosystems)
Abstract
:In the design of marine protected areas (MPAs), tailoring reserve placement to facilitate larval export beyond reserve boundaries may support fished populations and fisheries through recruitment subsidies. Intuitively, capturing such connectivity could be purely based on optimising larval dispersal metrics such as export strength. However, this can lead to inefficient or redundant larval connectivity, as the subset of sites with the best connectivity metrics might share many of the same connections, making them, collectively, poor MPA candidates to provide recruitment subsidies to unprotected sites. We propose a simple, dynamic algorithm for reserve placement optimisation designed to select MPAs sequentially, maximising larval export to the overall network, whilst accounting for redundancy in supply from multiple sources. When applied to four regions in the Caribbean, the algorithm consistently outperformed approaches that did not consider supply redundancy, leading to, on average, 20% greater fished biomass in a simulated model. Improvements were most apparent in dense, strongly connected systems such as the Bahamas. Here, MPA placement without redundancy considerations produced fishery benefits worse than random MPA design. Our findings highlight the importance of considering redundancy in MPA design, and offer a novel, simple approach to improving MPA design for achieving fishery objectives.
Keywords:
optimization algorithm; Caribbean; connectivity; design; complementarity; export; fisheries; fish larvae; MPA; redundancy1. Introduction
Population connectivity typically plays a more prevalent role in marine environments than in terrestrial systems [1]. Links between local populations form through the movement of individuals in their larval, juvenile and adult stages. On coral reefs, many organisms, including both habitat-forming corals and fishes, disperse widely during their larval stages in the open ocean. Whilst some fish species undertake ontogenetic migrations after settling in benthic habitats [2], most coral reef fishes have a restricted home range during their adult life stage [3,4,5,6]. Therefore, the primary opportunity for dispersal occurs during the larval phase [7,8]. Another key feature of marine environments is that they typically display asymmetric connectivity [9,10,11] because hydrodynamics drive larval movement, rather than pure diffusion [12]. Ocean currents, being highly variable across space, lead to regional larval connectivity patterns with variable strength and directionality [10,13,14].
It has long been recognised that the design of marine protected areas (MPAs), referring to a spectrum of restrictions to use and access of marine areas, would benefit from a consideration of larval dispersal [15]. Most MPAs that have incorporated connectivity in their design do so for the purposes of biodiversity conservation [16]. This normally favours site selection based on larval self-sufficiency [17], and in the case of an MPA network, interconnectedness to support metapopulation persistence [18,19]. In a fisheries context, external larval replenishment from protected populations to fishing grounds may provide resilience from overexploitation and allow for sustained fishing efforts [20]. If these source populations can be protected, then they may also help support fishery productivity. For this reason, source areas that are high larval exporters are most attractive for MPA placement that is aimed not only at species conservation and population recovery within MPAs, but also at benefiting fished populations and fisheries outside of MPAs [21,22].
There are several approaches to including larval connectivity into MPA design, which differ in their complexity and type of impact [22,23,24,25]. The first considers the degree of connectivity within the MPA network itself, which is generally asymmetric between pairs of MPAs [26]. These approaches can help maximise the metapopulation persistence of populations across the MPA network. They implicitly assume “scorched Earth” by ignoring the contribution of larvae outside reserve boundaries and this is likely appropriate in heavily impacted environments, though less so in moderately exploited marine ecosystems [27]. Most existing optimisation approaches are more strongly motivated by biodiversity goals rather than fisheries benefits. Connectivity scores are then considered alongside other costs and conservation features, and undergo site selection procedure as prescribed by the study [17,25,28,29].
A second approach is to identify metrics that capture the dispersal characteristics of reefs beyond the reserve network per se. For example, one might highlight areas of high self-retention—which has a biodiversity benefit—or seek those reefs that most strongly export larvae to key fishing grounds [22]. The latter approach attempts to maximise fisheries benefits by identifying areas for protection that enable brood stocks to rise and then supply larvae to replenish fishing grounds [22]. In order to be computationally tractable using widely-used optimisation software like Marxan [26,30], this approach simply seeks reefs that have desirable attributes (termed “site-based” approaches in [22]. The limitation is that it assumes that the contribution of each MPA is unaffected by the selection of other MPAs in the network. Yet, in reality, the pattern of larval spillover to fished areas can be highly sensitive to the choice of MPA locations within the metapopulation [22]. Ideally, the reserve selection algorithm would evaluate the level of desirable connectivity (e.g., spillover from MPAs to fished locations) at every step of the optimisation process; i.e., when each potential MPA site is added to or removed from the potential MPA network. While this approach generates greater fisheries benefits, it is far more complex to implement and currently not available for Marxan.
Thus, while it is possible to optimise MPA network designs for system-wide benefits, these approaches can be computationally intensive, difficult to understand, and commonly unavailable to practitioners. Here, we describe a novel MPA placement optimisation algorithm that is relatively simple and fast to implement. Specifically, we consider larval export and complementarity among sites, maximising larval subsidies from MPAs and minimising redundancy in supply. Redundancy can occur when more than one MPA supplies larvae to the same fishing ground and other MPAs, particularly if density dependent survivorship of larvae means that much of the “excess” larvae are unnecessary and die naturally [31]. We evaluated the algorithm’s performance against simpler approaches that do not consider complementarity, in four oceanographically contrasting regions of the Caribbean.
2. Materials and Methods
2.1. Complementarity Algorithm Design
We define the network as a set of sites N, where , and where R are sites that have been selected as reserves whilst F are sites that are not selected as reserves. Initially, R is empty and all sites are in F. We then successively change site status from F to R as we select reserve priority locations for protection in a stepwise manner. At each reserve selection step, we select a site that satisfies Equation (1):
where eij is the strength of link from node i to node j, and Ei is the summed out-strength (the probability of larval export from the source to all destinations, which for simplicity is assumed to represent the strength of all outgoing connections) of the site, and move that site from F to R. In cases of ties, where sites have the same out-strength, one of the sites is selected randomly as the new reserve site.
To achieve complementarity of site selection, such that larval contributions are distributed across the network, we also define a larval saturation threshold S, above which any additional larval supply is ignored. During the reserve selection process, after site i has been selected as a new reserve site, we update Sj for all sites as follows:
We then reweigh all connections to account for the supply that sites receive from the newly selected reserve and discount it from the supply that is needed as follows:
The process is then repeated after each site is added to R until the size of R is equal to the predetermined size of the reserve network (previously specified proportion of N), and the search terminates and the algorithm outputs the selected set of reserves.
It is important to note that the network is defined to include all sites in a region, including sites that are denoted MPA status. This results in an algorithm which maximises larval export from an MPA system to all sites in the region, including protected areas. This may potentially sacrifice the maximal amount possible of recruitment subsidies to fished regions specifically. We consider this to be a conservative approach, which ensures that larval benefits between MPAs are not ignored. In order to select for larval dispersal to unprotected sites exclusively, a simple modification of the proposed algorithm would be necessary, whereby protected status of a site is accompanied by a conversion of its saturation threshold to zero.
The proposed algorithm is also inherently greedy, where the best solution is always selected as the next site that is added to the reserve network. As such, it is prone to get stuck in local maxima where the same initial node direct subsequent reweighing of connections and sets a predetermined, potentially sub-optimal selection of MPAs. To explore multiple solutions beyond the one obtained when the best-connected site is selected first, we modified the algorithm to designate a randomly selected site as the first reserve site, utilising a random restart hill climbing approach rather than a strictly greedy search. The algorithm then proceeds to select subsequent sites through the greedy selection and reweighing process. Greedy algorithms are desirable because of their simplicity to implement and high speed. For all scenarios, this procedure was repeated 1000 times to ensure all start node configurations were tested and to allow for any branching between solutions during later search steps that could arise due to ties between out-strengths of sites.
2.2. Assumptions
For simplicity, fishing is considered to occur at all sites and all sites equally. Therefore, no area is valued more in terms of a larval export destination. However, this could be modified such that heavily fished areas can be prioritised as larval destinations. This could be achieved either by assigning greater saturation thresholds, S, or by overweighting larval links, to priority sites before the selection process commences.
Assuming that brood stock populations in MPAs will have far greater larval output than heavily fished areas, we assume a scorched Earth such that fished areas do not contribute significantly to the larval supply of fished areas. Another way to frame this is that larval contributions among fished sites are assumed to vary randomly across the seascape and do not require explicit incorporation.
The larval dispersal matrices we use are unweighted probability matrices which describe the probability of larvae travelling from one site to another. However, this is a simplified scenario as larval production will vary across sites. In order to account for magnitude of larval flow, the probability matrix can be multiplied by proxies of population size and health, such as habitat area and quality.
Finally, connectivity is only evaluated across a single generation. Stepwise transfer of larvae across sites, over several generations may result in larval contributions but are not considered in our analysis in order to simplify assumptions.
2.3. Measures of Performance
The performance of the resulting MPA systems were explored based on multiple response metrics. Firstly, to provide a baseline for comparisons to the Complementarity algorithm, MPA systems were also designed using alternative, and presumably less desirable, methods. The first of these approaches consisted of a random selection of reserve locations that did not take into account connectivity (using a random number generator performed for 1000 iterations). The second approach selected sites by optimising fixed export strength and export connections, respectively. Fixed metrics refers to metrics that are evaluated before site selection, and never updated to account for redundancy. The fixed export strength method selected the subset of sites with the highest cumulative larval export, regardless of directionality. Meanwhile, the fixed export connections method selected sites with the greatest number of out-connections (any probability of larval exchange), regardless of how strong these connections were. All design approaches were tested in four different regions of the Caribbean. These regions were analysed using graph-theoretical metrics (Table 1) to provide a basis for understanding inter-regional differences in MPA network performances.
MPA performance across site selection approaches was analysed based on multiple alternative metrics. We started with relatively simple metrics that were suitable to better understand the basic functioning of the Complementarity algorithm in selecting MPAs that export larvae across a network.
The first of these simple metrics was defined as constrained larval export (CLE):
where xi represents the protection status of site i, with 0 denoting unprotected and 1 denoting MPA status.
CLE is a means of quantifying the degree of larval output from MPAs to the entire network, within the bounds of the specified larval threshold. A second related metric was calculated, which captured the number of sites that met the specified larval threshold (LTM), that is, the sites in the network that have received larval contributions from an MPA up to or beyond the assumed larval saturation state. LTM is useful to determine the capacity for an MPA system to meet specified larval export targets across a network. As a proportion of the overall number of sites in a network, LTM allowed for inter-regional analysis of performance.
We further calculated larval export and connections from MPA systems to unprotected areas, standardising measurements across regions by dividing the sum of export and connections by the corresponding total larval strength or connections across the whole network. We refer to these standardised metrics in the following simply as export connection ratio and export strength ratio.
2.4. Application to Caribbean Coral Reef Dataset
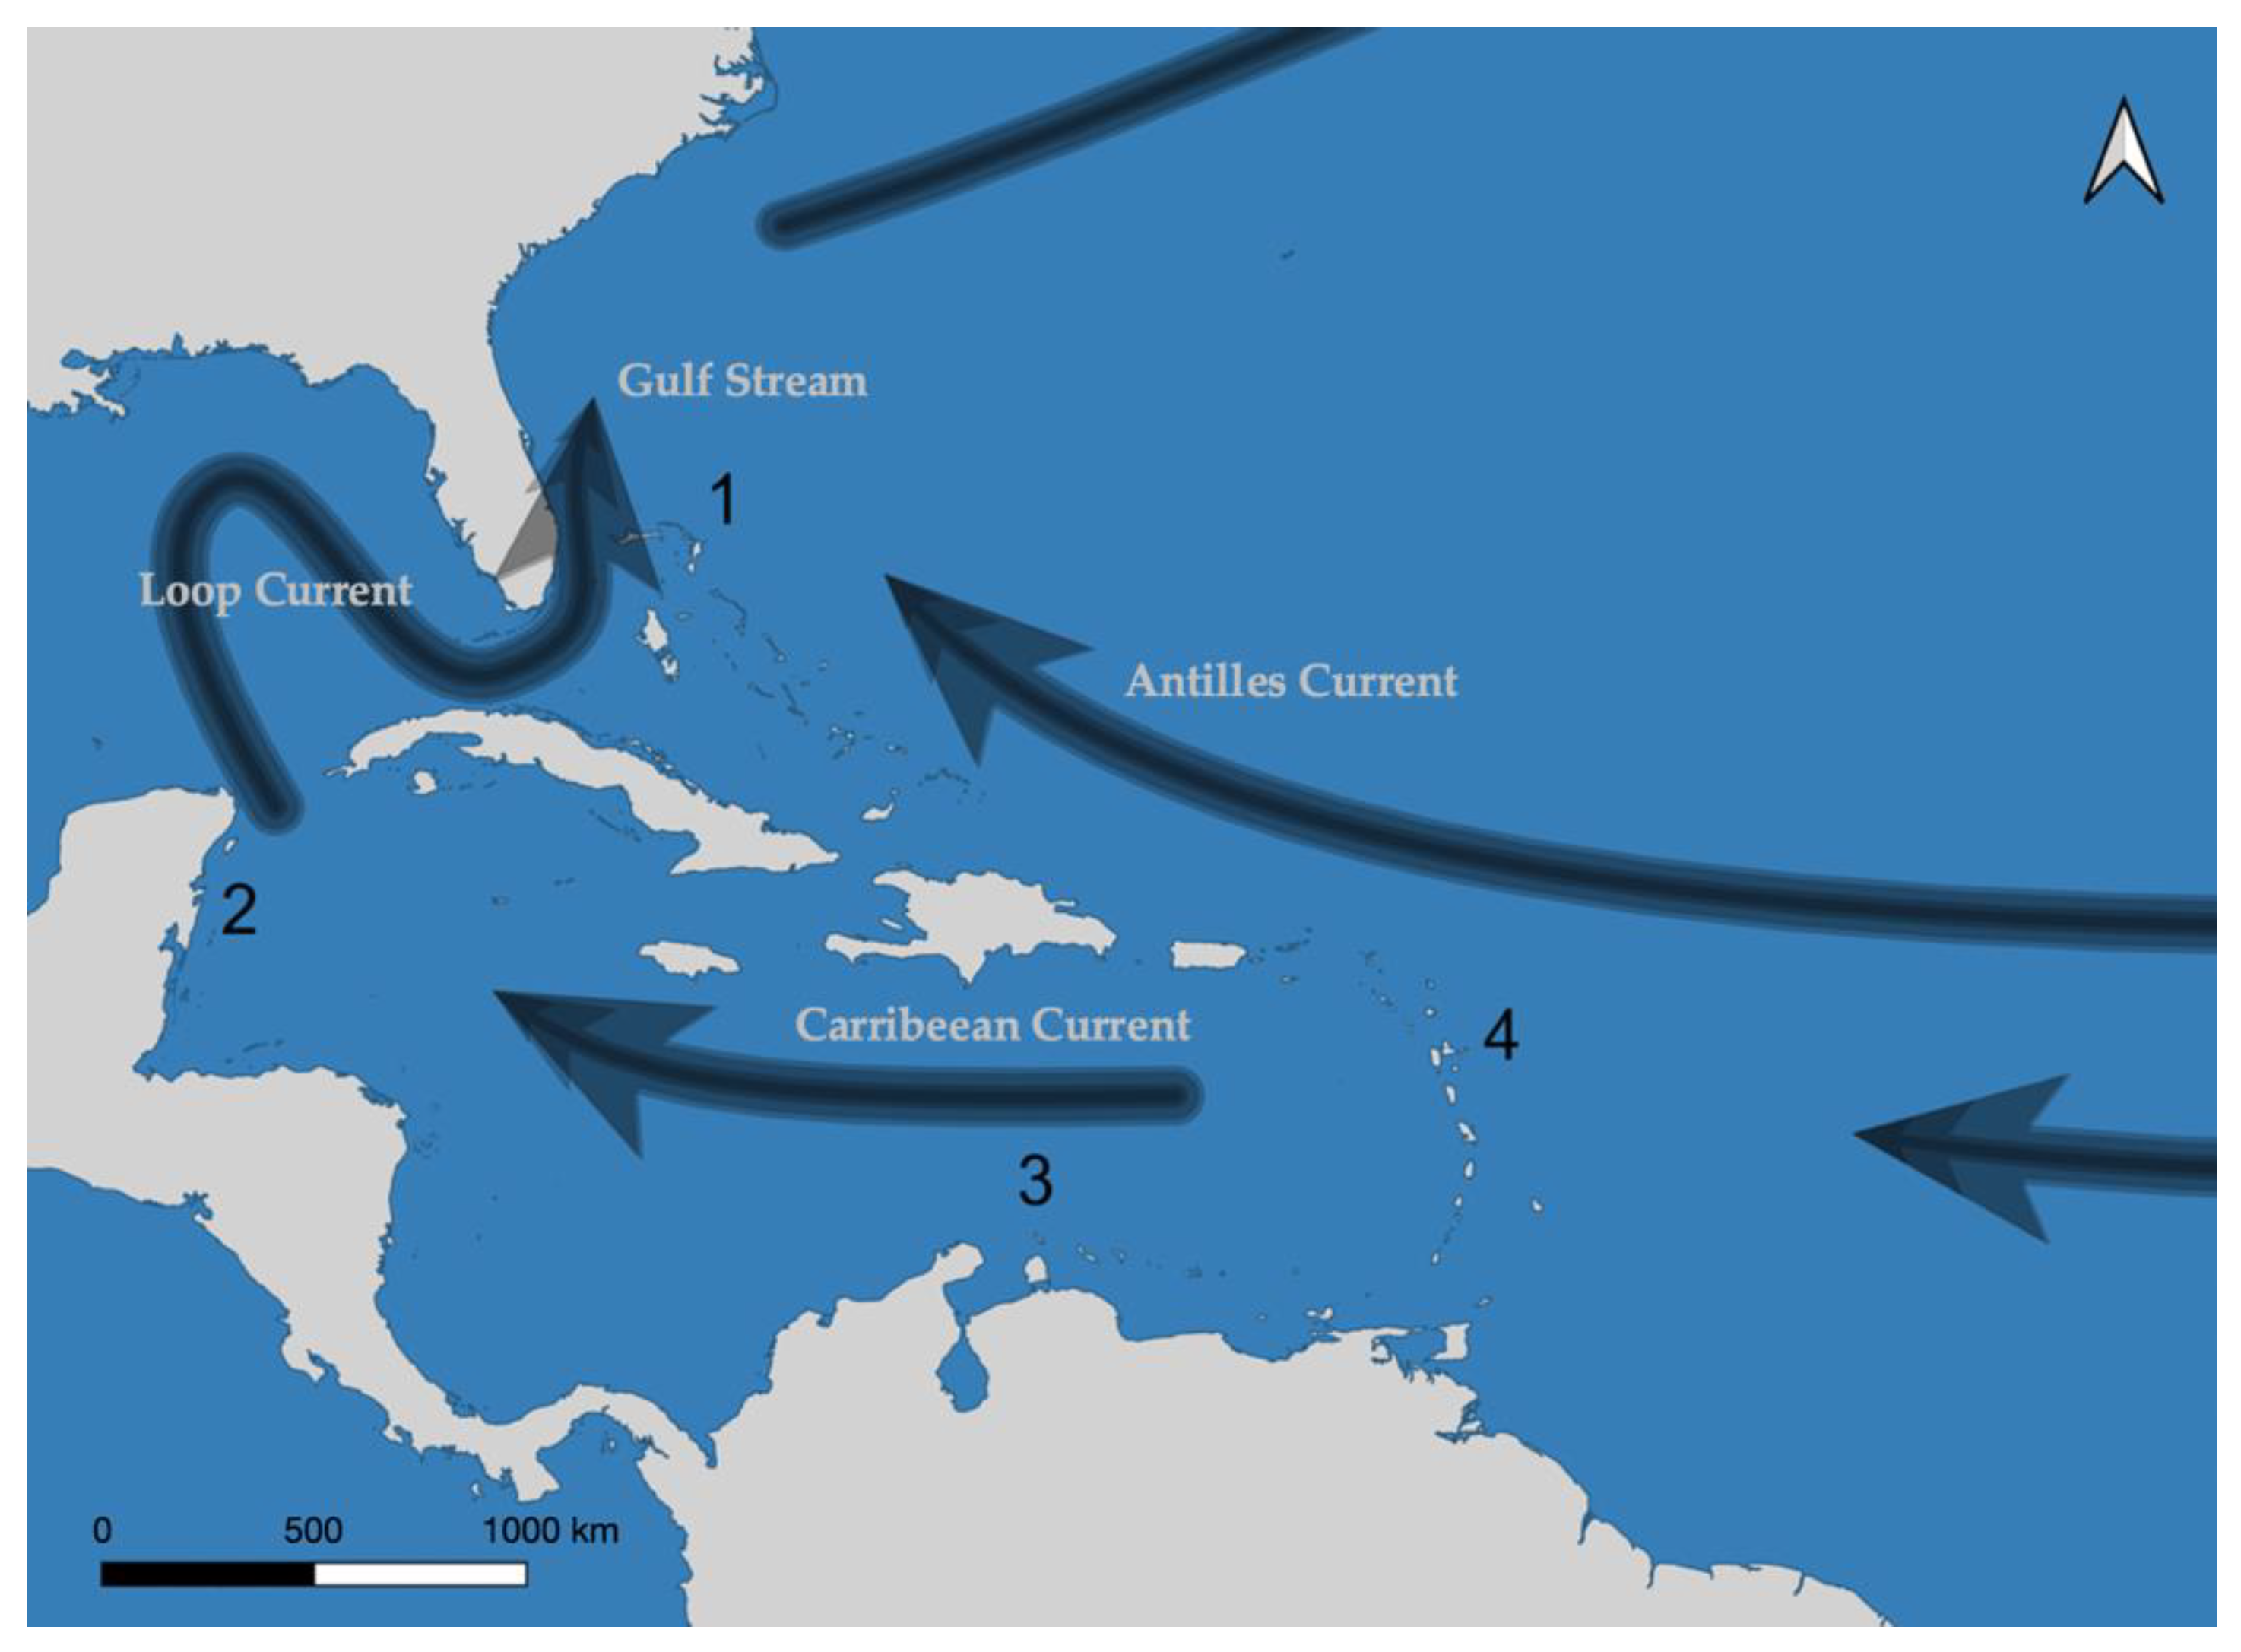
Biophysical data consisted of connectivity matrices, generated from the work of Holstein et al. [32] for yellowtail snapper (Ocyurus chrysurus). O. chrysurus is an abundant fishery target species in the Caribbean and closely associated with coral reefs, making it highly suitable for the purpose of this study. Dispersal connectivity matrices were produced using the Connectivity Modelling System [33], which is a multi-scale biophysical Lagrangian model. The model incorporates ocean currents, habitat distribution, and larval traits to produce larval dispersal matrices. Dispersing larvae were simulated as particles, released every month, over a 5 year period to account for temporal variation. Particles in the model were subjected to biologically relevant constraints such as larval pre-competency period, spawning frequency, larval ontogenetic vertical shifts, maximum pelagic larval duration, and larval mortality. Dispersal probability matrices were derived from these simulations, describing the probabilities of larval dispersal to any and every planning unit in a region. We distinguished four regions of the Caribbean on the expectation that they would have quite different connectivity properties (see Figure 1). The Bahamas is a large and complex network of reefs with potentially high levels of connectivity; Belize is large continuous barrier reef system where the reefs are essentially parallel to prevailing currents; Bonaire and its surrounding islands are small and sit in an area of relatively simple flow; and the Lesser Antilles is a chain of reefs situated perpendicular to the prevailing current, suggesting that reefs may be quite isolated from one another.
Finally, and importantly, MPA performance was measured by running a spatial fishery model which simulated metapopulation fish biomass and catch across the entire seascape. Fishery simulations were based on a Deriso–Schnute delay-difference model, which mimics age-structured population dynamics under data-poor conditions [34]. Simulations used an annual time step, capturing changes in fish biomass and catch according to assumed natural adult mortality/survival, growth, larval dispersal, density-dependent recruitment, and fishing pressure in each area of the planning grid. All simulations started with a spawning event based upon which eggs were released from all areas and in proportion to the local biomass of mature fish in those areas at a given time. Eggs were assumed to develop into larvae and distributed across space to calculate settlement as predicted according to the above-described larval dispersal probability matrices. Settled juveniles were then subjected to density dependent mortality before entering the adult population by calculating recruitment according to a Beverton–Holt stock-recruitment relationship [35]. Further detail on principal equations and procedures used are available in multiple previous studies [22,36].
To parameterise the fishery model for yellowtail snapper, the global average across empirical estimates of natural annual mortality/survival (s = 0.68) and growth (p = 0.17) were sourced from FishBase (https://www.fishbase.se/search.php, accessed on 5 September 2021). The estimated steepness of the Beverton–Holt recruitment relationship (h = 0.6) was set to a value slightly lower than the average estimated across various commercial fish stocks [37]. Probabilities of larval dispersal were derived from the biophysical connectivity modelling results described above. Adult movements between areas were assumed to be negligible. Similarly, unfished biomass in each area of the planning grid was set to a uniform value of 1. The distribution of fishing effort was also assumed to be uniform and parameterised such that biomass prior to MPA enforcement was depleted down to only 10% of unfished levels. This assumption was intentionally pessimistic, but likely to be realistic for many key target species on overfished coral reefs, helping to identify MPA systems that are most likely to prevent further declines under intense fishing pressure. In combination, these modelling assumptions ensured that spatial heterogeneity in fishery simulations was informed purely by estimated patterns of larval dispersal, allowing to quantify how alternative reserve placement prioritisation approaches impacted fished area biomass (unprotected area biomass) and protected area biomass.
3. Results
3.1. Connectivity Network Analysis
The Bahamas was the most complex network with more and stronger connections than other regions (Table 2). Belize and Lesser Antilles were comparable with average numbers of connections, although Belize was found to be a single biconnected network with no articulation points, and also had the second highest average strength per site. Bonaire was the least connected region, with strong clustering and weak connections.
3.2. Non-Modelling Measures of Performance
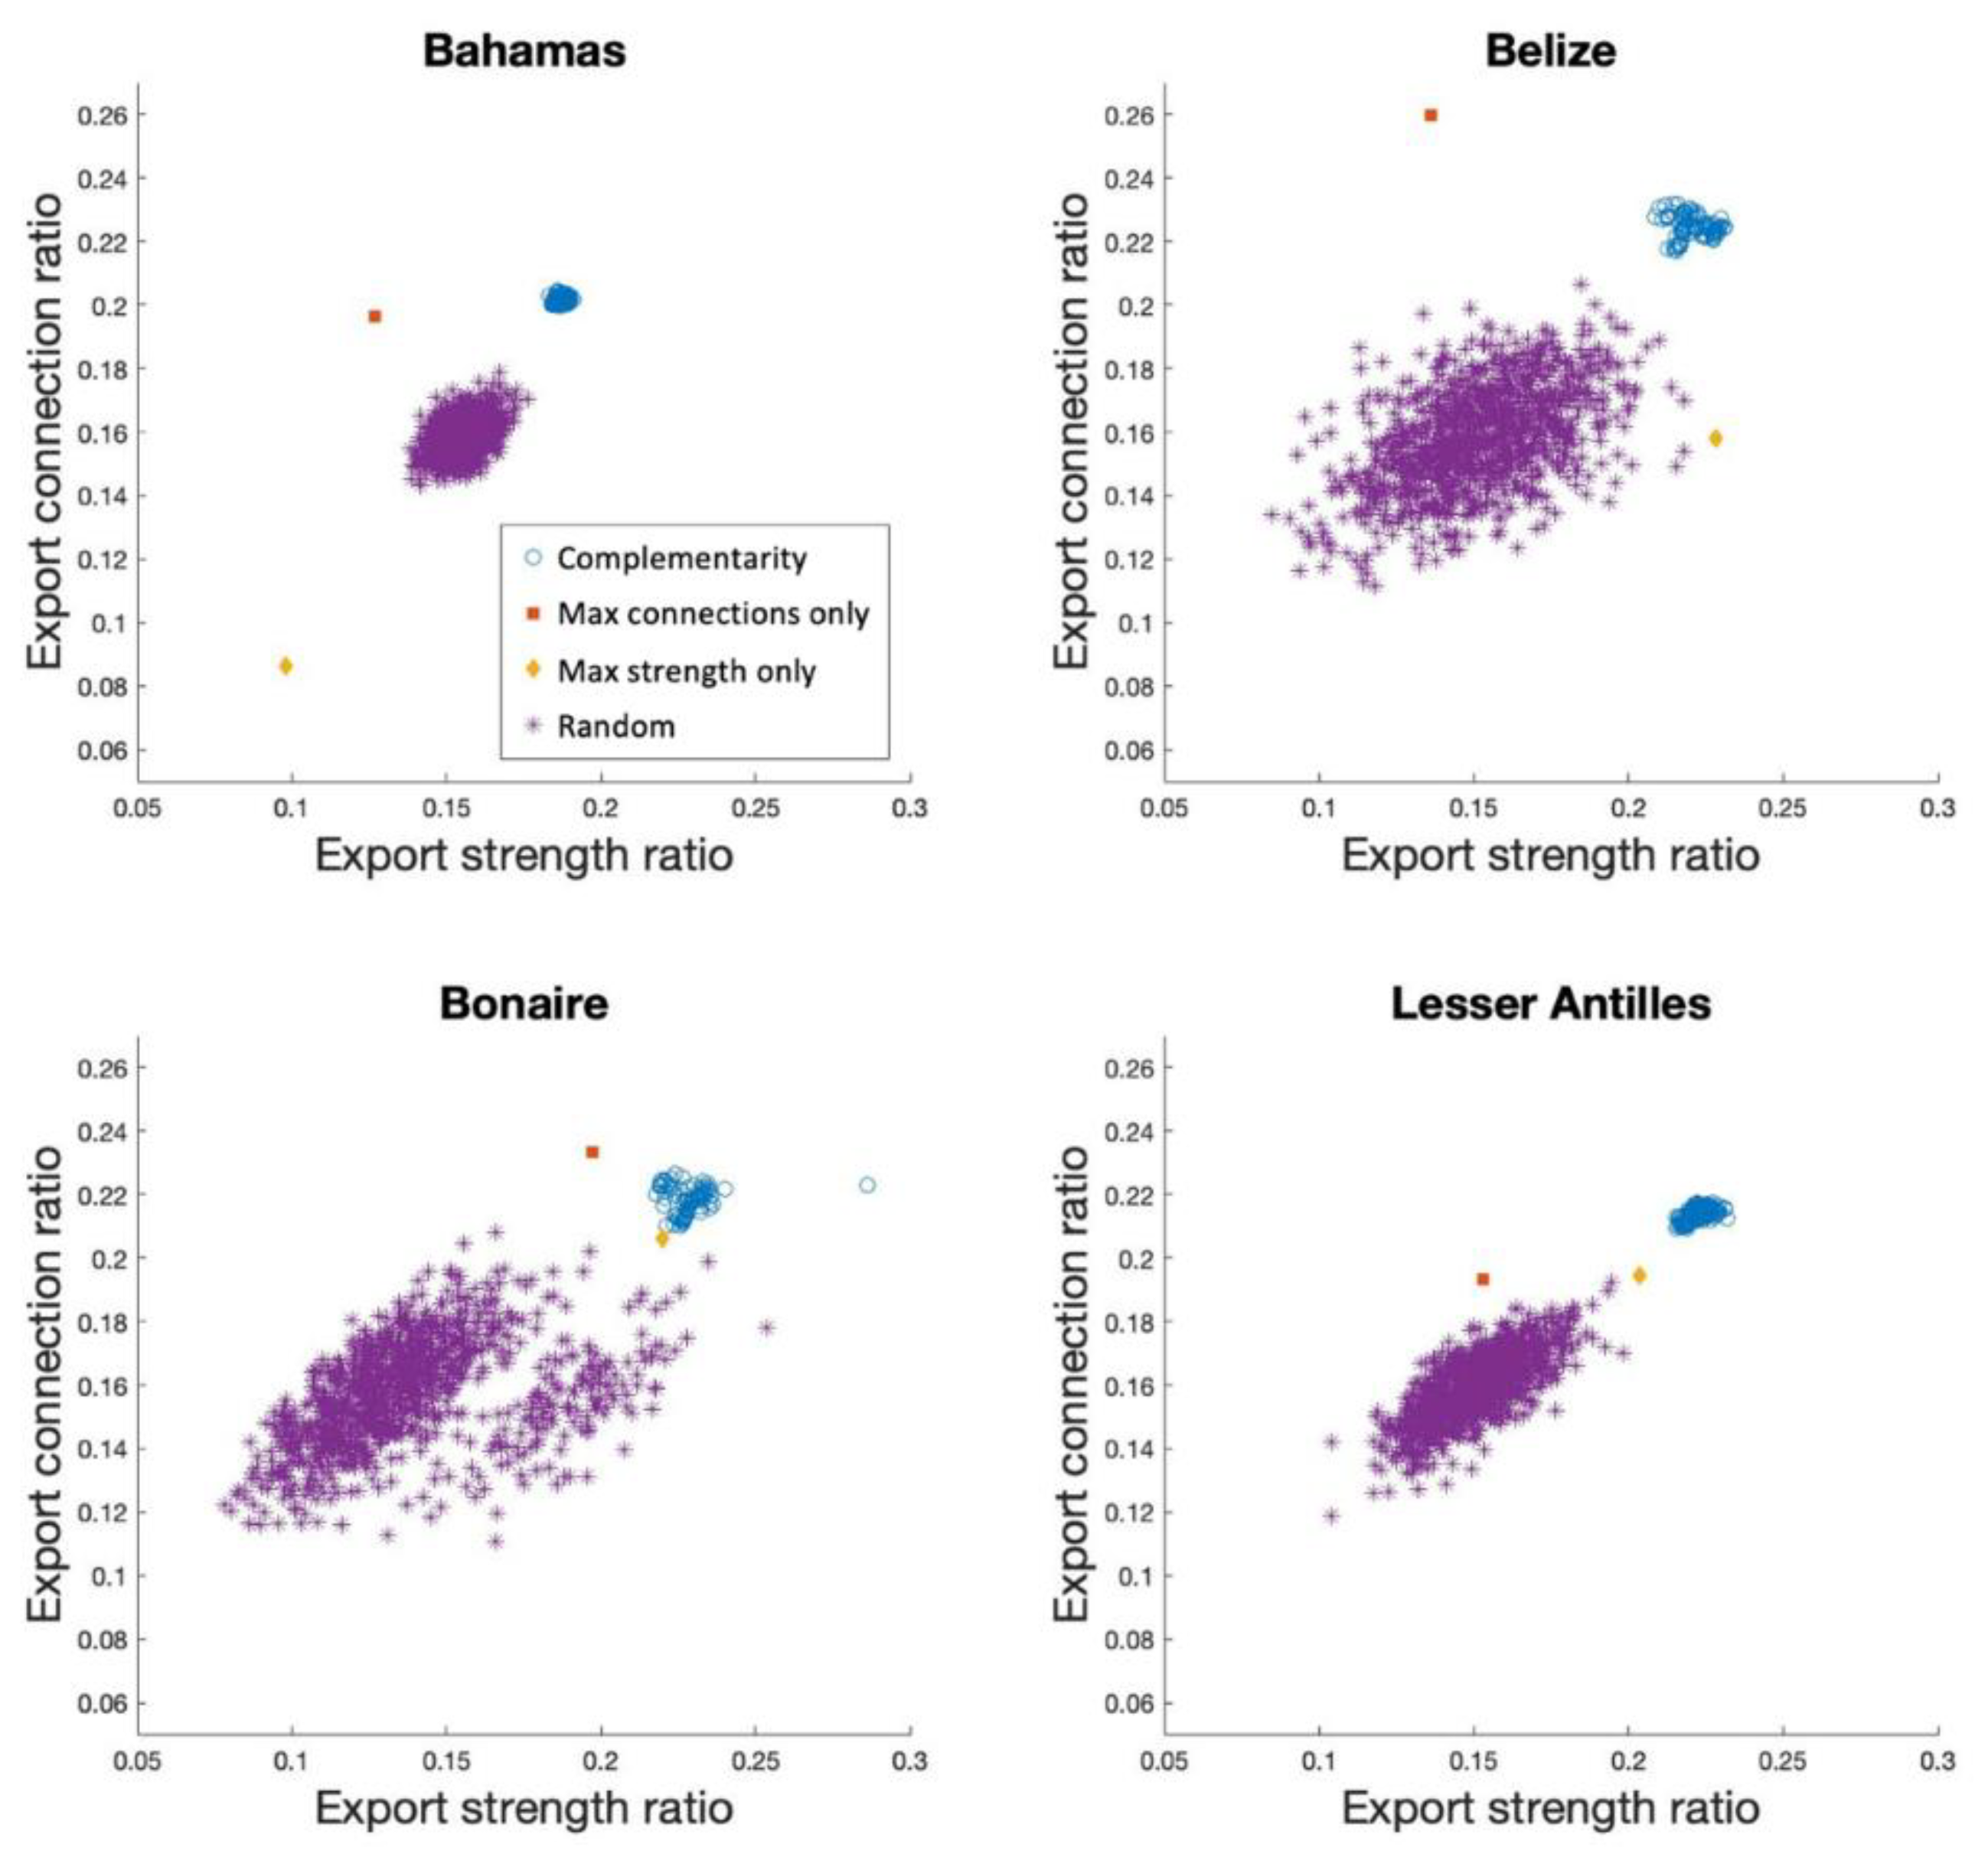
MPA systems selected by the Complementarity algorithm consistently distributed high quantities of larvae to a diverse number of unprotected sites compared to other methods (Figure 2). In all but two instances (Connections in Belize and Bonaire), simply selecting the best ranked sites based on export strength or export connections, did not produce MPA systems that ensured near-maximum export strength or connections to unprotected sites. In the Bahamas, MPAs selected based on highest export strength actually resulted in the lowest export strength to unprotected sites. Only in Bonaire did optimising fixed connectivity metrics produce MPA systems whose performance was within the top 25% of MPA systems in terms of export connections and export strength to unprotected areas.
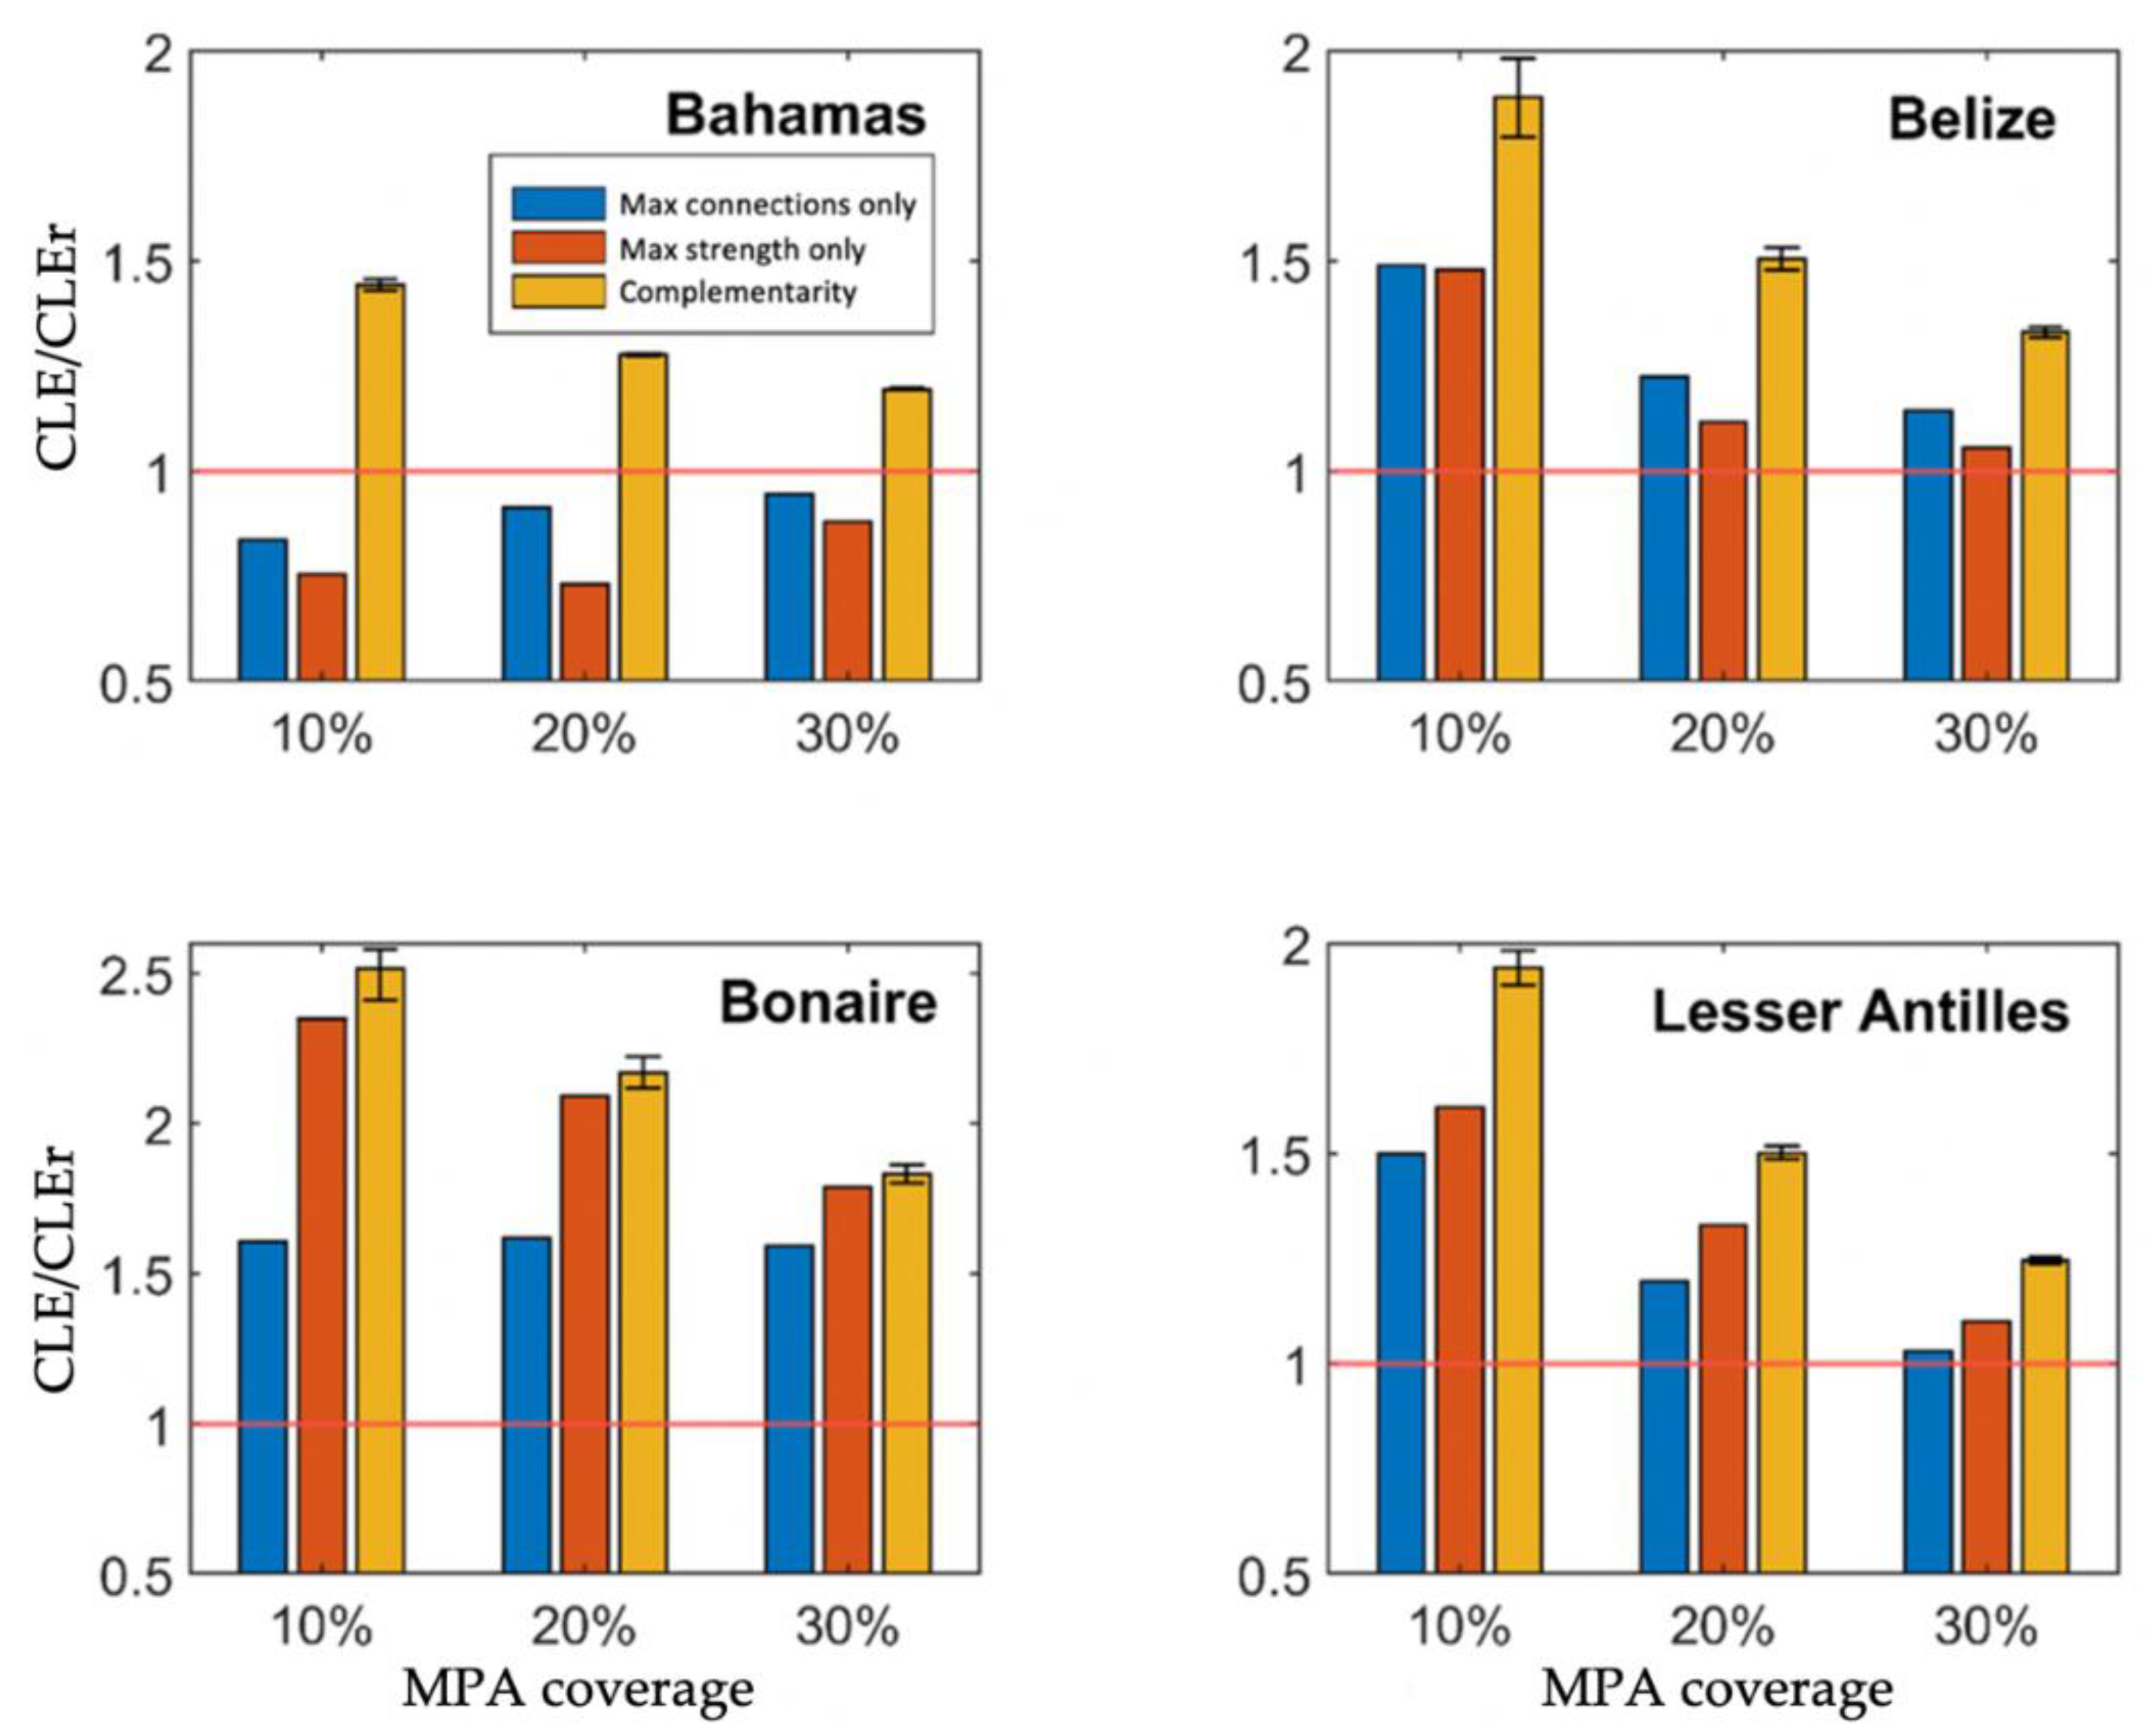
As expected, MPA networks designed with the Complementarity algorithm resulted in more widespread larval saturation than those designed based on simple connectivity metrics. This observation was consistent across all regions, larval saturation thresholds and reserve sizes tested. Compared to a random design CLE (CLEr), mean algorithm CLE increased by 19% to 146% (Figure 3). Algorithm performance in the Bahamas was most closely comparable to CLEr. Methods optimising fixed connectivity metrics also performed worst in the Bahamas. As MPA coverage increased, the performance of all reserve designs trended towards random selection performance, as more sites are shared across different algorithms with the increase in number of reserve sites.
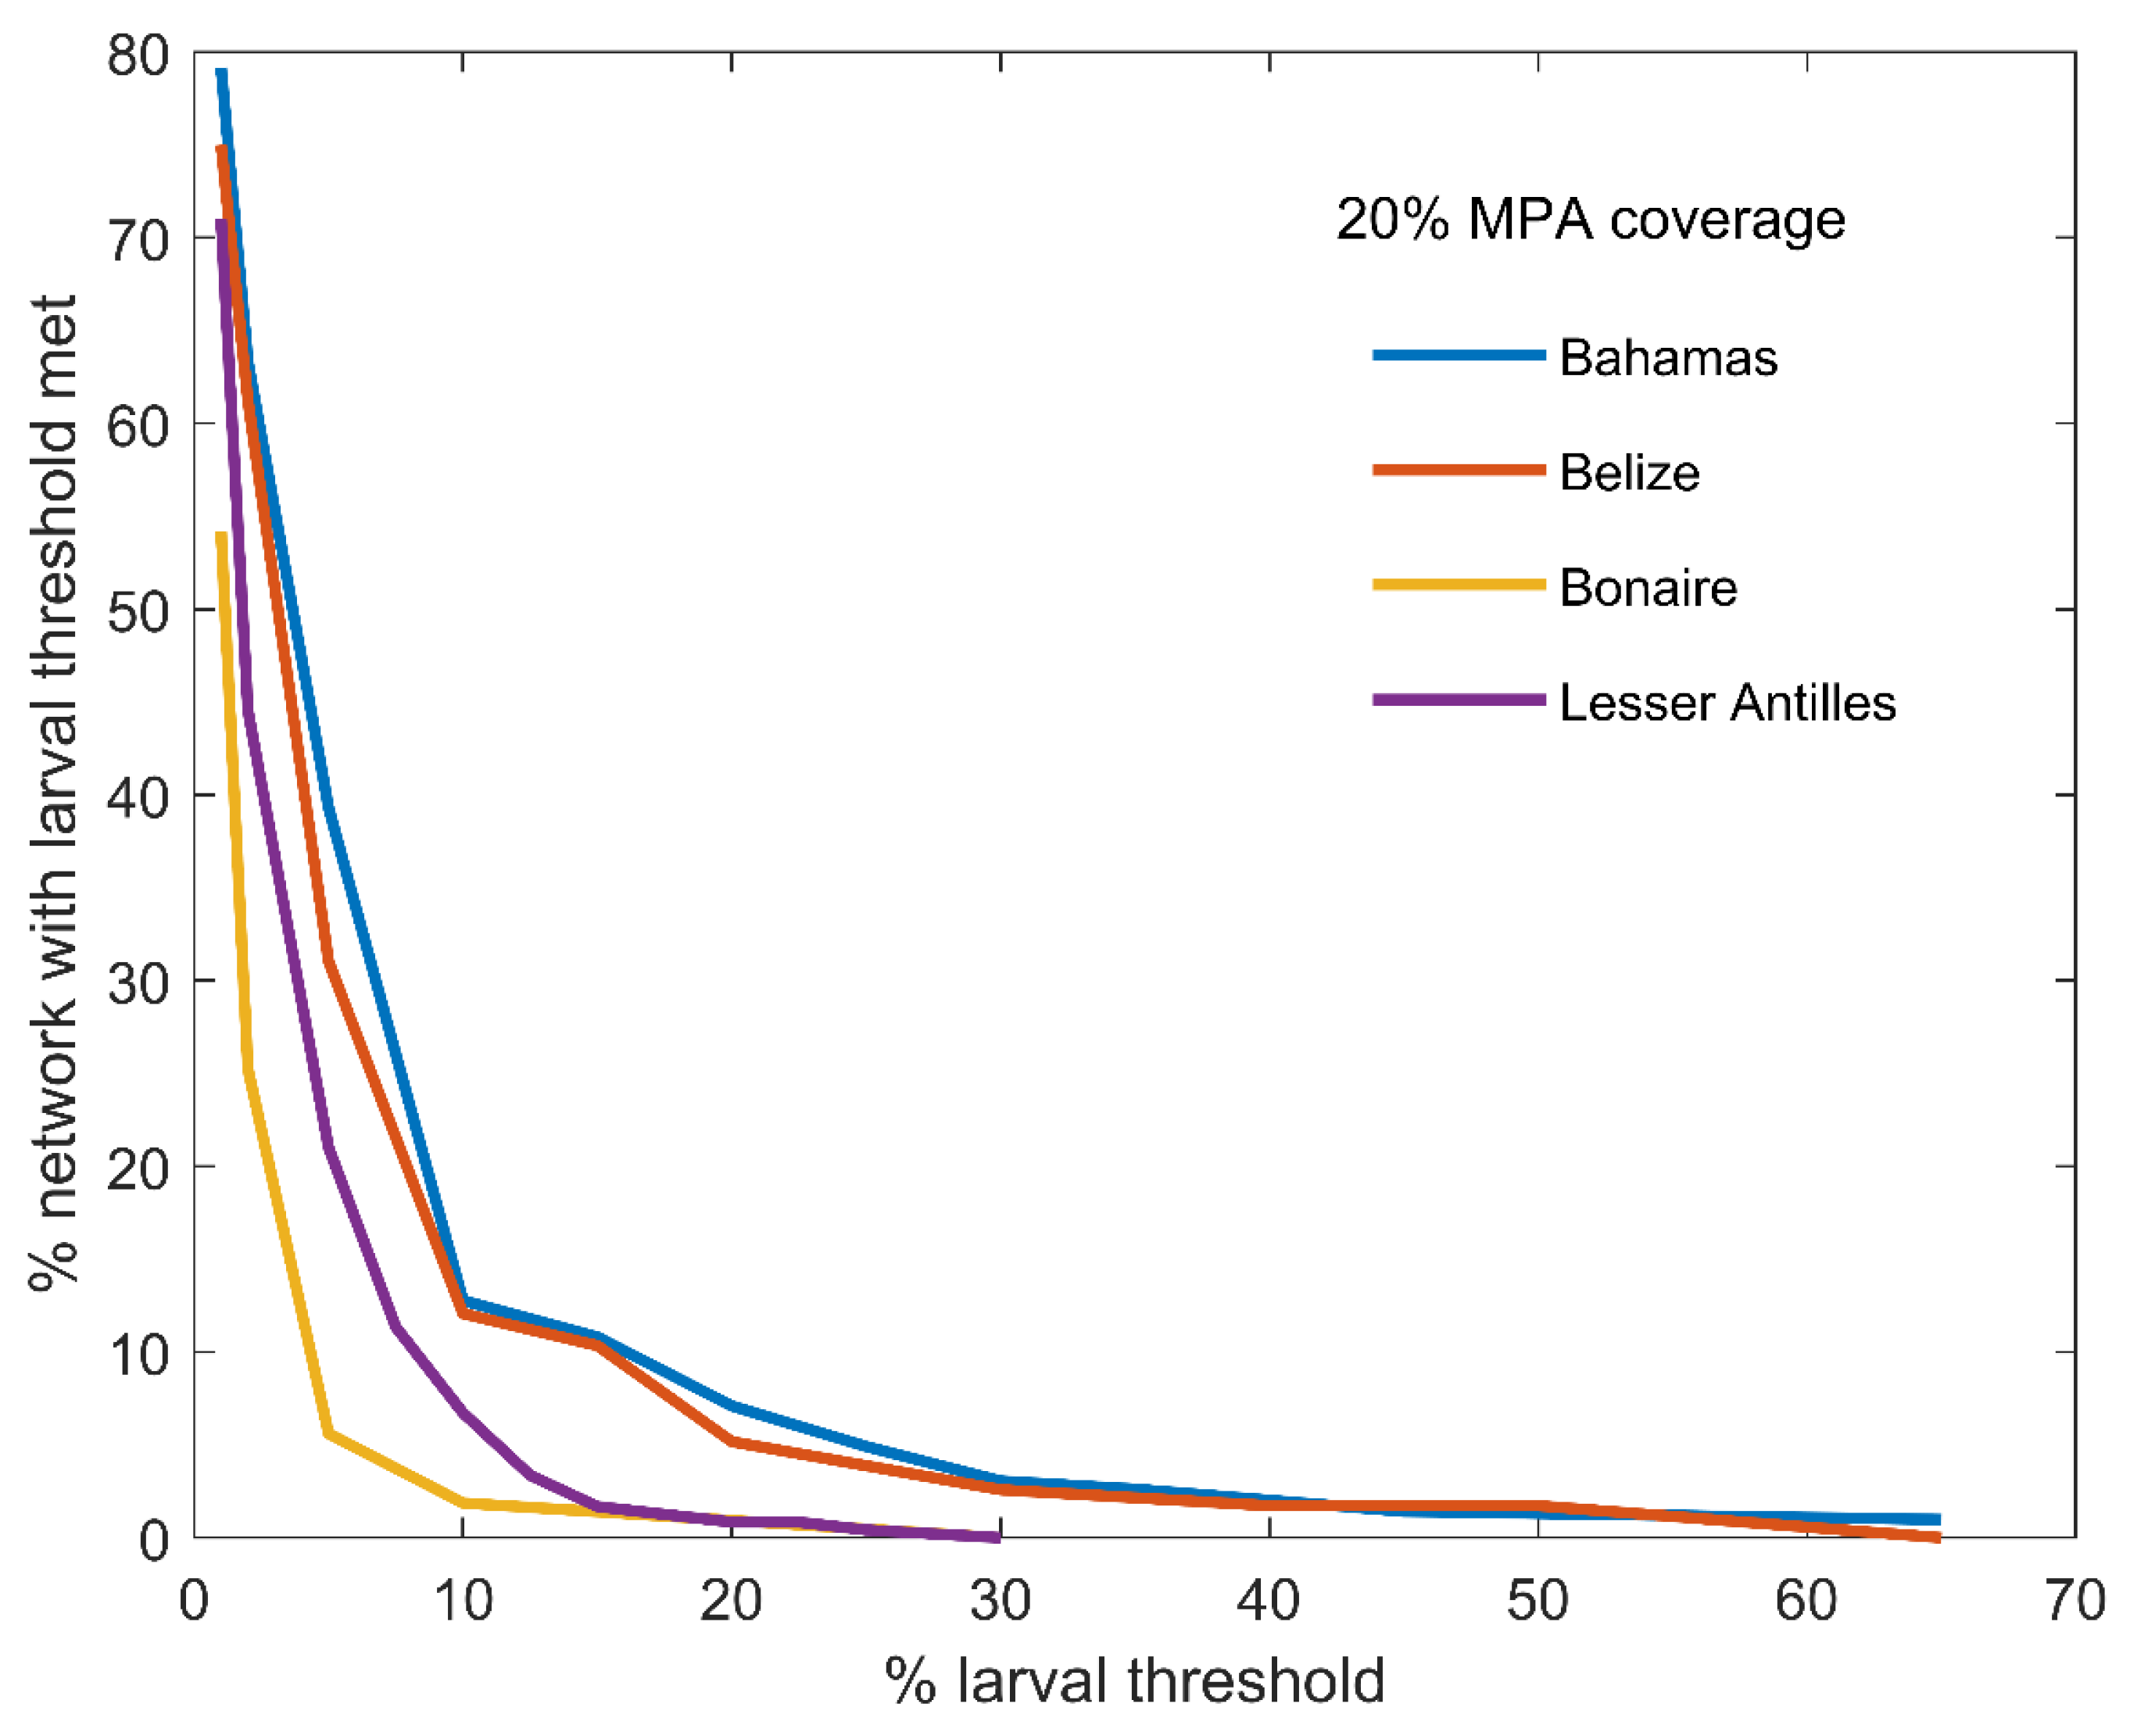
For a given reserve size and larval threshold, dispersal patterns in the Bahamas and Belize allowed for designing MPA systems that distributed larvae more widely across the region (Figure 4). However, as larval threshold increased, performance of the algorithm converged towards the approach which optimised export strength, because fewer sites could then be saturated with larvae. This is because a sufficiently high larval threshold will negate the effects of complementarity and export strength will be the sole site selection criteria. This point occurs at different thresholds based on region (Figure 4). For a given MPA coverage, more strongly connected areas like the Bahamas and Belize required higher thresholds than Bonaire and Lesser Antilles to lose advantage of the Complementarity algorithm.
3.3. Modelling Measures of Performance
Population Modelling
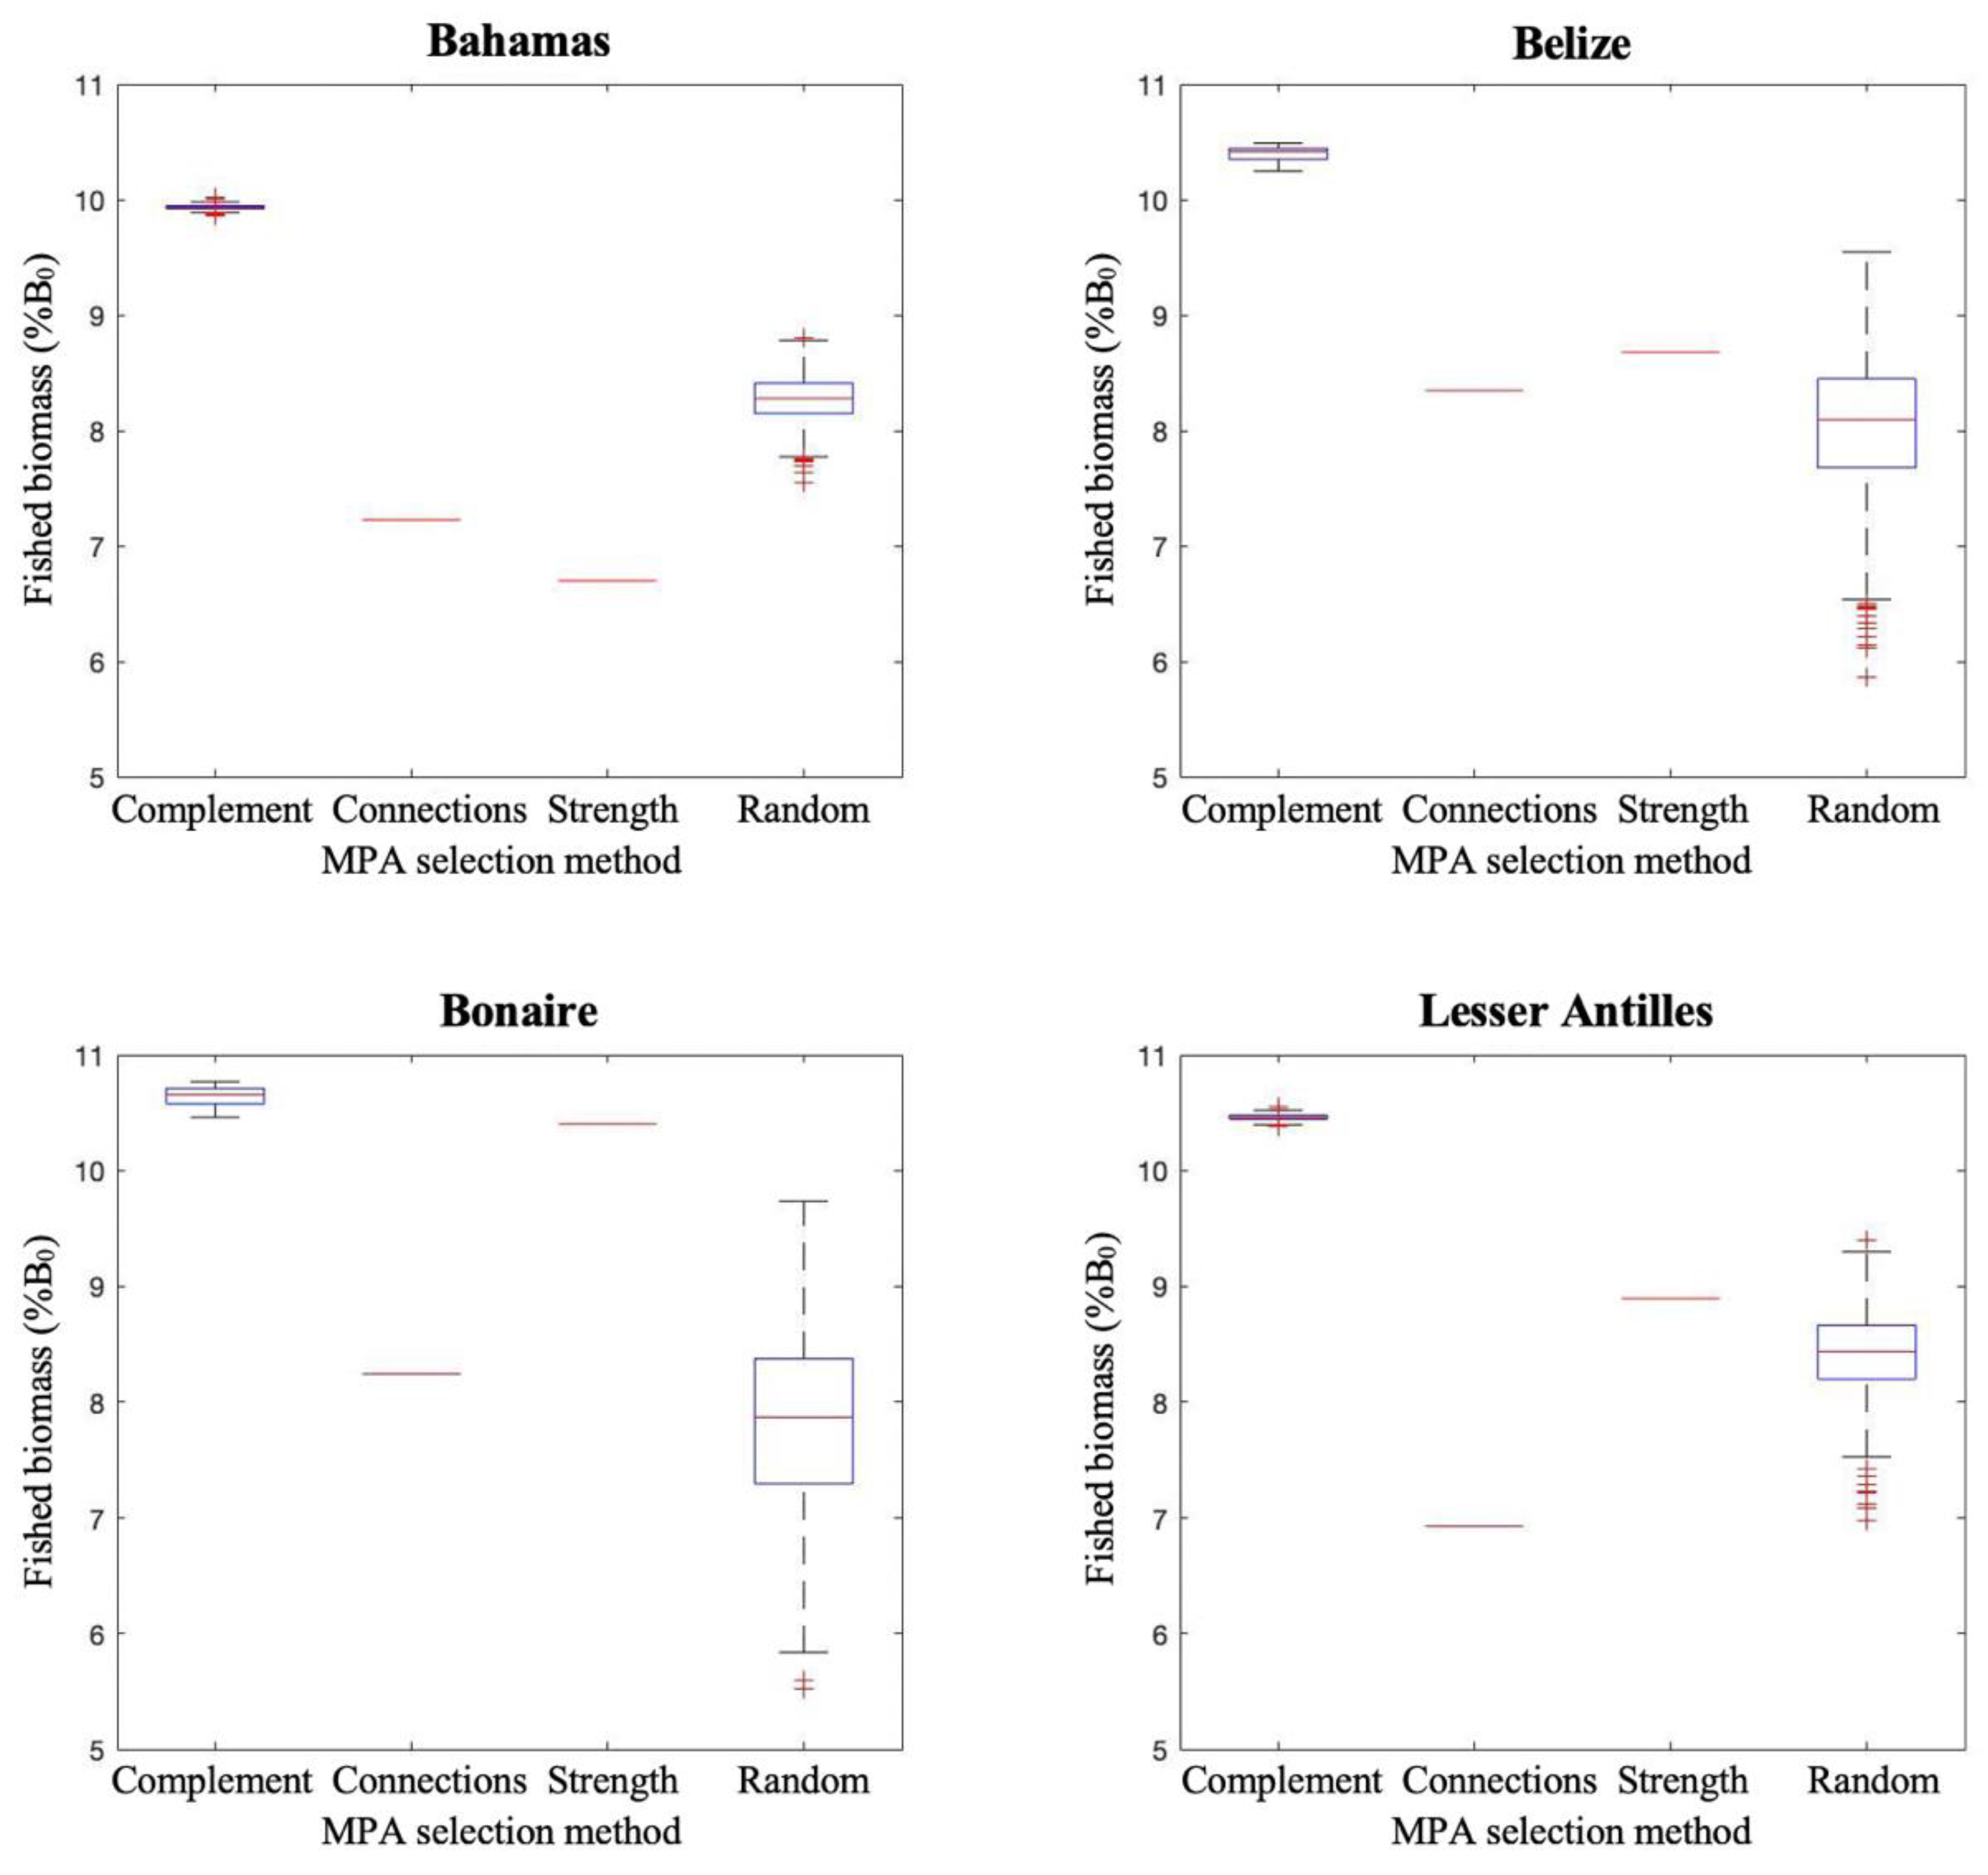
In all regions, the Complementarity algorithm resulted in greater fish biomass in unprotected areas than other approaches (Figure 5). Interestingly, both simpler approaches which selected sites based on optimising connectivity metrics performed comparable to random and, in the Bahamas, performed consistently worse than random site selections. The one exception is in Bonaire, where optimising export strength was almost equivalent to the Complementarity algorithm. However, on average across all regions, MPA selection optimising export strength produced 20% less fished area biomass than the Complementarity algorithm. Compared to random MPA site selections, fished area biomass improved by 27% using the Complementarity algorithm.
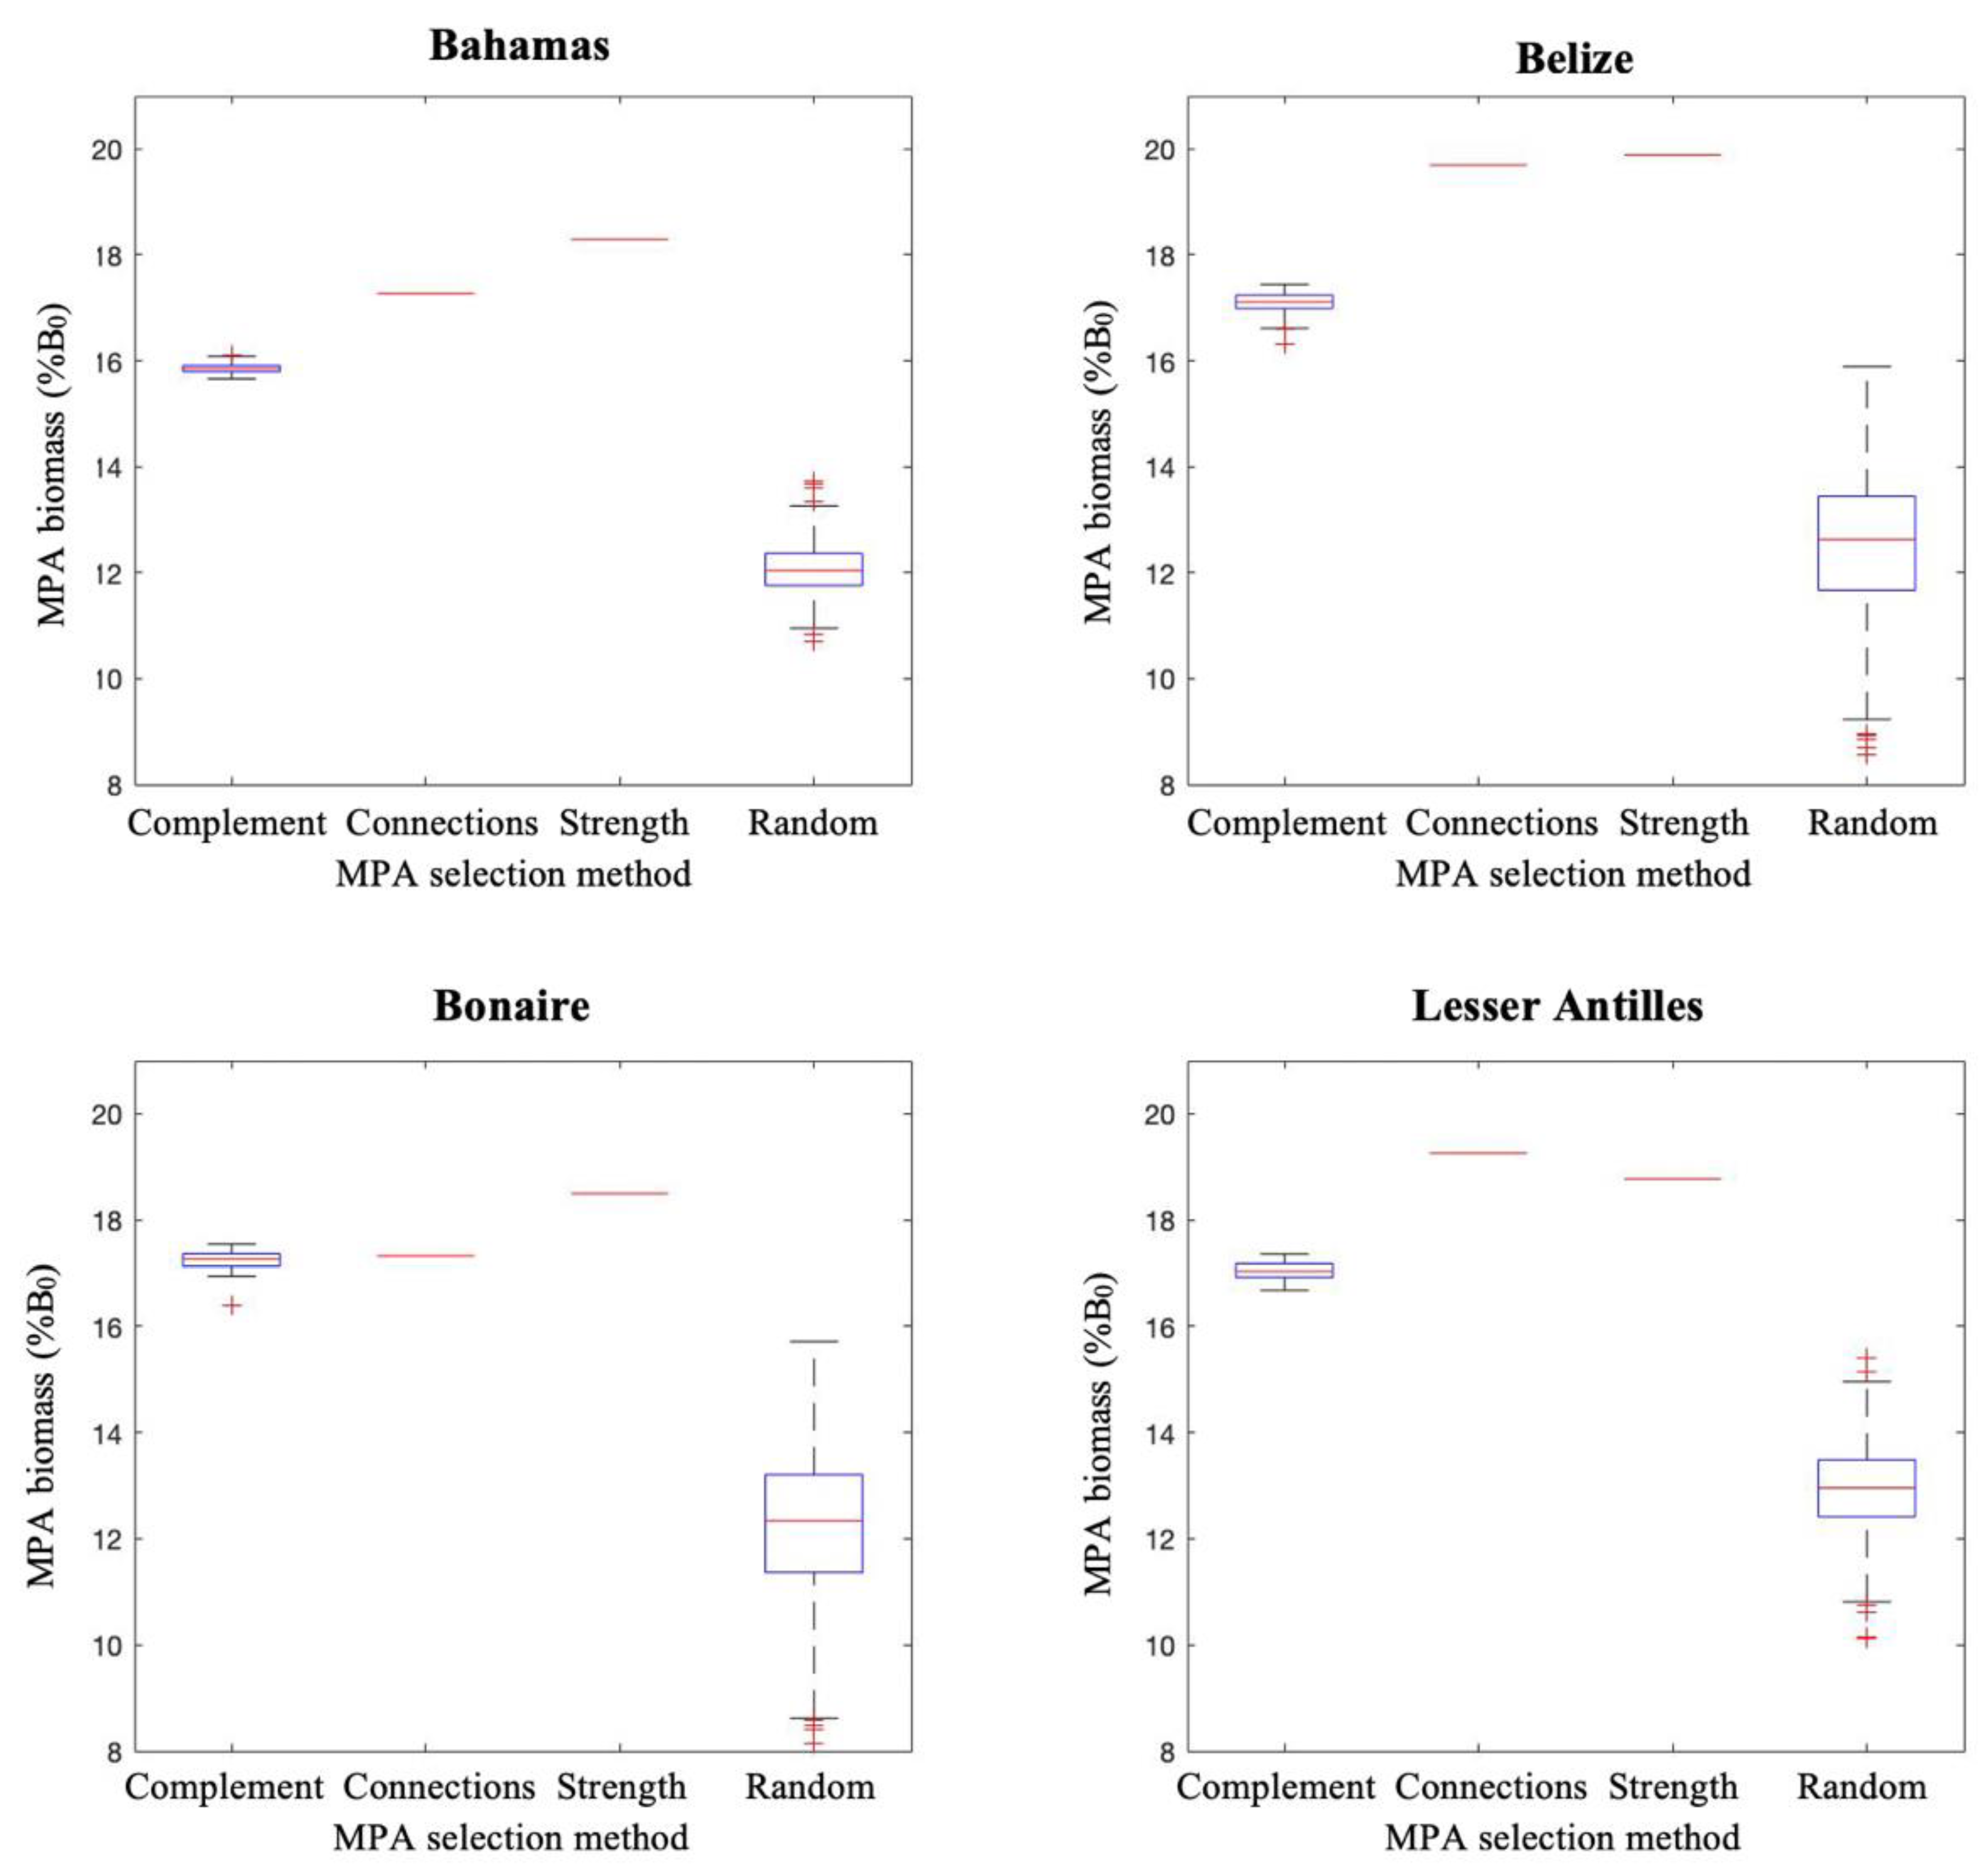
Results for fish biomass within MPAs were different than for biomass in fished areas (Figure 6). Here, the hierarchy of performance was reversed, whereby selections based on fixed site connectivity metrics produced the highest fish biomass. Again, Bonaire presented an exception, where all approaches (excluding random) were largely comparable. Random site selections consistently performed poorly in comparison.
4. Discussion
Our paper set out with the objective to provide a simple and efficient methodology for optimising connectivity in MPA design for fishery objectives. Our methodology proposes a fast, greedy algorithm that identifies combinations of MPAs that maximise spillover of larvae, whilst minimising redundancy and maximising complementarity of larval supply from MPAs in the network. Algorithm performance consistently exceeded network designs which did not account for connectivity, yielding larval export improvements predicted to rebuild fished area biomass by 27% on average. Across all regions, the Complementarity algorithm also produced 20% more biomass in unprotected areas than MPA selections optimising fixed export strength. Importantly, selection approaches that relied on optimising fixed connectivity metrics, such as export strength, often yielded fisheries benefits comparable, or worse, than random site selections.
Counterintuitively, site selection which maximised export strength or connections while ignoring complementarity sometimes produced MPA systems that had poor export strength or connections to the unprotected network. This can be explained due to clustering effects, where the subset of sites that ranked highly in connectivity metrics were interconnected with each other and actually poorly connected to other (unprotected) sites. This was particularly evident in the Bahamas. The presence of connectivity clusters also explained why MPA systems using fixed connectivity metrics tended to produce more biomass within protected areas; their recruitment subsidies were mostly shared amongst the MPA system, and therefore benefited biomass within MPAs. This observation, whereby the optimisation of fixed connectivity metrics can produce results incongruous to design intentions, should elicit caution in using such methodologies to incorporate connectivity. However, metric approaches can be made more robust by incorporating an updating component to them, as is demonstrated by our proposed Complementarity algorithm. Additionally, whilst the benefits from incorporating complementarity was most evident in strongly connected regions where potential for larval redundancy is highest, it was demonstrated to occur in all four regions tested in the Caribbean.
The overarching purpose of the Complementarity algorithm is to help planners simply design MPA systems that benefit fisheries explicitly. Such needs are not easily met by standard MPA planning tools [29]. Moreover, whilst other site selection methods require complex optimisation routines [22,25], we use a simple hill climbing algorithm and updating ranking system (of the metric export strength) to minimise connectivity redundancy. The nature of this process not only reduces the computational requirements, but also the knowledge requirements for planners to make decisions informed by connectivity.
In practice, this algorithm could quickly identify complementary combinations of sites which will provide fishery benefits. Context specific details can be easily added into the design process. For example, larval flow to economically important fishing grounds can be prioritised, or important conservation features and pre-existing MPAs can be locked into the algorithm’s site selection process. A key caveat to note is the access to, and reliability of, the underlying larval dispersal data. Biophysical dispersal models can be highly sensitive to species specific larval behaviour and life history [38], and to different spatial [39] and temporal scales [14]. Care is therefore needed to ensure dispersal models are appropriate to use, in order for subsequent connectivity analysis to be meaningful. With those qualifications in mind, we suggest the proposed algorithm offers a simple and accessible means of improving MPA design for achieving fishery objectives.
Author Contributions
Conceptualisation: P.J.M., C.T. and K.H. Methodology: C.T., K.H., P.J.M., N.C.K. and V.T. Software: C.T., K.H. and N.C.K. Validation: C.T., V.T. Formal Analysis: C.T. Investigation: C.T., K.H., P.J.M., V.T. and N.C.K. Resources: P.J.M. Data Curation: P.J.M. Original Draft Preparation: C.T. Review and Editing: K.H., P.J.M. and N.C.K. Visualisation: C.T. Supervision: K.H. and P.J.M. Project Administration: P.J.M. Funding Acquisition: P.J.M. All authors have read and agreed to the published version of the manuscript.
Funding
This research received no external funding.
Institutional Review Board Statement
Not applicable.
Informed Consent Statement
Not applicable.
Data Availability Statement
Larval dispersal datasets, algorithm, and analysis code available at https://www.dropbox.com/sh/t4gdfkebi2sgugt/AACPRr2egDmQFKywENUJHqXBa?dl=0 (accessed on 17 November 2021).
Conflicts of Interest
The authors declare no conflict of interest.
References
- Carr, M.H.; Neigel, J.E.; Estes, J.A.; Andelman, S.; Warner, R.R.; Largier, J.L. Comparing marine and terrestrial ecosystems: Implications for the design of coastal marine reserves. Ecol. Appl. 2003, 13 (Suppl. 1), 90–107. [Google Scholar] [CrossRef] [Green Version]
- Brown, C.J.; Harborne, A.R.; Paris, C.B.; Mumby, P.J. Uniting paradigms of connectivity in marine ecology. Ecology 2016, 97, 2447–2457. [Google Scholar] [CrossRef] [PubMed] [Green Version]
- Righton, D.; Mills, C. Application of GIS to investigate the use of space in coral reef fish: A comparison of territorial behaviour in two red sea butterflyfishes. Int. J. Geogr. Inf. Sci. 2006, 20, 215–232. [Google Scholar] [CrossRef]
- Claisse, J.T.; Clark, T.B.; Schumacher, B.D.; McTee, S.A.; Bushnell, M.E.; Callan, C.K.; Parrish, J.D. Conventional tagging and acoustic telemetry of a small surgeonfish, Zebrasoma flavescens, in a structurally complex coral reef environment. Environ. Biol. Fishes 2011, 91, 185–201. [Google Scholar] [CrossRef]
- Green, A.L.; Maypa, A.P.; Almany, G.R.; Rhodes, K.L.; Weeks, R.; Abesamis, R.A.; White, A.T. Larval dispersal and movement patterns of coral reef fishes, and implications for marine reserve network design. Biol. Rev. 2015, 90, 1215–1247. [Google Scholar] [CrossRef]
- Nash, K.L.; Welsh, J.Q.; Graham, N.A.; Bellwood, D.R. Home-range allometry in coral reef fishes: Comparison to other vertebrates, methodological issues and management implications. Oecologia 2015, 177, 73–83. [Google Scholar] [CrossRef]
- Hanski, I.; Ovaskainen, O. Metapopulation theory for fragmented landscapes. Theor. Popul. Biol. 2003, 64, 119–127. [Google Scholar] [CrossRef]
- Sale, P.F.; Cowen, R.K.; Danilowicz, B.S.; Jones, G.P.; Kritzer, J.P.; Lindeman, K.C.; Steneck, R.S. Critical science gaps impede use of no-take fishery reserves. Trends Ecol. Evol. 2005, 20, 74–80. [Google Scholar] [CrossRef]
- Hock, K.; Wolff, N.H.; Ortiz, J.C.; Condie, S.A.; Anthony, K.R.N.; Blackwell, P.G.; Mumby, P.J. Connectivity and systemic resilience of the great barrier reef. PLoS Biol. 2017, 15, e2003355. [Google Scholar] [CrossRef]
- Hock, K.; Doropoulos, C.; Gorton, R.; Condie, S.A.; Mumby, P.J. Split spawning increases robustness of coral larval supply and inter-reef connectivity. Nat. Commun. 2019, 10, 3463. [Google Scholar] [CrossRef] [Green Version]
- Riginos, C.; Hock, K.; Matias, A.M.; Mumby, P.J.; van Oppen, M.J.H.; Lukoschek, V. Asymmetric dispersal is a critical element of concordance between biophysical dispersal models and spatial genetic structure in Great Barrier Reef corals. Divers. Distrib. 2019, 25, 1684–1696. [Google Scholar] [CrossRef] [Green Version]
- White, C.; Selkoe, K.A.; Watson, J.; Siegel, D.A.; Zacherl, D.C.; Toonen, R.J. Ocean currents help explain population genetic structure. Proc. R. Soc. B Biol. Sci. 2010, 277, 1685–1694. [Google Scholar] [CrossRef] [Green Version]
- Cowen, R.K.; Paris, C.B.; Srinivasan, A. Scaling of connectivity in marine populations. Science 2006, 311, 522–527. [Google Scholar] [CrossRef] [Green Version]
- Watson, J.R.; Kendall, B.E.; Siegel, D.A.; Mitarai, S. Changing seascapes, stochastic connectivity, and marine metapopulation dynamics. Am. Nat. 2012, 180, 99–112. [Google Scholar] [CrossRef] [Green Version]
- Green, A.L.; Fernandes, L.; Almany, G.; Abesamis, R.; McLeod, E.; Aliño, P.M.; Pressey, R.L. Designing marine reserves for fisheries management, biodiversity conservation, and climate change adaptation. Coast. Manag. 2014, 42, 143–159. [Google Scholar] [CrossRef]
- Balbar, A.C.; Metaxas, A. The current application of ecological connectivity in the design of marine protected areas. Glob. Ecol. Conserv. 2019, 17, e00569. [Google Scholar] [CrossRef]
- Ospina-Alvarez, A.; de Juan, S.; Alós, J.; Basterretxea, G.; Alonso-Fernández, A.; Follana-Berná, G.; Catalán, I.A. MPA network design based on graph theory and emergent properties of larval dispersal. Mar. Ecol. Prog. Ser. 2020, 650, 309–326. [Google Scholar] [CrossRef]
- Jones, G.P.; Almany, G.R.; Russ, G.R.; Sale, P.F.; Steneck, R.S.; Van Oppen, M.J.H.; Willis, B.L. Larval retention and connectivity among populations of corals and reef fishes: History, advances and challenges. Coral Reefs 2009, 28, 307–325. [Google Scholar] [CrossRef]
- Krueck, N.C.; Ahmadia, G.N.; Possingham, H.P.; Riginos, C.; Treml, E.A.; Mumby, P.J. Marine reserve targets to sustain and rebuild unregulated fisheries. PLoS Biol. 2017, 15, e2000537. [Google Scholar] [CrossRef] [Green Version]
- Harrison, H.B.; Williamson, D.H.; Evans, R.D.; Almany, G.R.; Thorrold, S.R.; Russ, G.R.; Jones, G.P. Larval export from marine reserves and the recruitment benefit for fish and fisheries. Curr. Biol. 2012, 22, 1023–1028. [Google Scholar] [CrossRef] [PubMed] [Green Version]
- Halpern, B.S.; Warner, R.R. Matching marine reserve design to reserve objectives. Proc. R. Soc. London Ser. B Biol. Sci. 2003, 270, 1871–1878. [Google Scholar] [CrossRef] [Green Version]
- Krueck, N.C.; Ahmadia, G.N.; Green, A.; Jones, G.P.; Possingham, H.P.; Riginos, C.; Mumby, P.J. Incorporating larval dispersal into MPA design for both conservation and fisheries. Ecol. Appl. 2017, 27, 925–941. [Google Scholar] [CrossRef] [PubMed] [Green Version]
- Gaines, S.D.; White, C.; Carr, M.H.; Palumbi, S.R. Designing marine reserve networks for both conservation and fisheries management. Proc. Natl. Acad. Sci. USA 2010, 107, 18286–18293. [Google Scholar] [CrossRef] [PubMed] [Green Version]
- Roberts, C.M.; Branch, G.; Bustamante, R.H.; Castilla, J.C.; Dugan, J.; Halpern, B.S.; Warner, R.R. Application of ecological criteria in selecting marine reserves and developing reserve networks. Ecol. Appl. 2003, 13 (Suppl. 1), 215–228. [Google Scholar] [CrossRef] [Green Version]
- White, J.W.; Schroeger, J.; Drake, P.T.; Edwards, C.A. The value of larval connectivity information in the static optimization of marine reserve design. Conserv. Lett. 2014, 7, 533–544. [Google Scholar] [CrossRef]
- Beger, M.; Linke, S.; Watts, M.; Game, E.; Treml, E.; Ball, I.; Possingham, H.P. Incorporating asymmetric connectivity into spatial decision making for conservation. Conserv. Lett. 2010, 3, 359–368. [Google Scholar] [CrossRef]
- Mumby, P.J. Bleaching and hurricane disturbances to populations of coral recruits in Belize. Mar. Ecol. Prog. Ser. 1999, 190, 27–35. [Google Scholar] [CrossRef] [Green Version]
- Magris, R.A.; Treml, E.A.; Pressey, R.L.; Weeks, R. Integrating multiple species connectivity and habitat quality into conservation planning for coral reefs. Ecography 2016, 39, 649–664. [Google Scholar] [CrossRef]
- Daigle, R.M.; Metaxas, A.; Balbar, A.C.; McGowan, J.; Treml, E.A.; Kuempel, C.D.; Beger, M. Operationalizing ecological connectivity in spatial conservation planning with marxan connect. Methods Ecol. Evol. 2020, 11, 570–579. [Google Scholar] [CrossRef] [Green Version]
- Ball, I.R.; Possingham, H.P.; Watts, M. Marxan and relatives: Software for spatial conservation prioritisation. Spat. Conserv. Prioritisation Quant. Methods Comput. Tools 2009, 14, 185–196. [Google Scholar]
- Beverton, R.; Holt, S. On the Dynamics of Exploited Fish Populations; Springer: Dordrecht, The Netherlands, 1993. [Google Scholar]
- Holstein, D.M.; Paris, C.B.; Mumby, P.J. Consistency and inconsistency in multispecies population network dynamics of coral reef ecosystems. Mar. Ecol. Prog. Ser. 2014, 499, 1–18. [Google Scholar] [CrossRef] [Green Version]
- Hilborn, R.; Walters, C.J. Quantitative Fisheries Stock Assessment: Choice, Dynamics, and Uncertainty; Springer Science & Business Media: Berlin/Heidelberg, Germany, 1992. [Google Scholar]
- Paris, C.B.; Helgers, J.; Van Sebille, E.; Srinivasan, A. Connectivity modeling system: A probabilistic modeling tool for the multi-scale tracking of biotic and abiotic variability in the ocean. Environ. Model. Softw. 2013, 42, 47–54. [Google Scholar] [CrossRef]
- Walters, C.J.; Hilborn, R.; Parrish, R. An equilibrium model for predicting the efficacy of marine protected areas in coastal environments. Can. J. Fish. Aquat. Sci. 2007, 64, 1009–1018. [Google Scholar] [CrossRef]
- Krueck, N.; Abdurrahim, A.; Adhuri, D.; Mumby, P.; Ross, H. Quantitative decision support tools facilitate social-ecological alignment in community-based marine protected area design. Ecol. Soc. 2019, 24, 6. [Google Scholar] [CrossRef] [Green Version]
- Myers, R.A.; Bowen, K.G.; Barrowman, N.J. Maximum reproductive rate of fish at low population sizes. Can. J. Fish. Aquat. Sci. 1999, 56, 2404–2419. [Google Scholar] [CrossRef]
- Bode, M.; Leis, J.M.; Mason, L.B.; Williamson, D.H.; Harrison, H.B.; Choukroun, S.; Jones, G.P. Successful validation of a larval dispersal model using genetic parentage data. PLoS Biol. 2019, 17, e3000380. [Google Scholar] [CrossRef] [Green Version]
- Taebi, S.; Lowe, R.J.; Pattiaratchi, C.B.; Ivey, G.N.; Symonds, G. A numerical study of the dynamics of the wave-driven circulation within a fringing reef system. Ocean Dyn. 2012, 62, 585–602. [Google Scholar] [CrossRef]
Figure 1.
Major surface ocean current flow, with numbered labels of regions. Across these areas, ocean currents and island configurations result in different connectivity regimes. Bahamas (1) and Belize (2) have strong, complex connectivity regimes, with dense clusters of islands and the former subject to converging currents of the Gulf Stream and the Antilles Current. The Lesser Antilles (4) consists of a chain islands with north westerly ocean currents. Bonaire (3) is comprised of a disparate series of islands and is subjected to lateral, westerly currents from the Caribbean Current. Note that the oceanographic model is far more complex than illustrated here.

Figure 2.
Scatter plots depicting the strength and quantity of connections from MPA systems to the unprotected component of the entire network, at 20% MPA coverage. Export strength ratio refers to the strength of larval flow from MPA systems to unprotected sites, as a fraction of total larval flow across the respective region. Export connection ratio refers to the number of connections from MPA systems to unprotected sites, relative to total number of connections across all sites in the region. MPA systems in the top right quadrant are both strong larval exporters to unprotected areas and connected to many unprotected areas. Again, Complementarity refers to the algorithm MPA systems (n = 1000); “Max connections only” and “Max strength only” refer to optimising fixed connectivity metrics (n = 1); and Random refers to randomly selected MPA systems (n = 1000).

Figure 3.
Connectivity reserve selection methods compared relative to random reserve selection, across three MPA coverage scenarios, at a 10% larval threshold. Constrained larval export (CLE) of connectivity methods (complementarity algorithm, strength, and connections) were standardised against average CLE of random MPA network design (CLEr). CLE values above 1, highlighted by red horizontal lines, represent better results than CLEr. One thousand simulations were run for algorithm reserves and random selection. Average algorithm performance is represented by the bar value labelled “Complementarity”, accompanied by a min and max interval range for all simulations. “Max connections only” and “Max strength only” represent MPA systems that optimise fixed metrics—export connections and export strength, respectively.

Figure 4.
Proportion of sites in the global network with larval threshold met, as a function of larval threshold. The larval threshold is a predetermined value used to represent larval saturation, or the point at which larval subsidies to a site become redundant.
Figure 4.
Proportion of sites in the global network with larval threshold met, as a function of larval threshold. The larval threshold is a predetermined value used to represent larval saturation, or the point at which larval subsidies to a site become redundant.

Figure 5.
Equilibrium fish biomass in fished areas (unprotected areas) predicted for different MPA selection strategies, at 20% MPA coverage. Simulated biomass is represented as a percentage of the total unfished biomass (B0). Complement refers to the proposed algorithm, selecting MPA systems that minimise larval export redundancy (n = 1000). Scenarios “Connections” and “Strength” refer to the selections based on fixed metrics of larval export connection numbers and export strength, respectively (n = 1). Random represents haphazard protected area placement that still achieved the same habitat coverage as targeted placement strategies (n = 1000).

Figure 6.
Population model results for fish biomass in protected areas at year 100 of simulations for different MPA selection strategies, at 20% MPA coverage. Simulated MPA biomass is represented as a percentage of B0, the hypothetical network biomass in conditions where no fishing occurs. Scenarios are described in the text.


Table 1.
Descriptive metrics of global network connectivity.
| Metrics | Definition |
|---|---|
| Average connections | average number of connections at any site of the network, calculated as the sum of all connections divided by the number of sites in the network. |
| Average strength | average larval flow from any site in the network calculated as the sum of all connection weights divided by the number of sites in the network. |
| Biconnected components | a measure of network decomposition into a tree of biconnected components. Biconnected components are connected nodes where if any one node is removed, the remaining nodes will still be connected. Articulation points are the nodes which join biconnected components together to form the global network. Therefore, fewer biconnected components suggests a network which is more cohesive and less disjointed. |
Table 2.
Descriptive metrics of global connectivity for the four study regions. Average connections and strength describe the mean number of connections per site and mean flow of larvae between sites, respectively. Biconnected components refer to clusters which are connected together in two or more simple pathways. Biconnected components combine together to form the global network; therefore, fewer biconnected components suggests a more cohesive regional connectivity pattern.
| Region | Average Connections | Average Strength | Biconnected Components |
|---|---|---|---|
| Bahamas | 102 | 0.2 | 3 |
| Belize | 43 | 0.12 | 1 |
| Bonaire | 36 | 0.04 | 6 |
| Lesser Antilles | 46 | 0.08 | 2 |
Publisher’s Note: MDPI stays neutral with regard to jurisdictional claims in published maps and institutional affiliations. |
© 2021 by the authors. Licensee MDPI, Basel, Switzerland. This article is an open access article distributed under the terms and conditions of the Creative Commons Attribution (CC BY) license (https://creativecommons.org/licenses/by/4.0/).
Share and Cite
MDPI and ACS Style
Tong, C.; Hock, K.; Krueck, N.C.; Tyazhelnikov, V.; Mumby, P.J. An MPA Design Approach to Benefit Fisheries: Maximising Larval Export and Minimising Redundancy. Diversity 2021, 13, 586. https://0-doi-org.brum.beds.ac.uk/10.3390/d13110586
AMA Style
Tong C, Hock K, Krueck NC, Tyazhelnikov V, Mumby PJ. An MPA Design Approach to Benefit Fisheries: Maximising Larval Export and Minimising Redundancy. Diversity. 2021; 13(11):586. https://0-doi-org.brum.beds.ac.uk/10.3390/d13110586
Chicago/Turabian StyleTong, Colm, Karlo Hock, Nils C. Krueck, Vladimir Tyazhelnikov, and Peter J. Mumby. 2021. "An MPA Design Approach to Benefit Fisheries: Maximising Larval Export and Minimising Redundancy" Diversity 13, no. 11: 586. https://0-doi-org.brum.beds.ac.uk/10.3390/d13110586
Note that from the first issue of 2016, this journal uses article numbers instead of page numbers. See further details here.