Article

Perceptions of Local Inhabitants towards Land Management Systems Used in the Rainforest Area of Ecuador: An Evaluation Based on Visual Rating of the Main Land Use Types

by
Alex Vinicio Gavilanes Montoya
1,2,
Danny Daniel Castillo Vizuete
1,2,* and
Stelian Alexandru Borz
2,*
1
Faculty of Natural Resources, Escuela Superior Politécnica de Chimborazo, Panamericana Sur, Km 1 ½, Riobamba EC-060155, Ecuador
2
Department of Forest Engineering, Forest Management Planning and Terrestrial Measurements, Faculty of Silviculture and Forest Engineering, Transilvania University of Brasov, Şirul Beethoven 1, 500123 Brasov, Romania
*
Authors to whom correspondence should be addressed.
Submission received: 15 September 2021 / Revised: 11 November 2021 / Accepted: 16 November 2021 / Published: 18 November 2021
(This article belongs to the Special Issue Forest Management and Biodiversity Conservation)

Abstract

:
Land management policy and practice affects a wide segment of stakeholders, including the general population of a given area. This study evaluates the perceptions of local inhabitants towards the land management systems used in the rainforest area of Ecuador—namely, unmanaged (natural) forest, managed forest, croplands, and pasturelands. Data collected as ratings on 12 pictures were used to check the aggregated perceptions by developing the relative frequencies of ratings, in order to see how the perception rating data were associated with the types of land management systems depicted by the pictures, and to see whether the four types of land management could be mathematically represented by a clustering solution. A distinctive result was that the natural forests were the most positively rated, while the managed forests were the least positively rated among the respondents. It seems, however, that human intervention was not the landscape-related factor affecting this perception, since croplands and pasturelands also received high ratings. The ratings generated a clear clustering solution only in the case of forest management, indicating three groups: natural forests, managed forests, and the rest of the land management systems. Based on the results of this study, a combination of the four land use systems would balance the expectations of different stakeholders from the area, while also being consistent to some extent with the current diversity in land management systems. However, a more developed system of information propagation would be beneficial to educate the local population with regards to the benefits and drawbacks of different types of land management systems and their distribution.

1. Introduction

Forests sustain human societies via the provision of a wide range of ecosystem services [1] that are essential for the existence and wellbeing of humans [2]. Forest ecosystems have been always seen by humans as an important source of goods and services, which have supported human existence [3]. However, the sustainable management of forest ecosystems entails a great challenge for all those involved, requiring large spatial and temporal scales [4].
There are nine forest types in Ecuador, one of which is the rainforest [5]. Rainforests are biodiverse, and play an important role in the functioning of the Earth [6,7], accounting for ~36% (14.5 million km2) of the world’s forested areas [8]. The forests of Ecuador are spread over 12.5 million ha, and rainforests account for 42.32% of the country’s forested area [9,10]; they provide a wide range of services—such as food, energy, products for medical care, and building materials [11]—for the benefit of their owners and users [12]. In addition, for local communities, forests hold an intrinsic sociocultural value [13], which is why the forest management approach is increasingly considered through the framework of environmental policies [14]. The sustainable management of forest ecosystems requires the legitimacy of key political actors and an integrated support framework in the form of governmental and non-governmental institutions [15,16]. Involving communities in these processes is considered to be one of the key factors for effective forest governance [17]—even more so when the indigenous people are increasingly convinced of their role as guardians of the forest [18]. However, the lack of support policies for land tenure and ownership in local communities prevents the fulfillment of the objectives of sustainable forest management in certain cases [19,20]. For this reason, different forms of forest management have emerged, through which forest authorities work together with local governments and communities to make decisions on forest management, via a participatory approach [21]. The participatory approach to land management planning is seen as a fundamental way to involve local people in the planning process by integrating local knowledge and perspectives [22].
Among the participatory methods for the management of forest ecosystems, and for valuing the landscapes, are those of visual aesthetics. Globally, visual aesthetics is considered an important resource for the assessment of ecosystems, and it is a reliable method used to increase the visual quality of a landscape by design and management activities [23,24]. Visual assessment of landscape quality, or “visual assessment”, refers to the procedures implemented to characterize the scenic beauty of landscapes [25]. Accordingly, visual assessment places value on beauty, and identifies key aspects of the landscapes [26]. Aesthetic evaluation is known to be divided into two approaches: the objective approach, which is supported by the physical paradigm, and the subjective approach, which is supported by the psychological paradigm [25,27]. The objective approach considers aesthetic quality as an intrinsic attribute of a landscape, while the subjective approach assumes that aesthetic quality is a subjective value shaped in the evaluator’s mind [27,28]. However, many of those who conducted research on the evaluation of aesthetic preferences believe that aesthetic quality is located at the interaction between the physical and psychological characteristics of the landscape and of those who evaluate the landscape (e.g., [28,29,30,31]). In addition, taking into account the landscape’s quality can increase our understanding of how landscapes change [32]. Today, in environmental planning and management, the approach of preserving the aesthetic diversity of landscapes has become an important part of decision making [33]. On the other hand, the definition of landscape has evolved over the years, so as to focus it on aesthetic values, resources, and the combination of physical, biological, ecological, and human components. The landscape can now be seen as the scene of human activity, and any artificially induced change may affect human perceptions of it. The actions that have generated landscape losses have been mainly anthropogenic, and they have caused a growing and rapid deterioration of the landscape’s quality. Therefore, a continuous evaluation of the landscape is required—particularly to measure the state of degradation or improvement of ecosystems. Consequently, data are needed to support the implementation of actions by local governments and competent entities to improve the state of the landscapes.
The aim of this study was to evaluate the perceptions of local inhabitants towards the land management systems used in the rainforest area of Ecuador, based on visual rating of the main land use types. In this sense, the first objective of this study was to evaluate the visual perceptions of local inhabitants with regard to different types of land management systems—namely, natural forests, managed forests, croplands, and pasturelands—by a picture-rating approach. The second objective was to check whether there are important associations of the locals’ ratings with the type of land management system, while the third objective of the study was to check whether the locals’ ratings shape individualized groups of land management as a collective reflection over the rated land management systems. Potential effects of sociodemographic features, as well as some implications of the study’s findings, are also discussed.

2. Materials and Methods
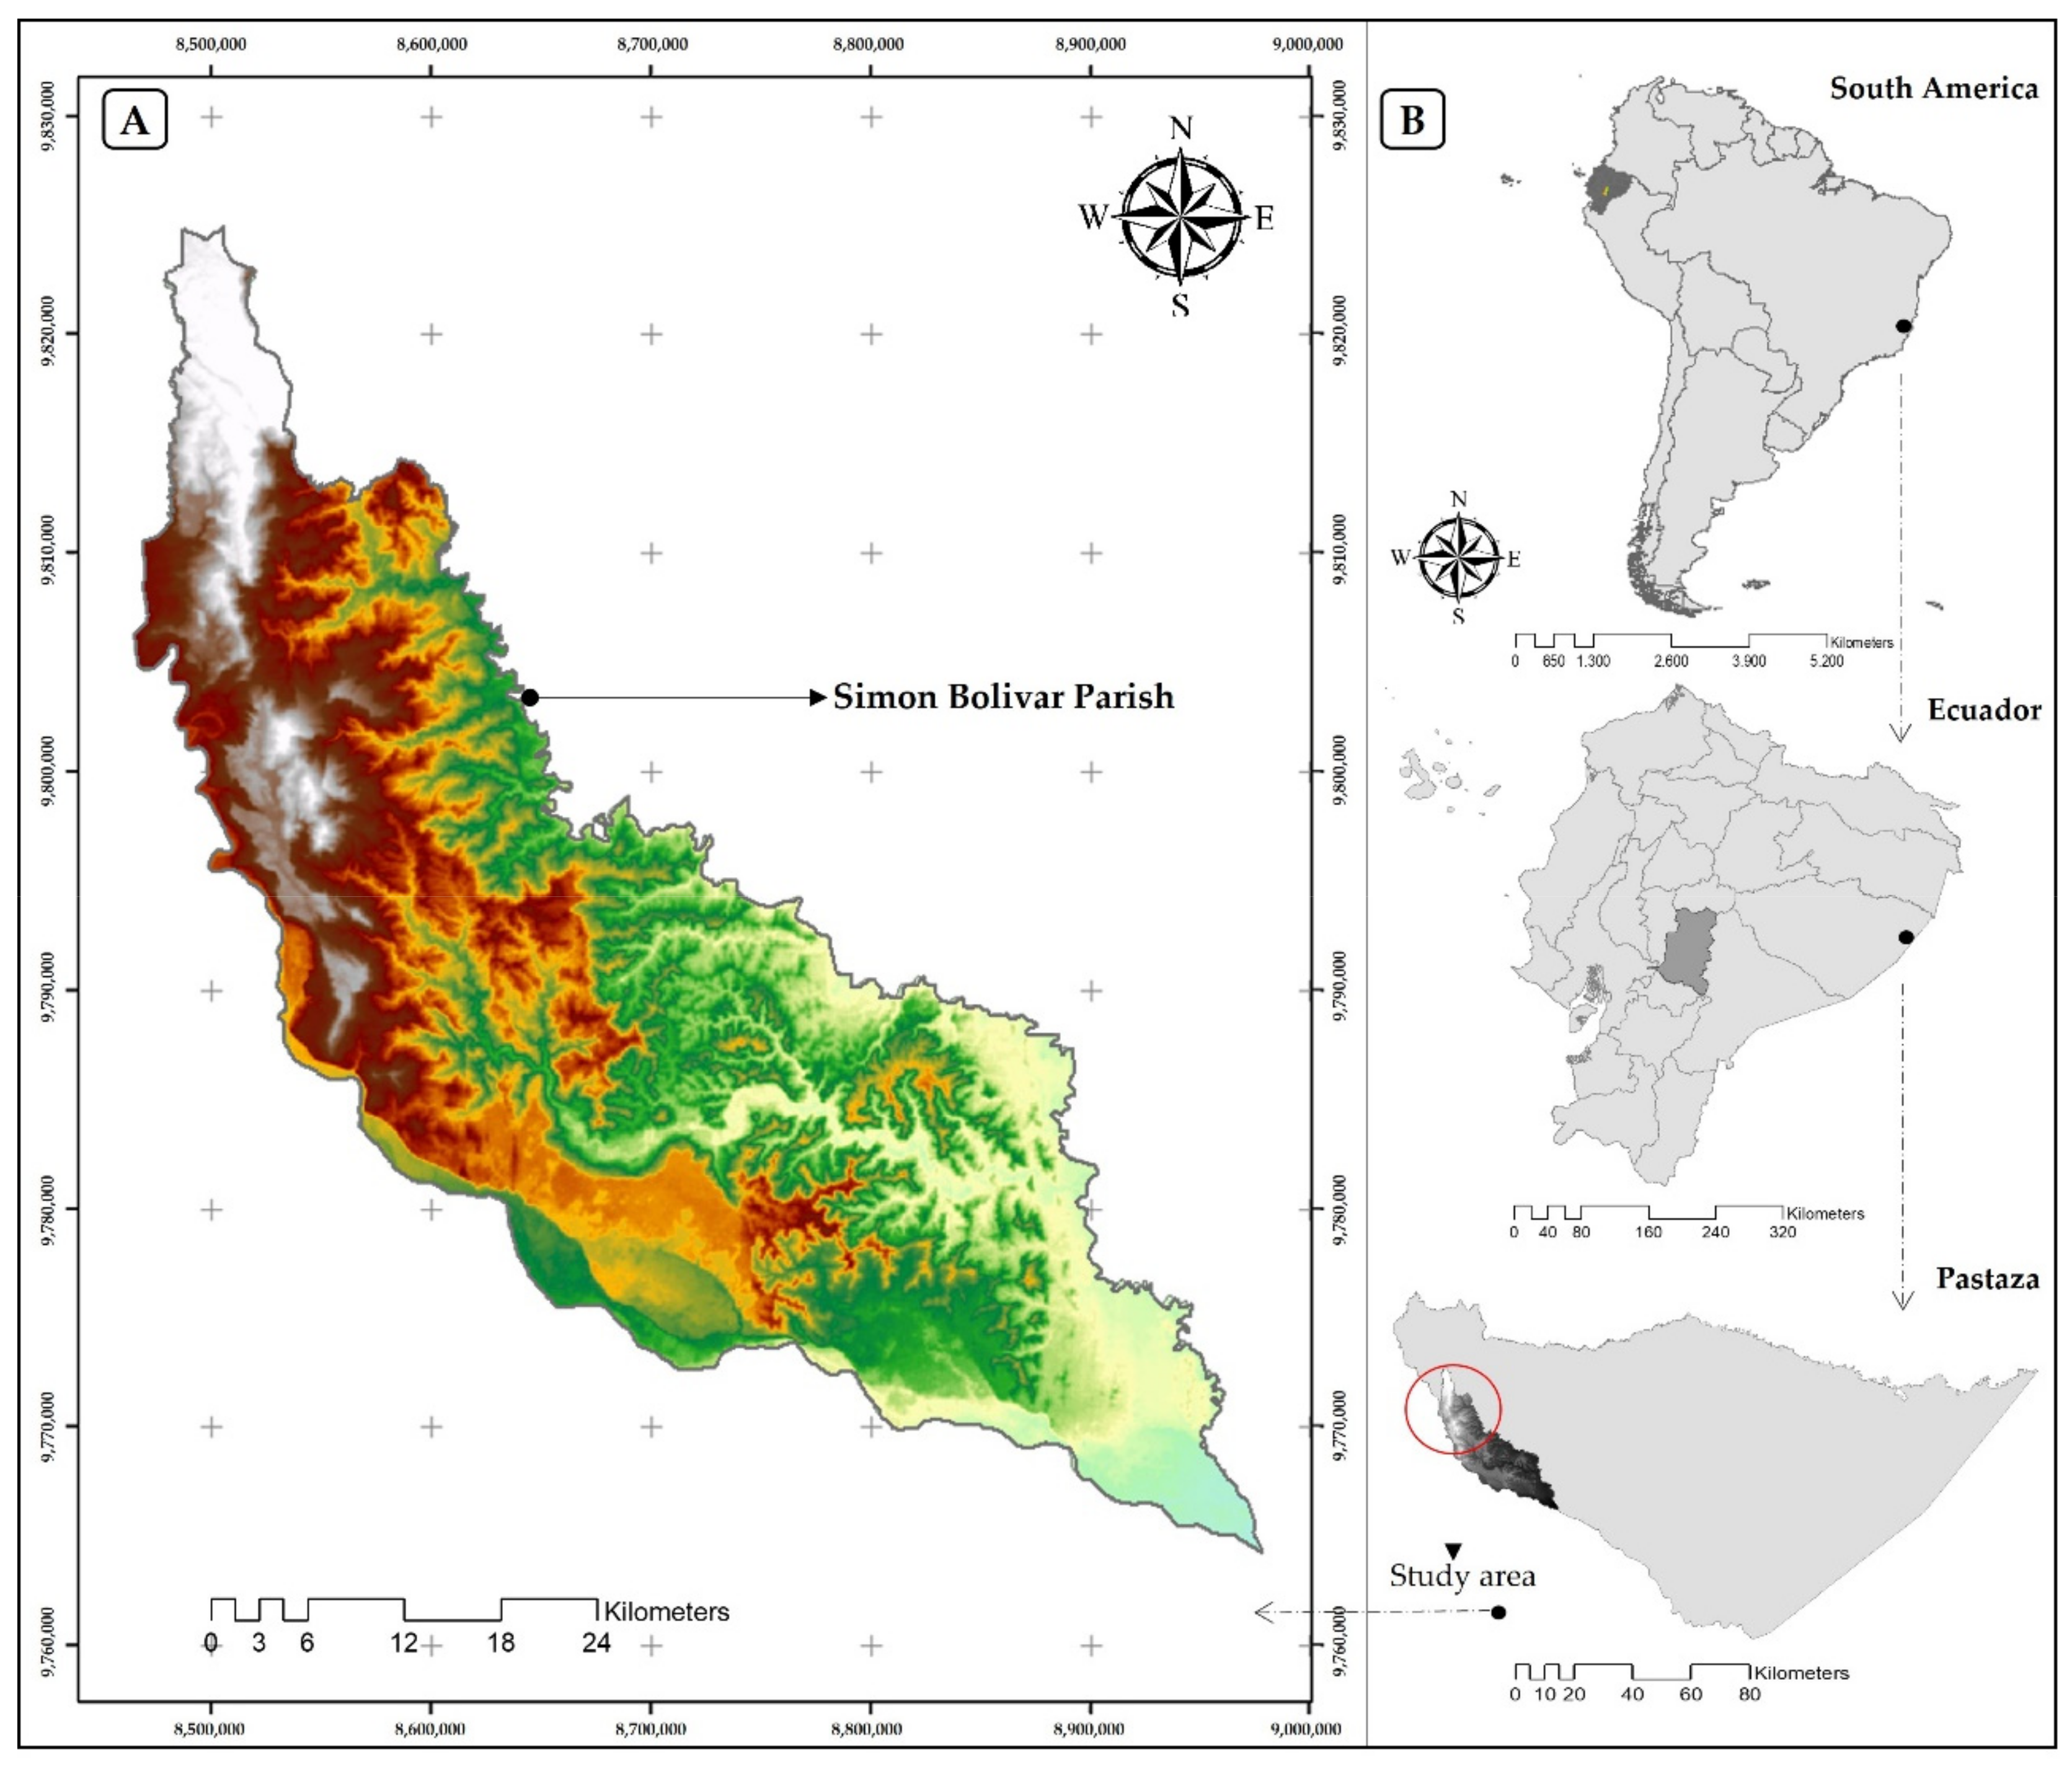
2.1. Study Location

Simón Bolívar Parish (SBP), which is located in the Pastaza Province of the Ecuadorian Amazon Region (Figure 1)—a place with a high biodiversity in the tropical forest—was chosen as the area of study. According to Gavilanes et al. [34], the province is quite abundant in species, as it hosts 540 plants species, of which 507 are native and 12 are included in the endemic group [34]. The choice of this area for study was based on a specific distribution, where the primary (natural, native) forest accounts for 84.31% of the total area of SBP [35], and which is representative for the rest of the rainforest area from Ecuador. The primary (natural) forest is commonly described as a place with a high species richness and without a significant presence of human activities [36]. In addition, the Amazon Region encompasses approximately 75% of the total forested area of Ecuador [37]. The main forest ecosystems in the study area are (1) evergreen forest of the Northern Oriental Mountain Range of the Andes (53.13%); (2) evergreen lowland forest of the “Tigre–Pastaza” Basin (28.56%); (3) floodplain forest of the alluvial plain of the rivers of Andean origin and of the Amazonian mountain ranges (15.72%); (4) floodplain forest with palms from the alluvial plain of the Amazon (0.57%), and (5) flooded forest of the alluvial plain of rivers of Amazonian origin (0.42%) [35].
Ecuador holds natural forests that cover 12,631,198 ha, and which are distributed across 65 locations [38]. The main types of land management systems of SBP are (1) primary (natural) forests, which correspond to rainforest with a coverage of 92,716.38 ha; (2) pasturelands, which include pastures and other systems that are used for cattle breeding (6,831.84 ha); (3) croplands (477.35 ha), as in the study area extensive agriculture is currently used to cultivate cassava, sugar cane, cocoa, and bananas; and (iv) secondary (managed) forest, which is represented by species such as bamboo and palms, with a coverage of 46.44 ha [39].
The majority of SBP’s population (67.41%) carries out economic activities related to agriculture, livestock farming, forestry, and fishing. Consequently, the future trend of increasing the categories of land management systems—such as crops, pastures, and inhabited areas—will be maintained at least proportional to the increase in the population and to the development of economic activities, which implies a reduction in the forested area. For instance, in Ecuador, the loss of vegetation cover is frequently associated with anthropogenic activity, population density, dependence on the quality of the land, accessibility, and the level of education [40]. Table 1 describes the main stakeholders in the area of study, their roles related to the land management systems, and their competencies to manage them. These stakeholders evaluated the natural resources of the study area with reference to their knowledge of the local environment, its benefits, and associated activities, as well as the land management systems of the territory.
According to the latest SBP population census, 78.08% of the population was identified in different indigenous ethnic groups, such as the Awa, Achuar, Cofan, Secoya, Shiwiar, Shuar, Waorani, Zapara, Andoa, Kichwa de la Sierra, and Manta. These ethnic groups have occupations mainly related to agriculture, livestock farming, forestry, and fishing [35]. The relationship between biodiversity and the these ethnic groups is based on the values provided by rainforests in biological, ethnobotanical, economic, and cultural terms [41].

2.2. Questionnaire Survey

The research was based on a questionnaire survey implemented through face-to-face interviews with randomly chosen representatives of SBP’s local population. The choice of face-to-face interviews was aimed at reducing the incorrect completion of the questionnaires. The original version of the questionnaire was developed by considering five main sections—namely, the (1) sociodemographic features; (2) local context related to the level of importance of rainforests and water resources; (3) socioeconomic component; (4) environmental and cultural components, which included the visual rating of the main land management system types; and (5) willingness to pay for conservation and other attributes. The data on sociodemographic features and visual ratings were used as a baseline for this study. The preliminary version of the questionnaire was tested and refined by the personnel from “Escuela Superior Politecnica de Chimborazo” before being used in the data collection. To estimate the sample size, a probabilistic formula was used at a confidence level of 95%, using as input the population of SBP (8348 inhabitants according to the management plan [35]), which resulted in 368 questionnaires to be implemented. However, a total of 451 questionnaire-based interviews were applied in the field, in order to provide a sufficient pool of respondents, assuming that in some of them the data would be incomplete. The field phase of the study was implemented with the support of 30 researchers who were trained in advance and had an academic background in environmental engineering. The respondents were selected so as to be people over the age of 18 years or the heads of their families.
For the visual perception section, 12 pictures were randomly selected from a larger picture pool and shown to the respondents in order to evaluate how much they liked each of them, using a Likert scale from 1 to 5, where 1 stood for “not at all” and 5 for “very much”. The pictures emulated three types of perspective (landscape view, close view, and inside view), and they were shown in three groups and ordered sequentially according to the main land management systems and economic activities of the population described in the management plan [35]: (1) primary (natural) or unmanaged forest, (2) secondary or managed forest, (3) pasturelands, and (4) croplands. Table A1 depicts and describes the pictures shown to the respondents in more detail. The data used in this study were part of a larger study dealing with both subjective and objective views of the inhabitants with regard to the evaluated landscapes [42].

2.3. Data Processing and Statistical Analysis

The data collected via pen-and-paper questionnaires were transferred into a database developed in Microsoft Excel® in the form of binary codes, in order to indicate the presence or absence of given sociodemographic attributes and the ratings given by the respondents. Then, the data were checked for consistency so as to identify the data coming from those questionnaires that were completely filled in. Incomplete data were removed, and only the data from 376 valid questionnaires were retained for further processing, representing ca. 83.4% of the initial sample (451 questionnaires implemented in the field). These data were recoded and reorganized based on sociodemographic features and ratings given at the picture level.
Sociodemographic characteristics were analyzed by the means of absolute and relative frequency of data—a step which was implemented for each sociodemographic feature. For gender, civil status, and age, the number of attributes was kept the same as in the case of those included in the original questionnaire. However, due to a low frequency of responses to some of the attributes, the data on ethnicity and monthly income were reorganized; in addition, for the sake of simplicity, the data on education were reorganized so as to reflect only the main categories, irrespective of the completion of a given education level—a procedure that was also applied to the data on occupation, with the aim being to reflect only the main categories.
Ratings of the respondents were analyzed by the use of relative frequency of responses given on the Likert scale (1 to 5), at two levels of aggregation: The first level was that of the entire respondent cohort, for which the perceptions of the land management systems were characterized by the relative frequencies of ratings from 1 to 5 computed for the 12 pictures shown to the respondents. The second level of aggregation was that characterizing the reorganized attributes of sociodemographic data; as such, relative frequencies of each response given on the Likert scale were computed for the gender (i.e., female vs. male respondents), civil status, age, education level, ethnicity, monthly income, and occupation attributes. For both levels of data aggregation, the results were prepared in the form of radar plots.
Inherently, the used data were available in a multidimensional form. To be able to check the data association and similarity with regard to the instances (pictures) and the ratings (1 to 5), a dimensionality reduction procedure was required. Given the type of the data (categorical), a correspondence analysis was carried out based on a contingency table (5 × 12), which was developed to contain the frequency of ratings (1 to 5) as rows (5 rows) and the picture numbers (P1 to P12) as columns (12 columns). The workflow was implemented in R Studio, based on the tutorial available at [43], with the aims of (1) checking whether there were dependencies between the rows and columns (based on the χ2 statistic), (2) choosing the number of dimensions to characterize the data in a lower dimensional space (based on the inertia and explained variance), (3) characterizing the contribution of row and column data to the developed dimensional solution, and (4) characterizing the data association via symmetrical and asymmetrical biplots.
To answer to the question of whether the respondents’ ratings in terms of visual perception would shape individual and cohesive groups of land use management, irrespective of the pictures’ scale of view, a hierarchical cluster analysis was implemented by the use of Orange Visual Programming software [44]. For this purpose, the Excel database was fed into a workflow that aimed at computing a distance matrix, a distance map, and a cluster solution, all of which were based on the ratings given by the respondents. Among the parameters used to reach a clustering solution were Spearman’s dissimilarity index, which was used as a distance metric, and the complete-linkage algorithm for hierarchical clustering. The choice of Spearman’s dissimilarity metric was based on its ability to work with categorical, ranked data, as it represents the square of Euclidian distance applied to given rank vectors. This metric outputs the linear correlation between the rank values remapped as distances in an interval from 0 to 1, where 0 means that there is a perfect match between two given features, while 1 means that the features are dissimilar. The use of the complete-linkage algorithm was chosen as an intermediary solution, mainly to avoid the chaining effect specific to the single-linkage algorithm. The final cluster solution was chosen based on the data grouping so as to reflect the main land use types; to do so, several clustering distances were tested, and the solutions outputted by them were visually evaluated.

3. Results

3.1. Sociodemographic Characteristics

The main statistics of the sample’s sociodemographic characteristics are given in Table 2. The share of female (ca. 49%) and male (ca. 51%) respondents was balanced in the sample under study.
More than half of the respondents (ca. 55%) declared to be engaged in some sort of relationship, and most of them (ca. 68%) were aged less than 40 years. Dominant in the sample were those having completed or still studying at the high school level (47%), as well as those belonging to the Metis ethnic group (ca. 75%).
The monthly income was consistent with the wealth of Ecuador [45], and most of the respondents declared that they had a monthly income of less than USD 394. The majority (ca. 86%) of the questioned people had some sort of occupation, such as being employed (ca. 61%) or house care (ca. 25%). According to the statistics available in June 2021, poverty at the national level stood at 32.2%, and extreme poverty at 14.7% of the population, taking into account that a person is considered poor if they have a per capita family income of less than USD 84.71 per month, and extremely poor for an income less than USD 47.74 per month [45]. In addition, according to the National Institute of Statistics and Censuses, the characteristics of employment in the rural sector are described in the following groups: formal sector (21.2%), informal sector (71.6%), domestic employment (1.1%), and not classified by sector (6.1%) [46]. Accordingly, the national data were consistent with the information obtained from the study area, which was representative in terms of sociodemographic statistics.

3.2. Aggregated Frequencies of Ratings

Figure 2 shows the relative frequency of ratings aggregated at the picture level for the sample of respondents under study. For interpretation, in the following section, some of the results are discussed as positive (ratings of 4 and 5), neutral (rating of 3), and negative (ratings of 1 and 2) ratings.
Picture 1, depicting a natural forest landscape, was rated by more than 70% of the respondents as being liked, by ca. 16% as being neutral, and by close to 14% as not being liked. Picture 1 received the most ratings of 5 (ca. 48%), being followed in this regard by Picture 3 (ca. 38%), Picture 8 (ca. 37%), Picture 12 (ca. 36%), and Picture 2 (ca. 36%). At the opposite end of the spectrum, pictures depicting managed forests (P4–P6) received the least positive ratings (by 33, 35, and 34% of the respondents, respectively), and neutral responses dominated the responses with regard to this type of land use management system.
Among the set of pictures describing the continuum in the land use management system, only Pictures 1 to 3 (native forests), 7 and 8 (croplands), and 11 and 12 (pasturelands) were rated positively by more than 50% of the respondents. In the case of pictures depicting native forests, these positive ratings were given by ca. 69–70% of the respondents, while in the case of pictures 7 and 8, depicting croplands, the positive ratings were given by 53 and 63% of the respondents, respectively. Last, but not least, in the case of pictures 11 and 12, positive ratings were given by 50 and 58% of the respondents, respectively.
A rating pattern similar to that shown in Figure 2 was preserved in the case of data that were aggregated at the gender level (Figure A1 in Appendix A), with the difference being that female respondents rated Picture 8 (cropland) better, while male respondents rated the pictures depicting natural forests better. In relation to ethnic groups, the data shown in Figure A2 indicate that Metis and indigenous groups had similar evaluation patterns, with Pictures 1 and 3 (natural forest) being the best rated, while Caucasians gave the highest ratings for Picture 8 (croplands). The ratings associated with marital status are shown in Figure A3, showing that Picture 1 was the best evaluated; however, the group of widowers mostly preferred Picture 8 (croplands) and Picture 12 (pasturelands). Figure A4 shows the results in relation to age category. Those aged less than 30, as well as those aged 41–50 years, gave better ratings to Pictures 1–3 (natural forest) and Picture 8 (croplands). In addition to these ratings, the group of 31–40-year-old respondents positively rated Pictures 11 and 12 (pasturelands). Finally, for the group of those over 60 years old, the best evaluated landscapes were croplands (Picture 8) and pasturelands (Picture 12). Figure A5 shows a relationship between the ratings and education level. The ratings of the primary forest (Pictures 1–3) were correlated with the educational level, being higher as the respondents declared a higher educational level. Figure A6 shows the ratings given by different groups in relation to their occupation. Employees gave the best ratings to Picture 1, while those from the house care group gave the best ratings to the natural forests (Pictures 1–3), croplands (Picture 8), and pasturelands (P12). On the other hand, students highly rated the natural forests (Pictures 1–3) and croplands (Picture 7). Ratings of the groups by monthly income are shown in Figure A7, indicating a trend of highly rating the native forests (Pictures 1–3), with the exception of those with a salary less than USD 394, who also positively rated the agricultural activities (Picture 8).

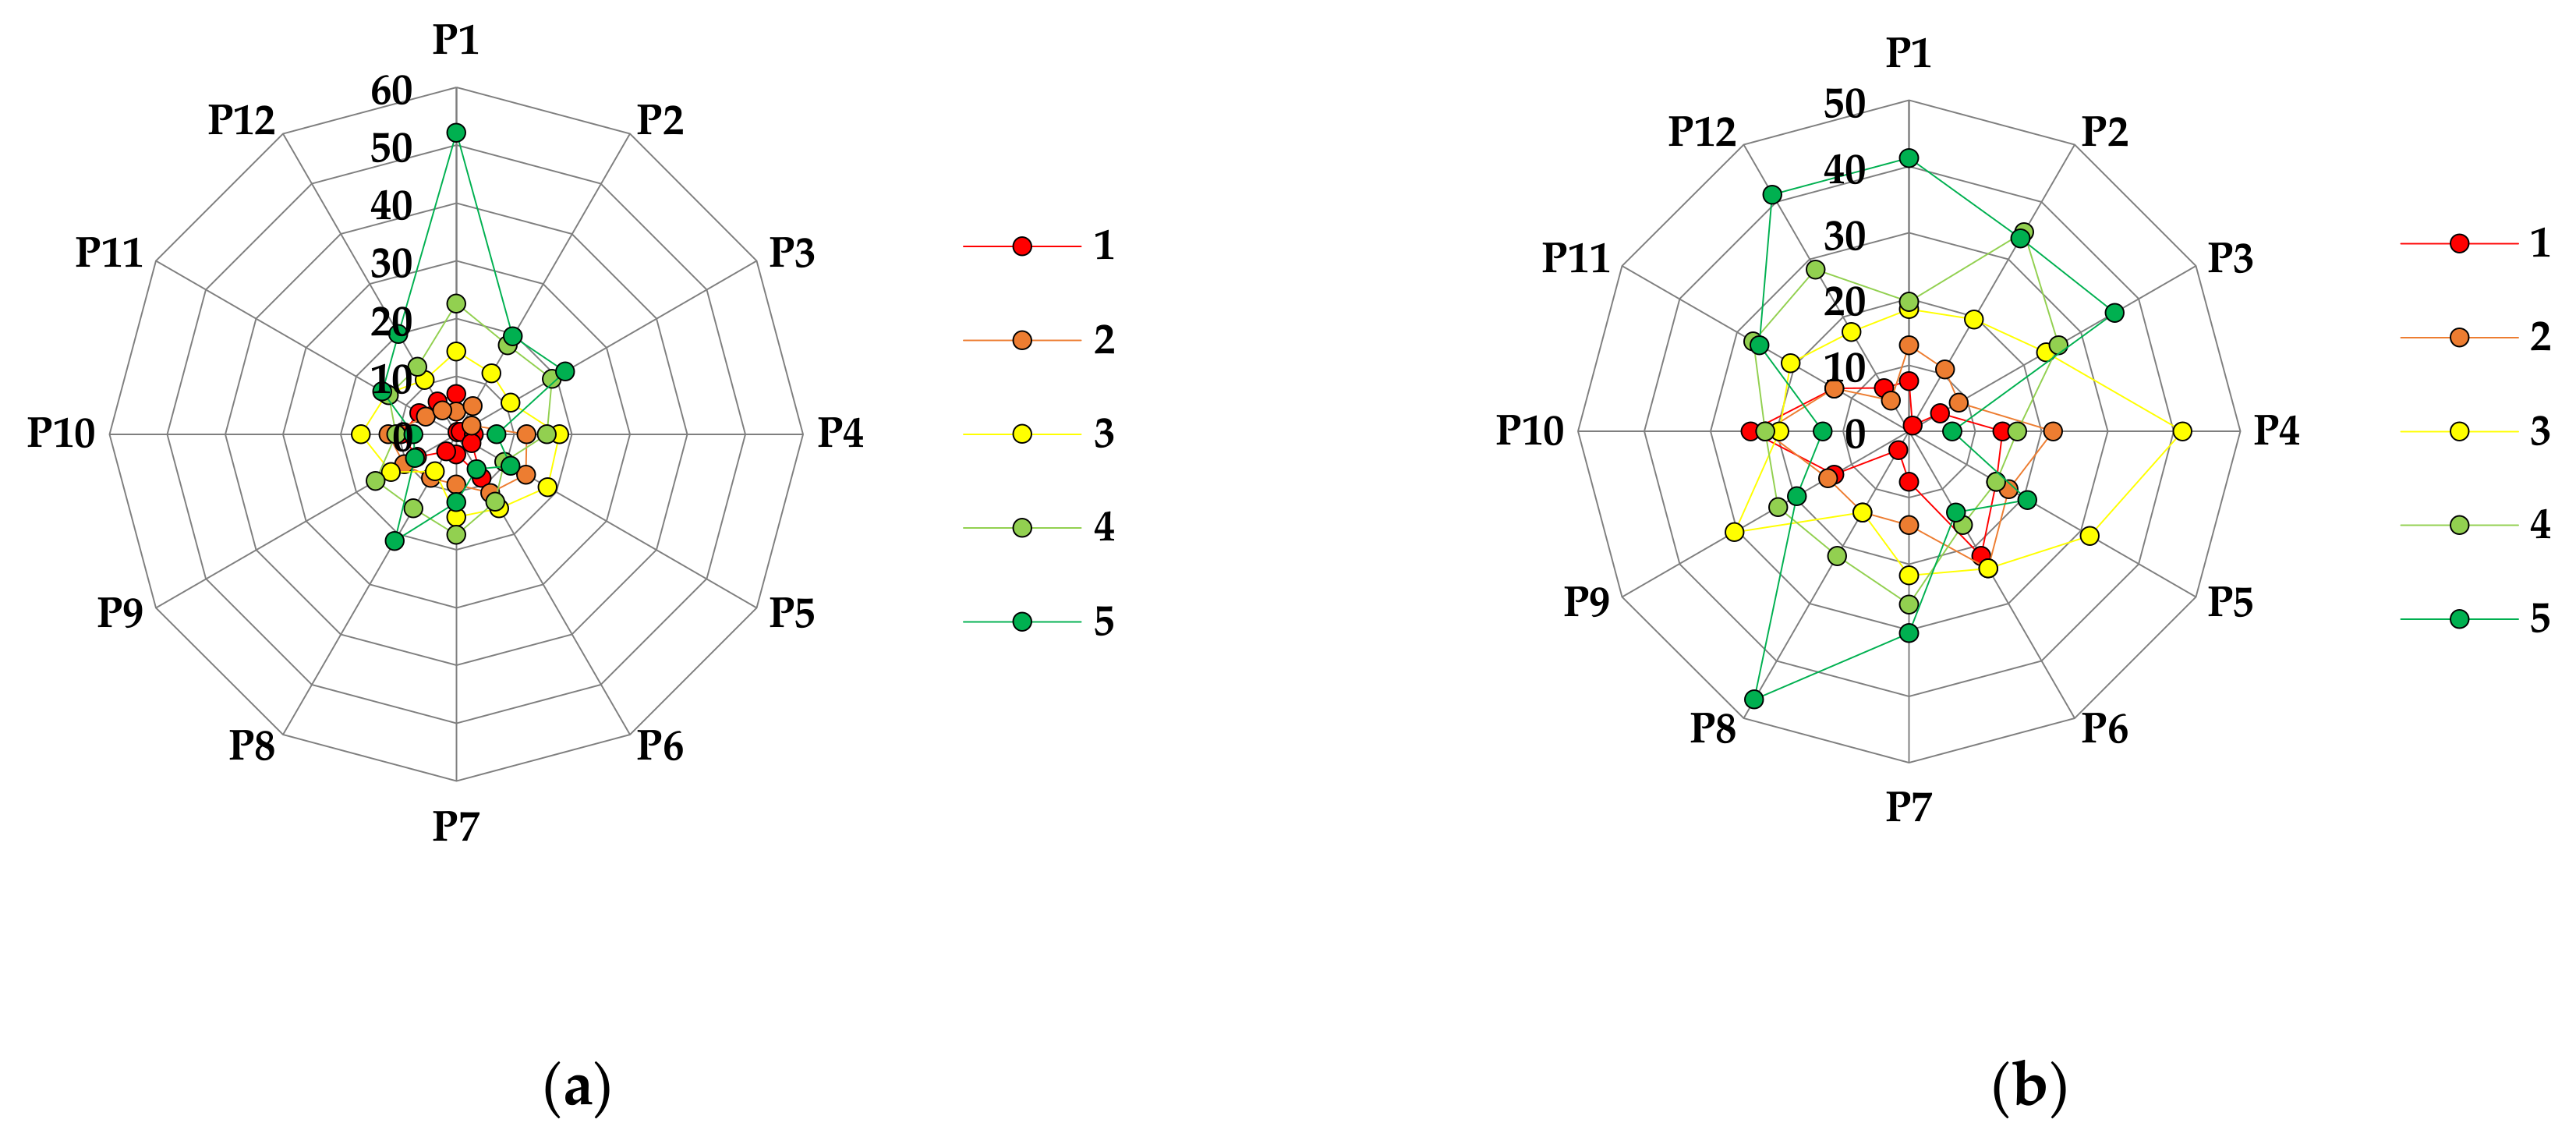
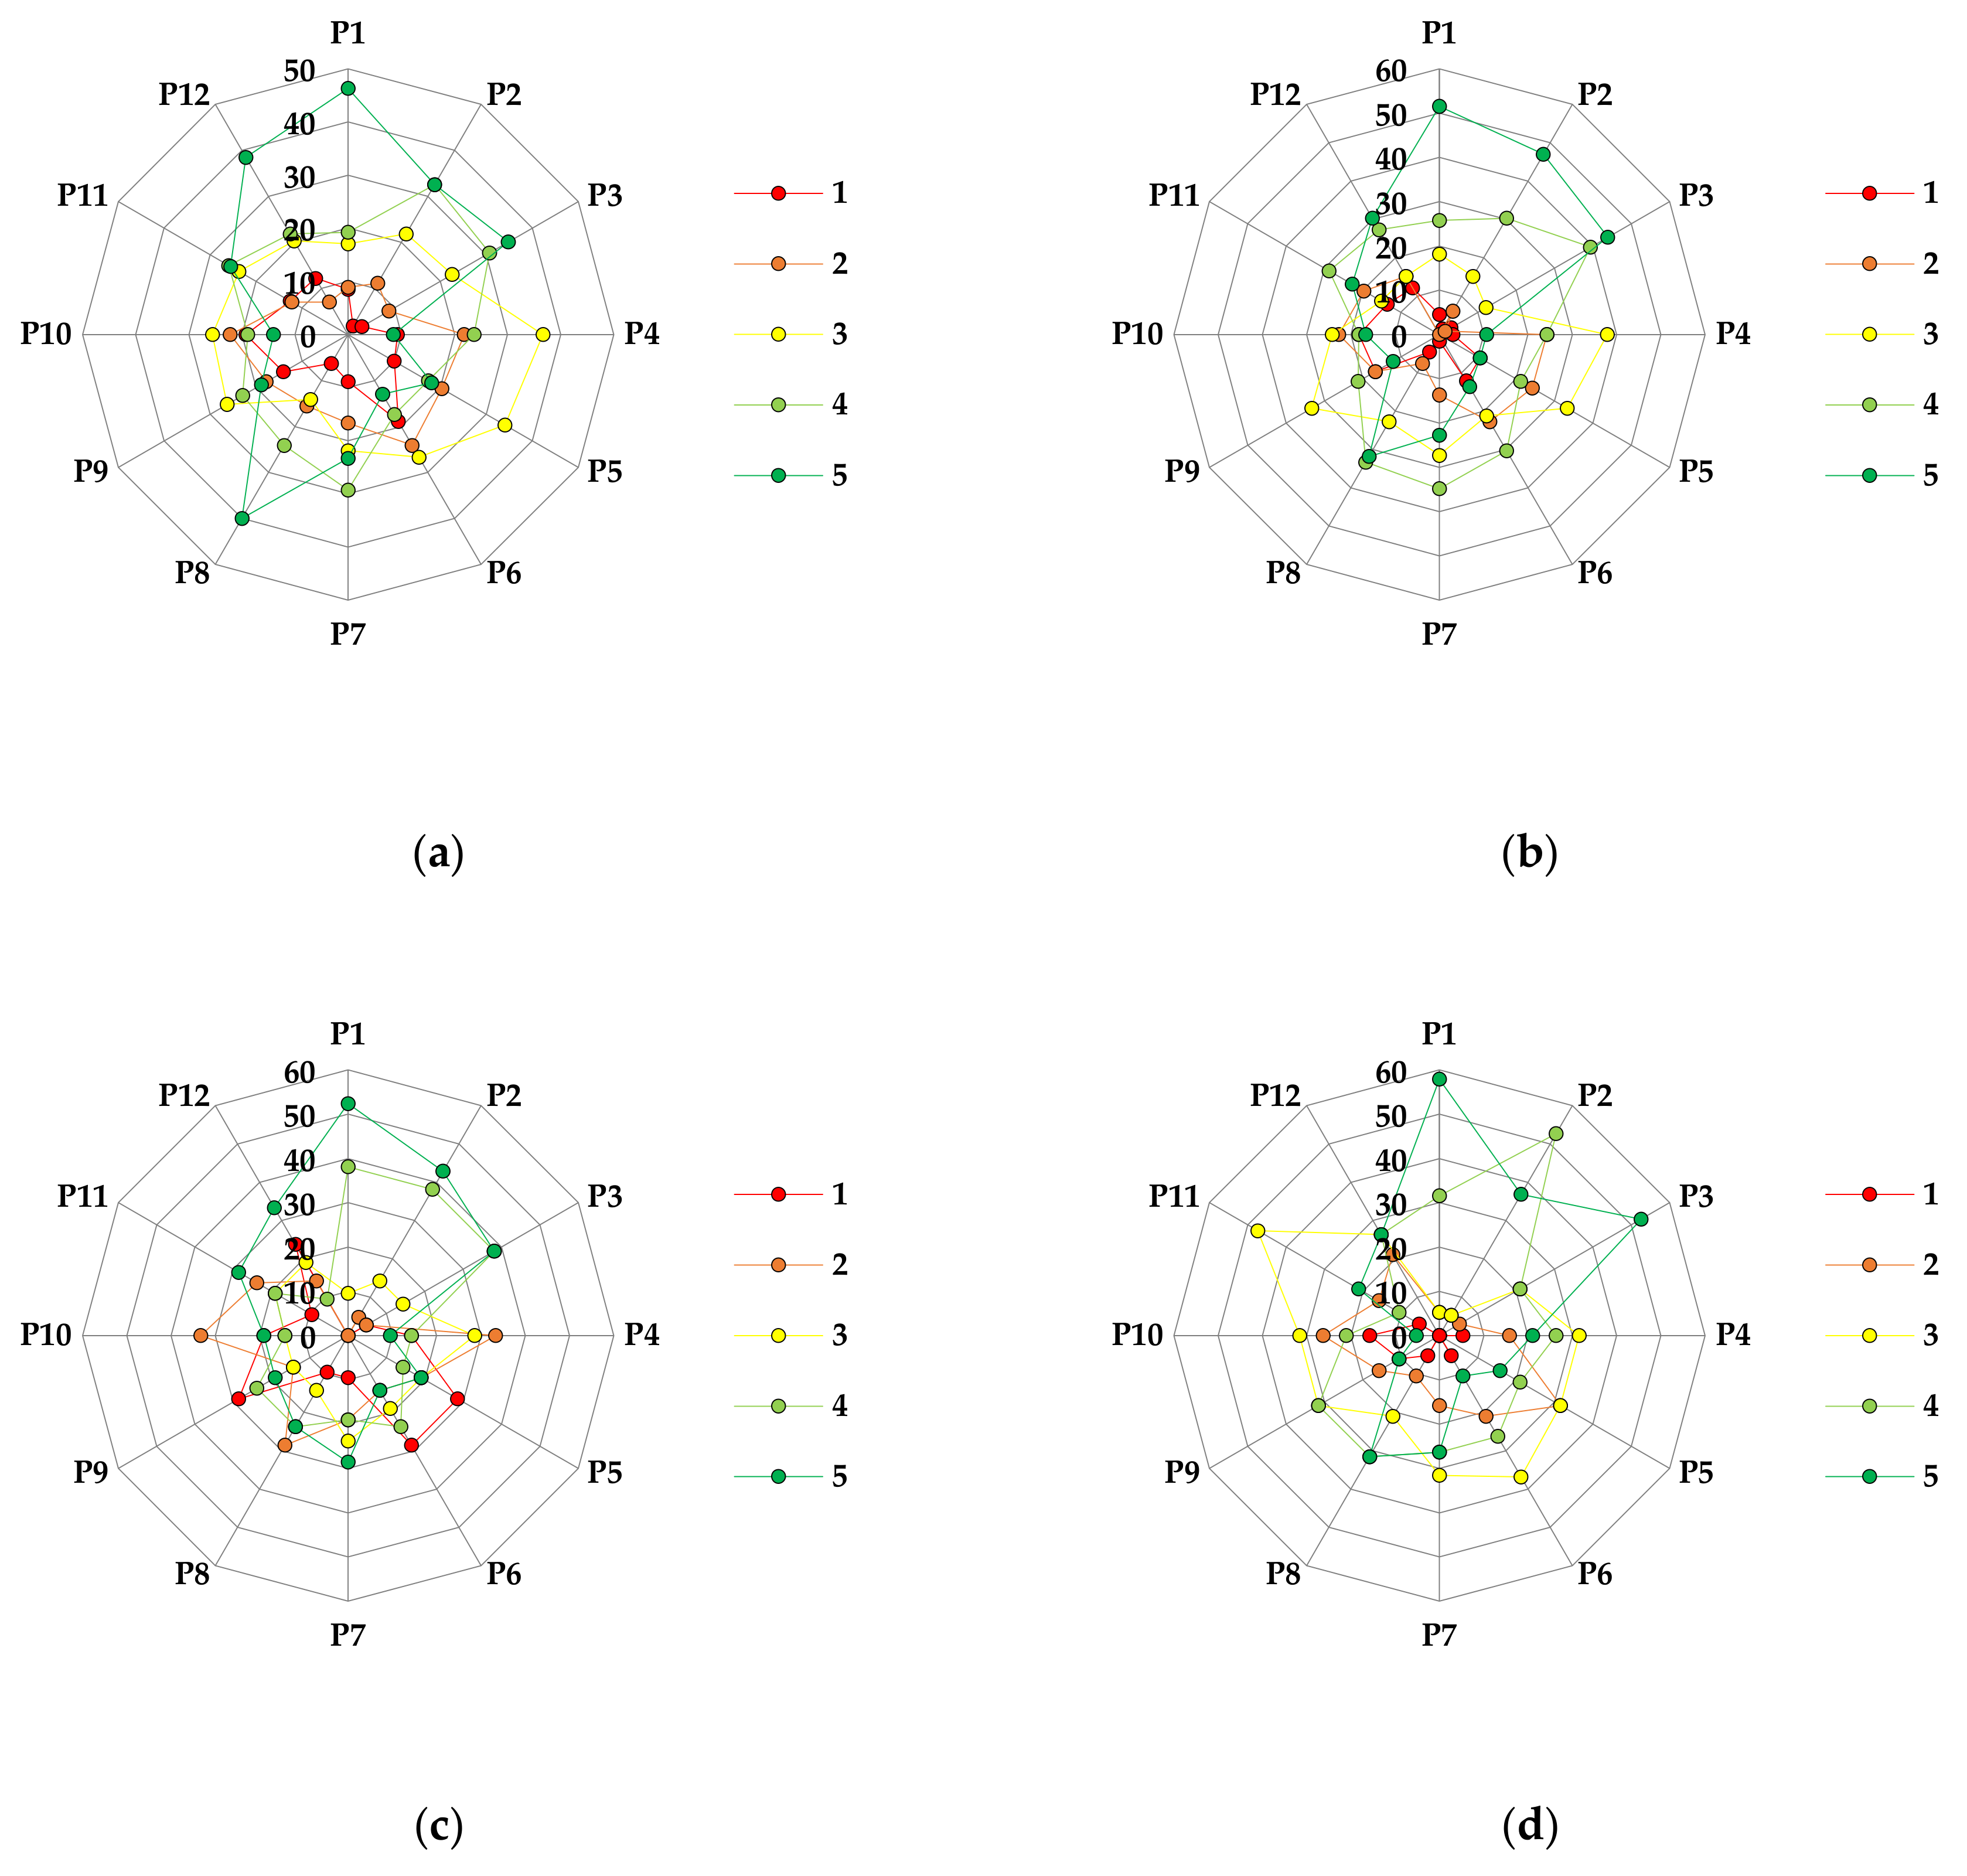
3.3. Association between Land Use Management Systems and Ratings

The main results of the correspondence analysis are shown in Figure 3 and Figure 4, in the form of symmetrical and asymmetrical biplots complemented with the proportion of explained variance and with the contributions of the row and column data to the dimensions. Finally, a solution with two dimensions was kept, explaining more than 94% of the data variability. Some interesting findings can be seen from a closer look at Figure 3 and Figure 4. Informatively, P1 was the most associated with the rating of 5 (Figure 3a), and it was represented at a considerable distance from its counterparts in the native forest category. P11 was the closest to the average profile of responses and, in general, the grouping of the data on the four types of land management systems was not cohesive.
Figure 4a shows the asymmetrical biplot of the data, by plotting the row (ratings) profiles in the column space (pictures). Interpretation of data on an asymmetrical plot may be done based on the angles made by the arrows and the projection of the data characterizing a given row on the arrows depicting the column profiles [43]. For instance, if the angle between two given arrows is more acute, the association between them is stronger. As such, P1 was more associated with ratings of 5, while at the opposite end was the association between P10 and ratings of 1. Ratings of 1 and 5, and data characterizing P1, P4, P10, P3, P6, and P2, contributed the most to the first two dimensions generated by the correspondence analysis.
In terms of profiles set by the ratings, P1 stood apart from P2 and P3, which were more similar. P9 and P10 seemed to be more similar to P6, although these pictures represented three different land management systems—namely, croplands, pasturelands, and managed forest.

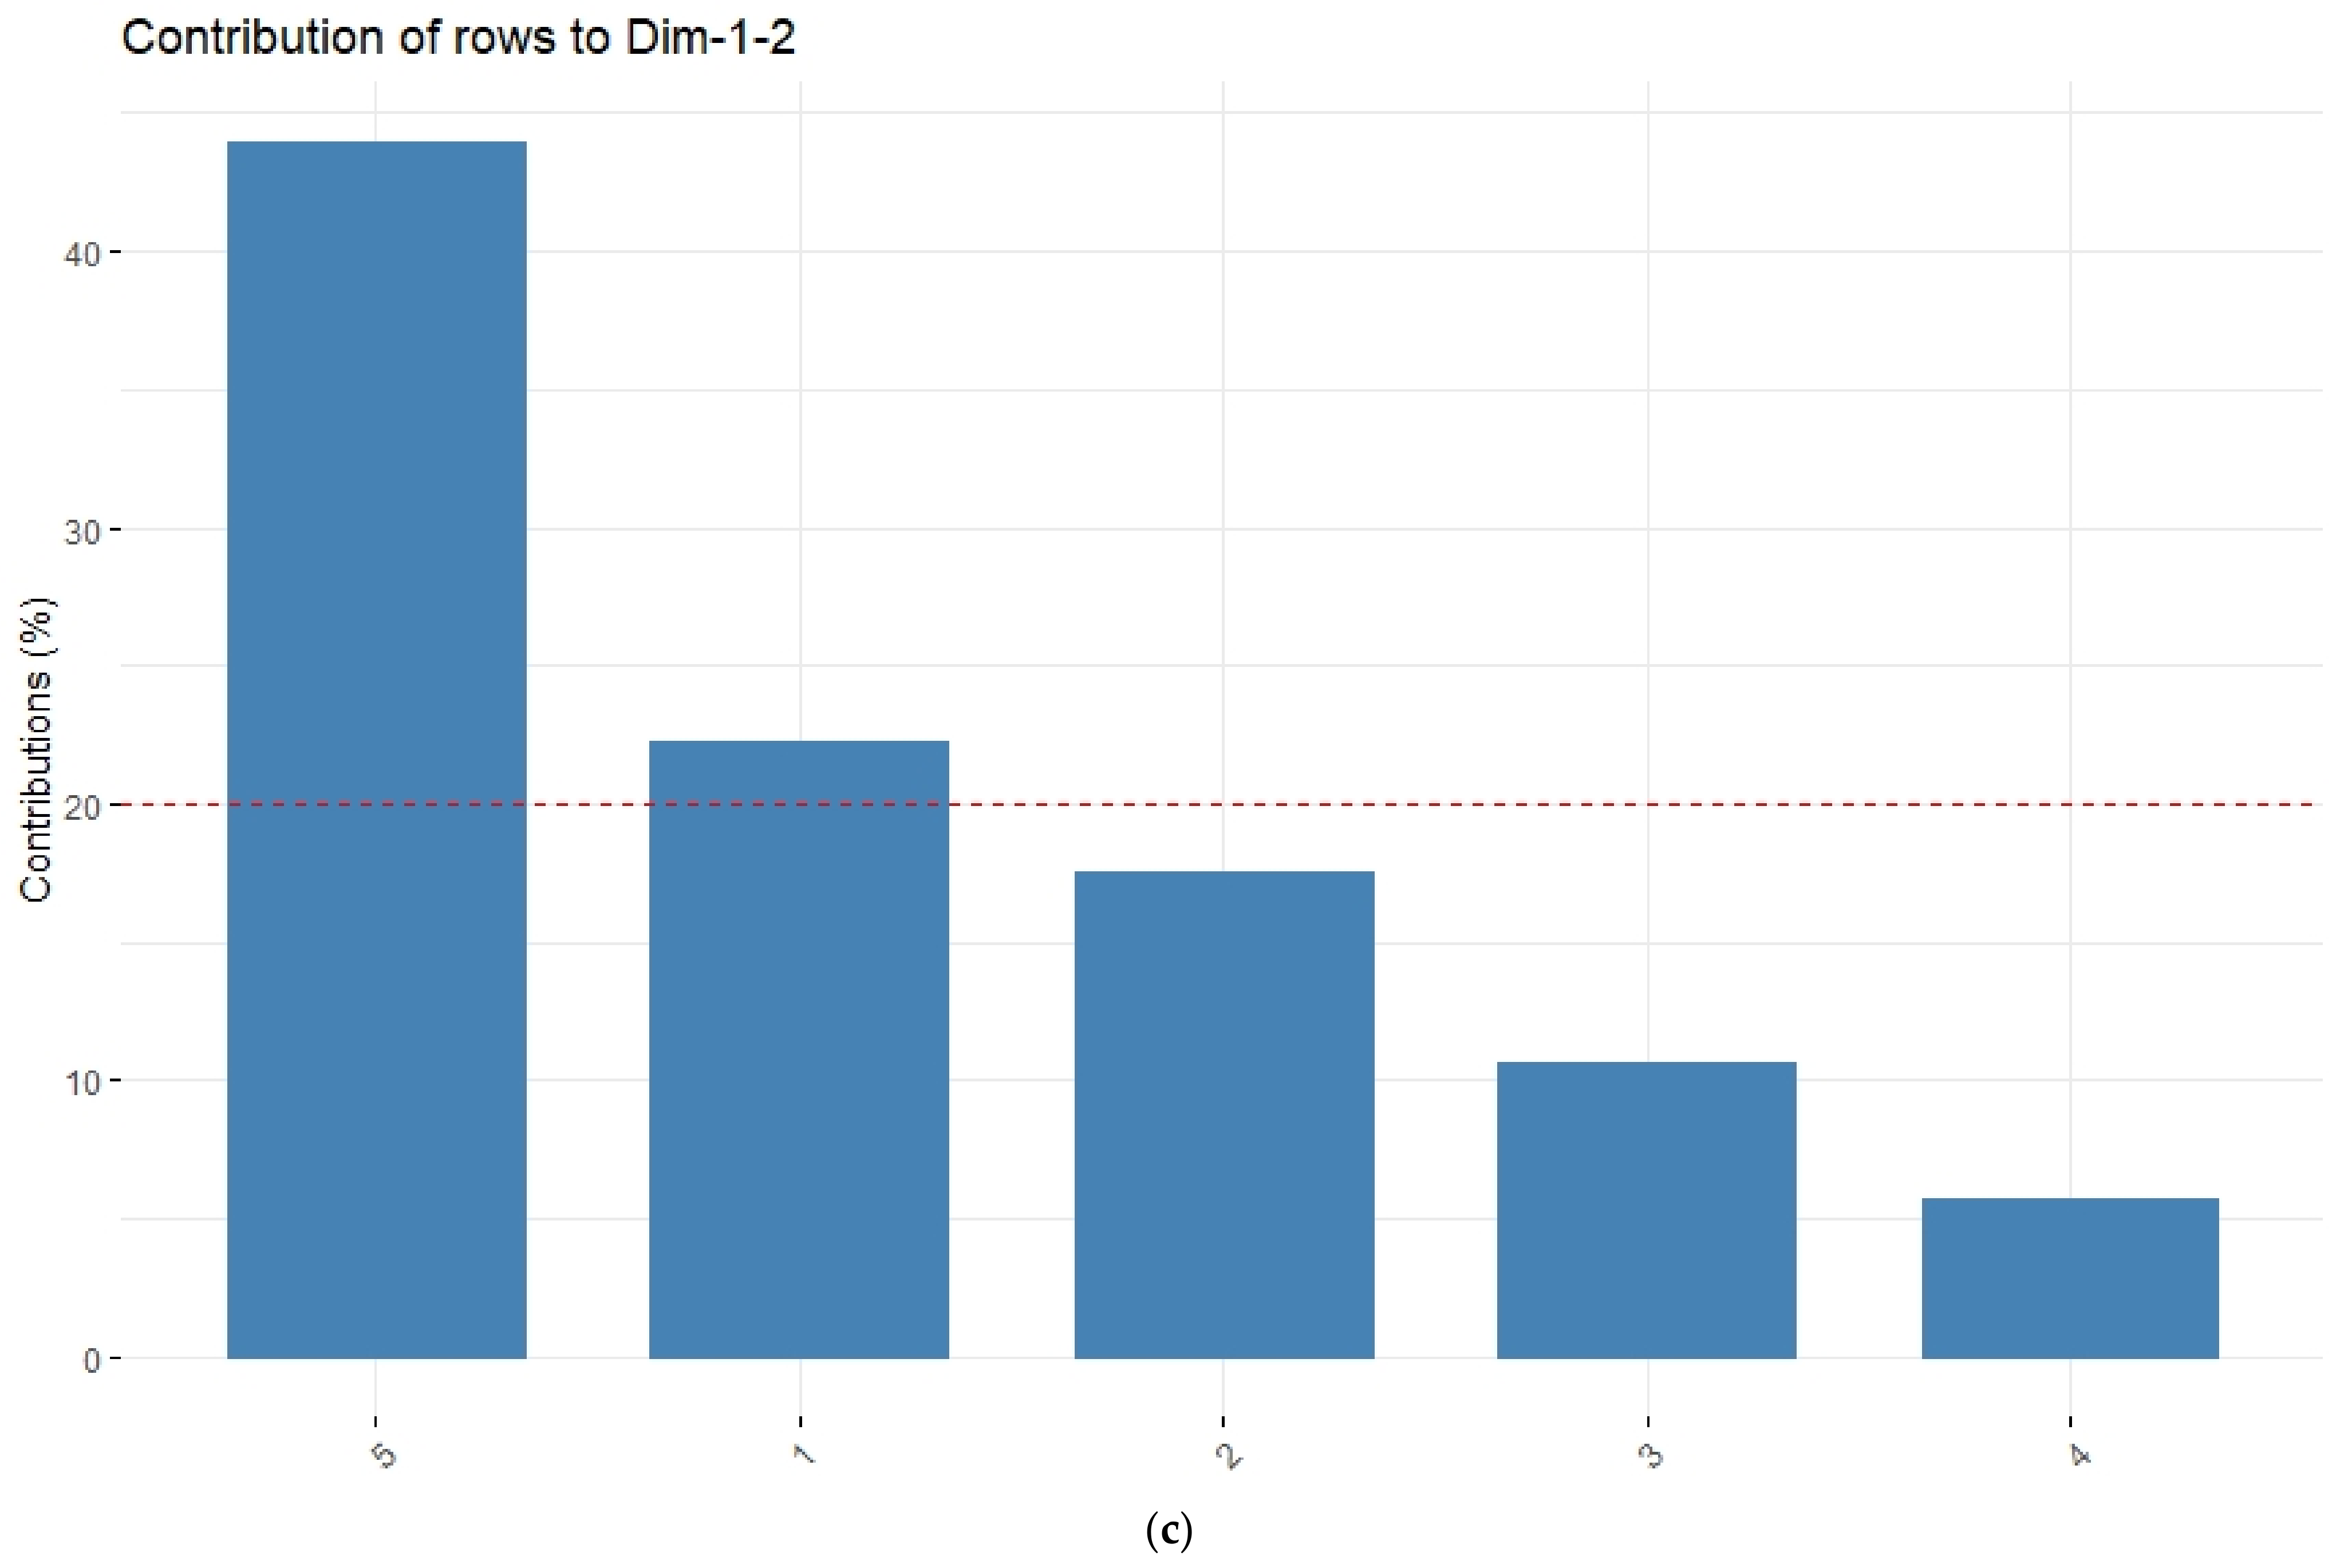
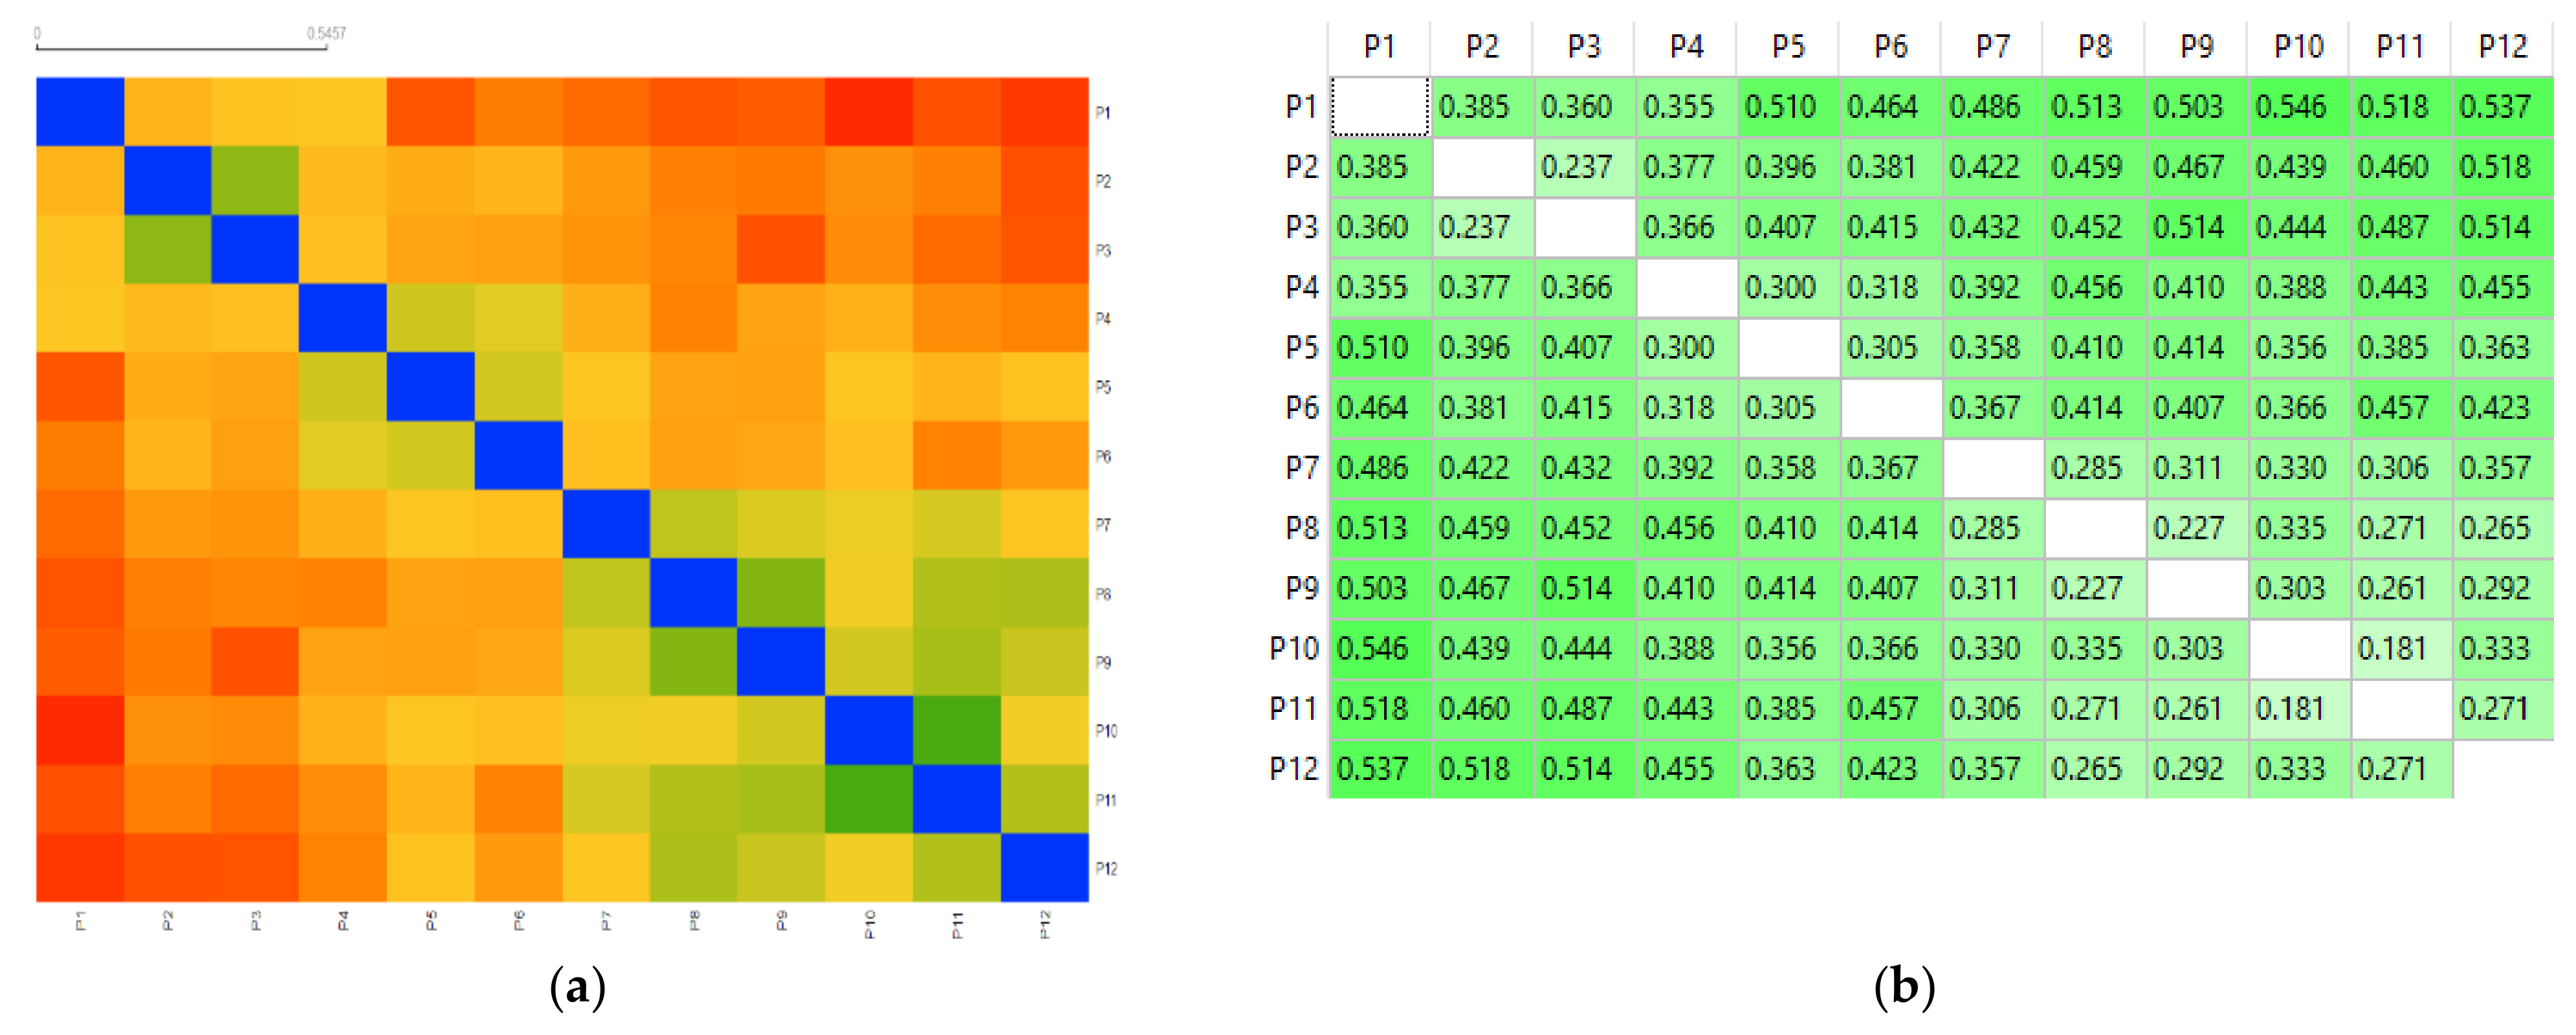
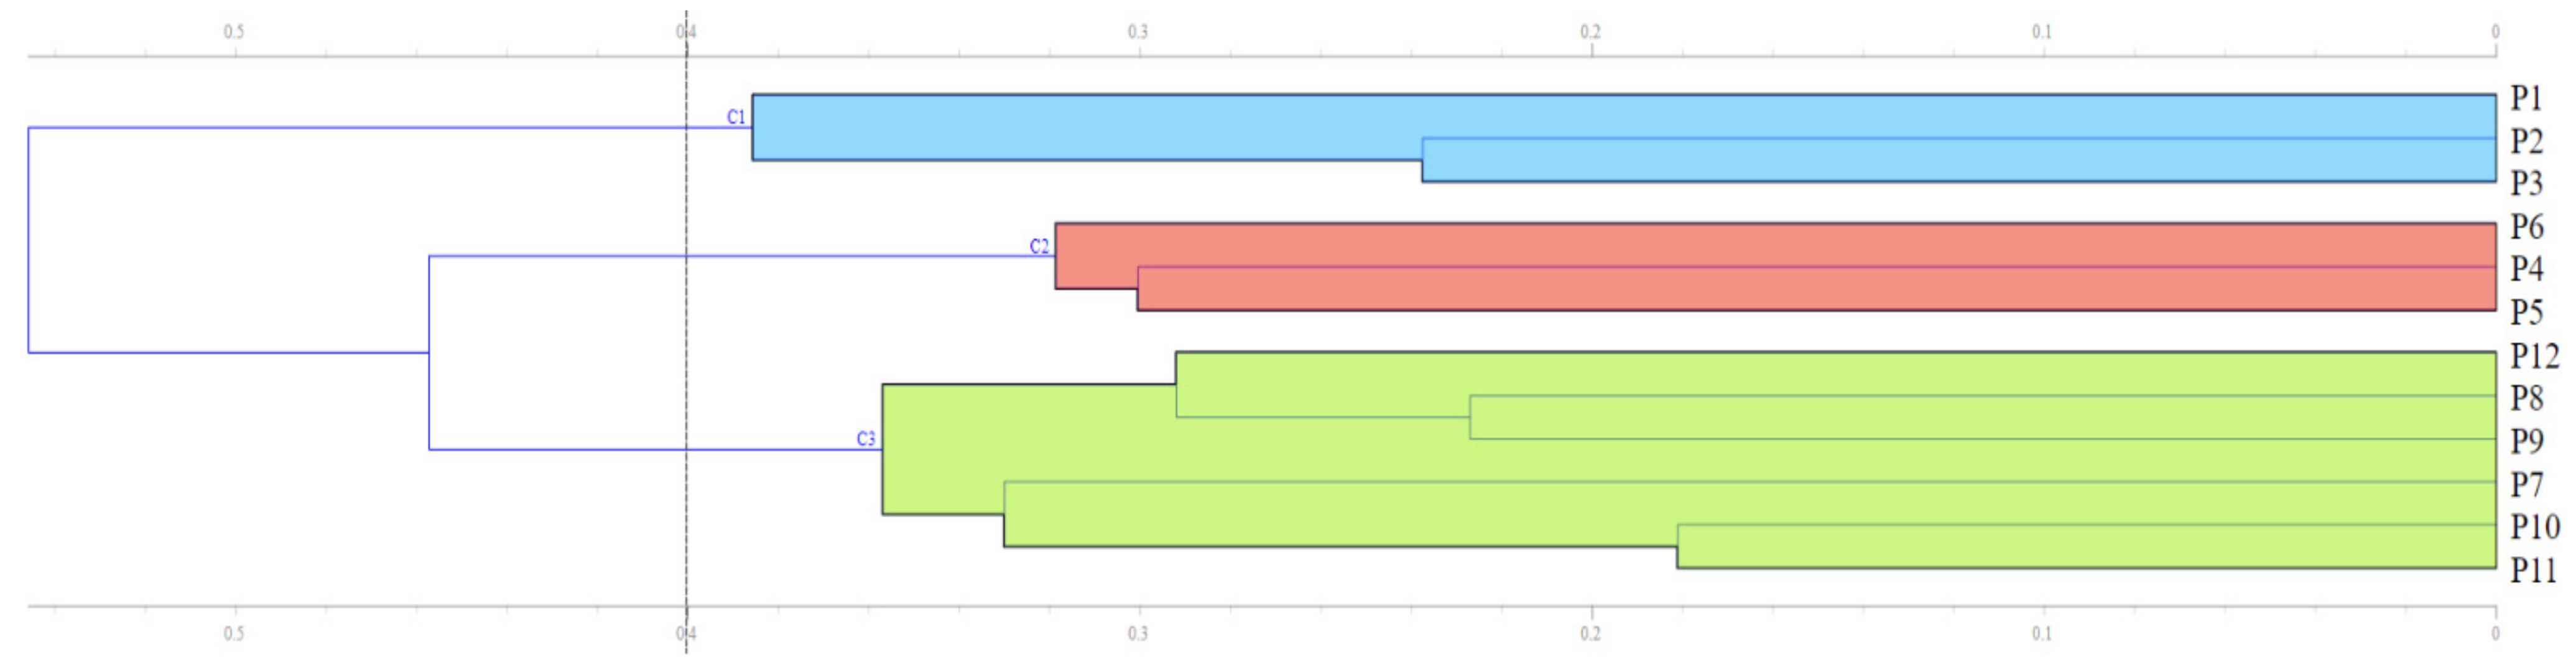
3.4. Grouping of Land Management Systems Based on Collective Visual Ratings

The results of the workflow implemented for the hierarchical cluster analysis are shown in Figure 5 and Figure 6. Figure 5a shows the distance map based on Spearman’s dissimilarity metric, while Figure 5b gives the actual distances computed in the range of 0 to 1. Finally, Figure 6 shows the dendrogram built via cluster analysis, in which three clusters were kept in the final solution.
The distance set at 0.4 was arbitrarily chosen based on several iterations aiming to make sense of the final data clustering. For instance, P10 and P11 (pasturelands) merged in a cluster at a distance of 0.181, and then they joined a new cluster that included P7 (cropland) at the distance of 0.330 (Figure 5 and Figure 6). The same was found for P8 and P9 (croplands), which merged in a cluster at a distance of 0.227, and then were clustered together with P12 (pasturelands) at a distance of 0.292 (Figure 5 and Figure 6). By moving the distance threshold at which this solution was found (0.4) to 0.335, the data from the cluster of pictures depicting the croplands and pasturelands were split into two new clusters—namely, P7, P10, and P11, and P8, P9, and P1, respectively—which were heterogeneous in terms of land use type (Figure 6). The same solution (distance set at 0.335) has split the first cluster (natural forest) in two new clusters. The data shown in Figure 5 may be used to evaluate the distance at which each two pictures in a given pair are located.

4. Discussion

The fact that people build high consensus in the evaluation of positively perceived land management systems provides a valid argument for the management of valuable landscape scenes in terms of sustainability [33]. This study evaluated the perceptions of the local inhabitants towards the land management systems in the rainforest area of Ecuador, based on 12 pictures depicting the main land management systems in the area—namely, unmanaged (natural) forest, managed forest, croplands, and pasturelands—at three levels of landscape view: far, medium, and inside. A study carried out in Tanzania described the importance of the opinion of the population located near a forest, due to the fact that people carry out economic activities and have an environmental knowledge of the area [47]. In addition, the incidence of the population allows the management of activities that affect the environment and the biophysical aspects of the forest [48]. The importance of accounting for the preferences of local inhabitants with regard to the land management systems was also described by a case study from Botswana where, based on such information, forest management regimes were developed to protect and conserve rainforests via an inclusive, participatory approach [49]. Similar studies have evaluated the importance of forest ecosystems by considering variables such as the ecosystem services, forest area, levels of human intervention, sociodemographic variables [50], ecosystem services categories (provisioning, regulating or cultural) [51], and variables associated with landscape resources [52].
In this study, the respondents’ visual perceptions of the types of land management systems were evaluated by considering the typical land use continuum in the area of study. As such, the study included the land use types without human intervention, characterized by density and abundance of vegetation (Pictures 1–3). Previous studies relating the visual perception with the types of scenes shown to respondents have indicated that higher evaluation rates are given to scenes depicting continuous vegetative cover [53], as was the case with the natural forest from this study. Pasturelands, on the other hand, are generally given lower ratings, because they are typically associated with agricultural and livestock practices [54], so respondents associate this type of land management system with human activities and intensive-use practices. Resources such as water, soil, and biodiversity of flora and fauna cause emotive feelings towards a place [55]. It was found in this study that the pictures that showed land management systems from an intermediate perspective (P5—managed forest, and P8—croplands) produced some of the highest ratings within their land management system group. This may be the effect of a differentiated visual perception, owing to recognition of the components of diversity, along with other features such as the shape, density, and position of the landscape features [56].
Thus far, the main sociodemographic variables that may act as drivers of the visual perceptions of the landscapes were found to be the gender, level of education, age, and employment [57,58]. In addition, a study on landscape preferences carried out in Germany reported that female respondents who have completed tertiary education, as well as people with knowledge about the environment, gave positive ratings to different landscapes [54]. However, this study shows that men rated the managed and unmanaged forests higher, which may have been due to the fact that they develop their work in relation to forests, and probably understand the functions and services provided by the forests better [59]. In relation to levels of education, respondents from the bachelor’s degree group and above evaluated natural forests with higher scores, but they gave low ratings to croplands (Pictures 7–9); this most likely suggests that their environmental knowledge allowed them to better understand the importance of the rainforest.
The trend of giving higher scores to the natural forest, considering the shares of responses per type of landscape and management system, is possibly related to features such as abundance, structure, and vegetation’s diversity. In support of this, a study on the visual quality of rural landscapes indicated that the beauty of a given landscape is linked to its share of flora, and to low homogeneity (color contrast) [23]. In addition, other studies have mentioned that visual perceptions of forests change in relation to the type of ecosystem, stand age, abundance, and diversity [60,61]. For instance, studies on the structural attributes of forests indicate that the population perceives forests under close-to-nature management and low-intensity managed ecosystems positively [62], while the perceptions of the visitors are often related to the functionality and management of the forests [63].
The results of cluster analysis, showing that there is a collective view that can be differentiated into three groups of land management systems, are consistent with past studies on visual perception. For instance, local users liked natural environments, although other groups of people liked scenes depicting various levels of management or human intervention [64]. According to Schmidt et al. [65], people can be characterized as “forest and nature enthusiasts”, “traditionalists”, and “multi-functionalists”. Accordingly, this study indicates that a mathematical differentiation of the main land use systems can be derived based on the collective perception; however, it was more a differentiation between the forest (natural and managed) and the rest of the land management systems. Moreover, in some cases, the results were contradictory, in the sense that some liked both untouched and highly managed land use systems. This contradiction arises from the fact that, in the study area, croplands and pasturelands are commonly created by removing natural forests, thereby changing the land use type. Although the locals’ perceptions of intensively managed land uses may be driven by the acknowledgement of the potential economic and professional development, which is not necessarily an unsustainable perspective, public dissemination of knowledge would be useful in order for the local population to understand the benefits and the drawbacks of different land use scenarios, including their share in a given area. This would help not only in shaping, but also in accepting and smoothly implementing local governance policies.
The results of this study highlight the importance of the evaluation of visual perception for the purposes of land use planning and management. To the best of our knowledge, this is the first study of its kind implemented in Ecuador. In addition, a study by De Meo et al. [66] mentioned that the knowledge of communities’ perceptions of forests is important for decision makers to develop and implement management strategies [66]; such data are also important for planning or design activities [67]. Finally, we acknowledge that user perceptions may vary according to various factors [68]—for instance, the landscape components and their aesthetic values [69], the backgrounds of different people [70], and lack of knowledge about agricultural practices and environmental attitudes [65]. In this context, our findings provide an overview of the perceptions towards different land management systems, related to the sociodemographic variables. The results of this study can be used to shape a new management approach and objectives taking public perceptions into account, considering that the current management plan of SBP ends in 2021. In addition, some data from this study indicate the importance of educating the local people, in order for them to be more informed about the types of land management systems in the area.
This study evaluated the visual perceptions of the local inhabitants with regard to land management systems via a rather subjective approach which, in addition, implied the use of categorical data in the analytic part of the study. These two important components of the study can also constitute some of its limitations. To what extent other features and mechanisms—such as local and national economics, economic implications, and internal and external trading policies and regulations—would have changed the perceptions of the respondents if brought into the study as quantitative features, remains an open question. In fact, visual assessment is just one component that can be used to evaluate the sustainability of a landscape, and its outcomes need to be balanced with the findings of other quantitative studies. Future studies should add to these findings by extending the assessments over the economic component. By using quantitative data, such studies could elucidate whether the perceptions would remain the same or be shifted based on policy issues and economic implications—particularly those typically brought about by conservation.

5. Conclusions

The results of this research indicate that the natural forest was the most liked by the local people in comparison with the rest of the land use systems. Managed forest was less liked, probably due to the visible impact of human activities. However, one cannot infer that those land management systems with evident human intervention were less liked, as in some cases croplands and pasturelands received high ratings. In addition, there were no significant differences between the scores given to croplands and pasturelands—a fact that was reflected in the clusters formed based on the collective perceptions. Therefore, the results show that locals generally perceived the natural forests positively. Despite that, the perceptions of local people were differentiated, because croplands and pasturelands were probably associated with sources of economic income. However, such land use systems are derived from the removal of natural forest. A combination of the four land use systems would balance the expectations of different stakeholders from the area, while also being consistent to some extent with the current diversity in land management systems. However, a more developed system of information propagation would be beneficial to educate the local population with regards to the benefits and drawbacks of different types of land use and their share.

Author Contributions

Conceptualization, A.V.G.M., D.D.C.V. and S.A.B.; data curation, A.V.G.M., D.D.C.V. and S.A.B.; formal analysis, A.V.G.M. and S.A.B.; investigation, A.V.G.M. and D.D.C.V.; methodology, A.V.G.M., D.D.C.V. and S.A.B.; project administration, S.A.B.; resources, A.V.G.M., D.D.C.V. and S.A.B.; supervision, A.V.G.M., D.D.C.V. and S.A.B.; validation, A.V.G.M., D.D.C.V. and S.A.B.; visualization, A.V.G.M., D.D.C.V. and S.A.B.; writing—original draft, A.V.G.M., D.D.C.V. and S.A.B.; writing—review and editing, A.V.G.M., D.D.C.V. and S.A.B. All authors have read and agreed to the published version of the manuscript.

Funding

This research received no external funding. The APC was funded by the Escuela Superior Politecnica de Chimborazo.

Institutional Review Board Statement

Ethical review and approval were waived for this study due to the fact that the study was carried out based on an informed consent and anonymity of the respondents.

Informed Consent Statement

Each respondent was informed in detail about the objectives of the study and how the data would be used. Each responded agreed verbally to participate in the study under an anonymity clause.

Data Availability Statement

All of the data supporting this study may be made available upon request to the first and second authors of the study.

Acknowledgments

This study reports results that are part of a PhD thesis developed under the supervision of the Doctoral School of the Transilvania University of Brasov. The authors acknowledge the support of Department of Forest Engineering, Forest Management Planning, and Terrestrial Measurements of the Faculty of Silviculture and Forest Engineering, Transilvania University of Brasov. The authors would like to give thanks to the Escuela Superior Politécnica de Chimborazo for technical help during the data collection phase, and to all respondents who participated in this research for supporting our survey.

Conflicts of Interest

The authors declare no conflict of interest.

Appendix A

Table A1. Description of the pictures used for the evaluation of visual preferences.
Photo ContentName
(Abbreviation)
Description
Diversity 13 00592 i001Picture 1
(P1)
Primary (natural) forest from a far perspective.
Diversity 13 00592 i002Picture 2
(P2)
Primary (natural) forest from an intermediate position of the observer.
Diversity 13 00592 i003Picture 3
(P3)
Primary (natural) forest from a close perspective of the observer.
Diversity 13 00592 i004Picture 4
(P4)
Secondary (managed) forest from a far perspective
Diversity 13 00592 i005Picture 5
(P5)
Secondary (managed) forest from an intermediate position of the observer.
Diversity 13 00592 i006Picture 6
(P6)
Secondary (managed) forest from a close perspective of the observer.
Diversity 13 00592 i007Picture 7
(P7)
Croplands from a far perspective.
Diversity 13 00592 i008Picture 8
(P8)
Croplands from an intermediate position of the observer.
Diversity 13 00592 i009Picture 9
(P9)
Croplands from a close perspective of the observer.
Diversity 13 00592 i010Picture 10
(P10)
Pasturelands from a far perspective.
Diversity 13 00592 i011Picture 11
(P11)
Pasturelands from an intermediate position of the observer.
Diversity 13 00592 i012Picture 12
(P12)
Pasturelands from a close perspective of the observer.
Figure A1. Relative frequency of ratings as a function of gender: (a) female respondents; (b) male respondents. Legend: P1 to P12—pictures 1 to 12; 1 to 5 stand for ratings of 1 (“not at all”) to 5 (“very much”).
Diversity 13 00592 g0a1
Figure A2. Relative frequency of ratings as a function of the ethnicity: (a) Caucasian; (b) indigenous; (c) Metis and other. Legend: P1 to P12—pictures 1 to 12; 1 to 5 stand for ratings of 1 (“not at all”) to 5 (“very much”).
Diversity 13 00592 g0a2
Figure A3. Relative frequency of ratings as a function of marital status: (a) single; (b) common law; (c) married; (d) divorced; (e) widow(er). Legend: P1 to P12—pictures 1 to 12; 1 to 5 stand for ratings of 1 (“not at all”) to 5 (“very much”).
Diversity 13 00592 g0a3
Figure A4. Relative frequency of ratings as a function of the age category: (a) less than 30 years old; (b) 31 to 40 years old; (c) 41 to 50 years old; (d) 51 to 60 years old; (e) more than 60 years old. Legend: P1 to P12—pictures 1 to 12; 1 to 5 stand for ratings of 1 (“not at all”) to 5 (“very much”).
Diversity 13 00592 g0a4
Figure A5. Relative frequency of ratings as a function of the education category: (a) elementary school; (b) high school; (c) bachelor’s degree; (d) master’s degree or more. Legend: P1 to P12—pictures 1 to 12; 1 to 5 stand for ratings of 1 (“not at all”) to 5 (“very much”).
Diversity 13 00592 g0a5
Figure A6. Relative frequency of ratings as a function of the occupation category: (a) employed; (b) house care; (c) student; (d) unemployed. Legend: P1 to P12—pictures 1 to 12; 1 to 5 stand for ratings of 1 (“not at all”) to 5 (“very much”).
Diversity 13 00592 g0a6aDiversity 13 00592 g0a6b
Figure A7. Relative frequency of ratings as a function of the monthly income category: (a) less than USD 394; (b) USD 395–733; (c) USD 734–901; (d) more than USD 901. Legend: P1 to P12—pictures 1 to 12; 1 to 5 stand for ratings of 1 (“not at all”) to 5 (“very much”).
Diversity 13 00592 g0a7

References

  1. Juerges, N.; Arts, B.; Masiero, M.; Hoogstra-Klein, M.; Borges, J.G.; Brodrechtova, Y.; Brukas, V.; Canadas, M.J.; Carvalho, P.O.; Corradini, G.; et al. Power analysis as a tool to analyse trade-offs between ecosystem services in forest management: A case study from nine European countries. Ecosyst. Serv. 2021, 49, 101290. [Google Scholar] [CrossRef]
  2. Taye, F.A.; Folkersen, M.V.; Fleming, C.M.; Buckwell, A.; Mackey, B.; Diwakar, K.; Saint, C. The economic values of global forest ecosystem services: A meta-analysis. Ecol. Econ. 2021, 189, 107145. [Google Scholar] [CrossRef]
  3. Portela Peñalver, L.; Rivero Galván, A.; Portela Peñalver, L. Valoración económica de bienes y servicios ecosistémicos en montañas de Guamuhaya, Cienfuegos, Cuba. Rev. Univ. Soc. 2019, 11, 47–55. [Google Scholar]
  4. Fischer, A.P. Forest landscapes as social-ecological systems and implications for management. Landsc. Urban Plan. 2018, 177, 138–147. [Google Scholar] [CrossRef]
  5. Calva, J.; Ortiz, N.; Calapucha, J.; Changa, G.; Pallo, C. Los Bosques de Ecuador: Su Importancia y sus Limitaciones; Universidad Estatal Amazónica: Pastaza, Ecuador, 2020. [Google Scholar]
  6. Malhi, Y.; Gardner, T.A.; Goldsmith, G.R.; Silman, M.R.; Zelazowski, P. Tropical forests in the Anthropocene. Annu. Rev. Environ. Resour. 2014, 39, 125–159. [Google Scholar] [CrossRef] [Green Version]
  7. Trumbore, S.; Brando, P.; Hartmann, H. Forest health and global change. Science 2015, 349, 814–818. [Google Scholar] [CrossRef] [PubMed] [Green Version]
  8. Mackey, B.; DellaSala, D.A.; Kormos, C.; Lindenmayer, D.; Kumpel, N.; Zimmerman, B.; Watson, J.E.M.; Hugh, S.; Young, V.; Foley, S.; et al. Policy options for the world’s primary forests in multilateral environmental agreements. Conserv. Lett. 2015, 8, 139–147. [Google Scholar] [CrossRef] [Green Version]
  9. Duffau, M.V.; Guachimboza, P.K.C. Gobernanza ambiental, Buen Vivir y la evolución de la deforestación en Ecuador en las provincias de Tungurahua y Pastaza. Rev. Derecho 2020, 34, 146–167. [Google Scholar] [CrossRef]
  10. Garí, J. Biodiversity and indigenous agroecology in Amazonia: The indigenous people of Pastaza. Etnoecologica 2001, 5, 21–37. [Google Scholar]
  11. Ahammad, R.; Stacey, N.; Sunderland, T. Analysis of forest-related policies for supporting ecosystem services-based forest management in Bangladesh. Ecosyst. Serv. 2021, 48, 101235. [Google Scholar] [CrossRef]
  12. Miura, S.; Amacher, M.; Hofer, T.; San-Miguel-Ayanz, J.; Thackway, R. Protective functions and ecosystem services of global forests in the past quarter-century. For. Ecol. Manag. 2015, 352, 35–46. [Google Scholar] [CrossRef] [Green Version]
  13. Frick, J.; Bauer, N.; von Lindern, E.; Hunziker, M. What forest is in the light of people’s perceptions and values: Socio-cultural forest monitoring in Switzerland. Geogr. Helv. 2018, 73, 335–345. [Google Scholar] [CrossRef]
  14. Stępniewska, M.; Zwierzchowska, I.; Mizgajski, A. Capability of the Polish legal system to introduce the ecosystem services approach into environmental management. Ecosyst. Serv. 2018, 29, 271–281. [Google Scholar] [CrossRef]
  15. Loft, L.; Mann, C.; Hansjürgens, B. Challenges in ecosystem services governance: Multi-levels, multi-actors, multi-rationalities. Ecosyst. Serv. 2015, 16, 150–157. [Google Scholar] [CrossRef]
  16. Keenan, R.J.; Pozza, G.; Fitzsimons, J.A. Ecosystem services in environmental policy: Barriers and opportunities for increased adoption. Ecosyst. Serv. 2019, 38, 100943. [Google Scholar] [CrossRef]
  17. Gavilanes, A.; Castillo, D.; Morocho, J.; Marcu, V.; Borz, S. Importance and use of ecosystem services provided by the Amazonian landscapes in Ecuador-evaluation and spatial scaling of a representative area. Bull. Transilv. Univ. Brasov. For. Wood Ind. Agric. Food Eng. Ser. II 2019, 12, 1–26. [Google Scholar] [CrossRef]
  18. Silva, E.; Reardon, H.; Soares, A.; Azeiteiro, U. Identity and environment: Historical trajectories of ‘traditional’ communities in the protection of the Brazilian Amazon. In Sustainability in Natural Resources Management and Land Planning; Springer: Cham, Switzerland, 2021; pp. 233–248. [Google Scholar] [CrossRef]
  19. Catacutan, D.C.; Van Noordwijk, M.; Nguyen, T.H.; Öborn, I.; Mercado, A.R. Agroforestry: Contribution to Food Security and Climate-Change Adaptation and Mitigation in Southeast Asia; White Paper; World Agroforestry Centre (ICRAF) Southeast Asia Regional Program: Bogor, Indonesia, 2017. [Google Scholar]
  20. Carrasco, L.R.; Papworth, S.K.; Reed, J.; Symes, W.S.; Ickowitz, A.; Clements, T.; Sunderland, T.; Peh, K.-H. Five challenges to reconcile agricultural land use and forest ecosystem services in Southeast Asia. Conserv. Biol. 2016, 30, 962–971. [Google Scholar] [CrossRef] [Green Version]
  21. FAO; PROFOR. Framework for Assessing and Monitoring Forest Governance; Food and Agriculture Organisation and Program on Forests (PROFOR): Rome, Italy, 2011. [Google Scholar]
  22. Valencia-Sandoval, C.; Flanders, D.N.; Kozak, R.A. Participatory landscape planning and sustainable community development: Methodological observations from a case study in rural Mexico. Landsc. Urban Plan. 2010, 94, 63–70. [Google Scholar] [CrossRef]
  23. Arriaza, M.; Cañas-Ortega, J.F.; Cañas-Madueño, J.; Ruiz-Aviles, P. Assessing the visual quality of rural landscapes. Landsc. Urban Plan. 2004, 69, 115–125. [Google Scholar] [CrossRef]
  24. Zhao, J.; Luo, P.; Wang, R.; Cai, Y. Correlations between aesthetic preferences of river and landscape characters. J. Environ. Eng. Landsc. Manag. 2013, 21, 123–132. [Google Scholar] [CrossRef]
  25. Daniel, T.C.; Meitner, M.M. Representational validity of landscape visualizations: The effects of graphical realism on perceived scenic beauty of forest vistas. J. Environ. Psychol. 2001, 21, 61–72. [Google Scholar] [CrossRef] [Green Version]
  26. Gobster, P.H.; Ribe, R.G.; Palmer, J.F. Themes and trends in visual assessment research: Introduction to the landscape and urban planning special collection on the visual assessment of landscapes. Landsc. Urban Plan. 2019, 191, 103635. [Google Scholar] [CrossRef]
  27. Lothian, A. Landscape and the philosophy of aesthetics: Is landscape quality inherent in the landscape or in the eye of the beholder? Landsc. Urban Plan. 1999, 44, 177–198. [Google Scholar] [CrossRef]
  28. Tveit, M.S. Indicators of visual scale as predictors of landscape preference; a comparison between groups. J. Environ. Manag. 2009, 90, 2882–2888. [Google Scholar] [CrossRef]
  29. Strumse, E. Demographic differences in the visual preferences for agrarian landscapes in western Norway. J. Environ. Psychol. 1996, 16, 17–31. [Google Scholar] [CrossRef]
  30. Vouligny, É.; Domon, G.; Ruiz, J. An assessment of ordinary landscapes by an expert and by its residents: Landscape values in areas of intensive agricultural use. Land Use Policy 2009, 26, 890–900. [Google Scholar] [CrossRef]
  31. Molnarova, K.; Sklenicka, P.; Stiborek, J.; Svobodova, K.; Salek, M.; Brabec, E. Visual preferences for wind turbines: Location, numbers and respondent characteristics. Appl. Energy 2012, 92, 269–278. [Google Scholar] [CrossRef] [Green Version]
  32. Spielhofer, R.; Hunziker, M.; Kienast, F.; Hayek, U.W.; Grêt-Regamey, A. Does rated visual landscape quality match visual features? An analysis for renewable energy landscapes. Landsc. Urban Plan. 2021, 209, 104000. [Google Scholar] [CrossRef]
  33. Asur, F.; Deniz Sevimli, S.; Yazici, K. Visual preferences assessment of landscape character types using data mining methods (Apriori algorithm): The case of Altınsaç and Inkoy (Van/Turkey). J. Agric. Sci. Technol. 2020, 22, 247–260. [Google Scholar]
  34. Gavilanes, A.; Castillo, D.; Ricaurte, C.; Marcu, M.; Borz, S. Known and newly documented uses of 540 rainforest species in the Pastaza region, Ecuador. Bull. Transilv. Univ. Braşov 2018, 11, 20. [Google Scholar] [CrossRef]
  35. CDTER. Plan de Desarrollo y Ordenamiento Territorial de la Parroquia Simón Bolívar 2015–2019, GADPR Simón Bolivar, Ecuador. 2015. Available online: http://app.sni.gob.ec/sni-link/sni/PORTAL_SNI/data_sigad_plus/sigadplusdocumentofinal/1660011960001_PD%20Y%20OT%20GADPR%20SIM%C3%93N%20BOL%C3%8DVAR_30-10-2015_19-31-05.pdf (accessed on 12 September 2021).
  36. Organización de las Naciones Unidas para la Agricultura y la Alimentación (FAO). Evaluación de los Recursos Forestales Mundiales 2015. ¿Cómo están Cambiando los Bosques del Mundo? 2a ed.; FAO: Rome, Italy, 2016; pp. 1–54. [Google Scholar]
  37. Bonilla, S.; Estrella, A.; Molina, J.; Herrera, M. Socioecological system and potential deforestation in Western Amazon forest landscapes. Sci. Total Environ. 2018, 644, 1044–1055. [Google Scholar] [CrossRef] [PubMed]
  38. Ponce, C. Sistema Nacional de Monitoreo de Bosques. 2017. Available online: http://redd.mma.gov.br/images/gttredd/carlosponce_equador.pdf (accessed on 12 September 2021).
  39. Ministerio del Ambiente del Ecuador (MAE). Sistema de Clasificación de Ecosistemas del Ecuador Continental; Ministerio del Ambiente del Ecuador: Quito, Ecuador, 2013. Available online: http://app.sni.gob.ec/sni-link/sni/PDOT/NIVEL%20NACIONAL/MAE/ECOSISTEMAS/DOCUMENTOS/Sistema.pdf (accessed on 12 September 2021).
  40. Mena, C. Deforestación en el Norte de la Amazonía Ecuatoriana: Del patrón al proceso. Polémika 2010, 2, 1–5. [Google Scholar]
  41. Ríos, M.; Pedersen, H. Uso y Manejo de Recursos Vegetales. Memorias del Segundo Simposio Ecuatoriano de Etnobotánica y Botánica Económica. En uso y Manejo de Recursos Vegetales: Memorias del Segundo Simposio Ecuatoriano de Etnobotánica y Botánica Económica; Ediciones Abya-Yala: Quito, Ecuador, 1997. [Google Scholar]
  42. Gavilanes, A. Capacity of the Ecuadorian Amazonian Rainforest to Provide Ecosystem Services: An Evaluation of Plant Uses, Capacity to Provide Products and Services and Perception on the Landscape Management Systems in the View of Local Stakeholders. Ph.D. Thesis, Universitatea Transilvania Brasov, Brasov, Romania, 2020. [Google Scholar]
  43. CA—Correspondence Analysis in R: Essentials. Available online: http://www.sthda.com/english/articles/31-principal-component-methods-in-r-practical-guide/113-ca-correspondence-analysis-in-r-essentials/ (accessed on 10 November 2021).
  44. Demsar, J.; Curk, T.; Erjavec, A.; Gorup, C.; Hocevar, T.; Milutinovic, M.; Mozina, M.; Polajnar, M.; Toplak, M.; Staric, A.; et al. Orange: Data Mining Toolbox in Python. J. Mach. Learn. Res. 2013, 14, 2349–2353. [Google Scholar]
  45. Instituto Nacional de Estadística y Censos (INEC). Encuesta Nacional de Empleo, Desempleo y Subempleo 2021 (ENEMDU). 2021. Available online: https://www.ecuadorencifras.gob.ec/documentos/web-inec/POBREZA/2021/Junio-2021/202106_PobrezayDesigualdad.pdf (accessed on 12 September 2021).
  46. Instituto Nacional de Estadística y Censos (INEC). Principales resultados Encuesta Nacional de Empleo, Desempleo y Subempleo. 2021. Available online: https://www.ecuadorencifras.gob.ec/documentos/web-inec/EMPLEO/2021/Julio-2021/202107_Mercado_Laboral.pdf (accessed on 12 September 2021).
  47. Degnet, M.; Van der, E.; Ingram, V.; Wesseler, J. Do locals have a say? Community experiences of participation in governing Forest plantations in Tanzania. Forests 2020, 11, 782. [Google Scholar] [CrossRef]
  48. Payn, T.; Carnus, J.; Freer, P.; Kimberley, M.; Kollert, W.; Liu, S.; Wingfield, M. Changes in planted forests and future global implications. For. Ecol. Manag. 2015, 352, 57–67. [Google Scholar] [CrossRef] [Green Version]
  49. Garekae, H.; Lepetu, J.; Thakadu, O.; Sebina, V.; Tselaesele, N. Community perspective on state forest management regime and its implication on forest sustainability: A case study of Chobe Forest Reserve, Botswana. J. Sustain. For. 2020, 39, 692–709. [Google Scholar] [CrossRef]
  50. Carrasco, L.; Nghiem, T.; Sunderland, T.; Koh, L. Economic valuation of ecosystem services fails to capture biodiversity value of tropical forests. Biol. Conserv. 2014, 178, 163–170. [Google Scholar] [CrossRef]
  51. Quintas, C.; Martín, B.; Santos, F.; Loureiro, M.; Montes, C.; Benayas, J.; García, M. Ecosystem services values in Spain: A metaanalysis. Environ. Sci. Policy 2016, 55, 186–195. [Google Scholar] [CrossRef]
  52. Zandersen, M.; Tol, R. A meta-analysis of forest recreation values in Europe. J. For. Econ. 2009, 15, 109–130. [Google Scholar] [CrossRef]
  53. Nahuelhual, L.; Laterra, P.; Jiménez, D.; Báez, A.; Echeverría, C.; Fuentes, R. Do people prefer natural landscapes? An empirical study in Chile. Bosque (Valdivia) 2018, 39, 205–216. [Google Scholar] [CrossRef] [Green Version]
  54. Häfner, K.; Zasada, I.; van Zanten, B.; Ungaro, F.; Koetse, M.; Piorr, A. Assessing landscape preferences: A visual choice experiment in the agricultural region of Märkische Schweiz, Germany. Landsc. Res. 2018, 43, 846–861. [Google Scholar] [CrossRef]
  55. Pan, S.; Lee, J.; Tsai, H. Travel photos: Motivations, image dimensions, and affective qualities of places. Tour. Manag. 2014, 40, 59–69. [Google Scholar] [CrossRef]
  56. Rensink, R. Scene Perception. Oxford University Press. Encyclopedia of psychology. 2000, 7, 151–155. [Google Scholar]
  57. Kalivoda, O.; Vojar, J.; Skřivanová, Z.; Zahradník, D. Consensus in landscape preference judgments: The effects of landscape visual aesthetic quality and respondents’ characteristics. J. Environ. Manag. 2014, 137, 36–44. [Google Scholar] [CrossRef] [PubMed]
  58. Campbell, C.; Cox, A.; Darby, H.; Roberts, D.; Torrance, L. Landscape Preference and Perception. 2019. Available online: https://macaulay.webarchive.hutton.ac.uk/visualisationlitrev/chap2.html (accessed on 12 September 2021).
  59. Affek, A.; Kowalska, A. Ecosystem potentials to provide services in the view of direct users. J. Ecosyst. Serv. 2017, 26, 183–196. [Google Scholar] [CrossRef]
  60. Nielsen, A.; Gundersen, V.; Jensen, F. The impact of field layer characteristics on forest preference in Southern Scandinavia. Landsc. Urban Plan. 2018, 170, 221–230. [Google Scholar] [CrossRef]
  61. Sklenicka, P.; Molnarova, K. Visual perception of habitats adopted for post-mining landscape rehabilitation. Environ. Manag. 2010, 46, 424–435. [Google Scholar] [CrossRef]
  62. Edwards, D.; Jay, M.; Jensen, F.; Lucas, B.; Marzano, M.; Montagné, C.; Peace, A.; Weiss, G. Public preferences for structural attributes of forests: Towards a pan-European perspective. For. Policy Econ. 2012, 19, 12–19. [Google Scholar] [CrossRef]
  63. Pastorella, F.; Avdagić, A.; Čabaravdić, A.; Mraković, A.; Osmanović, M.; Paletto, A. Tourists’ perception of deadwood in mountain forests. Ann. For. Res. 2016, 59, 311–326. [Google Scholar] [CrossRef] [Green Version]
  64. Schroeder, H. Preference and meaning of arboretum landscapes: Combining quantitative and qualitative data. J. Environ. Psychol. 1991, 11, 231–248. [Google Scholar] [CrossRef]
  65. Schmidt, K.; Walz, A.; Martín-López, B.; Sachse, R. Testing socio-cultural valuation methods of ecosystem services to explain land use preferences. Ecosyst. Serv. 2017, 26, 270–288. [Google Scholar] [CrossRef]
  66. De Meo, I.; Paletto, A.; Cantiani, M. The attractiveness of forests: Preferences and perceptions in a mountain community in Italy. Ann. For. Res. 2015, 58, 145–156. [Google Scholar] [CrossRef]
  67. Palmer, J.; Hoffman, R. Rating reliability and representation validity in scenic landscape assessments. Landsc. Urban Plan. 2001, 54, 149–161. [Google Scholar] [CrossRef]
  68. Chua, H.; Boland, J.; Nisbett, R. Cultural variation in eye movements during scene perception. Proc. Natl. Acad. Sci. USA 2005, 102, 12629–12633. [Google Scholar] [CrossRef] [PubMed] [Green Version]
  69. Hagerhall, C. Clustering predictors of landscape preference in the traditional Swedish cultural landscape: Prospect-refuge, mystery, age and management. J. Environ. Psychol. 2000, 20, 83–90. [Google Scholar] [CrossRef]
  70. Bell, S. Landscape pattern, perception and visualisation in the visual management of forests. Landsc. Urban. Plan. 2001, 54, 201–211. [Google Scholar] [CrossRef]
Figure 1. Map of the study area. (A) Simon Bolivar Parish location (B) location in relation to South America, Ecuador and Pastaza Province.
Diversity 13 00592 g001
Figure 2. Relative frequencies of ratings at the picture level, aggregated for the sample under study. Legend: 1 to 5 stand for ratings of 1 to 5, P1 to P12 stand for Pictures 1 to 12.
Diversity 13 00592 g002
Figure 3. Symmetrical biplot of the correspondence analysis (a) and proportion of explained variance (b). Legend: blue dots (rows) represent the ratings given, and red triangles (columns) represent the rated pictures.
Diversity 13 00592 g003aDiversity 13 00592 g003b
Figure 4. Asymmetrical plot (a), and contributions of columns (b) and rows (c) to the dimensions.
Diversity 13 00592 g004aDiversity 13 00592 g004b
Figure 5. Distance map (a) and distance matrix (b) of the data used as inputs for clustering.
Diversity 13 00592 g005
Figure 6. Dendrogram of the land management systems built based on the rating data. Legend: blue—cluster of pictures depicting the natural forest; red—cluster of pictures depicting managed forest; green—cluster of pictures depicting croplands and pasturelands.
Diversity 13 00592 g006
Table 1. Description of the stakeholders from the study area.
NameRolesDecision MakingUse of ResourcesManagement of Resources
Government of SBPActivities related to the parish and land planning.XXX
Department of public irrigation of SBPControls the use of irrigation water and its rates.XX
Public department of potable waterProvision and quality control of water for human use.XX
Municipality of Puyo CantonPlans the categories of land management systems and occupation to regulate the activities to be developed.XX
Prefecture of PastazaContributes to the productivity and environment. Develops programs to promote agriculture, conservation, and aquaculture.XX
Population of SBPConsumes the natural resources.XX
Farmer organizationsContribute to decision making in agricultural activities.XX
Simón Bolivar ChurchReligious components linked to environmental practices.X
Table 2. Main statistics of sociodemographic characteristics.
FeatureItemAbsolute FrequencyRelative Frequency (%)
GenderFemale18448.9
Male19251.1
Civil statusSingle13435.6
Common law8221.8
Married12332.7
Divorced256.6
Widow(er)123.2
AgeLess than 30 years old15541.2
30–41 years old10327.4
41–50 years old5213.8
51–60 years old369.6
More than 60 years old308.0
EducationElementary12834.0
High school17847.3
Bachelor’s degree6417.0
Master’s degree or more61.6
EthnicityCaucasian61.6
Indigenous9023.9
Metis and Other28074.5
Monthly incomeLess than USD 39427071.8
USD 395–7936617.6
USD 794–901215.6
More than USD 901195.1
OccupationEmployed23061.2
House care9224.5
Student3910.4
Unemployed154.0
Publisher’s Note: MDPI stays neutral with regard to jurisdictional claims in published maps and institutional affiliations.

