
Old Brains in Alcohol: The Usability of Legacy Collection Material to Study the Spider Neuroarchitecture


1
Understanding Evolution Research Group, Naturalis Biodiversity Center, Darwinweg 2, 2333 CR Leiden, The Netherlands
2
Institute for Biology Leiden (IBL), Leiden University, Sylviusweg 72, 2333 BE Leiden, The Netherlands
*
Authors to whom correspondence should be addressed.
Diversity 2021, 13(11), 601; https://0-doi-org.brum.beds.ac.uk/10.3390/d13110601
Submission received: 7 October 2021
/
Revised: 12 November 2021
/
Accepted: 16 November 2021
/
Published: 21 November 2021
(This article belongs to the Special Issue Phylogenomic, Biogeographic, and Evolutionary Research Trends in Arachnology)
Abstract
:Natural history collections include rare and significant taxa that might otherwise be unavailable for comparative studies. However, curators must balance the needs of current and long-term research. Methods of data extraction that minimize the impact on specimens are therefore favored. Micro-CT has the potential to expose new character systems based on internal anatomy to taxonomic and phylogenetic analysis without dissection or thin sectioning for histology. However, commonly applied micro-CT protocols involve critical point drying, which permanently changes the specimen. Here, we apply a minimally destructive method of specimen preparation for micro-CT investigation of spider neuroanatomy suitable for application to legacy specimens in natural history collections. We used two groups of female spiders of the common species Araneus diadematus—freshly captured (n = 11) vs. legacy material between 70 and 90 years old (n = 10)—to qualitatively and quantitatively assess the viability of micro-CT scanning and the impact of aging on their neuroarchitecture. We statistically compared the volumes of the supraesophageal ganglion (syncerebrum) and used 2D geometric morphometrics to analyze variations in the gross shape of the brain. We found no significant differences in the brain shape or the brain volume relative to the cephalothorax size. Nonetheless, a significant difference was observed in the spider size. We considered such differences to be explained by environmental factors rather than preservation artifacts. Comparison between legacy and freshly collected specimens indicates that museum specimens do not degrade over time in a way that might bias the study results, as long as the basic preservation conditions are consistently maintained, and where lapses in preservation have occurred, these can be identified. This, together with the relatively low-impact nature of the micro-CT protocol applied here, could facilitate the use of old, rare, and valuable material from collections in studies of internal morphology.
Keywords:
Arachnida; Arthropoda; tissue; X-rays; micro-CT; cerebrum; nervous system; neuroanatomy; imaging1. Introduction
Specimens in natural history collections represent one of our largest and most complete archives of biodiversity records. They provide verifiable evidence of the existence of species in space and time, as well as molecular and morphological information, and cues about biodiversity dynamics, ecological interactions, and even physiological processes [1,2,3,4,5,6]. In a changing world, this historical baseline will become increasingly precious. High-value specimens in natural history collections include many rare species known from only one or a few specimens collected long ago, type specimens that are the essential vouchers for taxonomic research, and specimens from now extinct populations or species. The long-term preservation of such collections for future study is vital [7,8]. Curators must be responsive to the needs of current research without curtailing future research. Methods that extract data with the minimum possible impact on specimens are therefore preferable. Minimally destructive methods have been developed to facilitate DNA extraction from high-value specimens [7,8,9]. With some exceptions for specialized collections, natural history collection conditions are generally not adequate to completely prevent the degradation of specimen DNA [10,11,12,13]. However, the advent of new molecular technologies such as target-capture methods have substantiated the use of museum specimens as a source of DNA sequences from material collected decades or even centuries ago [2]. Similarly, cutting-edge imaging methods such as micro-CT scans have allowed the observation and characterization of internal anatomy while producing a minimal impact on the specimen by comparison with other methods for documenting internal anatomy (e.g., histology or dissection) [3,14]. Still, the effect of preservatives on the volume and shape of the structures may pose a challenge to the correct visualization, interpretation, and quantification of a specimen’s anatomy [15].
Micro-CT has gained traction in recent years as a way to observe the internal and external anatomy and reconstruct 3D models of a variety organs and systems in different invertebrate taxa [3,14,16,17,18,19,20,21,22,23,24]. Its ability to visualize and reconstruct models of internal and external anatomical features, without the need for dissection or thin slicing, makes this approach ideal for the digitization of both common and rare material. Ideal contrast in scans can be achieved through a staining process (critical for soft tissues) from which several protocols are available; these vary in their impact on specimen preservation and visualization [14,17,25]. Remarkably, in spiders, its use has allowed the documentation of a variety of sexual, muscular, and nervous organs and systems. This has permitted a quick and reliable way to generate 3D reconstructions and volume measurements that have the potential to become a powerful tool in studies as diverse as systematics, sexual selection, character evolution, and development, among many others [25,26,27,28,29,30]. Most of these studies on spiders have relied on the use of freshly collected material following, in many cases, specific fixation protocols. However, biological collections offer a massive library of taxa that can likely grant access to rare and relevant species while also broadening our potential taxonomic sampling. Furthermore, widely used protocols involve critical point drying of specimens, which can lead to distortions of the internal anatomy and interrupts ethanol preservation, permanently changing the specimen in ways that curtail other common research applications [25].
Here, we used a recently developed micro-CT protocol for spiders based on phosphotungstic acid (PTA) [25] to document and compare two groups (freshly collected vs. collection material) of the common spider Araneus diadematus Clerck, 1757. We found that given the correct preservation of specimens, gross neuroarchitectural features (as well as other anatomical traits) can be visualized, measured, and reconstructed, even after decades of 70% Et-OH storage.
2. Materials and Methods
Two groups of adult female Araneus diadematus were used. Group 1 (n = 11) was composed of spiders freshly collected at the Singelpark, Leiden, the Netherlands in October 2020. Group 2 (n = 10) was formed by legacy specimens archived in the collection of the Naturalis Biodiversity Center and collected within the Netherlands between the years 1929 and 1948 (Table 1). Fresh spiders were directly placed and stored in 70% Et-OH; collection specimens were stored in 70% Et-OH as well. All the specimens had their legs and palps removed and were stained with a contrast enhancing solution (1% PTA-70% Et-OH) for several days following Rivera-Quiroz and Miller [25]. After staining, all spiders were washed three times with 96% Et-OH and transferred into 1.5 mL eppendorf tubes filled with 96% Et-OH for scanning. Micro-CT scanning was performed with a Zeiss X-radia 520 versa. The software Avizo 2021.2 (Thermo Fisher Scientific, Waltham, MA, USA) was used to visualize the scannings and make 3D reconstructions of the supraesophageal ganglion. Labeling of the brain structures was performed by topological correspondence to the anatomy of Araneus diadematus and Argiope lobata (as Epeira in the original publication) [31], Argiope trifasciata [32,33], and other araneomorph spiders [27,29,34].
For the volumetric analysis, we obtained the synganglion volumes from the 3D reconstruction, and measurements of cephalothorax and brain length and width in Avizo. The size–volume ratio was obtained by dividing the cephalothorax and brain measurements by the total synganglion volume in mm3. Box plots were generated in R using the package GGplot2 [35]. Colored boxes indicate the 25 and 75 percentiles or interquartile range (IQR), the thick horizontal lines indicate the group’s median and error lines (whiskers) indicate the maximum and minimum distribution for the group (calculated as minimum value − 1.5 × IQR and maximum value + 1.5 × IQR). Individual values are represented with a dot; values that fall outside the error lines indicate potential outliers. Samples were tested for normality following a graphical approach (based on the boxplots) and a Shapiro–Wilk normality test performed in R [36]. In case Shapiro–Wilk suggested a non-normal distribution, outliers were removed and samples were tested a second time. Welch two sample t-test analyses were performed to test for significant differences between the normally distributed groups.
Due to the asymmetric nature of the optic nerves and other incidental abnormalities we found in the brain (see discussion), there was no satisfactory view that included right and left sides of the brain and optic lobes using the slice function in Avizo. Therefore, we used a simplified reconstruction of the whole supraesophageal ganglion on an axial view to perform the shape analysis. A scalebar of 200 micrometers was added to each image in Avizo and was used to calibrate the size before setting the landmarks. The software tpsUtil64 [37] was used to build a TPS file from the Axial views of the brain reconstructions.
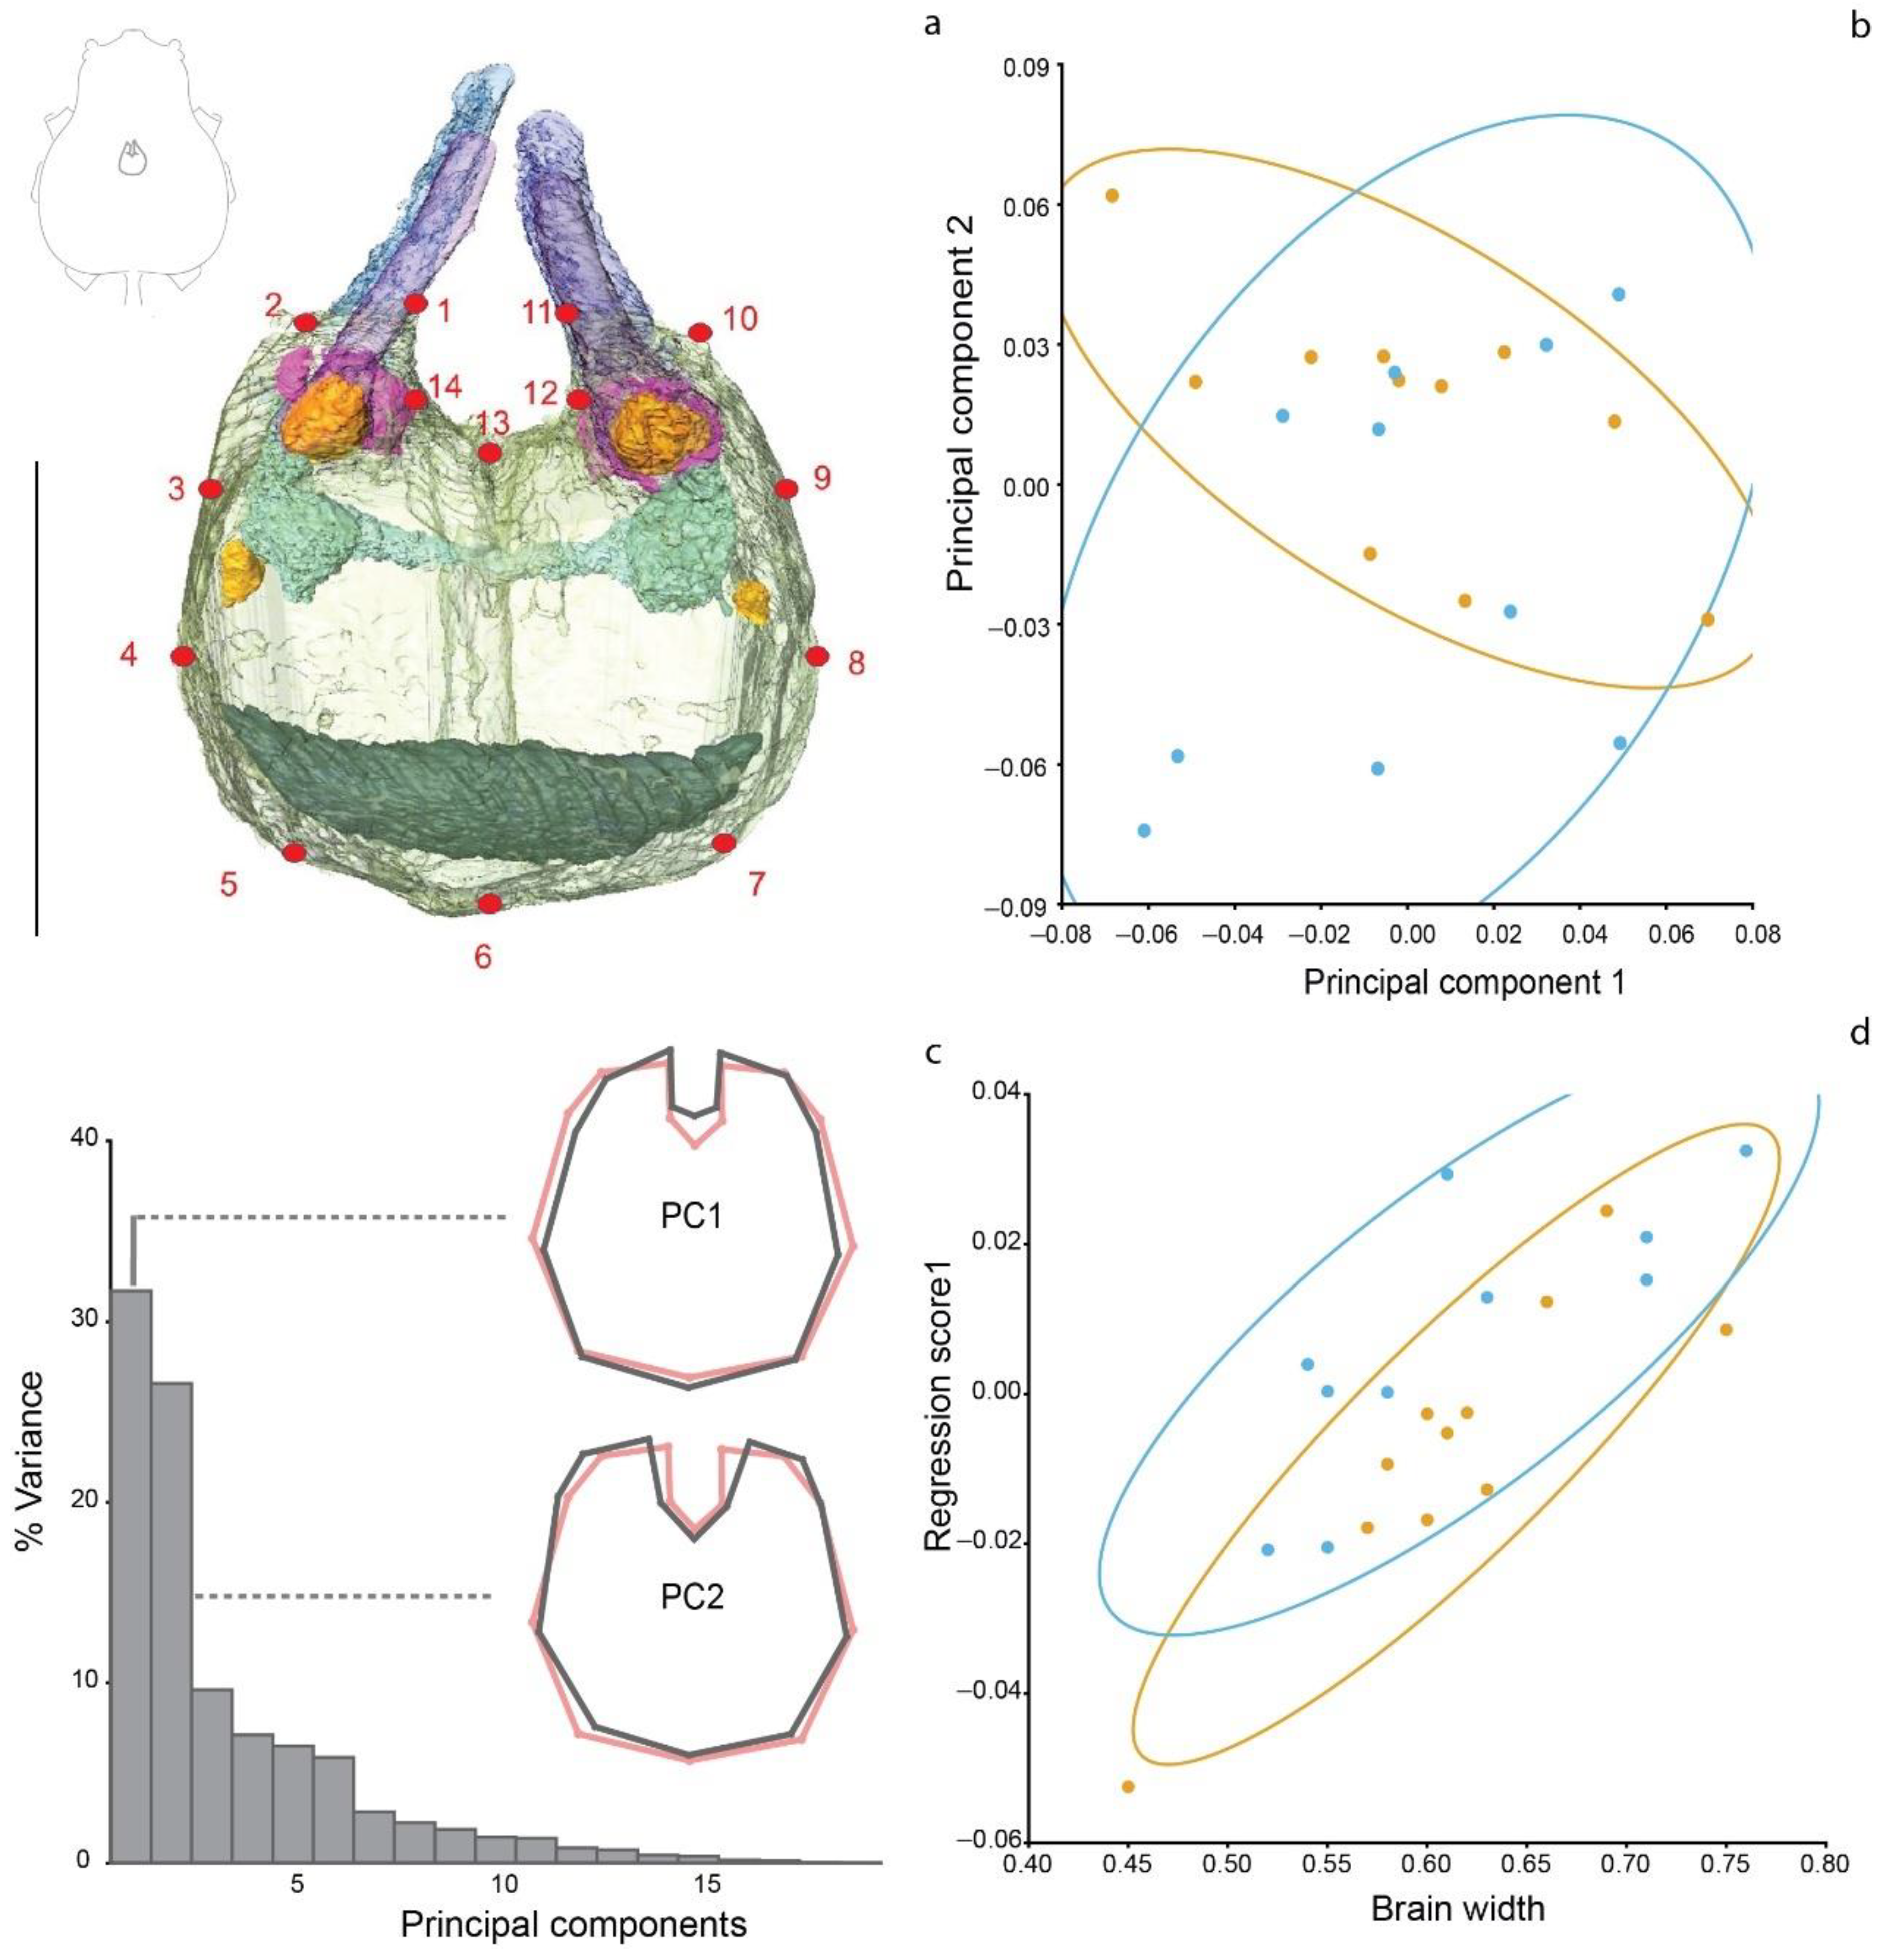
A total of fourteen landmarks were per image were manually laid using tpsDig264 [38]. Landmarks were placed on the most prominent features of the optic lobes in the anterior portion of the brain in the following order: Landmark 1 is placed at the intersection of the secondary eyes optic nerve and the left brain’s cellular cortex (CC) on the medial side. Landmarks 2 and 14 are placed on either side of the first visual neuropile of the left secondary eye tract. Landmarks 11, 10, and 12 mirror 1, 2, and 14 on the right side. Landmark 13 is placed on the cleavage of the right and left optic lobes. The posterior part lacks clear morphological features; therefore, to keep a consistent placement, landmarks were evenly distributed every 45 degrees in a semicircular fashion taking the middle axis as the starting point (see Figure A1). The program MorphoJ v.1.07a [39] was used to perform the geometric morphometric analysis. A preliminary procrustes fit was performed aligning the coordinates by principal axes. Additionally, as part of the preliminaries, a wire frame was created to help visualize the mean shape and two classifiers (group and size) were created. Group classifier indicates whether the specimens were freshly collected (New) or were legacy material (Old). A principal component analysis was performed to observe the distribution of our data (see Theska [40]), after which we performed a regression analysis to predict association between the procrustes values (dependent variable) and brain width (independent variable). Finally, we used a discriminant function analysis for further comparison of the shape variation between both groups.
3. Results
3.1. Size and Volumetric Analyses
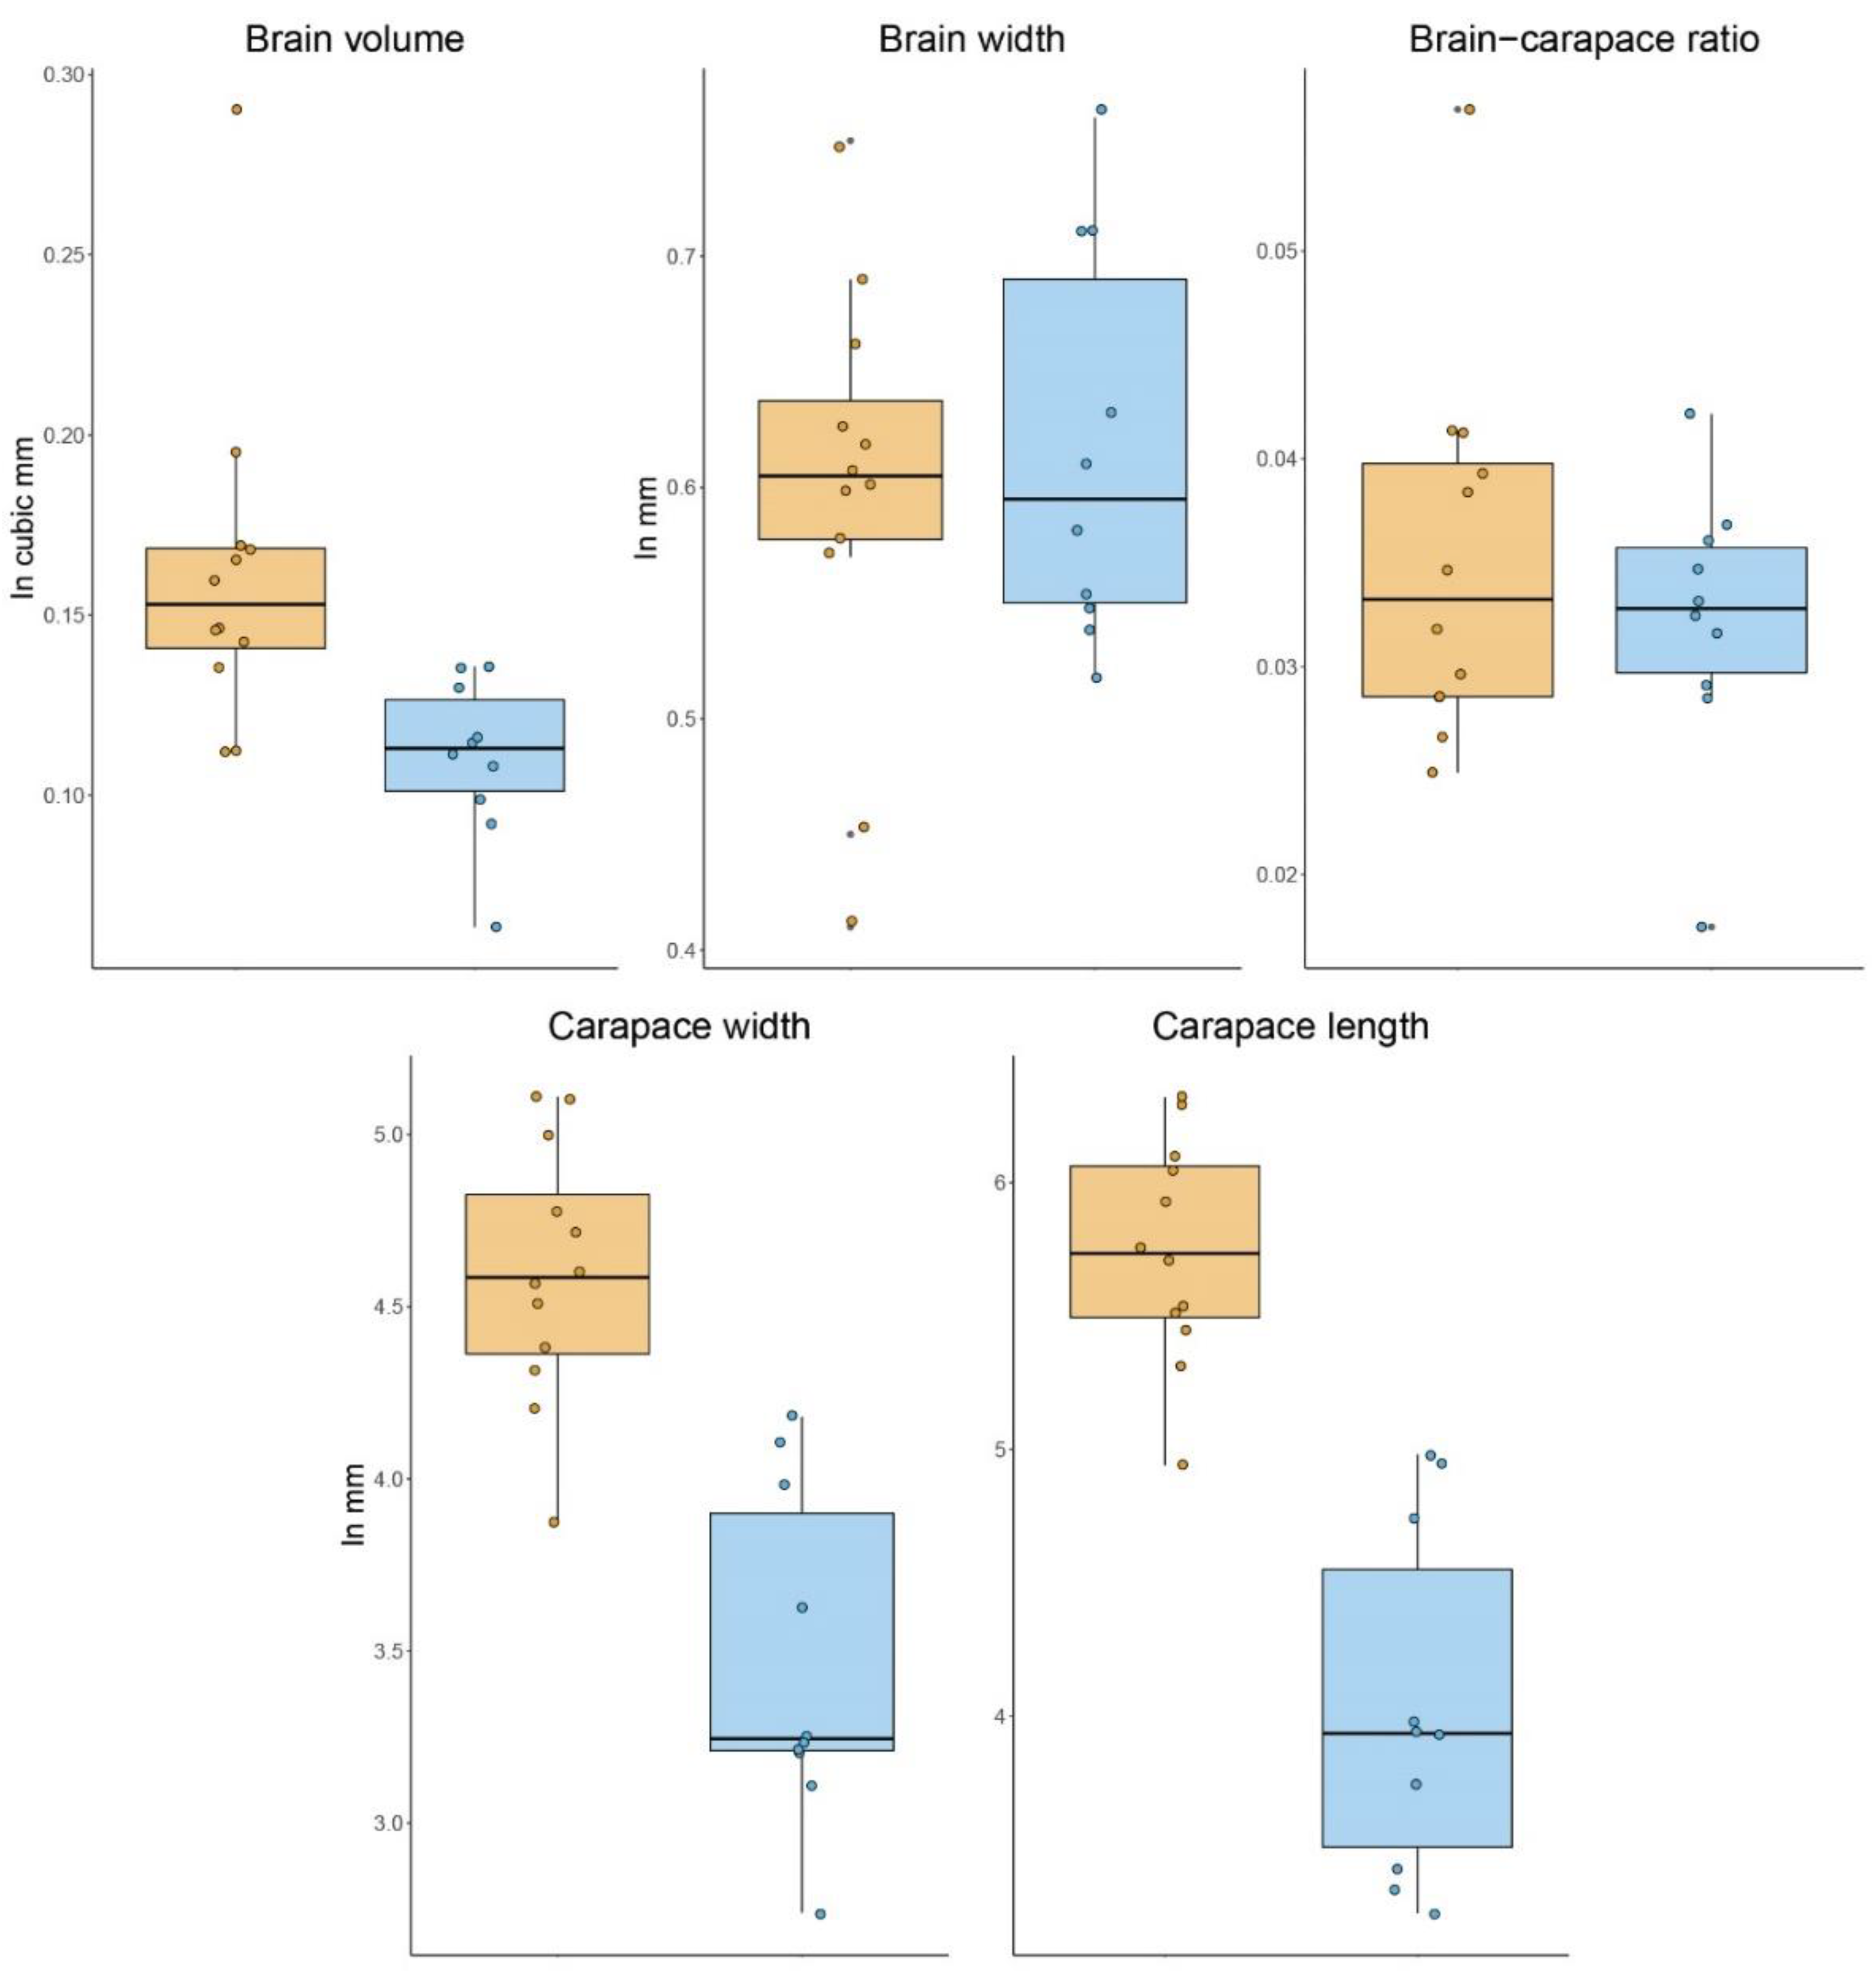
Our analyses showed an unequivocal difference in sizes between the freshly collected samples and the legacy material. The mean cephalothorax length was of 5.82 ± 0.363 mm for the New group while the Old group was smaller with 4.03 ± 0.647 mm. Similarly, the mean carapace width was 4.59 ± 0.370 mm and 3.46 ± 0.484 mm, respectively. The Shapiro–Wilk test showed all our samples to be normally distributed (Table 2). The t-test results show a significant difference between the groups in carapace length (t (14.823) = −7.2144, p = 3.215 × 10⁻⁶) and carapace width (t (16.795) = −6.024, p = 1.44 × 10⁻⁵). Interestingly, even the largest specimen from the legacy material is far below the mean size of the freshly collected spiders. We found a significant difference in the volume of the supraesophageal ganglion, with the New group averaging 0.16 ± 0.048 mm3 and the Old spiders 0.11 ± 0.022 mm3 (t (18.989) = −3.8665, p = 0.00104). The Shapiro–Wilk test showed brain size data to be normally distributed, except for volume of the New samples, which achieved normality after removal of one outlier (Table 2). By three metrics (carapace length, carapace width, brain volume), the fresh spiders were larger than the legacy specimens. However, we found no significant difference in the width of the supraesophageal ganglion, 0.61 ± 0.078 mm in the New group vs. 0.61 ± 0.084 mm in the Old group (t (19.841) = 0.48921, p = 0.6301. Moreover, when comparing the brain volume–cephalothorax width ratio as a way of scaling for differences in overall size, the groups were not significantly different: 0.036 ± 0.009 mm in the New group vs. 0.032 ± 0.006 mm in the Old group (t (19.714) = −0.89161, p = 0.3834) (Figure 1).
All subsets we compared were tested for normality using a Shapiro–Wilk test. The p-values in the first two columns are were calculated from the original sample (p > 0.05 indicates a normal distribution). Values in the second two columns were obtained after the removal of outliers; the number of discarded outliers is shown in brackets.
3.2. Shape Variation
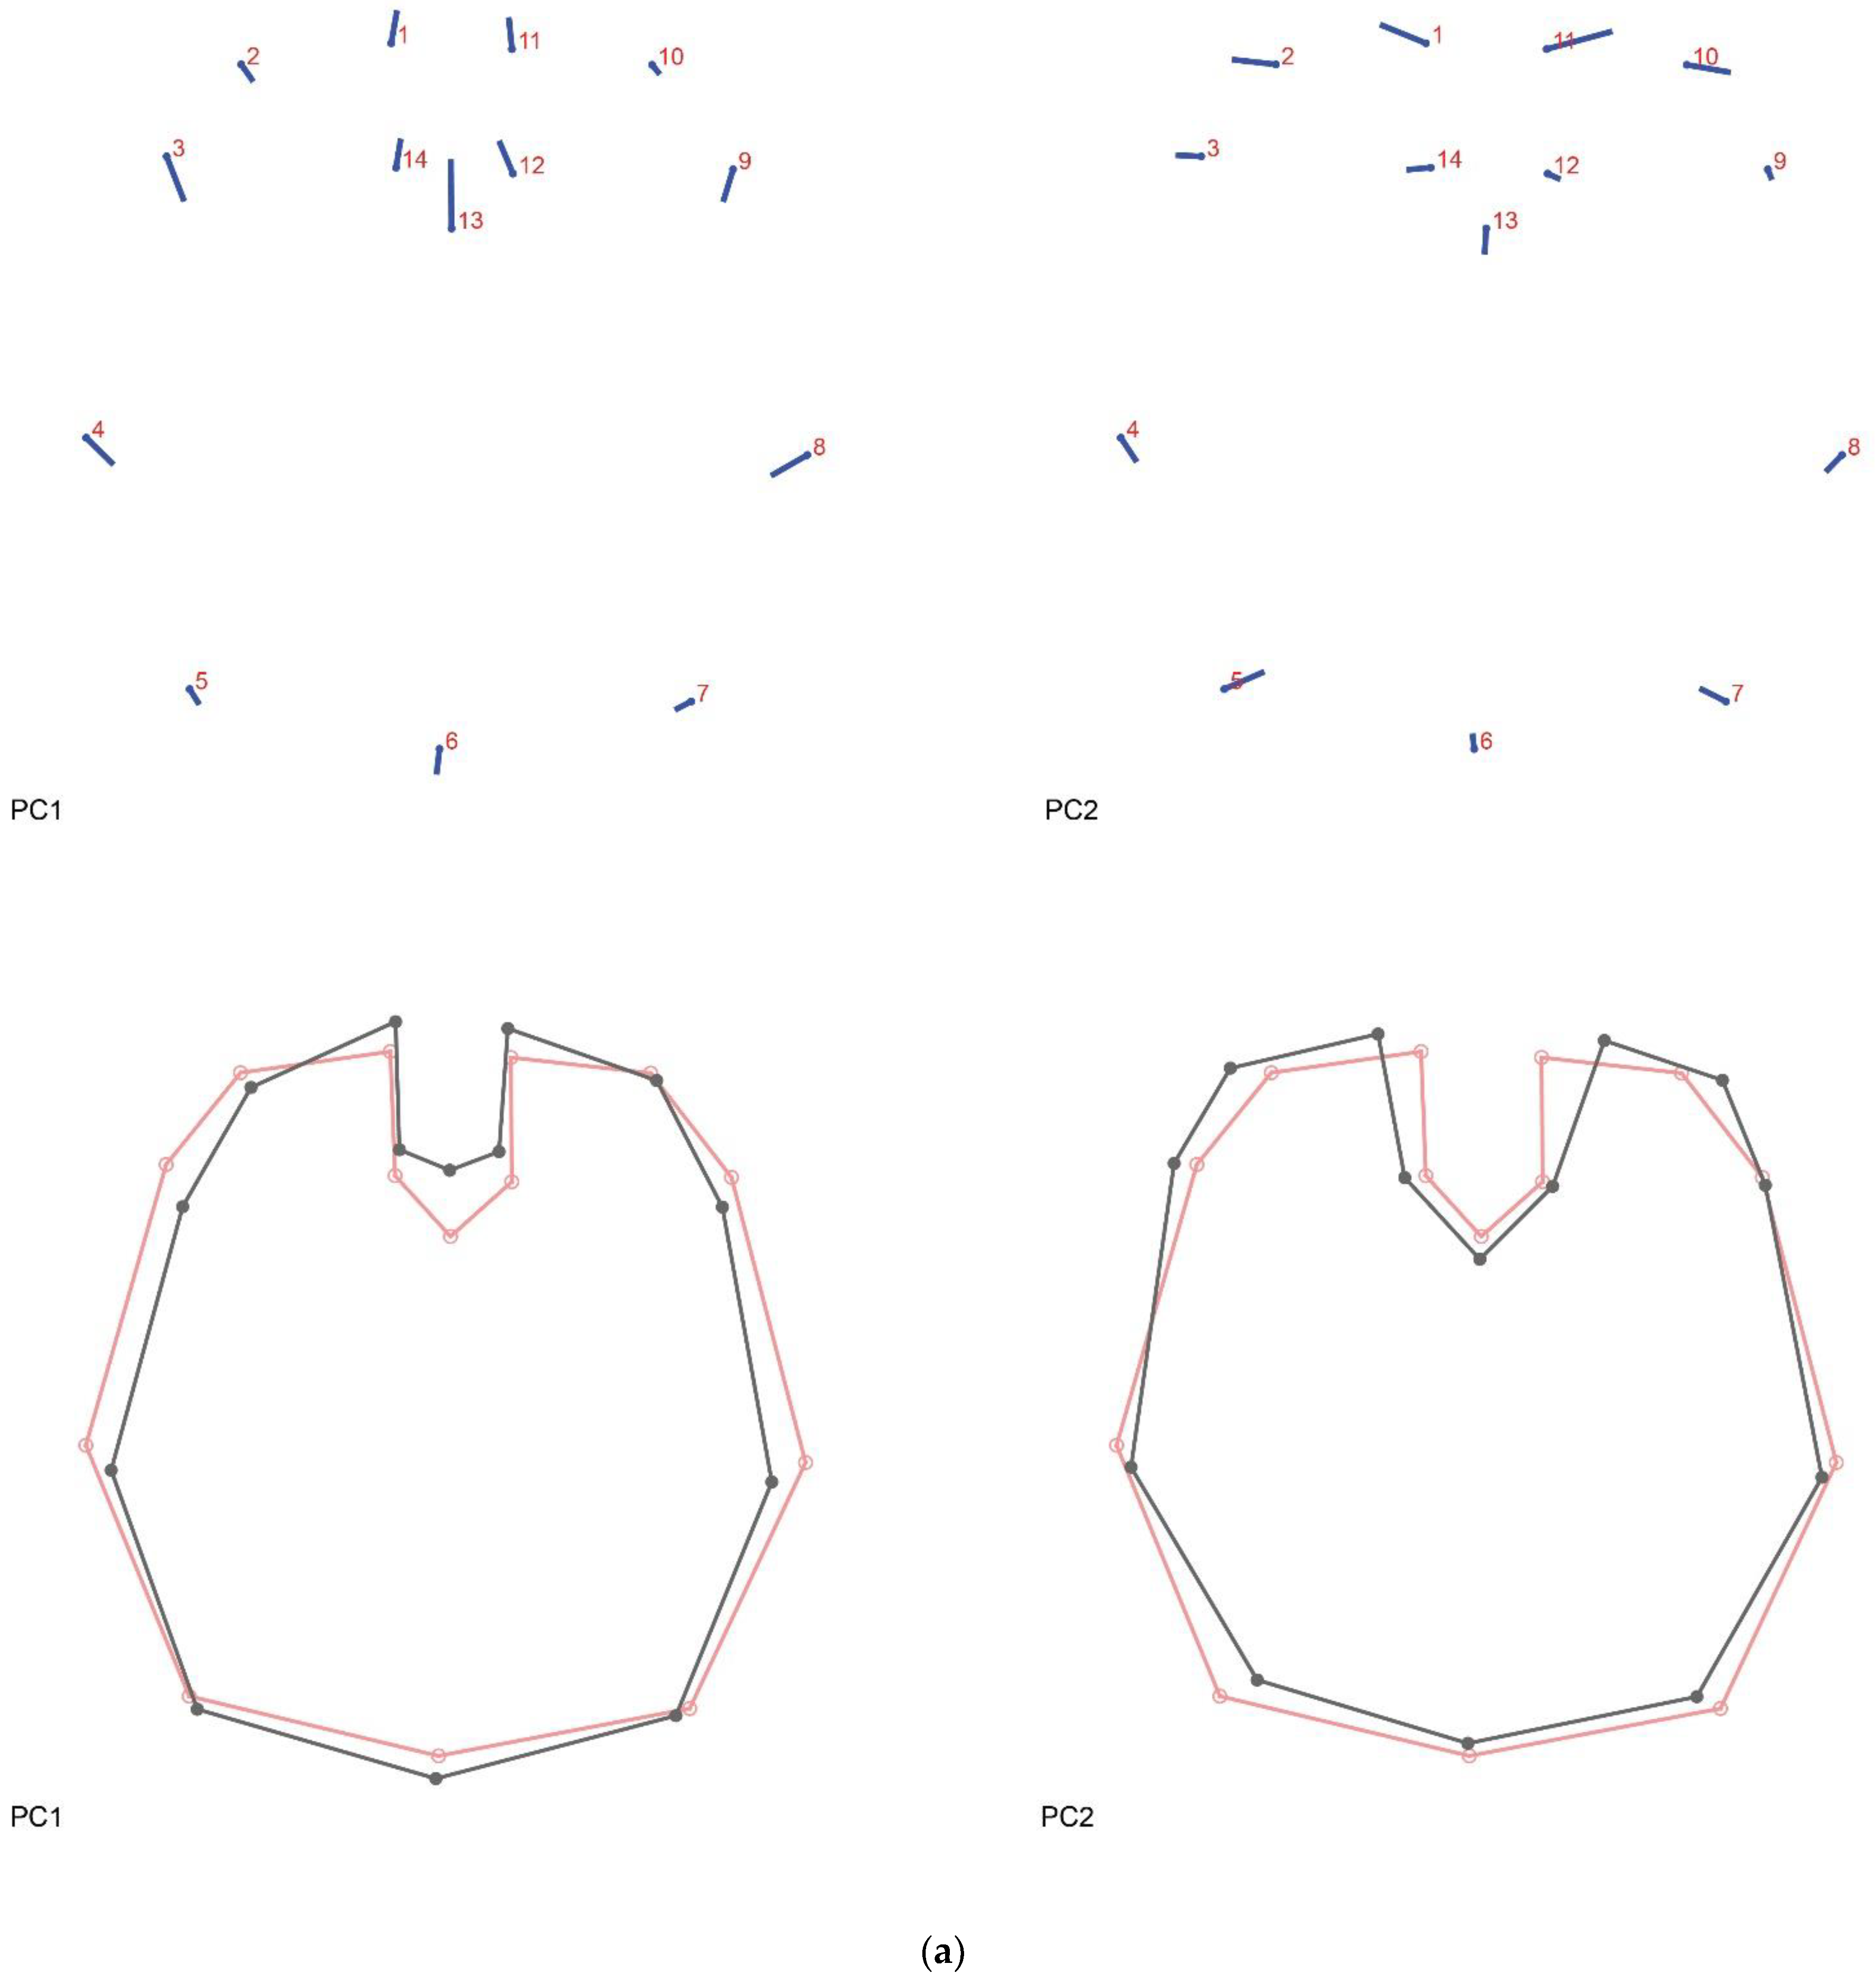
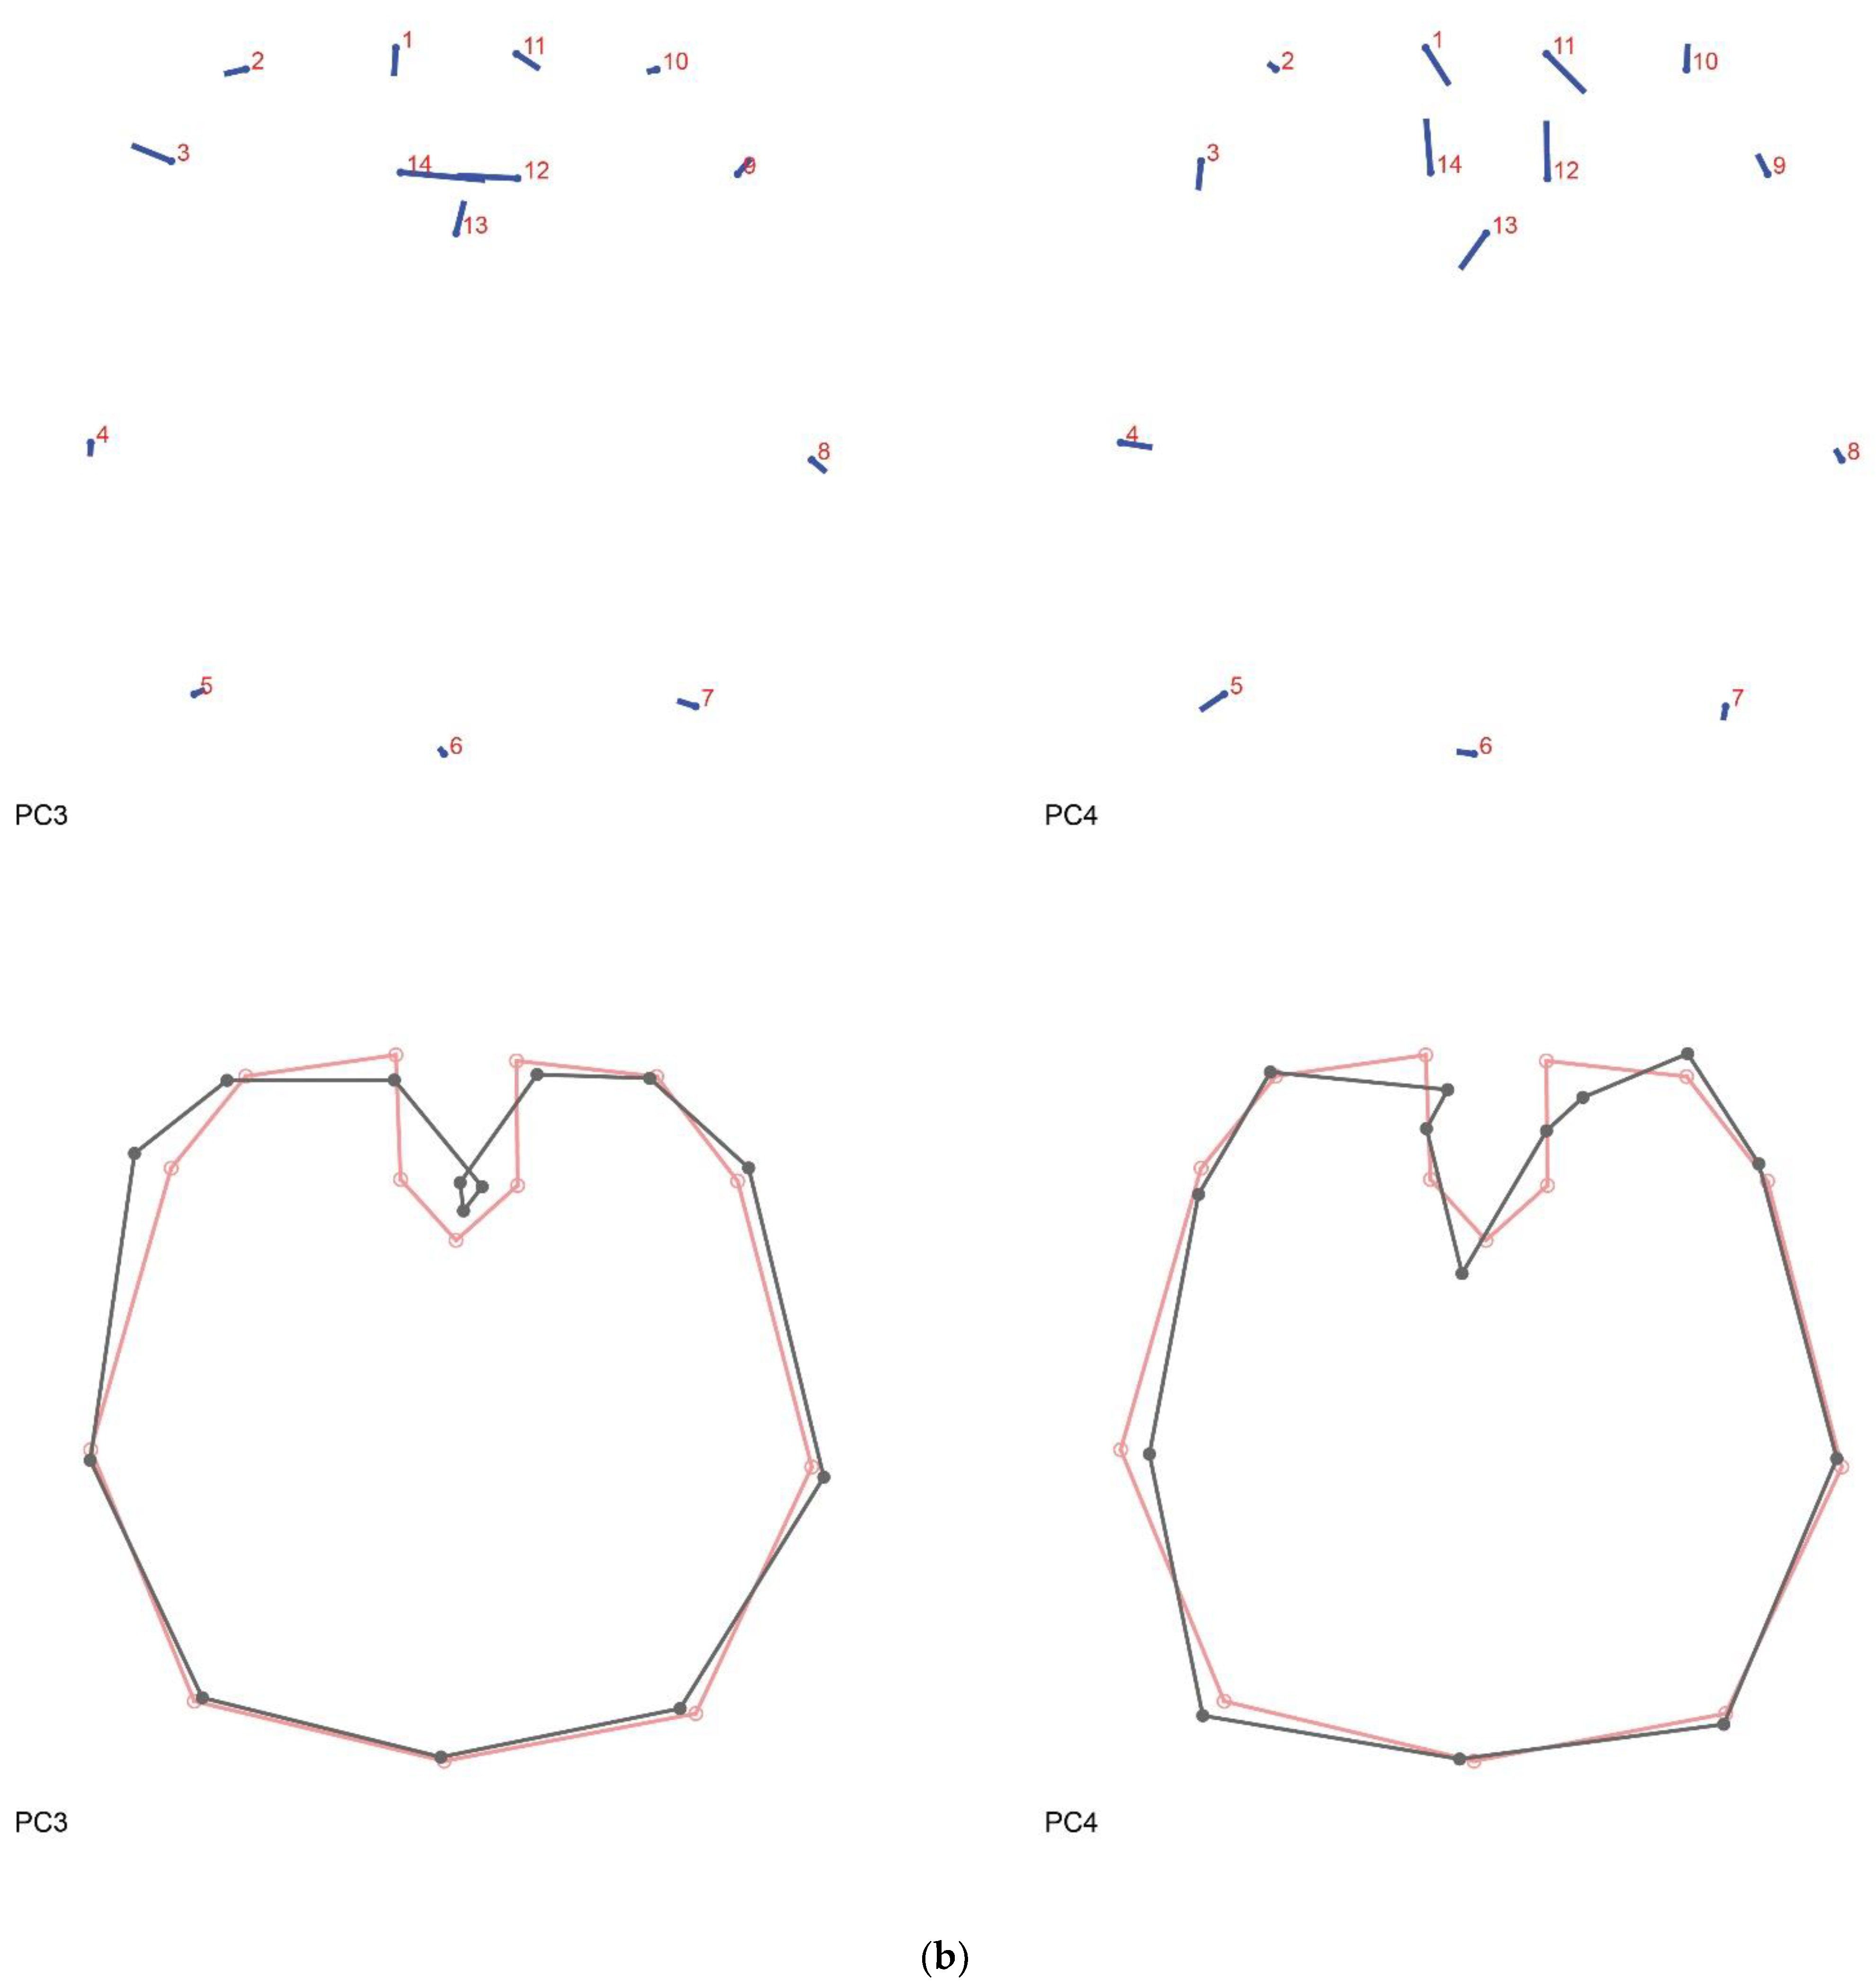
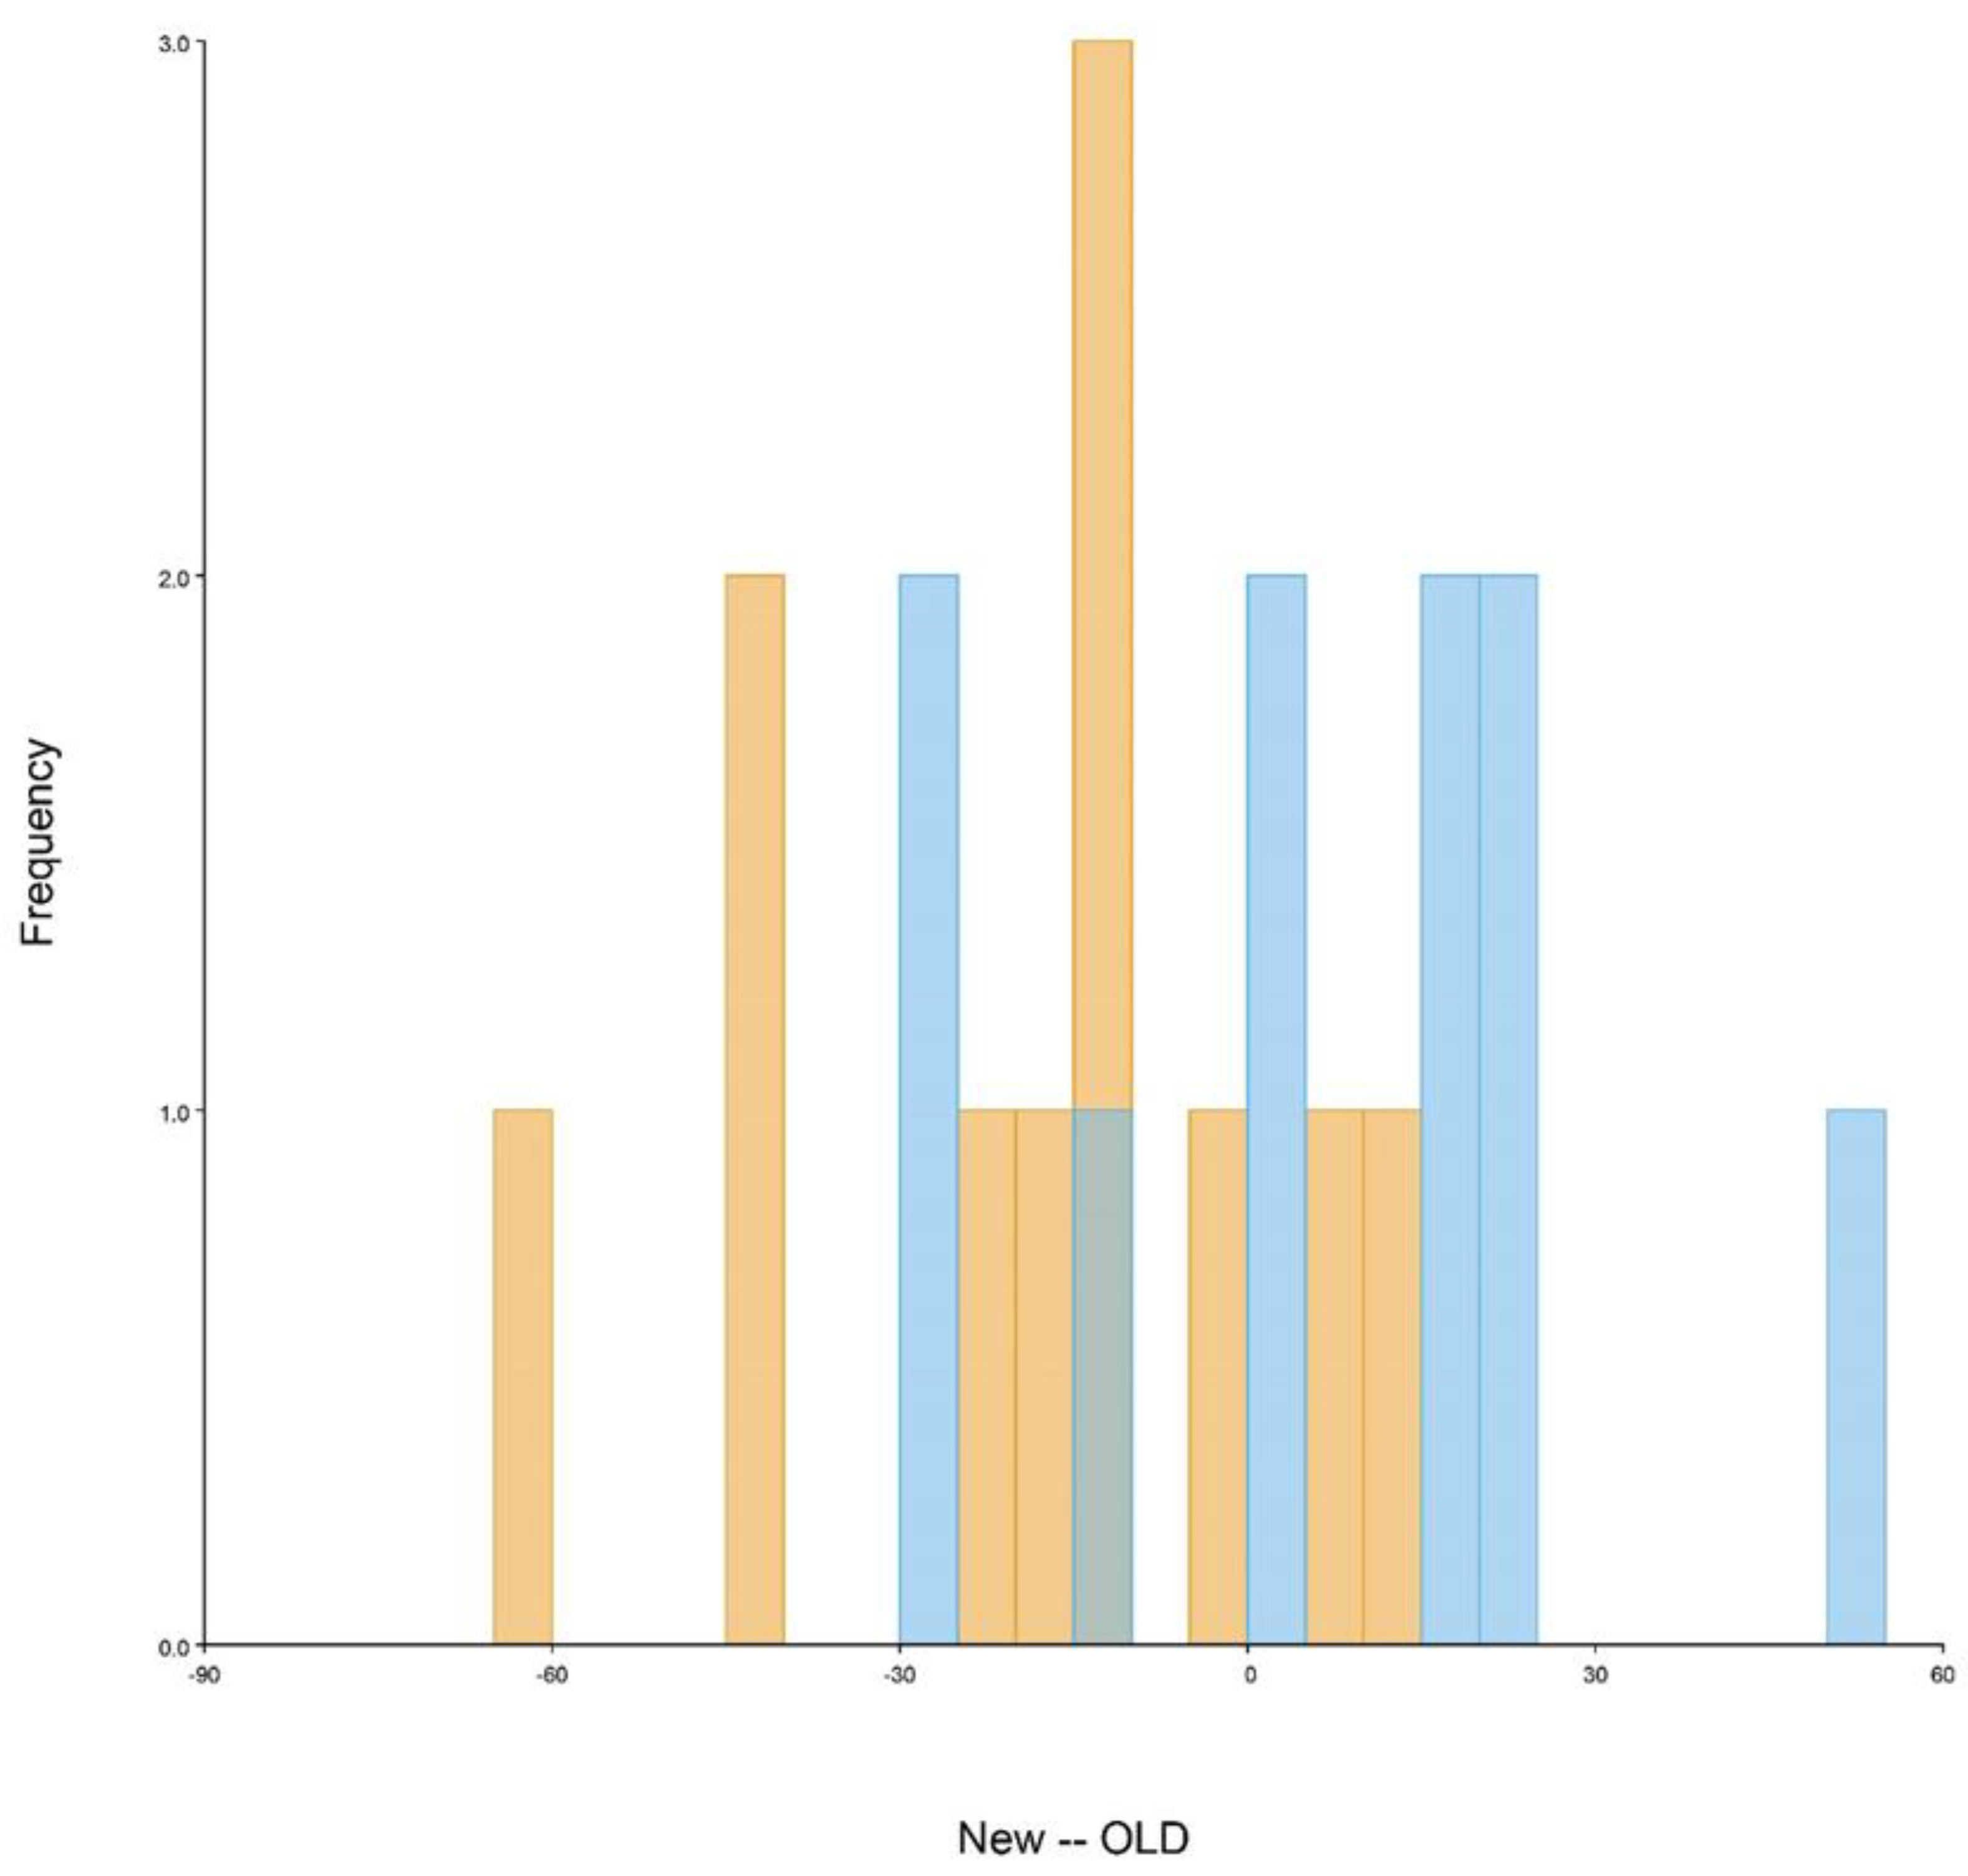
The PCA (Figure 2b) shows that the brain shapes of both groups largely overlap. PC1 is related to changes in the width of the brain, the length of its middle axis, and the length of the optic lobes. The shape variation accounted for by PC2 is principally related to the aperture and width of the optic lobes (see Figure 2c and Figure A2a). These first two PCs together explain almost 60% of the shape variation, having both a tendency towards a more regular and symmetric shape. PC3 and PC4, on the other hand, cover a more asymmetrical variation of the anterior half of the brain (see Figure A2b). PC3 shows a broader left optic lobe, with the two optic lobes being closer together in the center. Finally, PC4 indicates a skewedness of the optic lobes towards the right side, a deeper cleavage and therefore a shorter median axis of the brain and a slight enlargement on the posterior left side of the supraesophageal ganglion. The regression analysis shows an association between brain shape (procrustes coordinates) and brain width (Figure 2d) (p = 0.3633) that is not significantly different between the Old and New groups. Similarly, the discriminant analysis (Figure A3) (p = 0.7229) shows a clear overlap between both groups and suggests no significant difference between them.
3.3. Qualitative Assessment
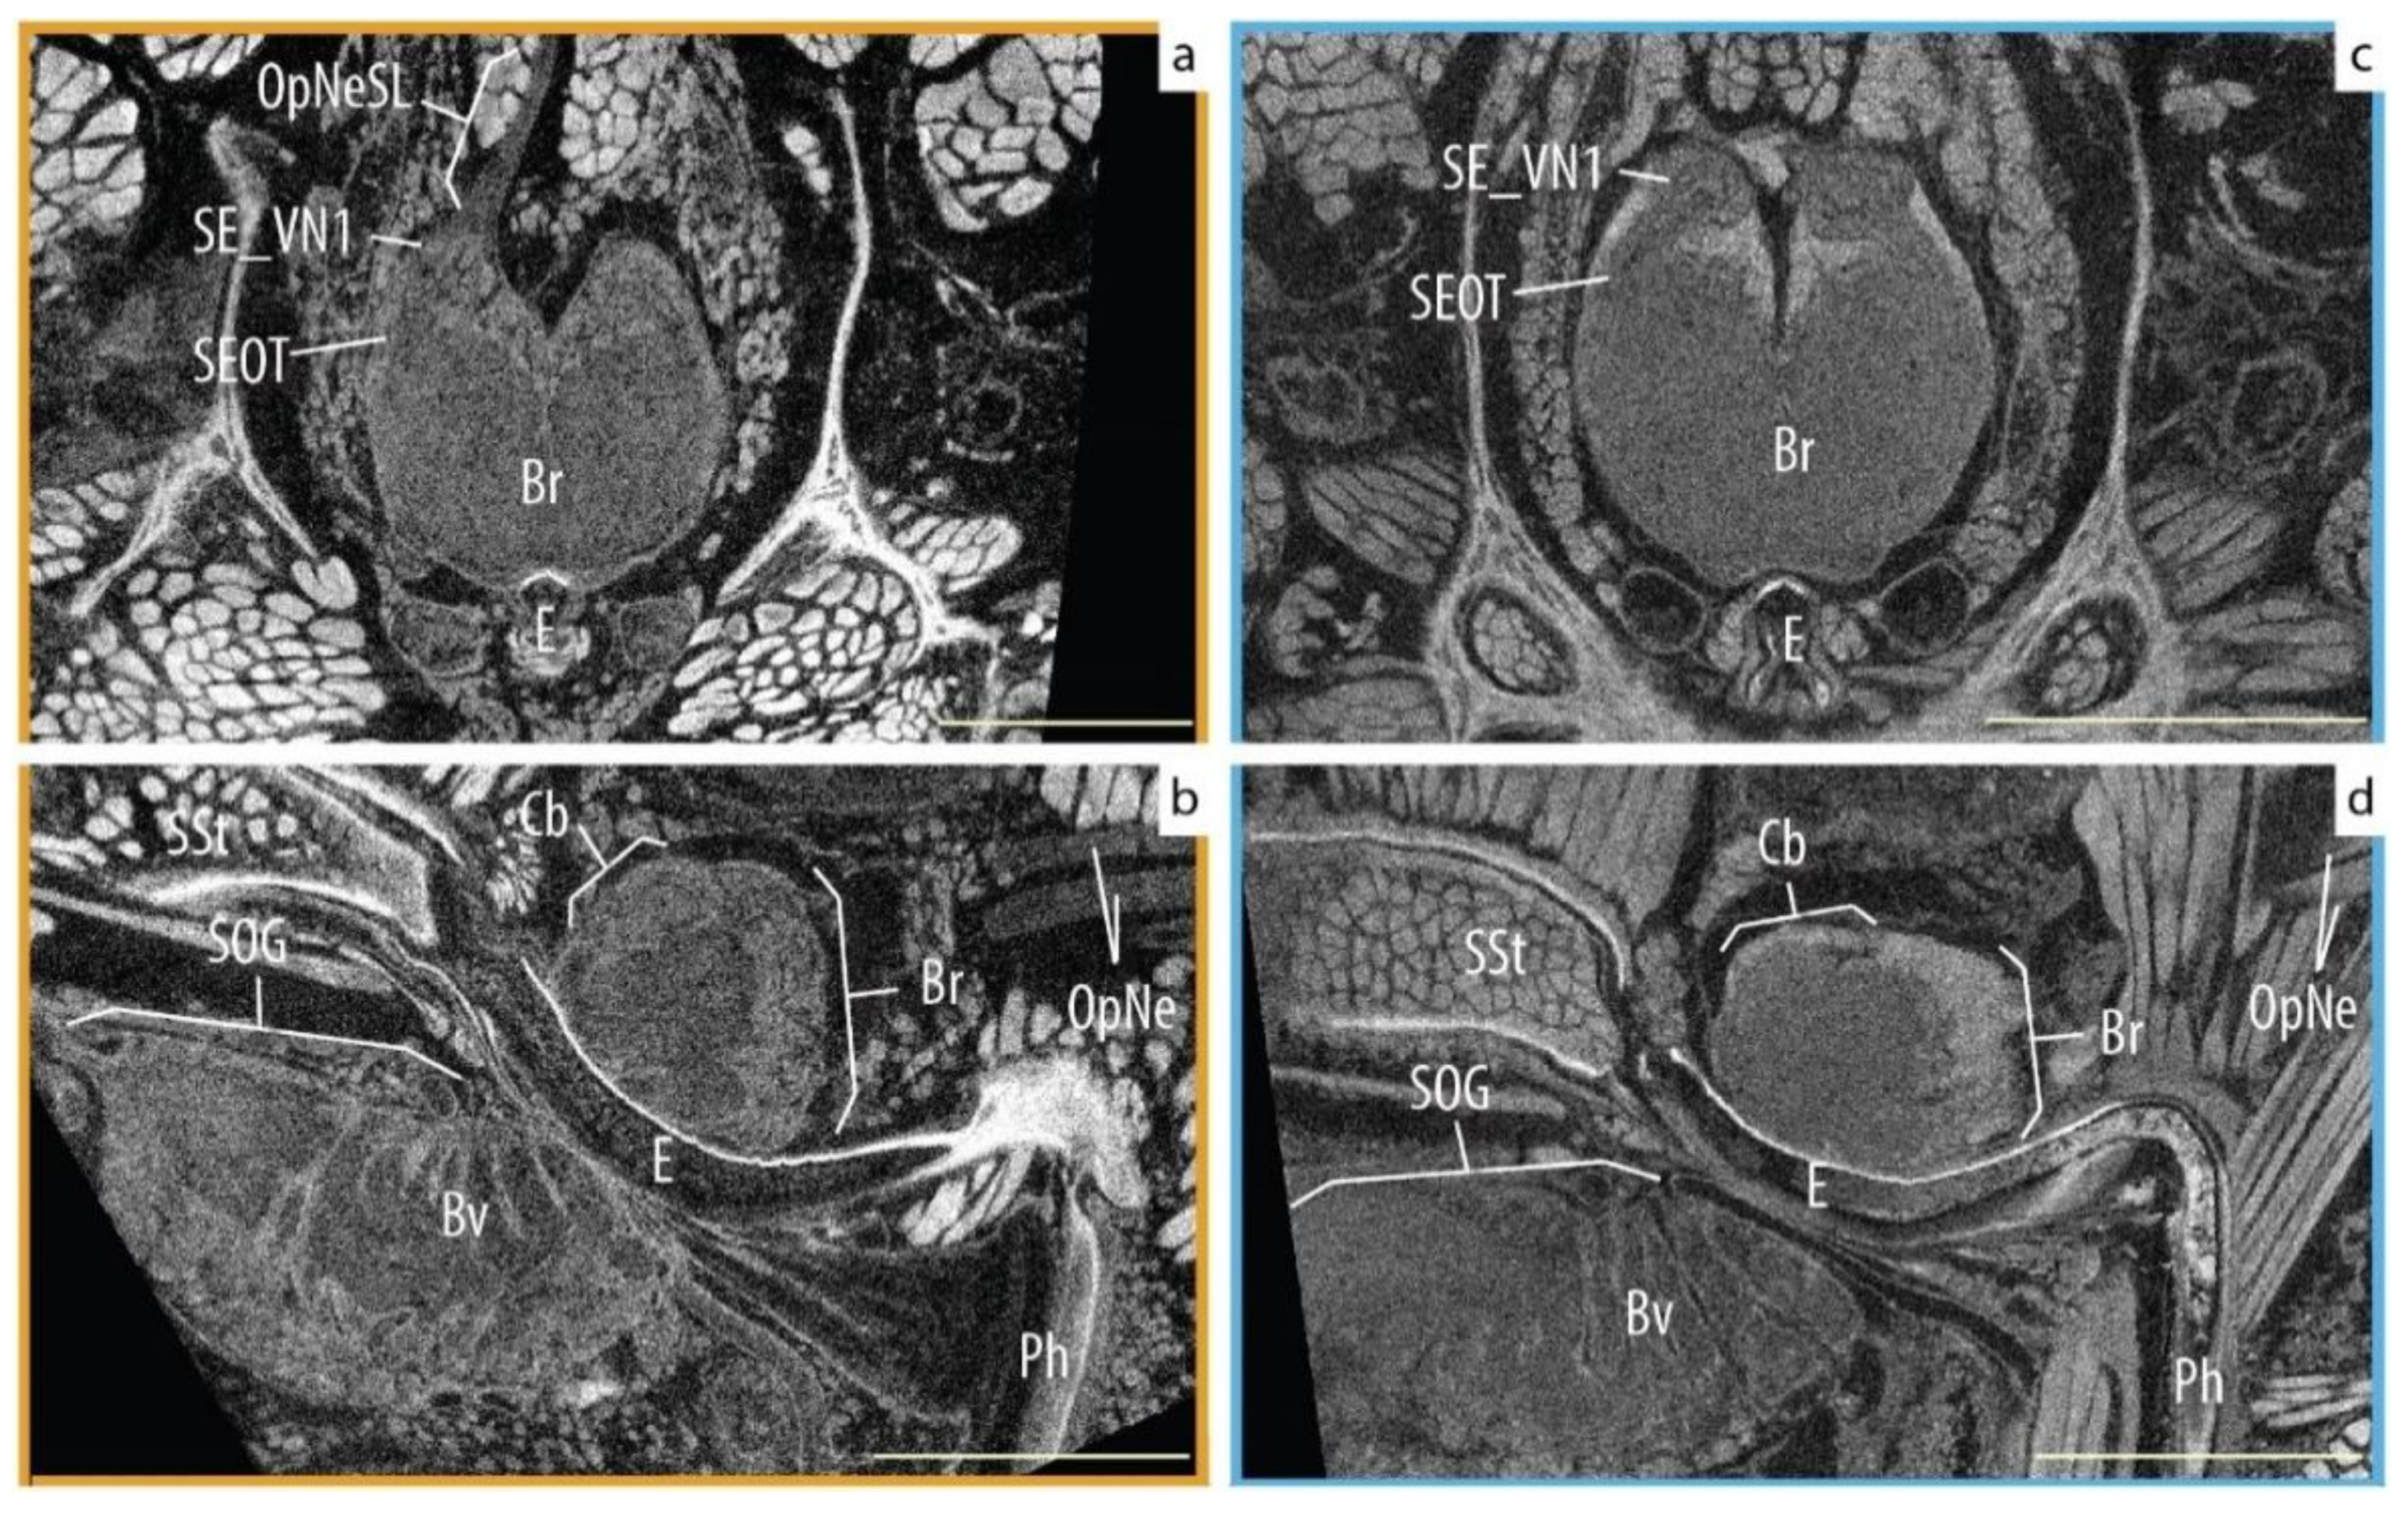
The internal anatomy and, most importantly, the central nervous system (CNS) architecture was recognizable and usable in both groups. We were able to visually identify the different parts of the visual systems (e.g., optic nerves, optic neuropiles and central body) and other parts of the CNS (e.g., ganglia, blood vessels) in most of our specimens, regardless of the time spent in preservation (Figure 3). Nevertheless, not all specimens were equally useful; two legacy specimens showed signs of tissue deterioration (probably caused by desiccation), and others had their synganglion displaced and deformed by the digestive diverticula (Figure 4). Still, in all of those cases, the supraesophageal ganglion could be identified, segmented, and compared from an axial view together with the rest of the samples.
4. Discussion
The brain and visual system in the order Araneae have been mostly studied only in a handful of species (e.g., Cupiennius salei [41,42,43]) with broad comparative anatomy studies being rare. Still, these few multi-taxon surveys [31,32,33] have shown spider neuroanatomy to be a potentially rich and interesting taxonomic character system. Internal anatomy is inherently difficult to study due to the necessity of performing invasive histological techniques and dissections in order to document it. Nevertheless, the last decade has seen a growing number of studies that rely on the utilization of X-ray micro-CT scanning for reconstructing and quantifying various internal organs and tissues in spiders [25,26,27,28,29,44,45,46]. Still, we consider that the conscientious use of legacy material can be an important route to fill the taxonomic sampling gaps and more easily and promptly understand the evolution of the spider central nervous system.
Our results show that this approach is feasible. Specimens preserved in 70% Et-OH for 70–90 years did not show signs of structural degradation in their internal anatomy, except in cases where proper storage had not been constantly maintained (see Figure 4). Furthermore, the tissue staining by PTA achieved identical results in fresh and archive material, allowing us to visually identify the main brain structures (Figure 3) without the need of critical point or HDMS drying. Thus, our investigation did not interrupt the consistent proper preservation of legacy specimens and provides a template for applying this method to a broader sample of legacy specimens. Our specimens, despite the individual variation seen in the synganglion’s 3D model reconstructions, did not show a significant difference in their brain morphology according to our geometric morphometric analyses (Figure 2, Figure A2 and Figure A3). Thus, we conclude that that long-stored specimens can be used to accurately examine spider neuroanatomy, opening the door to the use of collection material for studies of internal anatomy.
Nonetheless, the analysis of the cephalothorax size and brain volume did show a significant difference between both groups. We found an interesting pattern where archived specimens are consistently smaller than the fresh spiders. It was suggested to us that we consider whether this could be attributed to shrinking due to EtOH preservation, but this would require hard and soft parts to shrink proportionately, and also suggests that spider collections (or alcohol preserved specimens in general) might be shrinking over time, neither of which seems realistic. Therefore, we formulated three other non-mutually exclusive explanations to our observations: (1) Seasonal effects. Although we tried to minimize as many variables as possible, the Old material was sampled in a range of times and places within the Netherlands. These spiders were captured between 1929 and 1948, with most of them being captured between August and November, and two collected in April (although out of season, both specimens were adults). On the other hand, all the New spiders were collected in a single sampling event, from a single population in October (near the end of the mating season [47]). (2) Environmental variables. Our New group was consistently bigger than the legacy spiders, with the largest individuals from the Old group not even reaching the mean size of the fresh material. Therefore, we consider that access to food might had played an important role in the growth of the fresh specimens. The food level has been shown to have a strong positive impact on the body size development on the cellar spider Pholcus phalangioides, with females investing primarily in weight and size gain when food was abundant [48]. Likewise, the brain volume has shown be very plastic and at least partially dependent on the food supply during development of the jumping spider Marpissa muscosa [28]. (3) Urban Evolution. Differential adaptations of urban and rural populations have been documented for song patterns in birds [49,50], and colorations and morphologies in snails [51]. Therefore, changes in the body size over decades in response to changes in urban environments could be a viable explanation for our observations. The addition of natural history collections material can be an important resource for assessing the anthropogenic impact in urban-living species [52]. However, a bigger sampling effort from different populations and times, out of the scope of this study, would be required to test these hypotheses.
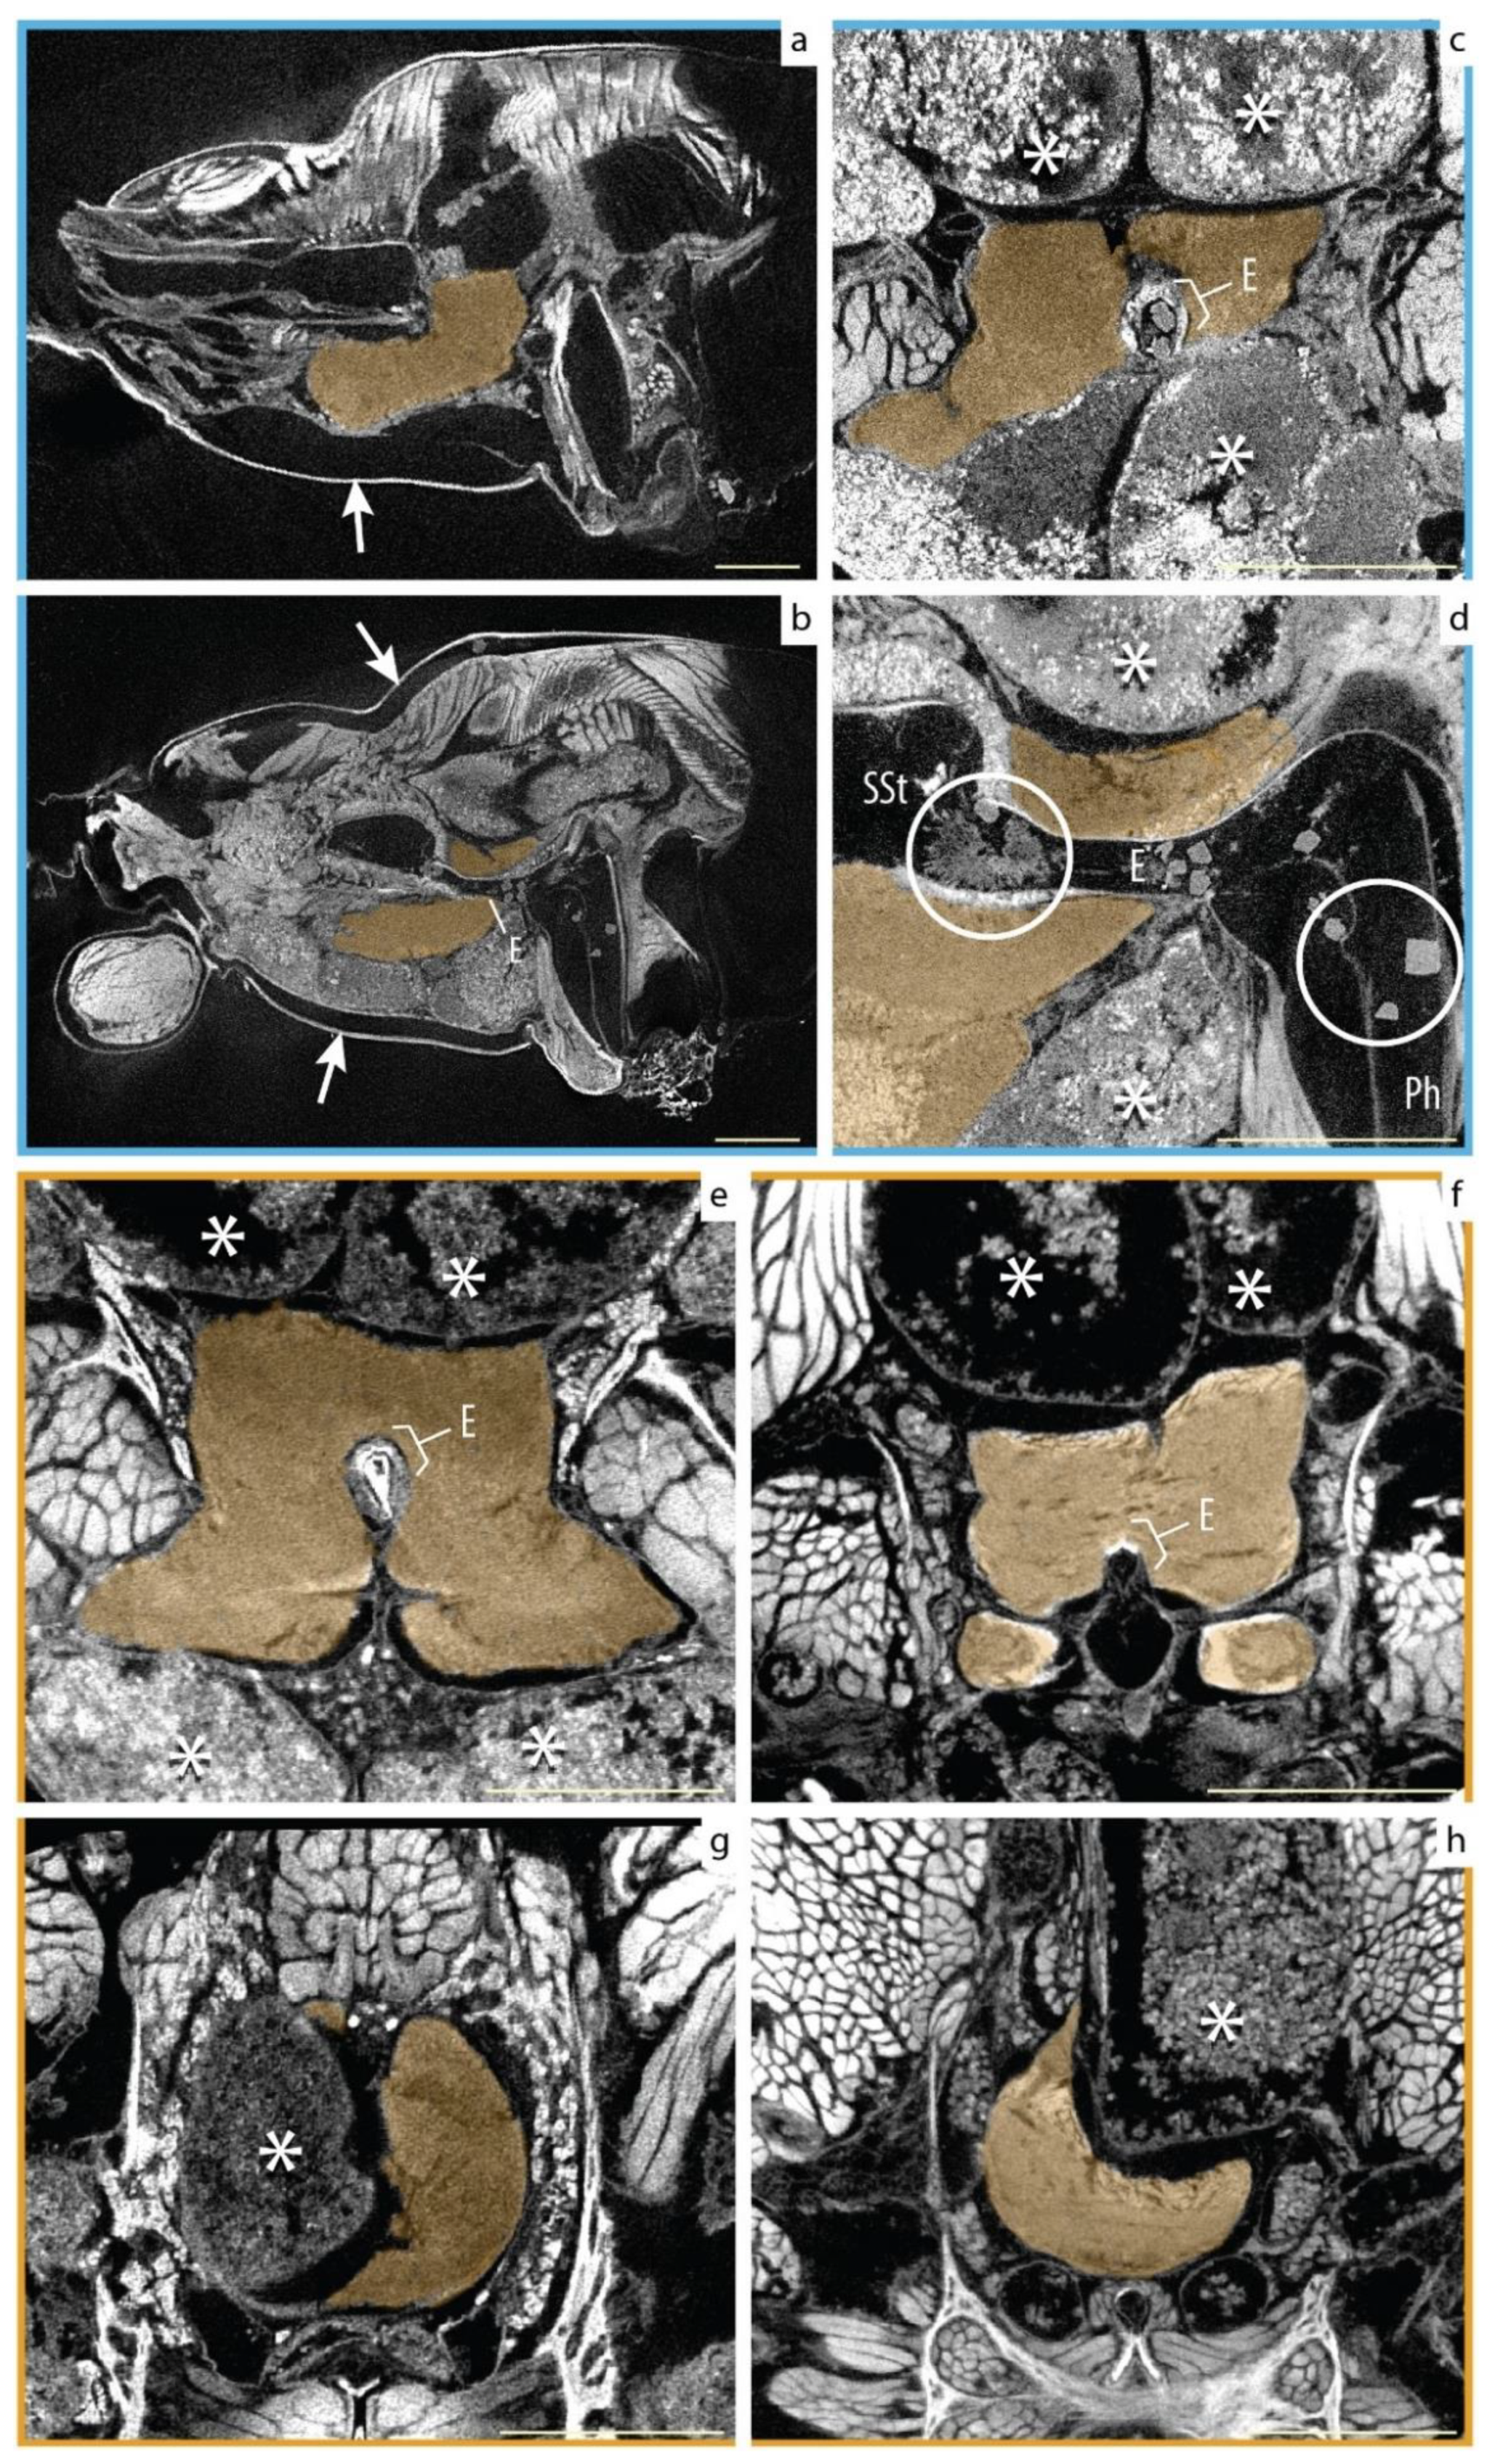
Finally, we did find some incidental factors that degraded the morphology of the brain and other internal organs (Figure 4). The most conspicuous was tissue shrinking induced by the accidental desiccation of two specimens. In both cases, the specimen’s condition was not visible externally but only became evident during the 3D data analysis. The aberrant morphologies were easy to identify and diagnose due to the evident shrinking in muscles and other organs, and the formation of crystals (Figure 4d) in the digestive tract. The other factor was a naturally occurring deformation of the supra- and subesophageal ganglia caused by the abnormal growth of the digestive diverticula (Figure 4c–h). This condition was observed in both groups. In all of those cases, the gross morphology of the supraesophageal ganglion could be identified, segmented, and compared together with the rest of the samples. By contrast, detailed assessment of the brain substructures in the dried samples was futile.
Broad comparative anatomy studies are necessary to elucidate the plasticity and evolution of the brain in a phylogenetic context. We hope that our results encourage the responsible use of legacy material to fill critical taxonomic gaps and illustrate the evolution of the CNS and other internal organs and systems whose comparative anatomy has so far largely remained a mystery.
Author Contributions
Conceptualization, F.A.R.-Q. and J.A.M.; formal analysis, F.A.R.-Q.; funding acquisition, F.A.R.-Q. and J.A.M.; investigation, F.A.R.-Q.; methodology, F.A.R.-Q.; supervision, J.A.M.; visualization, F.A.R.-Q.; writing—original draft, F.A.R.-Q.; writing—review and editing, J.A.M. All authors have read and agreed to the published version of the manuscript.
Funding
This research was funded by a Martin & Temminck Fellowship to FARQ from Naturalis Biodiversity Center.
Institutional Review Board Statement
Not applicable.
Data Availability Statement
The data presented in this study are available on request from the corresponding author. The data are not publicly available due to the size of the original scan files.
Acknowledgments
Thanks to Rob Langelaan and Dirk van der Marel for their valuable assistance obtaining micro-CT scans and for their suggestions on the protocol. Martin Rücklin facilitated the use of Avizo software. Davinia Arguedas helped find and collect the fresh Araneus diadematus specimens used in this study. Thanks to Vincent Merckx and the Naturalis Understanding Evolution research group for the support necessary to obtain the scans. Thanks to the two anonymous reviewers for their useful comments and suggestions. Thanks to Naturalis Biodiversity Center for providing support for FARQ through a Martin & Temminck Fellowship. Thanks to the reviewers and the editor for their constructive comments on the manuscript.
Conflicts of Interest
The authors declare no conflict of interest.
Appendix A
Supplementary figures providing additional details of the analyses presented.
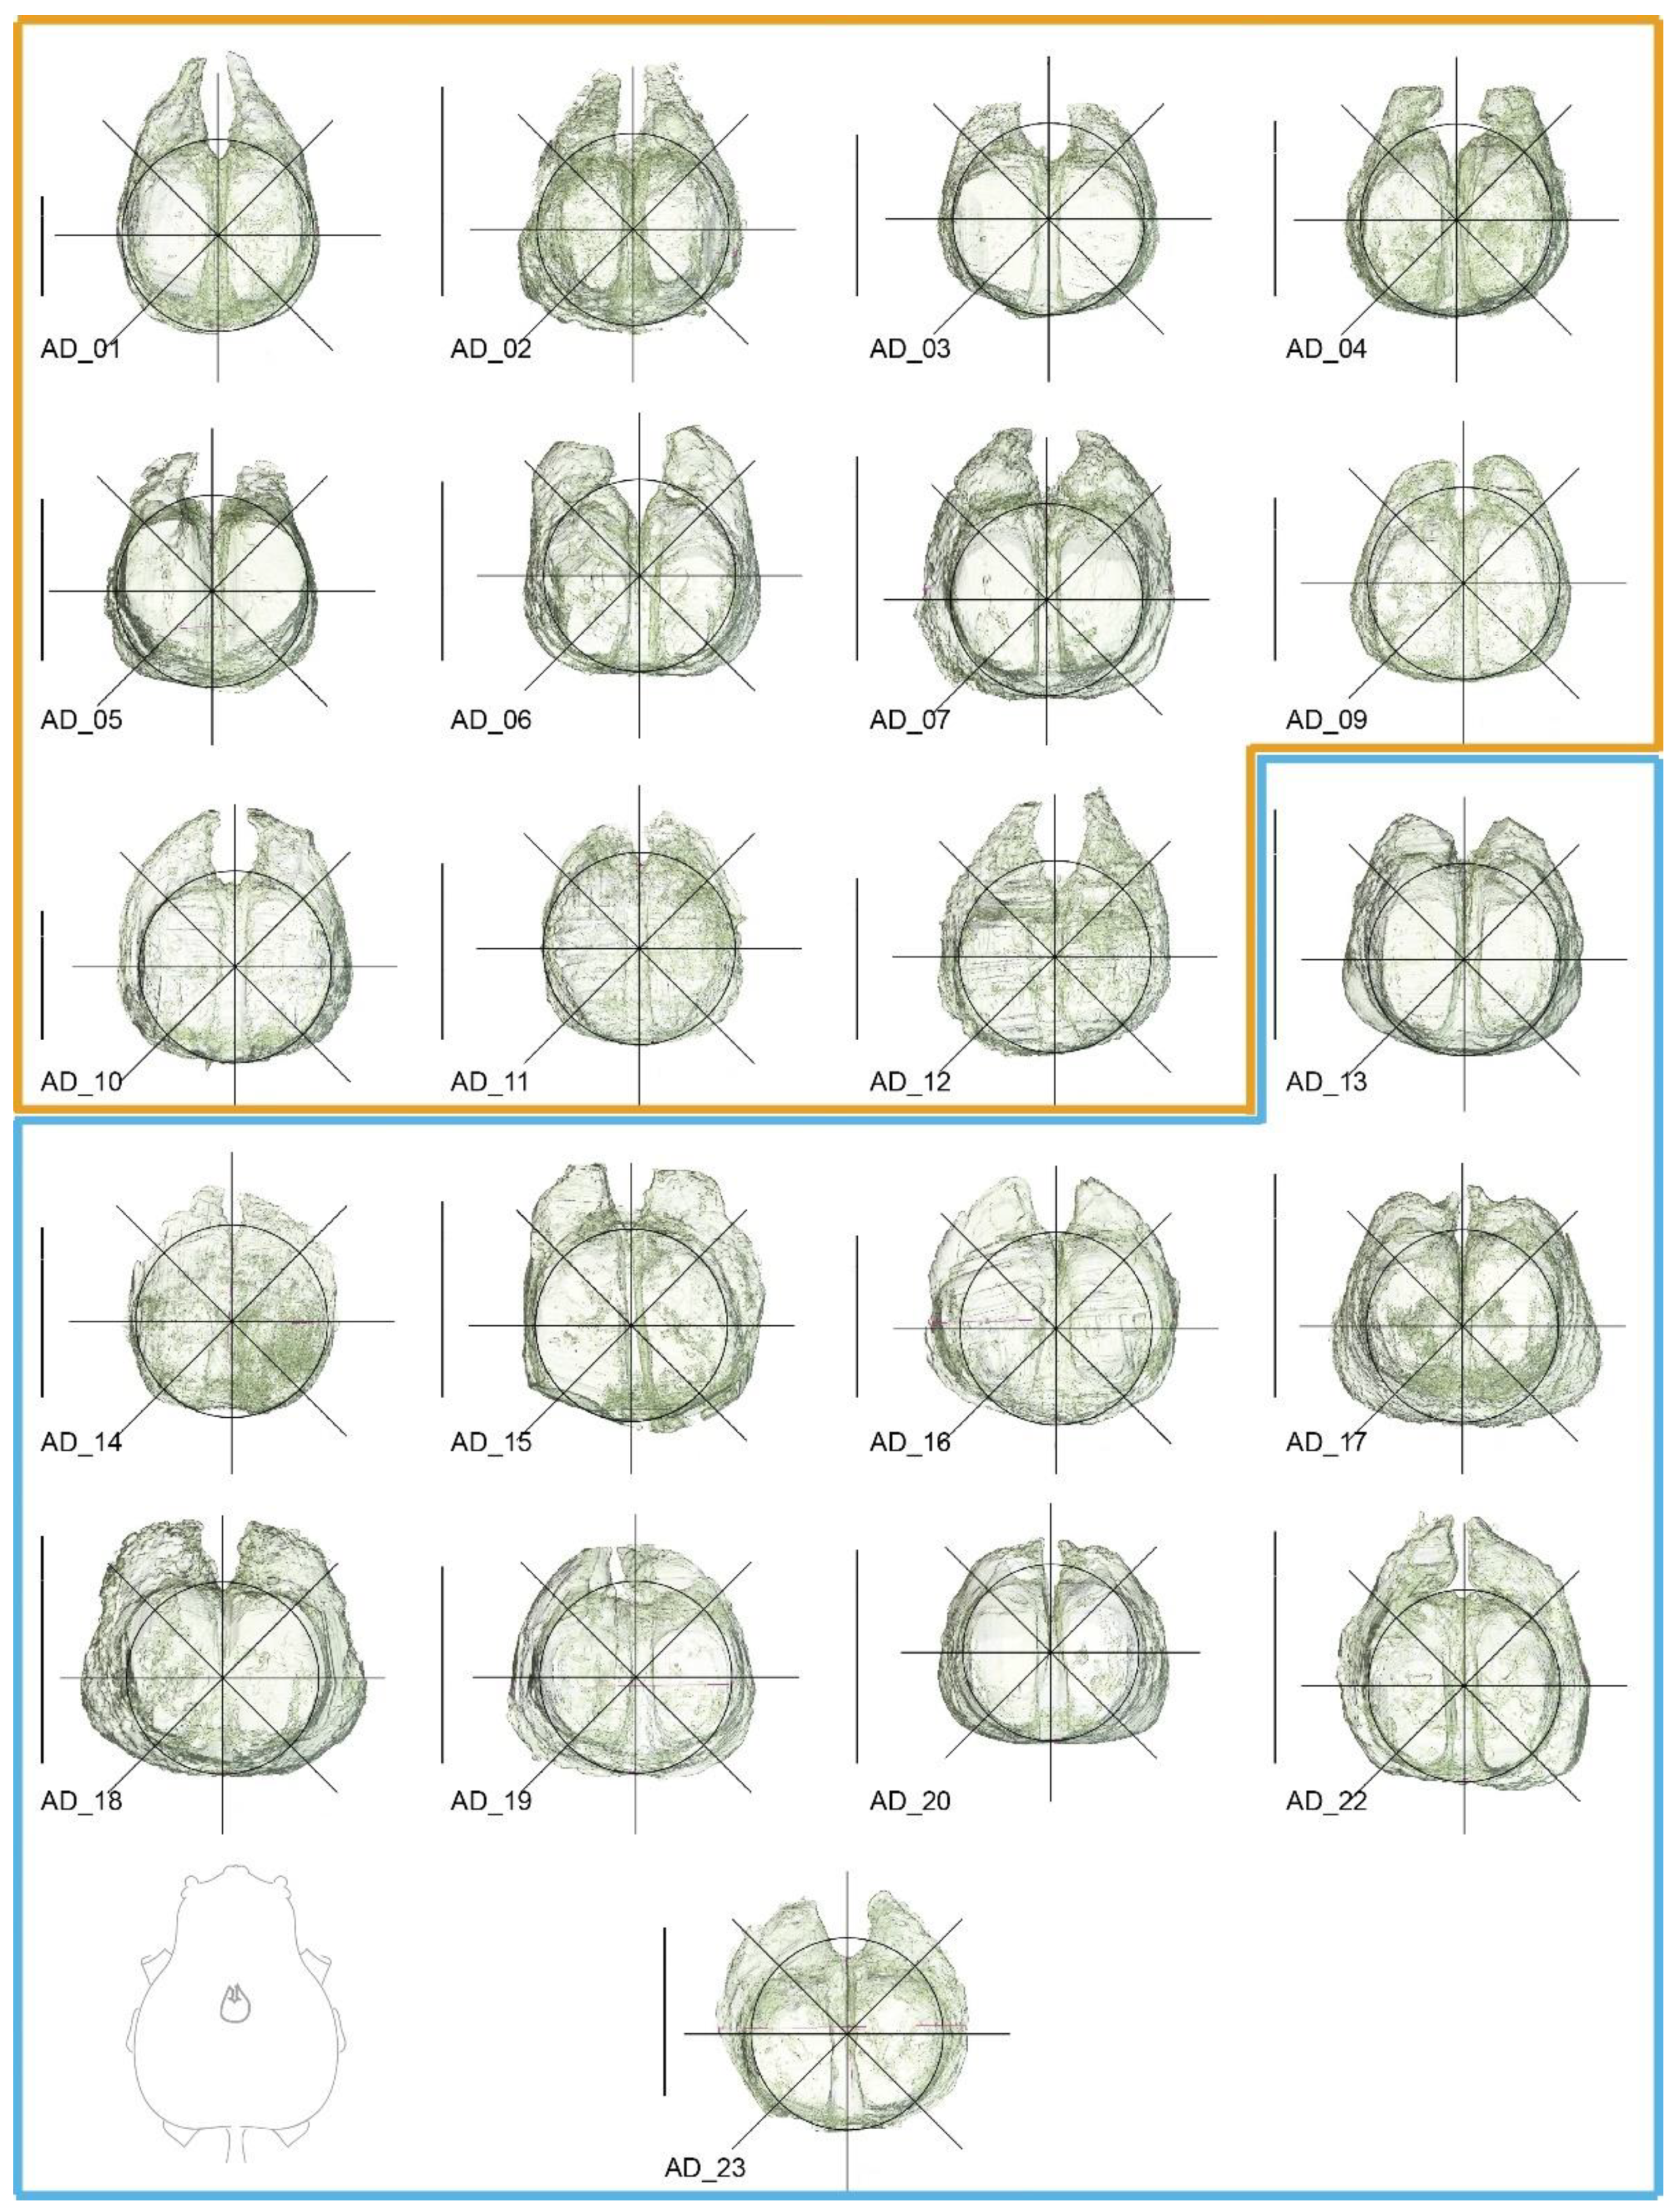
Figure A1.
Volume reconstructions of Araneus diadematus brains in dorsal view. Fresh material is marked in dark yellow and legacy material in blue. Landmarks were placed on the crossing of the lines and the edge of the reconstruction following the template in Figure 2. Line drawing in the lower left corner shows the brain in relation to the cephalothorax in dorsal view. Scale bars = 0.5 mm.

Figure A2.
Principal component analysis shape changes. (a) PC1 (31.709%) and PC2 (26.582%); (b) PC3 (9.610%) and PC4 (7.106%). Lollipop graphs indicate the direction and magnitude of change per landmark associated with each PC. Wireframes indicate the mean shape (red) and the shape variation (dark grey).


Figure A3.
Discriminant analysis of brain shape variation for the New and Old spider groups. Discriminant scores (frequencies) after a “leave-one-out” cross-validation are shown using histogram bars with the default 24 bins. Overlap between both groups of specimens and p = 0.7229 suggest no significant shape difference between the groups. Fresh material (New) is marked in dark yellow and legacy material (Old) in blue.

References
- Meineke, E.K.; Davies, T.J.; Daru, B.H.; Davis, C.C. Biological collections for understanding biodiversity in the Anthropocene. Philos. Trans. R. Soc. B Biol. Sci. 2019, 374, 20170386. [Google Scholar] [CrossRef] [Green Version]
- Derkarabetian, S.; Benavides, L.R.; Giribet, G. Sequence capture phylogenomics of historical ethanol-preserved museum specimens: Unlocking the rest of the vault. Mol. Ecol. Resour. 2019, 19, 1531–1544. [Google Scholar] [CrossRef] [PubMed]
- Fernández, R.; Kvist, S.; Lenihan, J.; Giribet, G.; Ziegler, A. Sine systemate chaos? A versatile tool for earthworm taxonomy: Non-destructive imaging of freshly fixed and museum specimens using micro-computed tomography. PLoS ONE 2014, 9, e96617. [Google Scholar] [CrossRef] [PubMed]
- Beaman, R.S.; Cellinese, N. Mass digitization of scientific collections: New opportunities to transform the use of biological specimens and underwrite biodiversity science. Zookeys 2012, 209, 7–17. [Google Scholar] [CrossRef] [PubMed]
- Nelson, G.; Ellis, S. The history and impact of digitization and digital data mobilization on biodiversity research. Philos. Trans. R. Soc. B Biol. Sci. 2019, 374, 20170391. [Google Scholar] [CrossRef] [Green Version]
- Short, A.E.Z.; Dikow, T.; Moreau, C.S. Entomological Collections in the Age of Big Data. Annu. Rev. Entomol. 2018, 63, 513–530. [Google Scholar] [CrossRef]
- Hofreiter, M. Nondestructive DNA extraction from museum specimens. In Ancient DNA: Methods and Protocols, Methods in Molecular Biology; Shapiro, B., Hofreiter, M., Eds.; Humana Press: New York, NY, USA, 2012; Volume 840, pp. 93–100. [Google Scholar] [CrossRef]
- Gilbert, M.T.P.; Moore, W.; Melchior, L.; Worebey, M. DNA extraction from dry museum beetles without conferring external morphological damage. PLoS ONE 2007, 2, e272. [Google Scholar] [CrossRef] [Green Version]
- Castalanelli, M.A.; Severtson, D.L.; Brumley, C.J.; Szito, A.; Foottit, R.G.; Grimm, M.; Munyard, K.; Groth, D.M. A rapid non-destructive DNA extraction method for insects and other arthropods. J. Asia-Pac. Entomol. 2010, 13, 243–248. [Google Scholar] [CrossRef] [Green Version]
- Miller, J.A.; Beentjes, K.K.; van Helsdingen, P.; Ijland, S. Which specimens from a museum collection will yield DNA barcodes? A time series study of spiders in alcohol. Zookeys 2013, 365, 245–261. [Google Scholar] [CrossRef] [Green Version]
- Vink, C.J.; Thomas, S.M.; Paquin, P.; Hayashi, C.Y.; Hedin, M. The effects of preservatives and temperatures on arachnid DNA. Invertebr. Syst. 2005, 19, 99–104. [Google Scholar] [CrossRef]
- Marquina, D.; Buczek, M.; Ronquist, F.; Lukasik, P. The effect of ethanol concentration on the morphological and molecular preservation of insects for biodiversity studies. PeerJ 2021, 9, e10799. [Google Scholar] [CrossRef] [PubMed]
- King, J.R.; Porter, S.D. Recommendations on the use of alcohols for preservation of ant specimens (Hymenoptera, Formicidae). Insectes Soc. 2004, 51, 197–202. [Google Scholar] [CrossRef]
- Sombke, A.; Lipke, E.; Michalik, P.; Uhl, G.; Harzsch, S. Potential and limitations of X-ray micro-computed tomography in arthropod neuroanatomy: A methodological and comparative survey. J. Comp. Neurol. 2015, 523, 1281–1295. [Google Scholar] [CrossRef] [PubMed] [Green Version]
- Weisbecker, V. Distortion in formalin-fixed brains: Using geometric morphometrics to quantify the worst-case scenario in mice. Brain Struct. Funct. 2012, 217, 677–685. [Google Scholar] [CrossRef]
- Ziegler, A.; Menze, B.H. Accelerated acquisition, visualization, and analysis of zoo-anatomical data. In Computation for Humanity; Zander, J., Mosterman, J., Eds.; CRC Press: Boca Raton, FL, USA, 2013; pp. 233–261. [Google Scholar]
- Keklikoglou, K.; Faulwetter, S.; Chatzinikolaou, E.; Wils, P.; Brecko, J.; Kvaček, J.; Metscher, B.; Arvanitidis, C. Micro-computed tomography for natural history specimens: A handbook of best practice protocols. Eur. J. Taxon. 2019, 522, 1–55. [Google Scholar] [CrossRef]
- Faulwetter, S.; Dailianis, T.; Vasileiadou, A.; Arvanitidis, C. Investigation of contrast enhancing techniques for the application of Micro-CT in marine biodiversity studies. Microsc.Anal. 2013, 27, S4–S7. [Google Scholar]
- Sakurai, Y.; Ikeda, Y. Development of a contrast-enhanced micro computed tomography protocol for the oval squid (Sepioteuthis lessoniana) brain. Microsc. Res. Tech. 2019, 82, 1941–1952. [Google Scholar] [CrossRef]
- Swart, P.; Wicklein, M.; Sykes, D.; Ahmed, F.; Krapp, H.G. A quantitative comparison of micro-CT preparations in Dipteran flies. Sci. Rep. 2016, 6, 39380. [Google Scholar] [CrossRef] [Green Version]
- Alba-Tercedor, J.; Hunter, W.B.; Alba-Alejandre, I. Using micro-computed tomography to reveal the anatomy of adult Diaphorina citri Kuwayama (Insecta: Hemiptera, Liviidae) and how it pierces and feeds within a citrus leaf. Sci. Rep. 2021, 11, 1358. [Google Scholar] [CrossRef]
- Alba-Alejandre, I.; Hunter, W.B.; Alba-Tercedor, J. Micro-CT study of male genitalia and reproductive system of the Asian citrus psyllid, Diaphorina citri Kuwayama, 1908 (Insecta: Hemiptera, Liviidae). PLoS ONE 2018, 13, e0202234. [Google Scholar] [CrossRef]
- Castejón, D.; Alba-Tercedor, J.; Rotllant, G.; Ribes, E.; Durfort, M.; Guerao, G. Micro-computed tomography and histology to explore internal morphology in decapod larvae. Sci. Rep. 2018, 8, 14399. [Google Scholar] [CrossRef] [PubMed]
- van de Kamp, T.; Schwermann, A.H.; dos Santos Rolo, T.; Lösel, P.D.; Engler, T.; Etter, W.; Faragó, T.; Göttlicher, J.; Heuveline, V.; Kopmann, A.; et al. Parasitoid biology preserved in mineralized fossils. Nat. Commun. 2018, 9, 3325. [Google Scholar] [CrossRef] [PubMed]
- Rivera-Quiroz, F.A.; Miller, J.A. Micro-CT visualization of the CNS: Performance of different contrast-enhancing techniques for documenting the spider brain. J. Comp. Neurol. 2021. under review. [Google Scholar]
- Steinhoff, P.O.M.; Sombke, A.; Liedtke, J.; Schneider, J.M.; Harzsch, S.; Uhl, G. The synganglion of the jumping spider Marpissa muscosa (Arachnida: Salticidae): Insights from histology, immunohistochemistry and microCT analysis. Arthropod Struct. Dev. 2017, 46, 156–170. [Google Scholar] [CrossRef]
- Stafstrom, J.A.; Michalik, P.; Hebets, E.A. Sensory system plasticity in a visually specialized, nocturnal spider. Sci. Rep. 2017, 7, 46627. [Google Scholar] [CrossRef]
- Steinhoff, P.O.M.; Liedtke, J.; Sombke, A.; Schneider, J.M.; Uhl, G. Early environmental conditions affect the volume of higher-order brain centers in a jumping spider. J. Zool. 2018, 304, 182–192. [Google Scholar] [CrossRef] [Green Version]
- Steinhoff, P.O.M.; Uhl, G.; Harzsch, S.; Sombke, A. Visual pathways in the brain of the jumping spider Marpissa muscosa. J. Comp. Neurol. 2020, 528, 1883–1902. [Google Scholar] [CrossRef] [Green Version]
- Lin, S.-W.; Lopardo, L.; Uhl, G. Diversification through sexual selection on gustatorial courtship traits in dwarf spiders. bioRxiv 2021. [Google Scholar] [CrossRef]
- Saint-Remy, G. Contribution a L’étude du Cerveau Chez les Arthropodes Trachéates; Faculté des Sciences de Paris: Paris, France, 1890. [Google Scholar]
- Long, S.M. Spider Brain Morphology & Behavior; University of Massachusetts: Amherst, MA, USA, 2016. [Google Scholar]
- Long, S.M. Variations on a theme: Morphological variation in the secondary eye visual pathway across the order of Araneae. J. Comp. Neurol. 2021, 529, 259–280. [Google Scholar] [CrossRef]
- Hill, D.E. The Structure of the Central Nervous System of Jumping Spiders of the Genus Phidippus (Araneae: Salticidae). Master’s Thesis, Oregon State University, Corvallis, OR, USA, 2006. [Google Scholar]
- Wickham, H. ggplot2 Elegant Graphics for Data Analysis, 2nd ed.; Springer International Publishing: Cham, Switzerland, 2016. [Google Scholar] [CrossRef]
- Wickham, H.; François, R.; Henry, L.; Müller, K. dplyr: A Grammar of Data Manipulation. 2021. Available online: https://cran.r-project.org/package=dplyr (accessed on 27 September 2021).
- Rohlf, F.J. tpsUtil, v1.81; Department of Anthropology, and Ecology & Evolution, Stony Brook University: New York, NY, USA, 2021. [Google Scholar]
- Rohlf, F.J. tpsDig2, v2.32; Department of Anthropology, and Ecology & Evolution, Stony Brook University: New York, NY, USA, 2021. [Google Scholar]
- Klingenberg, C.P. MorphoJ: An integrated software package for geometric morphometrics. Mol. Ecol. Resour. 2011, 11, 353–357. [Google Scholar] [CrossRef]
- Theska, T.; Sieriebriennikov, B.; Wighard, S.S.; Werner, M.S.; Sommer, R.J. Geometric morphometrics of microscopic animals as exemplified by model nematodes. Nat. Protoc. 2020, 15, 2611–2644. [Google Scholar] [CrossRef]
- Loesel, R.; Seyfarth, E.A.; Bräunig, P.; Agricola, H.J. Neuroarchitecture of the arcuate body in the brain of the spider Cupiennius salei (Araneae, Chelicerata) revealed by allatostatin-, proctolin-, and CCAP-immunocytochemistry and its evolutionary implications. Arthropod Struct. Dev. 2011, 40, 210–220. [Google Scholar] [CrossRef]
- Babu, K.S.; Barth, F.G. Neuroanatomy of the central nervous system of the wandering spider, Cupiennius salei (Arachnida, Araneida). Zoomorphology 1984, 104, 344–359. [Google Scholar] [CrossRef]
- Schmid, A.; Becherer, C. Distribution of histamine in the CNS of different spiders. Microsc. Res. Tech. 1999, 44, 81–93. [Google Scholar] [CrossRef]
- Lipke, E.; Hammel, J.U.; Michalik, P. First evidence of neurons in the male copulatory organ of a spider (Arachnida, Araneae). Biol. Lett. 2015, 11, 20150465. [Google Scholar] [CrossRef] [PubMed]
- Dederichs, T.M.; Müller, C.H.G.; Sentenská, L.; Lipke, E.; Uhl, G.; Michalik, P. The innervation of the male copulatory organ of spiders (Araneae)—A comparative analysis. Front. Zool. 2019, 16, 39. [Google Scholar] [CrossRef] [PubMed]
- Rivera-Quiroz, F.A.; Petcharad, B.; Miller, J.A. First records and three new species of the family Symphytognathidae (Arachnida, Araneae) from Thailand, and the circumscription of the genus Crassignatha Wunderlich, 1995. Zookeys 2021, 1012, 21–53. [Google Scholar] [CrossRef]
- iNaturalist: Cross Orbweaver (Araneus diadematus). Available online: https://www.inaturalist.org/taxa/52628-Araneus-diadematus (accessed on 27 September 2021).
- Uhl, G.; Schmitt, S.; Schäfer, M.A.; Blanckenhorn, W. Food and sex-specific growth strategies in a spider. Evol. Ecol. Res. 2004, 6, 523–540. [Google Scholar] [CrossRef]
- Dowling, J.L.; Luther, D.A.; Marra, P.P. Comparative effects of urban development and anthropogenic noise on bird songs. Behav. Ecol. 2012, 23, 201–209. [Google Scholar] [CrossRef] [Green Version]
- Narango, D.L.; Rodewald, A.D. Urban-associated drivers of song variation along a rural-urban gradient. Behav. Ecol. 2016, 27, 608–616. [Google Scholar] [CrossRef]
- Kerstes, N.A.G.; Breeschoten, T.; Kalkman, V.J.; Schilthuizen, M. Snail shell colour evolution in urban heat islands detected via citizen science. Commun. Biol. 2019, 2, 264. [Google Scholar] [CrossRef] [PubMed] [Green Version]
- Shultz, A.J.; Adams, B.J.; Bell, K.C.; Ludt, W.B.; Pauly, G.B.; Vendetti, J.E. Natural history collections are critical resources for contemporary and future studies of urban evolution. Evol. Appl. 2021, 14, 233–247. [Google Scholar] [CrossRef] [PubMed]
Figure 1.
Volumetric and size comparisons. Boxplots comparing the volume and size variation in both groups. Fresh material (New) is shown in dark yellow and legacy material (Old) in blue. Note that although there is a considerable variation in absolute brain volume and carapace size, the brain width and brain–carapace ratio are not significantly different between the groups.

Figure 2.
Shape analysis of the supraesophageal ganglion. (a) Volume rendering of the spider brain (dorsal view) showing the placement of the 14 landmarks we measured; inset line drawing shows the brain in relation to the cephalothorax in dorsal view. (b) Scatter plot of the PCA scores for PC1 and PC2. The distribution suggests no differences in the brain shape of the fresh and legacy specimens. (c) Bar plot showing the variance coverage of each PC. PC1 and PC2, the most meaningful PC (together explain almost 60% of the variance) are illustrated. The red outlines indicate the mean shape, and the grey outlines show the shape variation associated to each PC. (d) Regression analysis of the association between brain shape (procrustes coordinates) and brain width. The overlapping distributions of both groups show no statistical significance in the shape variation between Old and New spider groups. (b,d) fresh material (New) is shown in dark yellow and collection material (Old) in blue. Scale bar = 0.5 mm.

Figure 3.
Comparison of Araneus diadematus neuroanatomy. New material was collected in October 2020; the Old specimen was captured in April 1940. (a,c) Axial slice of the brain focusing on the secondary eye pathway. (b,d) Sagittal slice of the whole CNS. Abbreviations: Br, brain; Bv, blood vessels; CB, central body (arcuate body); E, esophagus; OpNe, optic nerves; OpNeSL, optic nerves of the left secondary eyes; Ph, pharinx; SE_VN1, visual neuropiles 1 (lamina) of the secondary eye pathway; SEOT, secondary optic track; SOG, sub-esophagic ganglion; SSt, sucking stomach. Fresh material (New) is marked in dark yellow and legacy material (Old) in blue. Scale bars = 0.5 mm.

Figure 4.
Artifacts and incidental brain morphologies. Two factors to take in account when assessing the individual variation: (1) incorrect preservation of specimens; evidence of shrinkage caused by desiccation (arrows in (a,b)); and formation of crystals in the pharynx (Ph), esophagus (E), and sucking stomach (SSt) (marked with circles in (d). (2) Naturally occurring abnormalities, for example, irregular growth of the digestive diverticula (* in (c–h)) pushing and deforming the central nervous system ganglia (in orange) but being more evident on the supraesophageal ganglion (see (g,h)). Fresh material (New) is marked in dark yellow and legacy material (Old) in blue. Scale bars = 0.5 mm.


Table 1.
Data of the freshly collected and legacy specimens used in our study.
| Specimen Code | Coll. Date | Collector | Coll. Country | Province | Region | Locality | Coord Lat | Coord Lon |
|---|---|---|---|---|---|---|---|---|
| AD_01 | 7-Oct-2020 | A. Rivera-Quiroz, D, Arguedas | NL | Zuid Holland | Leiden | Singel Park | 52.16088 | 4.504739 |
| AD_02 | 7-Oct-2020 | A. Rivera-Quiroz, D, Arguedas | NL | Zuid Holland | Leiden | Singel Park | 52.16088 | 4.504739 |
| AD_03 | 7-Oct-2020 | A. Rivera-Quiroz, D, Arguedas | NL | Zuid Holland | Leiden | Singel Park | 52.16088 | 4.504739 |
| AD_04 | 7-Oct-2020 | A. Rivera-Quiroz, D, Arguedas | NL | Zuid Holland | Leiden | Singel Park | 52.16088 | 4.504739 |
| AD_05 | 7-Oct-2020 | A. Rivera-Quiroz, D, Arguedas | NL | Zuid Holland | Leiden | Singel Park | 52.16088 | 4.504739 |
| AD_06 | 7-Oct-2020 | A. Rivera-Quiroz, D, Arguedas | NL | Zuid Holland | Leiden | Singel Park | 52.16088 | 4.504739 |
| AD_07 | 7-Oct-2020 | A. Rivera-Quiroz, D, Arguedas | NL | Zuid Holland | Leiden | Singel Park | 52.16088 | 4.504739 |
| AD_09 | 7-Oct-2020 | A. Rivera-Quiroz, D, Arguedas | NL | Zuid Holland | Leiden | Singel Park | 52.16088 | 4.504739 |
| AD_10 | 7-Oct-2020 | A. Rivera-Quiroz, D, Arguedas | NL | Zuid Holland | Leiden | Singel Park | 52.16088 | 4.504739 |
| AD_11 | 7-Oct-2020 | A. Rivera-Quiroz, D, Arguedas | NL | Zuid Holland | Leiden | Singel Park | 52.16088 | 4.504739 |
| AD_12 | 7-Oct-2020 | A. Rivera-Quiroz, D, Arguedas | NL | Zuid Holland | Leiden | Singel Park | 52.16088 | 4.504739 |
| AD_13 | 22-Apr-1940 | B. de Jong | NL | ND | ND | ND | ND | ND |
| AD_14 | 24-Aug-1941 | B. de Jong | NL | Noord Holland | Amsterdam | Kruislaan | ND | ND |
| AD_15 | 9-Oct-1929 | W. B. Begerinck, B. de Jong | NL | Noord Holland | ND | ND | ND | ND |
| AD_16 | 9-Oct-1929 | W. B. Begerinck, B. de Jong | NL | Noord Holland | ND | ND | ND | ND |
| AD_17 | 18-Oct-1946 | B. de Jong | NL | Noord Holland | Hilversum | Lage Vuursche | ND | ND |
| AD_18 | 18-Oct-1946 | B. de Jong | NL | Noord Holland | Hilversum | Lage Vuursche | ND | ND |
| AD_19 | 22-Apr-1940 | B. de Jong | NL | ND | ND | ND | ND | ND |
| AD_20 | 18-Oct-1946 | B. de Jong | NL | Noord Holland | Hilversum | Lage Vuursche | ND | ND |
| AD_22 | 18-Oct-1948 | B. de Jong | NL | Noord Holland | ND | ND | ND | ND |
| AD_23 | 3-Nov-1947 | B. de Jong | NL | Overijssel | Wanneperveen | ND | ND | ND |
ND = no data.
Table 2.
Results of normality test.
| p-Values | [Outliers Removed] | |||
|---|---|---|---|---|
| New | Old | New | Old | |
| Carapace width | 0.854 | 0.2008 | -- | -- |
| Carapace length | 0.8829 | 0.1361 | -- | -- |
| Brain width | 0.3331 | 0.2035 | -- | -- |
| Brain volume | 0.009821 | 0.3665 | 0.688 [1] | -- |
| BR vol. vs. Car. W | 0.1129 | 0.3808 | -- | -- |
Publisher’s Note: MDPI stays neutral with regard to jurisdictional claims in published maps and institutional affiliations. |
© 2021 by the authors. Licensee MDPI, Basel, Switzerland. This article is an open access article distributed under the terms and conditions of the Creative Commons Attribution (CC BY) license (https://creativecommons.org/licenses/by/4.0/).
Share and Cite
MDPI and ACS Style
Rivera-Quiroz, F.A.; Miller, J.A. Old Brains in Alcohol: The Usability of Legacy Collection Material to Study the Spider Neuroarchitecture. Diversity 2021, 13, 601. https://0-doi-org.brum.beds.ac.uk/10.3390/d13110601
AMA Style
Rivera-Quiroz FA, Miller JA. Old Brains in Alcohol: The Usability of Legacy Collection Material to Study the Spider Neuroarchitecture. Diversity. 2021; 13(11):601. https://0-doi-org.brum.beds.ac.uk/10.3390/d13110601
Chicago/Turabian StyleRivera-Quiroz, F. Andres, and Jeremy Abraham Miller. 2021. "Old Brains in Alcohol: The Usability of Legacy Collection Material to Study the Spider Neuroarchitecture" Diversity 13, no. 11: 601. https://0-doi-org.brum.beds.ac.uk/10.3390/d13110601
Note that from the first issue of 2016, this journal uses article numbers instead of page numbers. See further details here.