Article

Range Shifts in the Worldwide Expansion of Oenothera drummondii subsp. drummondii, a Plant Species of Coastal Dunes

by
Frida R. Castillo-Infante
1,
Gabriela Mendoza-González
2,3,*,
Rodolfo Rioja-Nieto
4,5 and
Juan B. Gallego-Fernández
6
1
Facultad de Ciencias, UMDI-Sisal, Universidad Nacional Autónoma de México, Sierra Papacal 97302, Yucatán, Mexico
2
CONACYT–Facultad de Ciencias, UMDI-Sisal, Universidad Nacional Autónoma de México, Sierra Papacal 97302, Yucatán, Mexico
3
Laboratorio Nacional de Resiliencia Costera (LANRESC), Consejo Nacional de Ciencia y Tecnologia (CONACyT), Sisal 97356, Yucatán, Mexico
4
Escuela Nacional de Estudios Superiores–Mérida, Universidad Nacional Autónoma de México, Mérida 97757, Yucatán, Mexico
5
Laboratorio de Análisis Espacial de Zonas Costeras (COSTALAB), Facultad de Ciencias, UMDI-Sisal, Universidad Nacional Autónoma de México, Sierra Papacal 97302, Yucatán, Mexico
6
Departamento de Biología Vegetal y Ecología, Universidad de Sevilla, 41012 Sevilla, Spain
*
Author to whom correspondence should be addressed.
Submission received: 8 October 2021 / Revised: 11 November 2021 / Accepted: 18 November 2021 / Published: 21 November 2021
(This article belongs to the Special Issue Biological Invasions and Conservation in Coastal Dune Ecosystems)

Abstract

:
Oenothera drummondii is a coastal dunes plant species from the North American continent that has affected the natural structure and dynamics of Spanish, Israeli, and Chinese shores as an invasive species. In South Africa, Australia, New Zealand, and France, it is reported as a naturalized species. Ecological niche and species distribution modeling has been widely used as a tool to find potential global invasions and assess invasion effects. Herein, we modeled the ecological niche and the potential distribution of Oenothera drummondii, using the Köppen–Geiger climate classification, bioclimatic variables and occurrence records that have been validated in their native and non-native distribution. In the native area, the temperature and precipitation values are higher compared to non-native zones, where the low temperatures and the absence of humidity are the main climatic limitations for the species. In the environmental space, new distribution areas were identified and a partial overlap between the native and non-native niches detected. This suggests that climate matching is not occurring for the species, and that the potential invasion of coastal dune areas seems to be higher than previously observed. Therefore, new potential invasion areas, where the species is not yet distributed, were also identified. Our predictions could be used to establish ecosystem management measures to mitigate the invasion of Oenothera drummondii, helping to prevent possible negative impacts on fragile coastal ecosystems.

1. Introduction

Invasive species are considered as a global driver of change that generates important ecological disturbances, threatening native biodiversity [1] and causing significant ecological and economic repercussions [2,3,4]. These threats are related to the ability of this type of species to alter ecosystem functions and processes as a result of increasing nutrient input, altering nutrient cycling or affecting water balance, and by modifying the vegetation community composition and structure [5,6,7,8]. These changes have repercussions on health, and can generate economic losses [9,10,11]. With human activities related to globalization and an increase in the transportation of goods, non-native species have increased their capability of movement around the world [12]. Specifically, in coastal dunes, invasive species are one of the major threats to the biodiversity [13], where the success of non-native species is mostly due to the harsh environmental conditions, low vegetation cover, frequent disturbances and the open patches free of plant competition [14,15]. The problem of species invasion in these ecosystems is of high-priority due to the possibility of losing many threatened, endemic or highly specialized flora and fauna, which are tolerant to the extreme conditions such as salt spray, burial by sand, drought, low nutrient availability and occasional storms [16]. Therefore, it is necessary to take preventive management measures to mitigate the impacts that invasive species may have on the biodiversity of natural ecosystems. Invasive species may represent superior competitors than native species in new sites, obtaining most of all the resources, by having higher environmental tolerances, higher reproduction rates, faster growth, possibility of absence of native enemies or having more effective dispersing strategies [8,17,18]. Their success may also be related to micro-evolution processes as responses to natural selection, in such a way that the invasive species become different from the ancestral ones. This is related to intraspecific hybridization between different populations, or between other species, which can provide superiority within the habitat [18].
Species can become invasive as a result of their plasticity, or, due to global change. Depending on different environmental characteristics, the same genotype can present different phenotypes that give the species tolerance and resistance to different climates, which could give them advantages in heterogeneous environments [19]. Knowing the invasive species’ potential for invasion might provide useful information that allows designing the necessary strategies to control its expansion in advance. There are different predictive models that estimate the potential distribution of the species, and identify the sites whose environmental characteristics are similar to those of native distribution or the areas with the most favorable environmental conditions [20]. Ecological niche and species distribution modeling are very useful tools, which combined with the biological knowledge of the species, allow researchers to know with some precision, the environmental and climatic requirements that invasive species require to expand into new environments [21,22]. Generally, to define the invasion potential of species through environmental matching [23], the calibration of models use the species native range to extrapolate the patterns into a new potential non-native range [24,25]. The already-observed invasion range can also be used to predict the potential extent of species distribution [26]. These are widely used methods to approximate the potential invasion of vulnerable areas [27,28,29,30] through different software and algorithms. Maxent is a program based on the principle of Maximum Entropy (the most stable and uniform) that performs geographic distribution models based on the environmental conditions associated with the occurrence records of the species [31,32]. In the native and non-native range where species distribution occurs, called realized niche [33], suitable conditions need to be present and available. This include climate, resources, biotic interactions, and dispersal ability [34]. This occurs in a fraction of the fundamental niche, which is the intersection of suitable abiotic (scenopoetic) conditions in the absence of biotic interactions where a species maintain positive population growth without the need for immigration [35]. According to Gallien et al. [29], there are three different possibilities in predicting invasion risk based on ecological niche modeling: (i) realized niche in invaded range is similar to the native; (ii) realized niche in invaded range may be very different from the native; and (iii) realized niche in invaded range might be partially outside of the fundamental niche because of rapid genetic adaptation. In this work, we aim to prove the first two possibilities, by analyzing the ecological niche and potential distribution modeling of a coastal dune species that has been considered as invasive.
Oenothera drummondii subsp. drummondii Hook. (Onagraceae) known as the beach evening primrose, is an herbaceous perennial native to the Atlantic coasts of North America, between North Carolina in the USA and Tabasco in Mexico [36]. O. drummondii grows in its native area in the back beaches and the first dune ridges with humid subtropical and wet tropical climates (Cfa, Aw, Am, BSh) according to the Köppen–Geiger classification [37,38]. The species is a short-lived herb (up to four years) that can measure from 10 to 50 cm tall; it is an erect to procumbent herb with hairy leaves, dry fruits and presents self-compatible yellow flowers pollinated by hawkmoths in their native distribution [36,39,40]. O. drummondii can be dispersed by barochory, thalassochory and endozoochory [41]. Currently, this species is found on beaches and dunes in Europe, Africa, Asia and Oceania; it is considered as invasive in Spain, Israel and China [13,42,43], but has also been introduced into Australia, South Africa, Egypt and New Zealand [44,45,46]. The introduction into non-native areas seems to be linked to the transport of goods where the seeds of O. drummondii would be transported as stowaways [45,47].
This species is of interest due to the high invasiveness that has shown in some coastal dune systems outside its native distribution, affecting the native biodiversity and functioning of the invaded ecosystem [13]. For example, in Spain since the beginning of 2000, this species has been considered a threat to the country’s biodiversity as it has altered the community composition and species abundance of vegetation in coastal dunes. In areas where this species occurs, dune species decrease and opportunistic species increase [13]. In addition, it has displaced native species such as Achillea maritime, Ammophila arenaria, Malcolmia littorea, and Silene nicaeensis [11,13] and has modified environmental conditions such as the sedimentary dynamics, the dune formation process and the dune morphology [13]. Furthermore, in China it has been documented that the presence of O. drummondii, together with other plant species, increases competition and decreases the abundance of Ipomoea pes-caprae, a pioneer species native to China [48].
Given the invasion risk that O. drummondii represents, it is important to document the areas where it has been recorded and to characterize the range of favorable environmental conditions in which it has been found. In this study, we investigated (i) how the species has expanded in its non-native range, (ii) what are the climatic conditions of the areas where the species has established, and (iii) which areas are potentially suitable for its expansion. To achieve these objectives, we use databases of the species distribution in its native and non-native area in combination with climatic data, in which we analyze its environmental profile for its global distribution. With historical and current data, we built models of potential distribution in native and invasive areas, through the selection of specific climates using the Köppen–Geiger classification, and the geographic range of expansion of the species. We analyze the climatic correspondence (climate matching) between different geographical regions where the species has increased its distribution and compare it with the native distribution regions. Modeling the geographic distribution of this species and the sites of potential invasion can provide information for the establishment of preventive and management measures to minimize its impact on native biodiversity.

2. Materials and Methods

2.1. Species Occurrence Data

A database of O. drummondii was constructed with 664 records of presence from the occurrence of native and non-native populations Global Biodiversity Information Facility [49], the Spanish Plants Information System [50], the Israel Biodiversity Information System [51], the Australasian Virtual Herbarium [52] and TROPICOS data bases [53]. Occurrence records were verified with literature and museum databases and incomplete locality information that could not be corrected was omitted. Due to the absence of genetic studies, it was also confirmed that the populations of the different native and non-native areas corresponded to the same species, by verifying the revisions in herbarium databases by the specialist in the genus, Werner Dietrich [54]. Due to the fact that O. drummondii distribute in coastal habits, the records that were outside of a coastal areas were eliminated. For this, a worldwide coastal buffer of two km from the coast was used, since the species colonizes primary and secondary dunes that do not exceed a greater distance to the interior of the continents. To correct the sampling bias of the presence datasets, prior to modeling, a cleaning of the areas with the highest concentration of occurrence records was made, obtaining a uniform distribution of the records. Repeated points were eliminated and single points per pixel were used (Figure 1).

2.2. Environmental Analysis and Climatic Profile

We used eight updated Köppen–Geiger climatic regions [37,38] that occurred within the worldwide coastal buffer in which O. drummondii is distributed (Figure 2), by using the spatial join function in ArcGIS 10.1. This climatic classification is frequently used for choosing a defined geographical background for sampling the reference climate where the species is present [55]. Köppen–Geiger climatic regions presented in the species native range were compared to those in the non-native, and novel regions were identified. Tropical monsoon climate (Am) and Tropical savanna climate with dry-winter characteristics (Aw) were identified only for native distribution; hot semi-arid climate (Bsh) and humid subtropical climate (Cfa) for native and non-native distributions; and temperate oceanic climate (Cfb), Mediterranean hot summer climates (Csa), Mediterranean warm/cool summer climates (Csb), and dry-winter humid subtropical climate (Cwa) were identified for non-native distribution. For each of these climatic regions, we selected the important bioclimatic variables from Worldclim (https://www.worldclim.org/, accessed on 27 September 2021) with an approximate resolution of one km2. The data represented both mean and extreme values of temperature and precipitation [56,57], which are the most suitable for making models on a global scale [58]. The appropriate selection of meaningful bioclimatic variables affects the performance of projections through space or time [59,60]. Selecting just a few variables could increase a model overprediction and a large number may lead to overfitting. To avoid this, we made a selection based on three stages. First, we consider the environmental requirements that favor or limit the distribution of O. drummondii obtained from the literature [13,61,62]. Then, we based the selection of variables on the highest percentage of contribution and the Jackknife analysis obtained by modeling with the 19 bioclimatic variables in Maxent for each Köppen–Geiger climate regions. Finally, with the identified variables we made a Spearman correlation analysis, in which we eliminated one of the variables with the highest and most significance coefficients (r > 0.5 and p < 0.001), selecting the one that had the higher relative importance that explained the highest variance by using a Principal Component Analysis (Table 1).
Each of the climatic regions occupied by O. drummondii was projected into the environmental space as an approximation of the species fundamental niche. Using a one km2 grid, the areas where the species distribute in the climatic regions were identified and used to obtain 19 bioclimatic variables from the Worldclim database.
The climatic profile of the species was determined by obtaining the values of the 19 bioclimatic variables for each occurrence data in the native and non-native distribution of the species in the global distribution (first data set). We also obtained the climatic profile for each Köppen–Geiger climatic region where the species was found by obtaining all the 19 bioclimatic values for each km2 that compose the area of each region. This allowed researchers to know the environmental space where the species might distribute in each of the regions (second data set). To analyze the environmental space that characterizes native and non-native distribution of the species, we plotted these data sets separately (one plot in general and one plot for each climatic region), in scatter plots through an ordination of Principal Common Analysis (PCA) to the first two axes, and used these to characterize the occurrence clouds for the species, using the software SPSS 24.0 [63]. We also statistically compared the different groups of bioclimatic variables (mean and extreme values of temperature and precipitation) of native and non-native distribution using a Mann–Whitney U test, and then plotted groups in a boxplot to explore the variability of the data by using the PAST v4 software.

2.3. Species Distribution Modeling

Model transferability is a challenge to address urgent problems related to climate change and species invasions. Methodological considerations can affect the spatial projections when transferred into broad unsampled environments across time and space [64]. Transferability in species distribution modeling involves two components: interpolation within the environmental constraints encountered during model calibration or training and extrapolation or projection outside of the environmental ranges encountered [65]. Due to these considerations, in this study, we used the eight Köppen–Geiger climatic regions where the species is distributed, to generate independent models for each region, with differentiated training procedures that made the projections unique in the native and non-native regions. Furthermore, the climatic profile of O. drummondii was analyzed in the environmental space and then projected to the geographical fraction of native and non-native distribution. These areas were selected as training and projecting the potential distribution, respectively, using the algorithm MaxEnt 3.4.1 [32]. Recent studies model the potential distribution of invasive species using Maxent [65,66,67,68,69]. This is one of the most popular algorithms that outperforms other methods due to its predictive accuracy ability, even with small samples [64,70,71]. This is the case for the study of O. drummondii (see # occurrence records of Table 2). Maxent, determine patterns in the data and select the most probable and uniform configuration based on the maximization of Shannon’s entropy [32,72]. We used the default parameters in the Maxent interface to obtain response curves and Jackknife analysis. The model outputs were obtained in a cumulative scale and the threshold of “minimum training presence” was used to transform the data to presence and absence binary maps. We built models for eight data sets according to Köppen–Geiger climatic regions (Table 1 and Table 2) where the species occurs in coastal areas worldwide. The models were calibrated based on the geographic areas where the species is observed (training areas) and the resulting model was transferred to areas with the same type of climate (projection areas of possible invasion). For the native region, four data sets considering Am, Aw, Bsh and Cfa, climatic regions, were built, calibrated and then projected to the non-native areas with the same climate type, to model potential invasions for each set. For the non-native distribution regions, the remaining four sets were built considering Csa, Csb, Cfb and Cwa climatic regions, where the species has been observed. These models were calibrated in areas with occurrence records and then projected to new areas where occurrence records are not reported to explore potential invasions (see Appendix A).
Binary models of presence-absence from each Köppen–Geiger climatic region were converted from raster to points in ArcMap 10.1, to extract the values of the 19 bioclimatic variables from the Worldclim database for each point. These values were used to project (in the environmental space) the realized niched predicted by the model combined with the approximated fundamental niche, in each of the eight Köppen climatic (scenopoetic) regions where the species could be distributed.
To identify the potential invasion of O. drummondii, the eight resulting models were compiled in Arcmap 10.1, and a global scale map of the potential distribution of the species was obtained. Regional maps were made to review in detail the areas of potential invasion.

2.4. Evaluation of the Models

We validated the discrimination ability and overfitting of the models by using the area under the curve (AUC) resulting from the receiver operating characteristic (ROC) curve using the statistical analyzes obtained with Maxent. This shows the fit of the model in relation to the test and training data, describing the rate of correct identification of presence, also known as the absence of errors of omission (sensitivity, on the “y” axis) against the rate of commission errors (1-specificity, in the “x” axis). The closer the value is to 1, the better the performance of the model [32,73]. However, the ROC curve assigns the same weight to errors of omission and commission, and it has been documented that errors of omission have greater weight, such that a model that omits known presences has a lower performance than one that predicts areas that cannot be inhabited [23]. To avoid this bias, the partial ROC curve was used, which “uses the portion of the ROC curve that is within the predictive range of the modeling algorithm and within the range of acceptable models in terms of error of omission” [23]. For this purpose the software “Tool for Partial-ROC” from Barve (2008), with 50% of the test points was used to obtain the “AUC ratio”, with 1000 iterations and an omission threshold of 5%. The values obtained in this parameter ranged from 0 to 2, where those closest to one describe a random model with no predictive power, while the values close to two suggest a better performance (p < 0.05) of the model [23,74].

3. Results

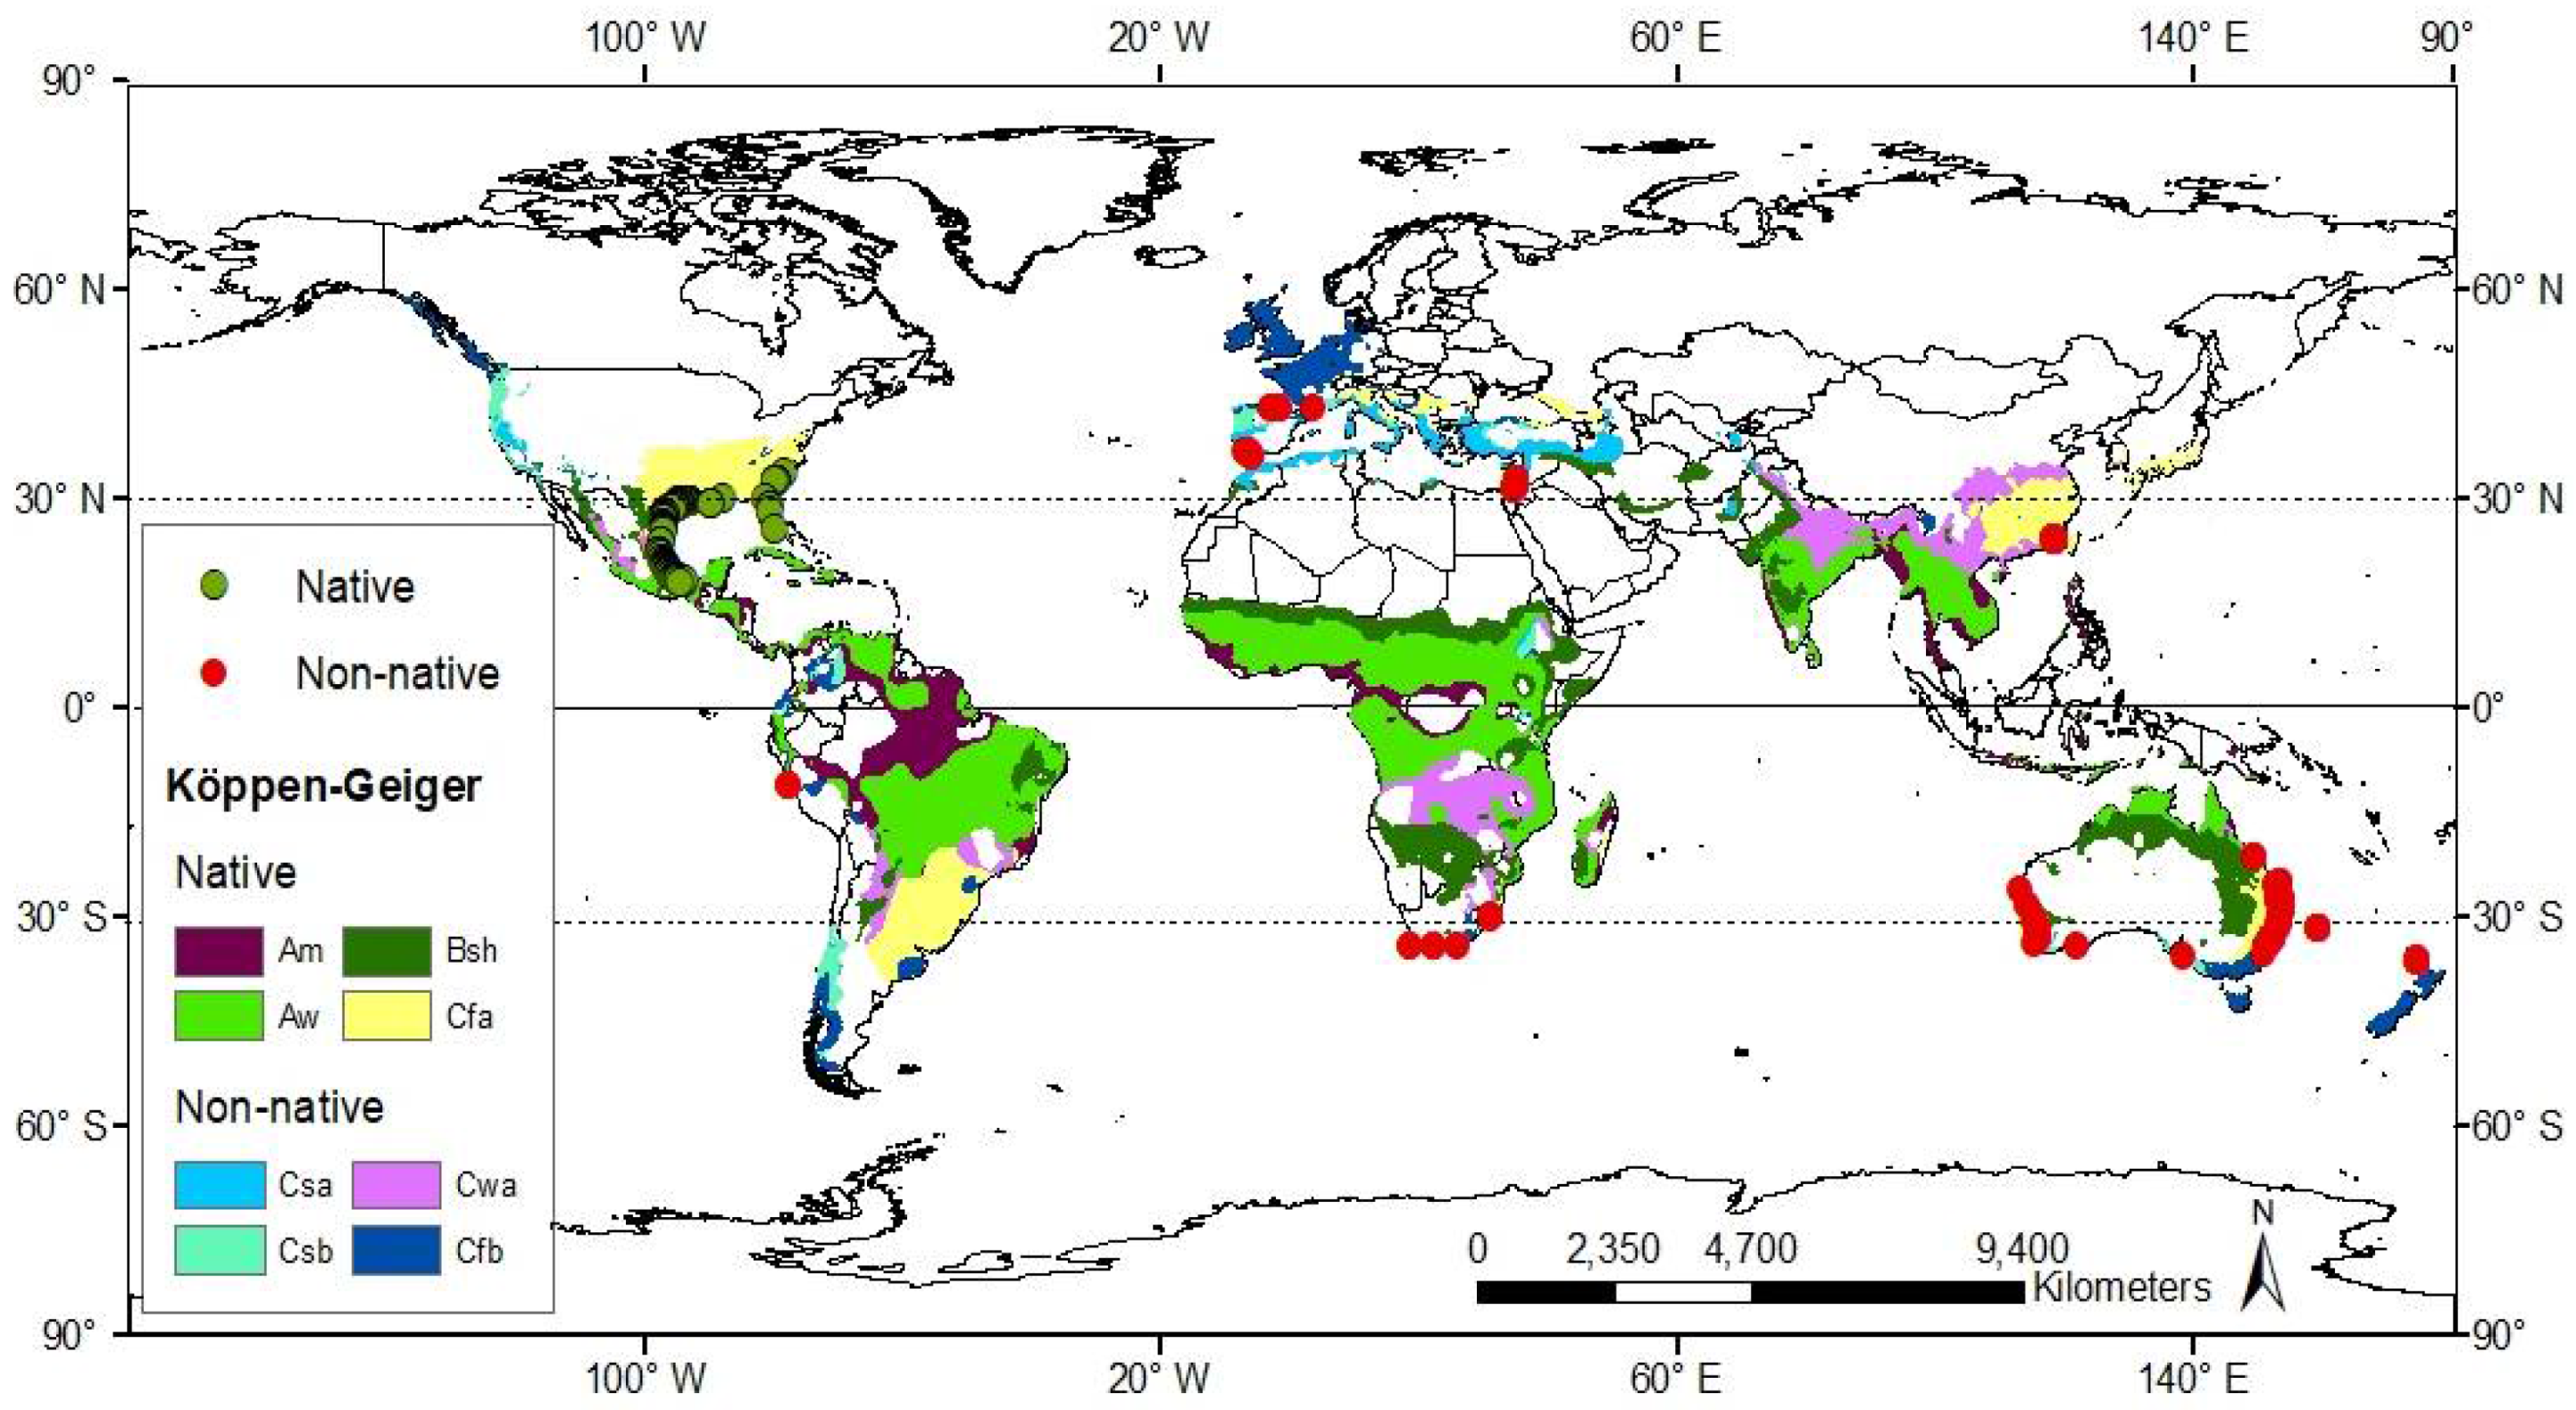
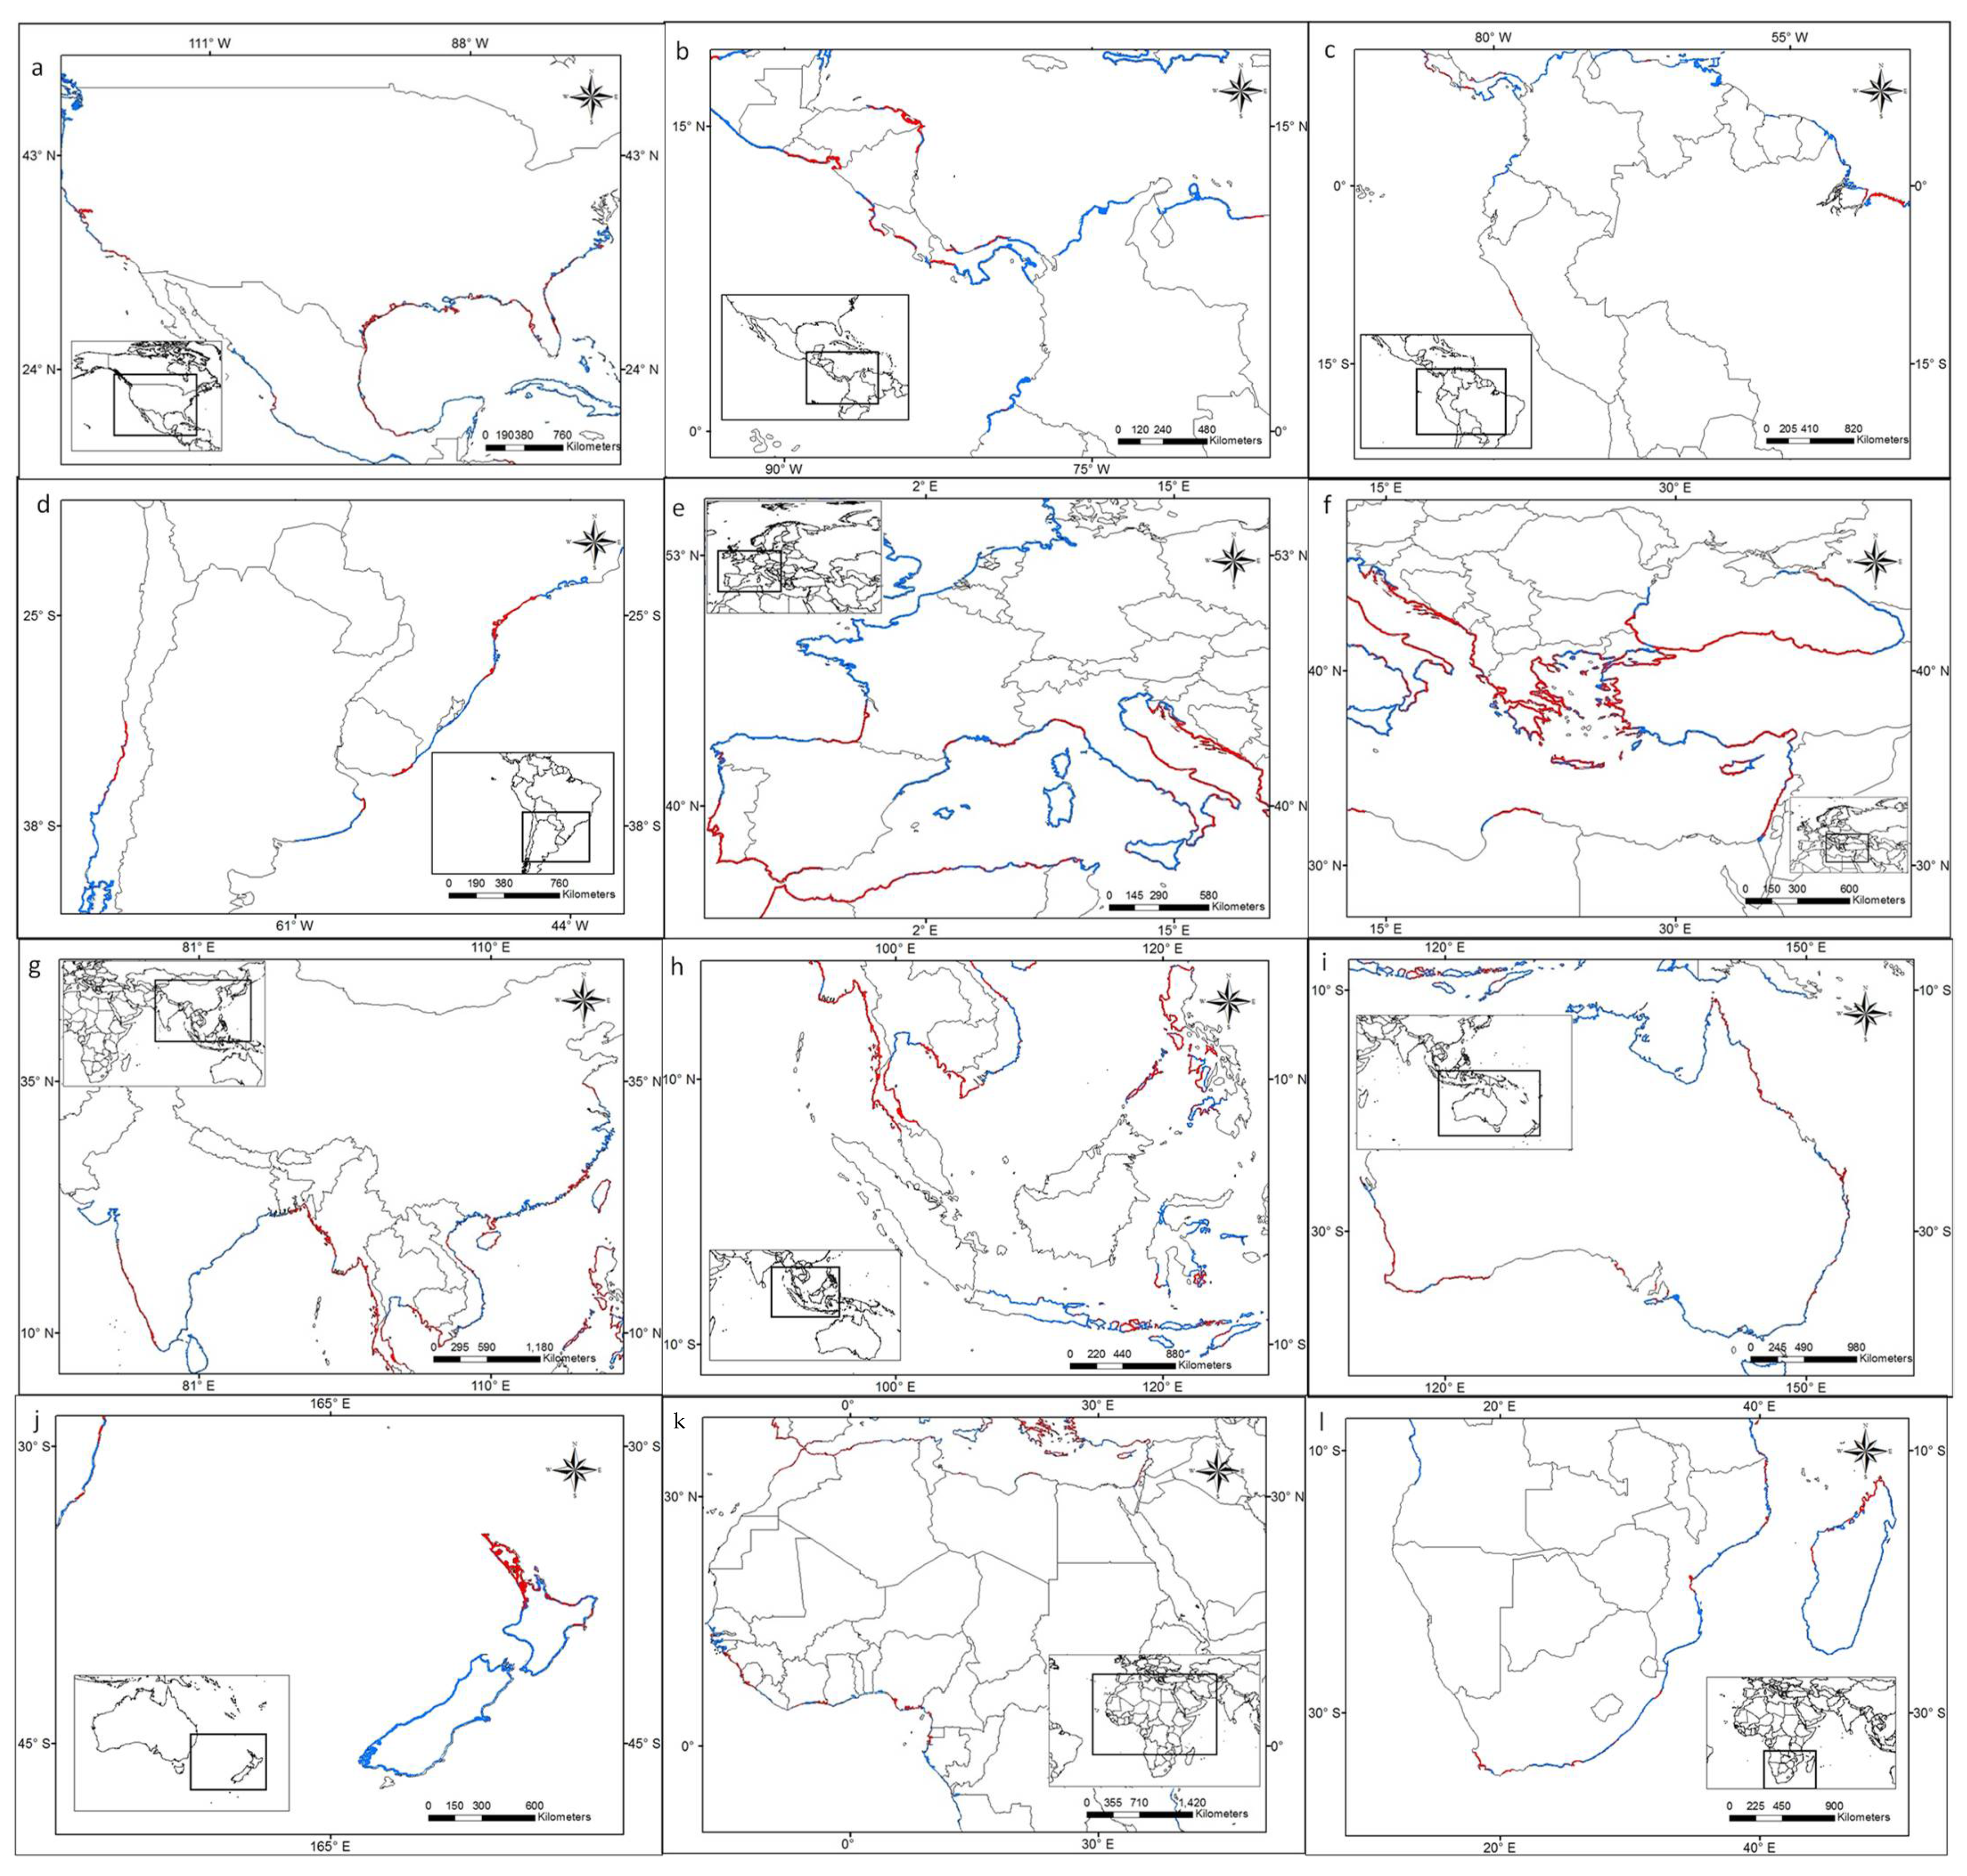
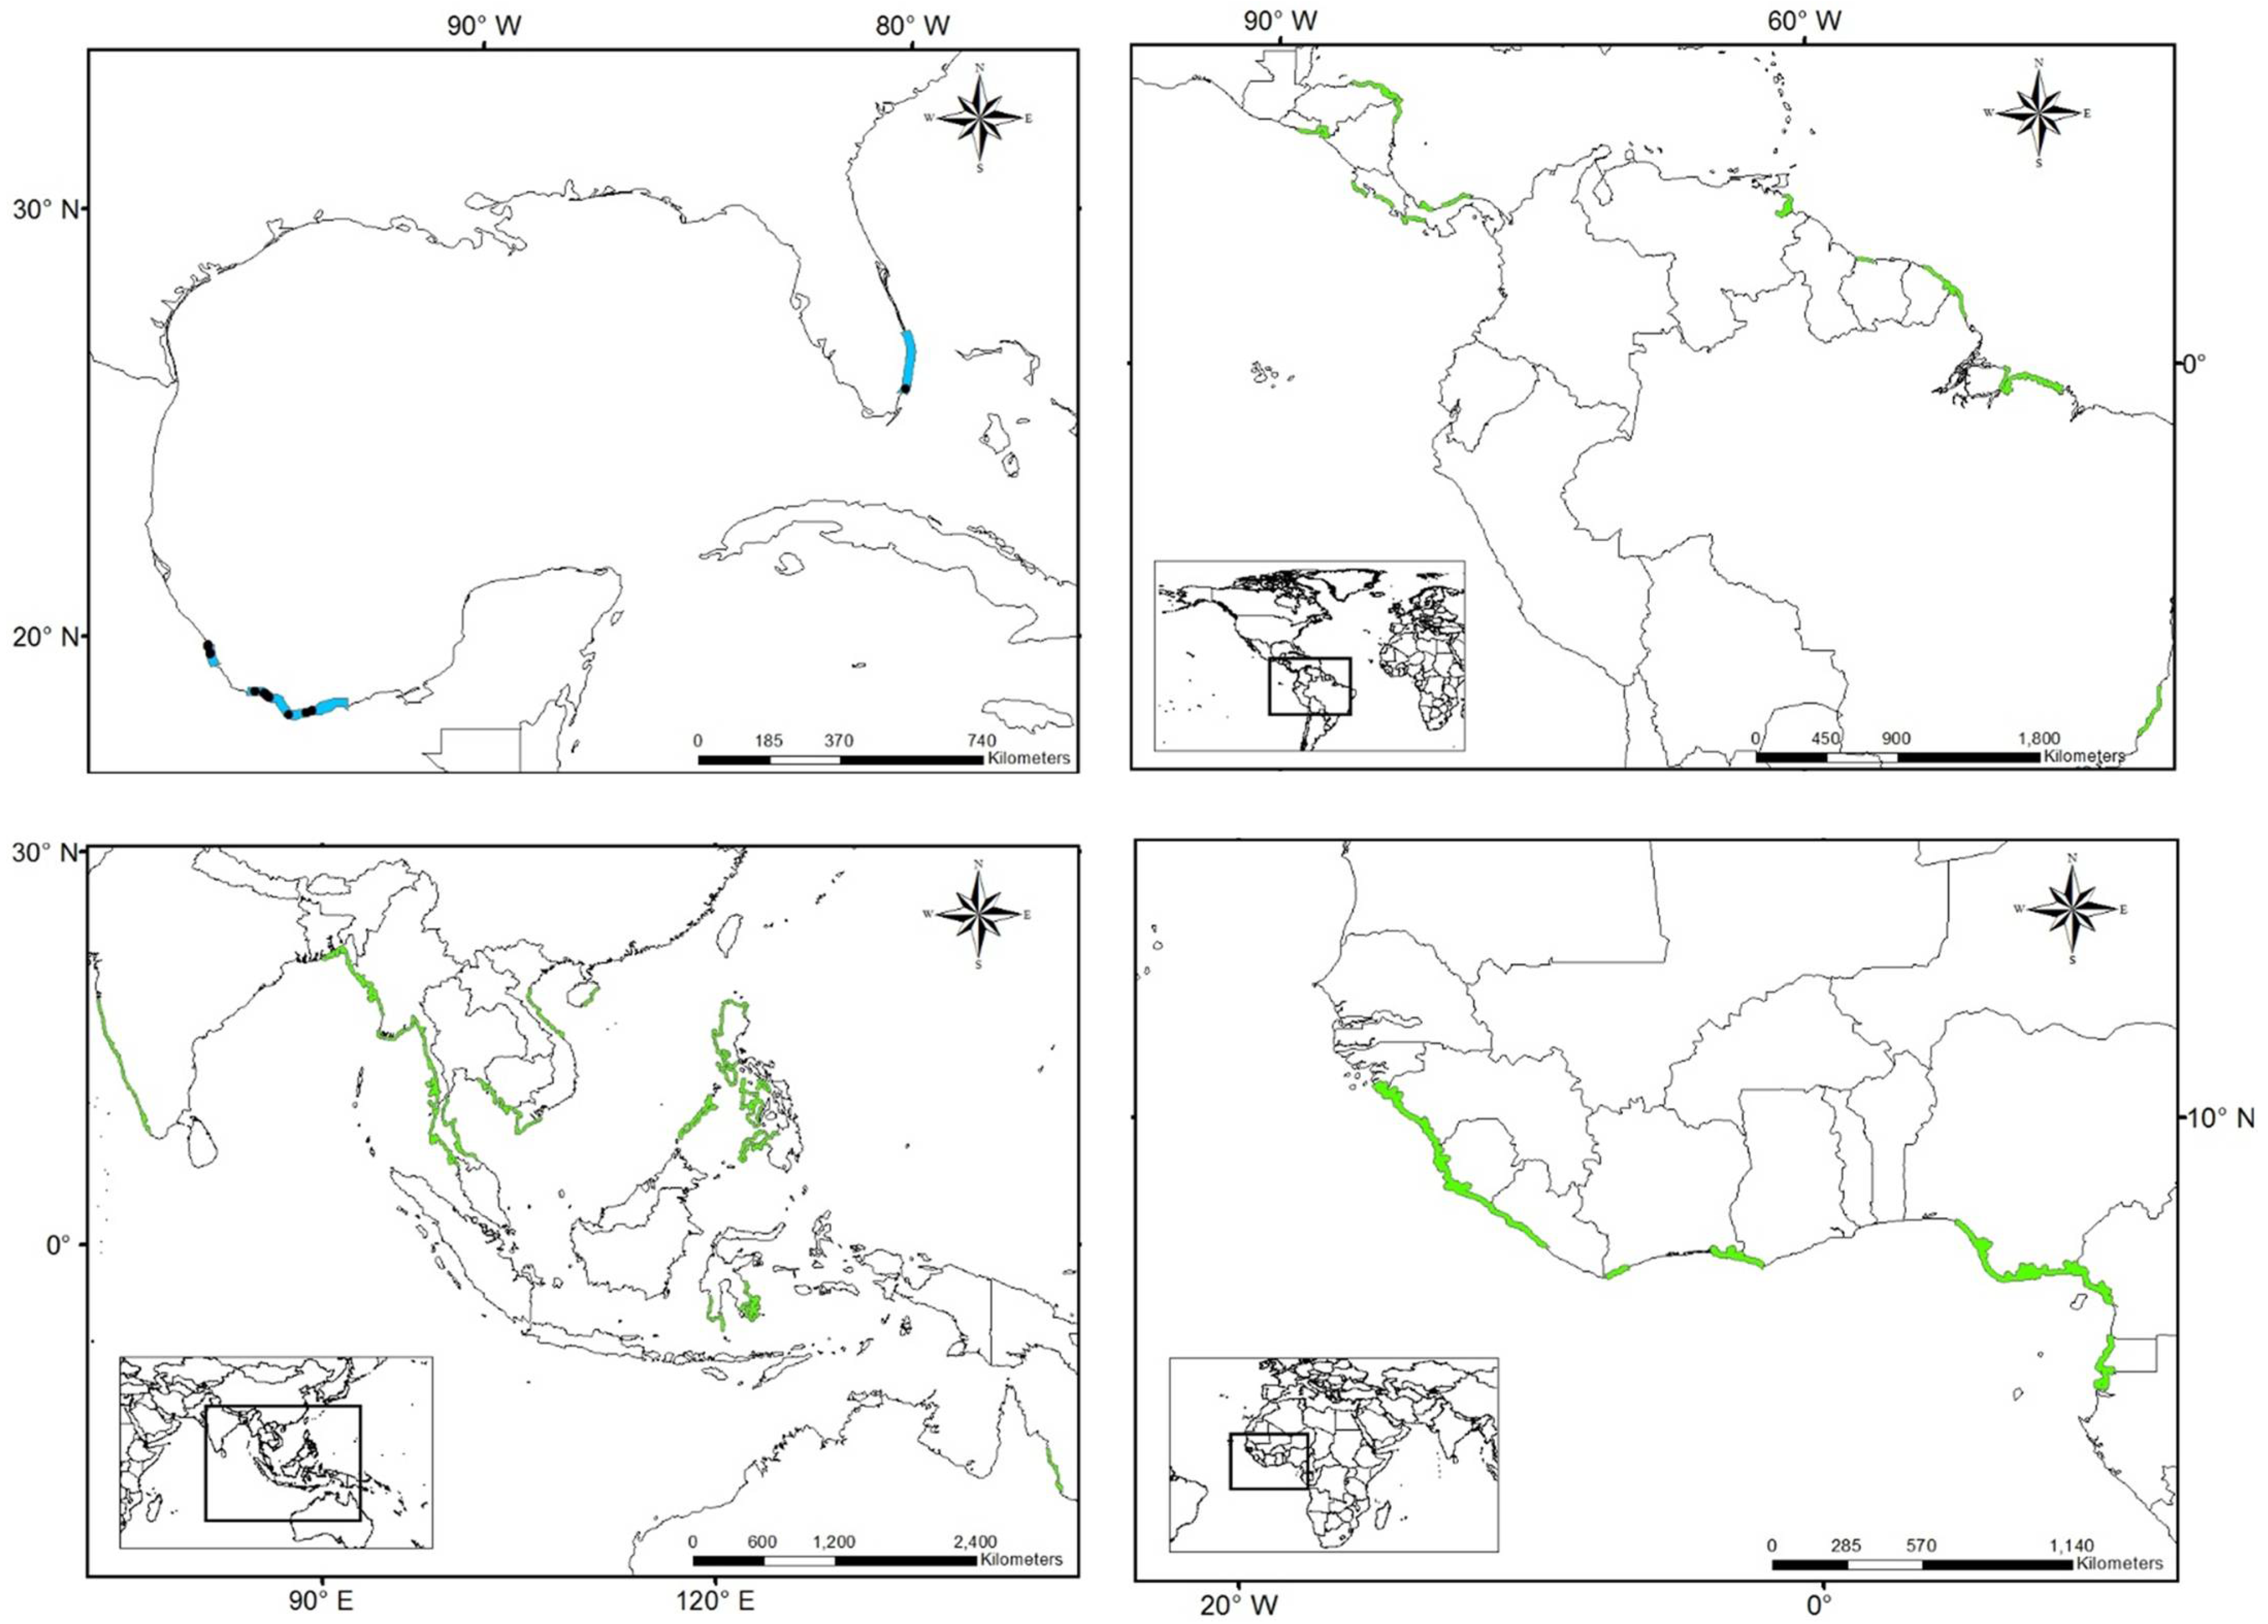
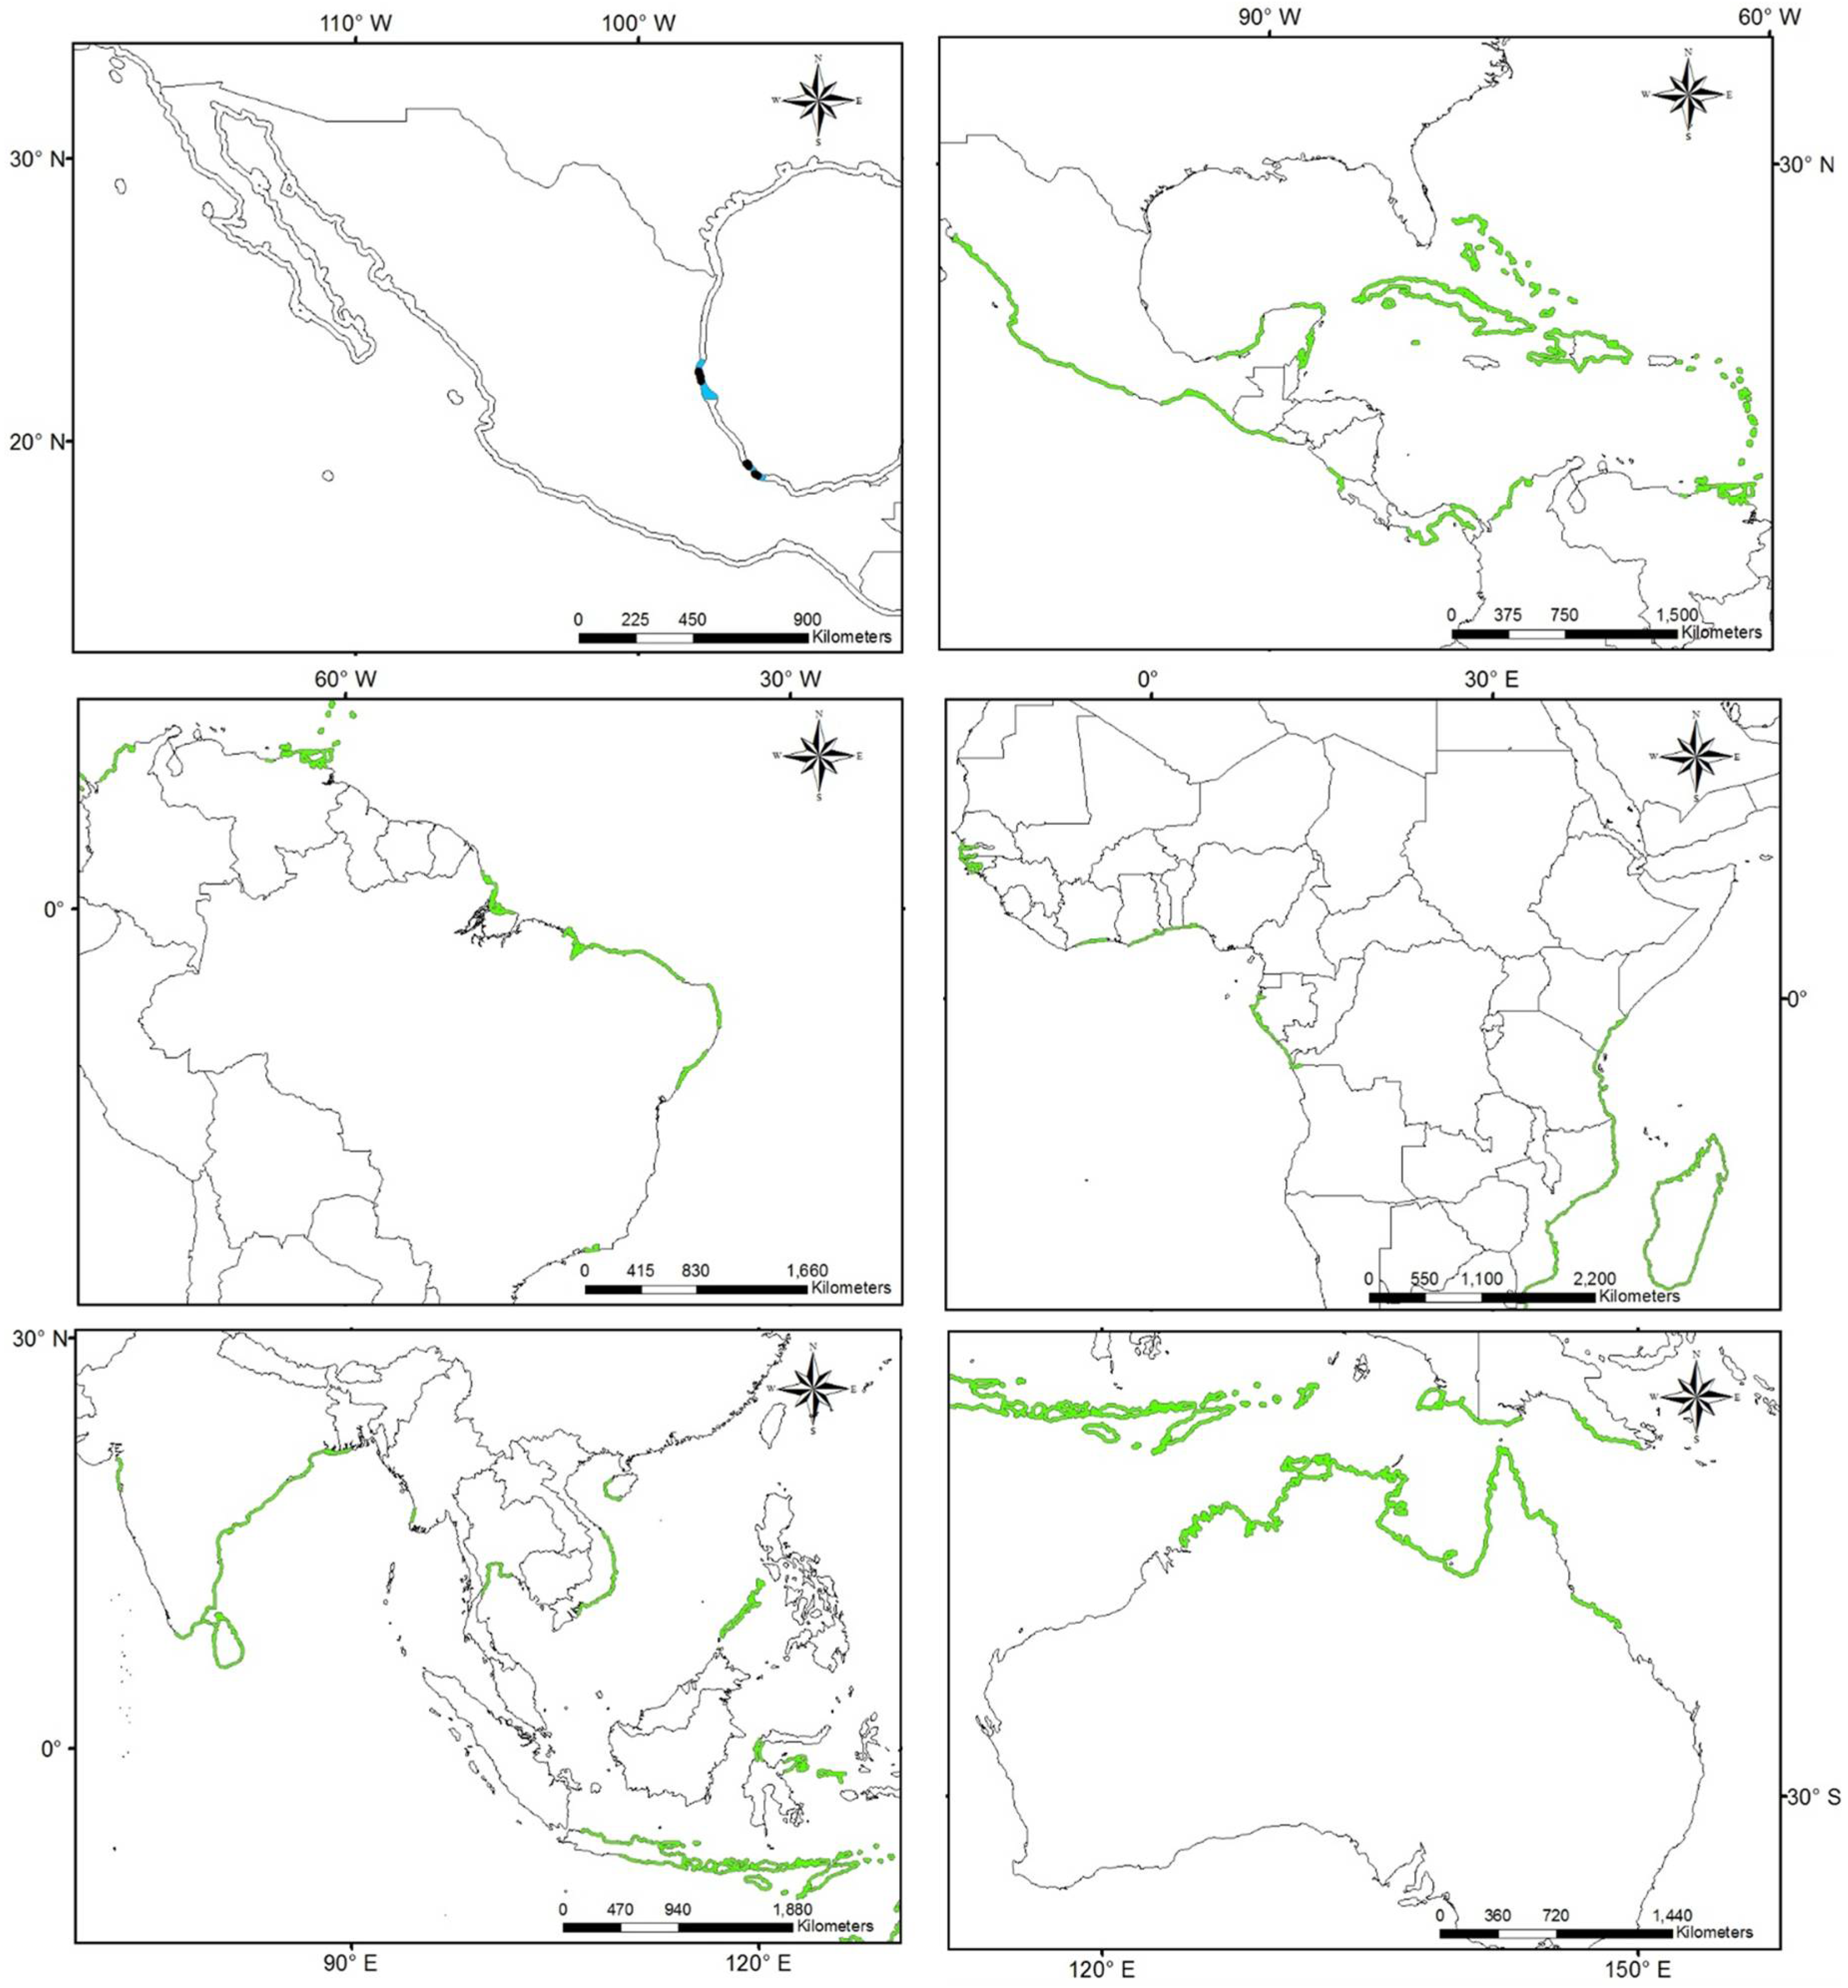
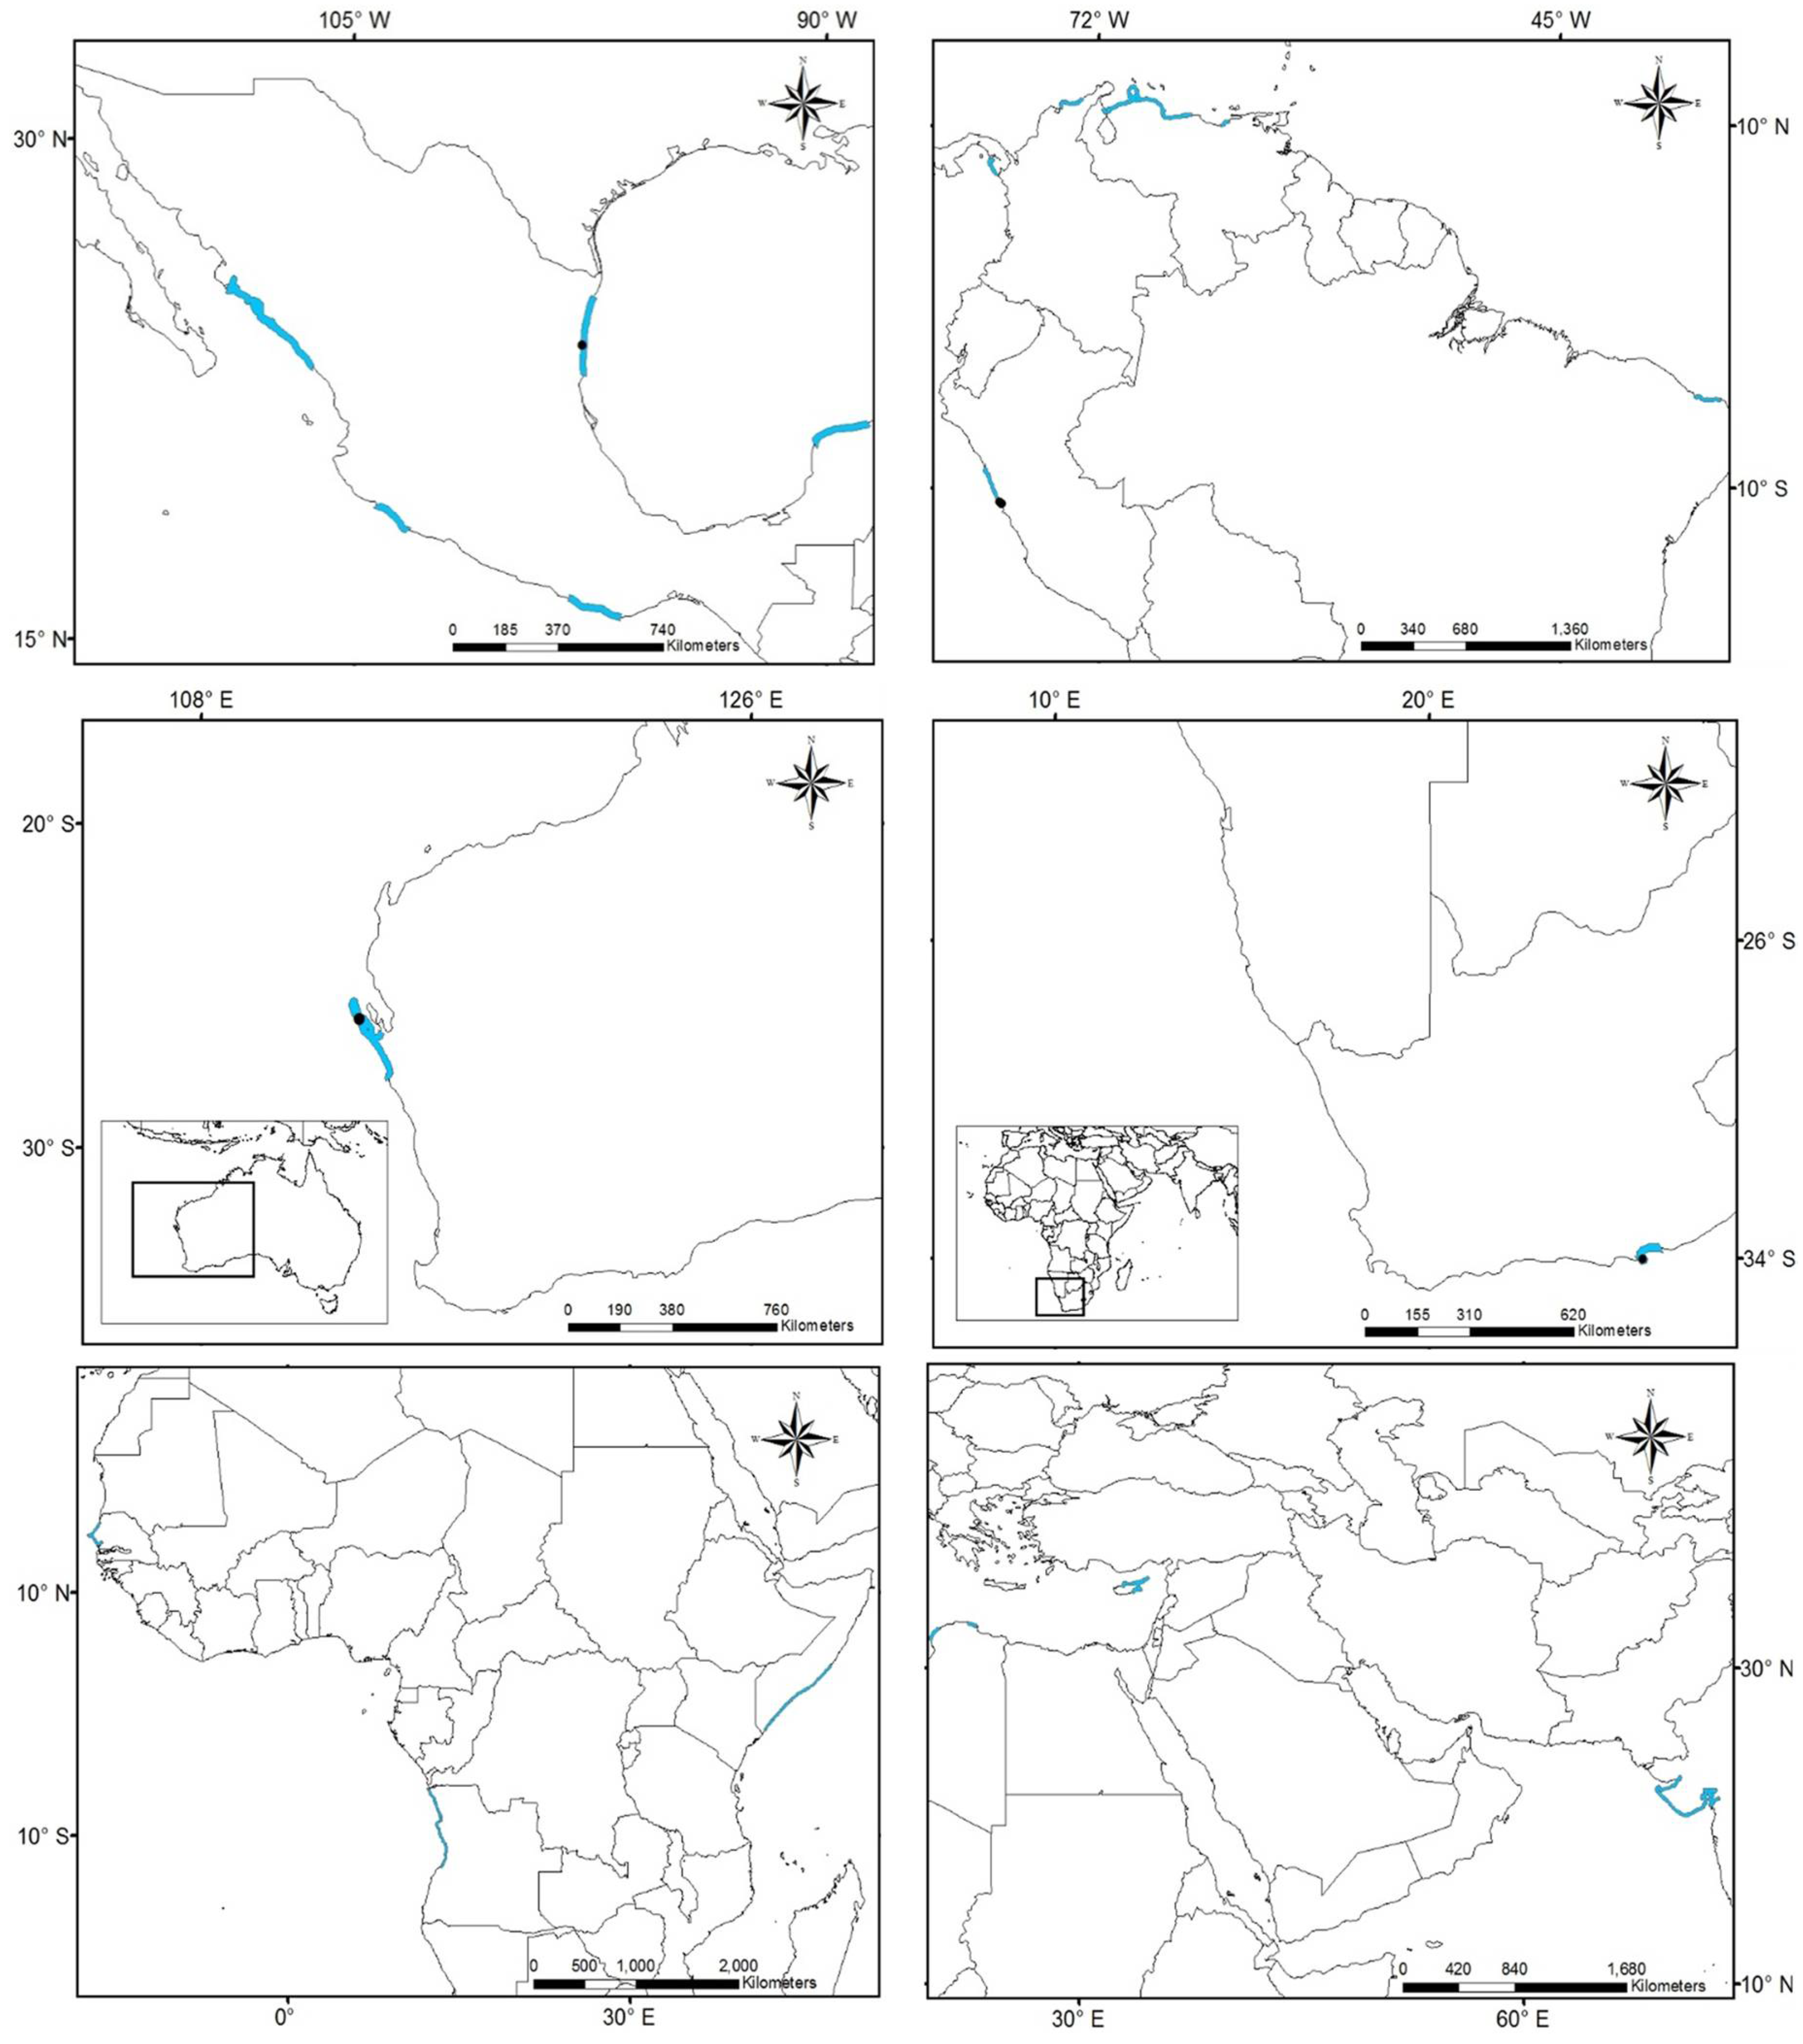
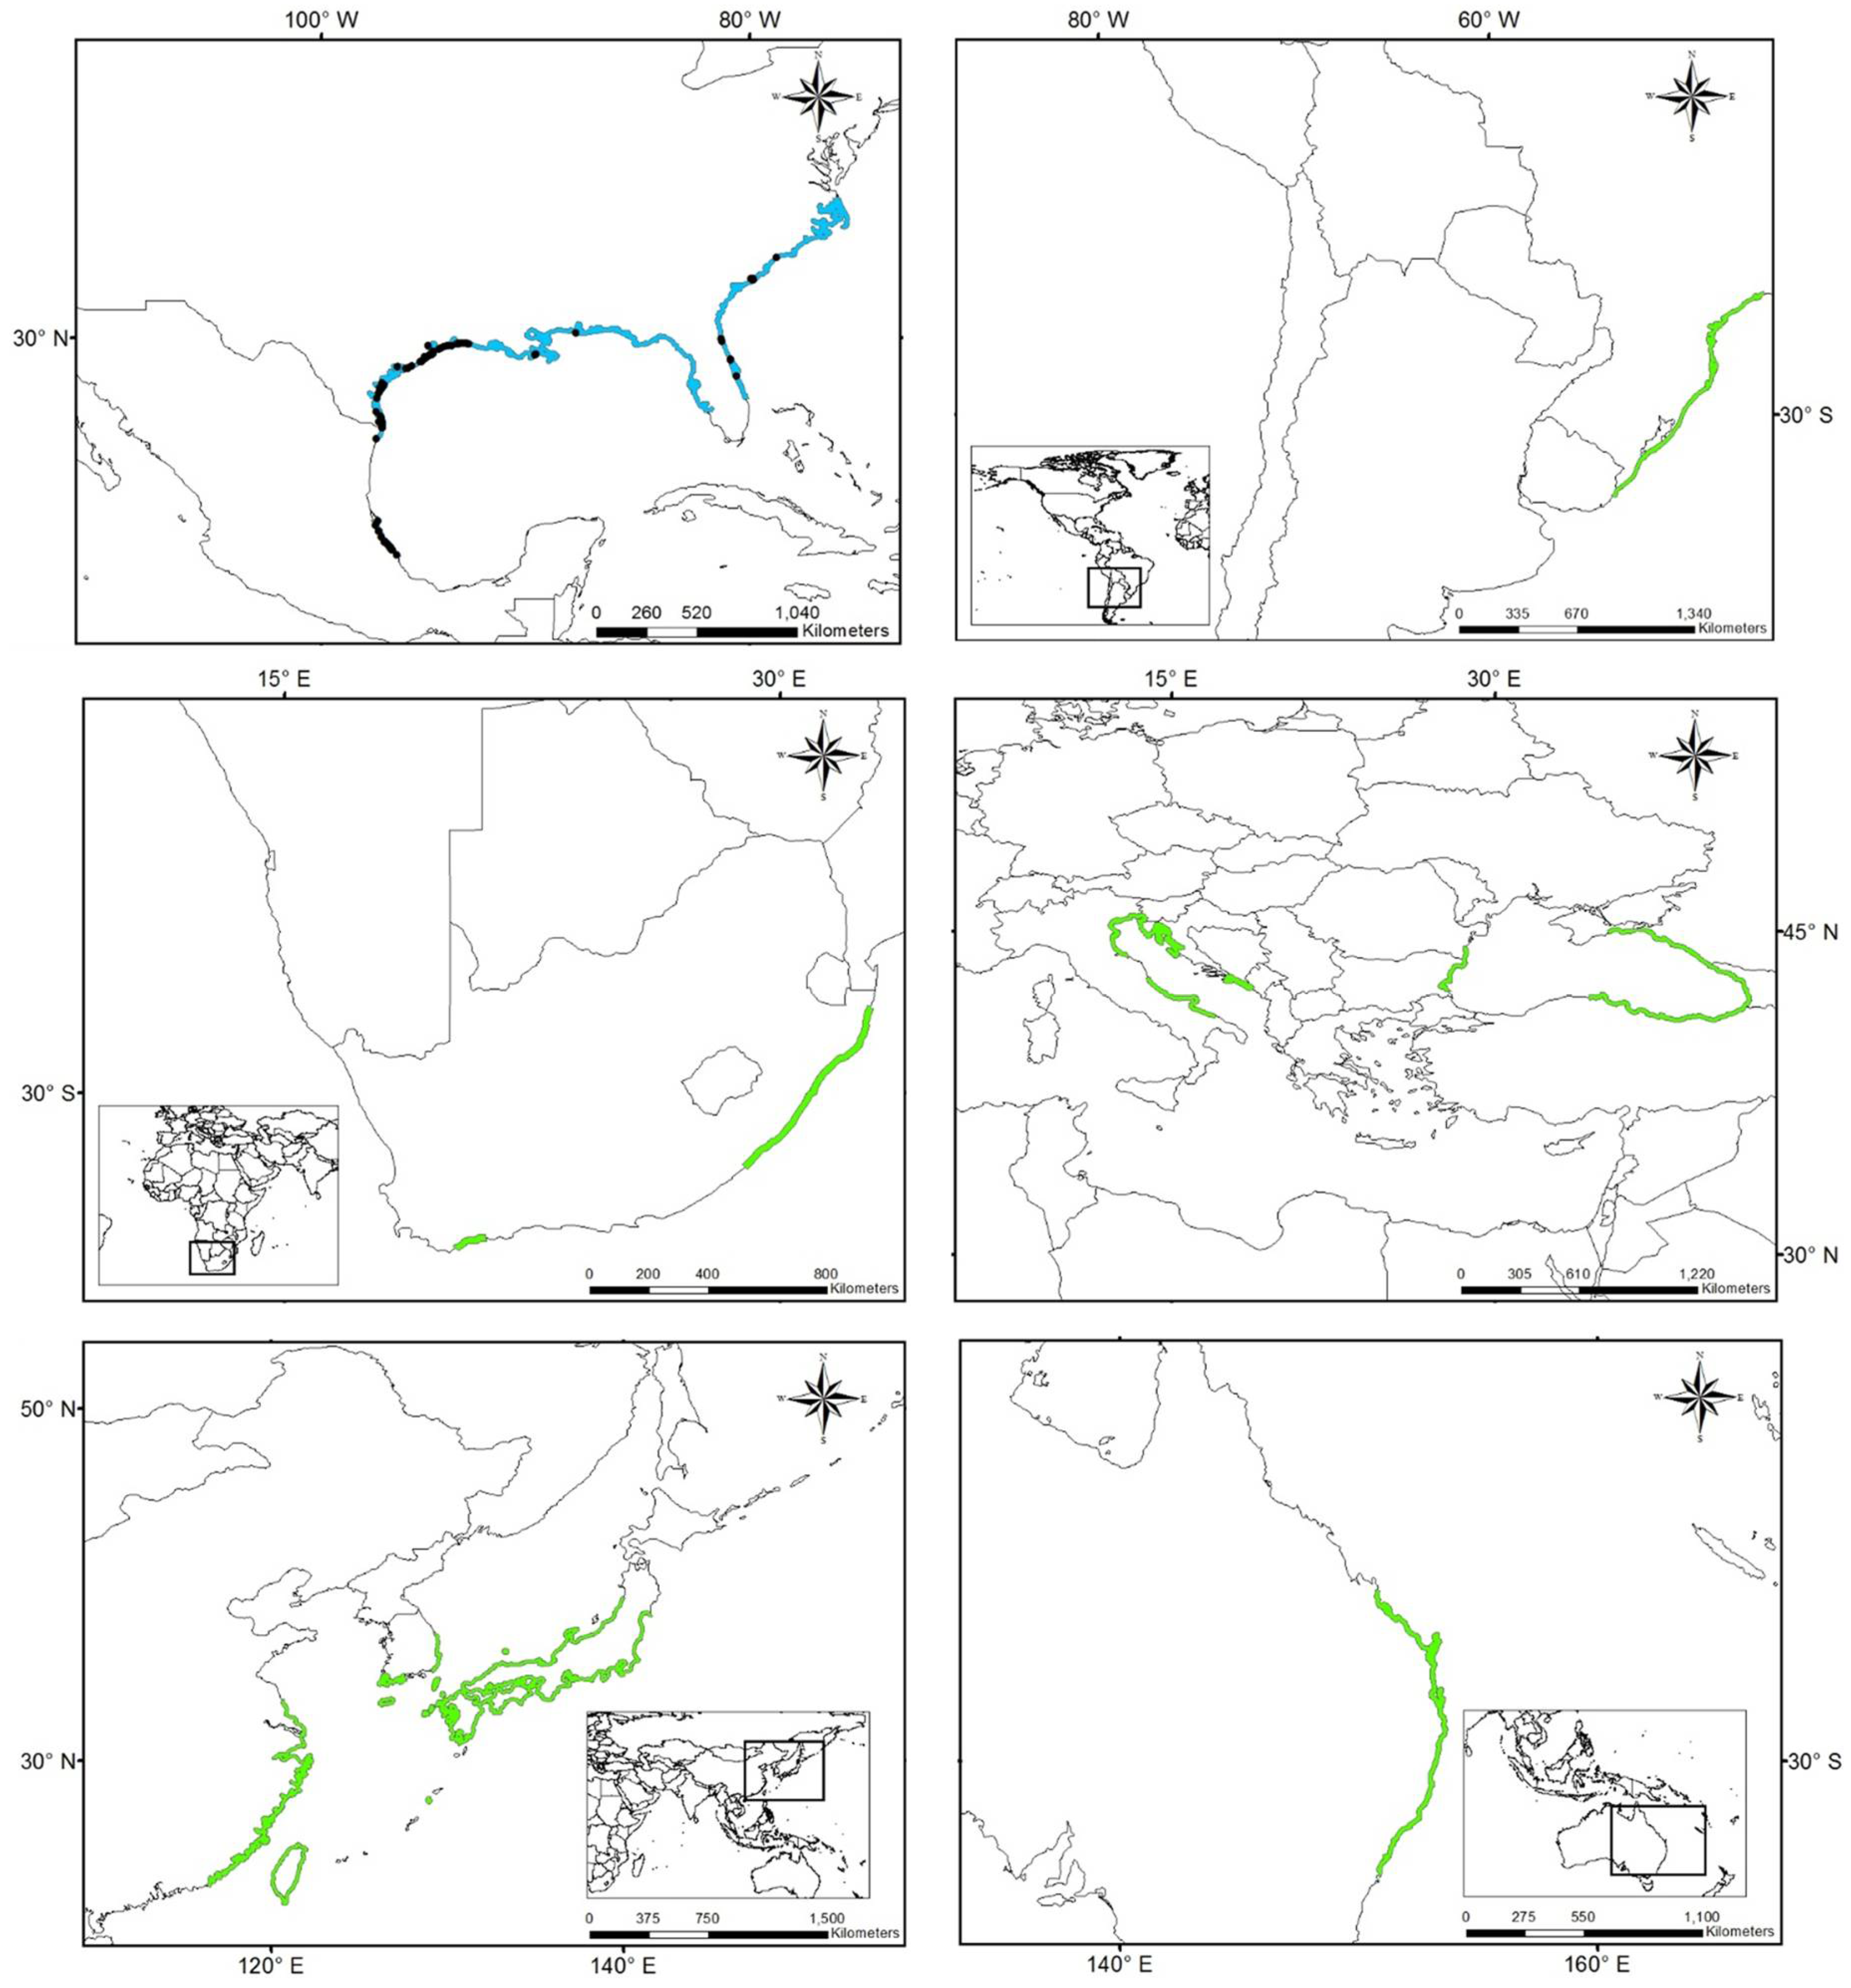
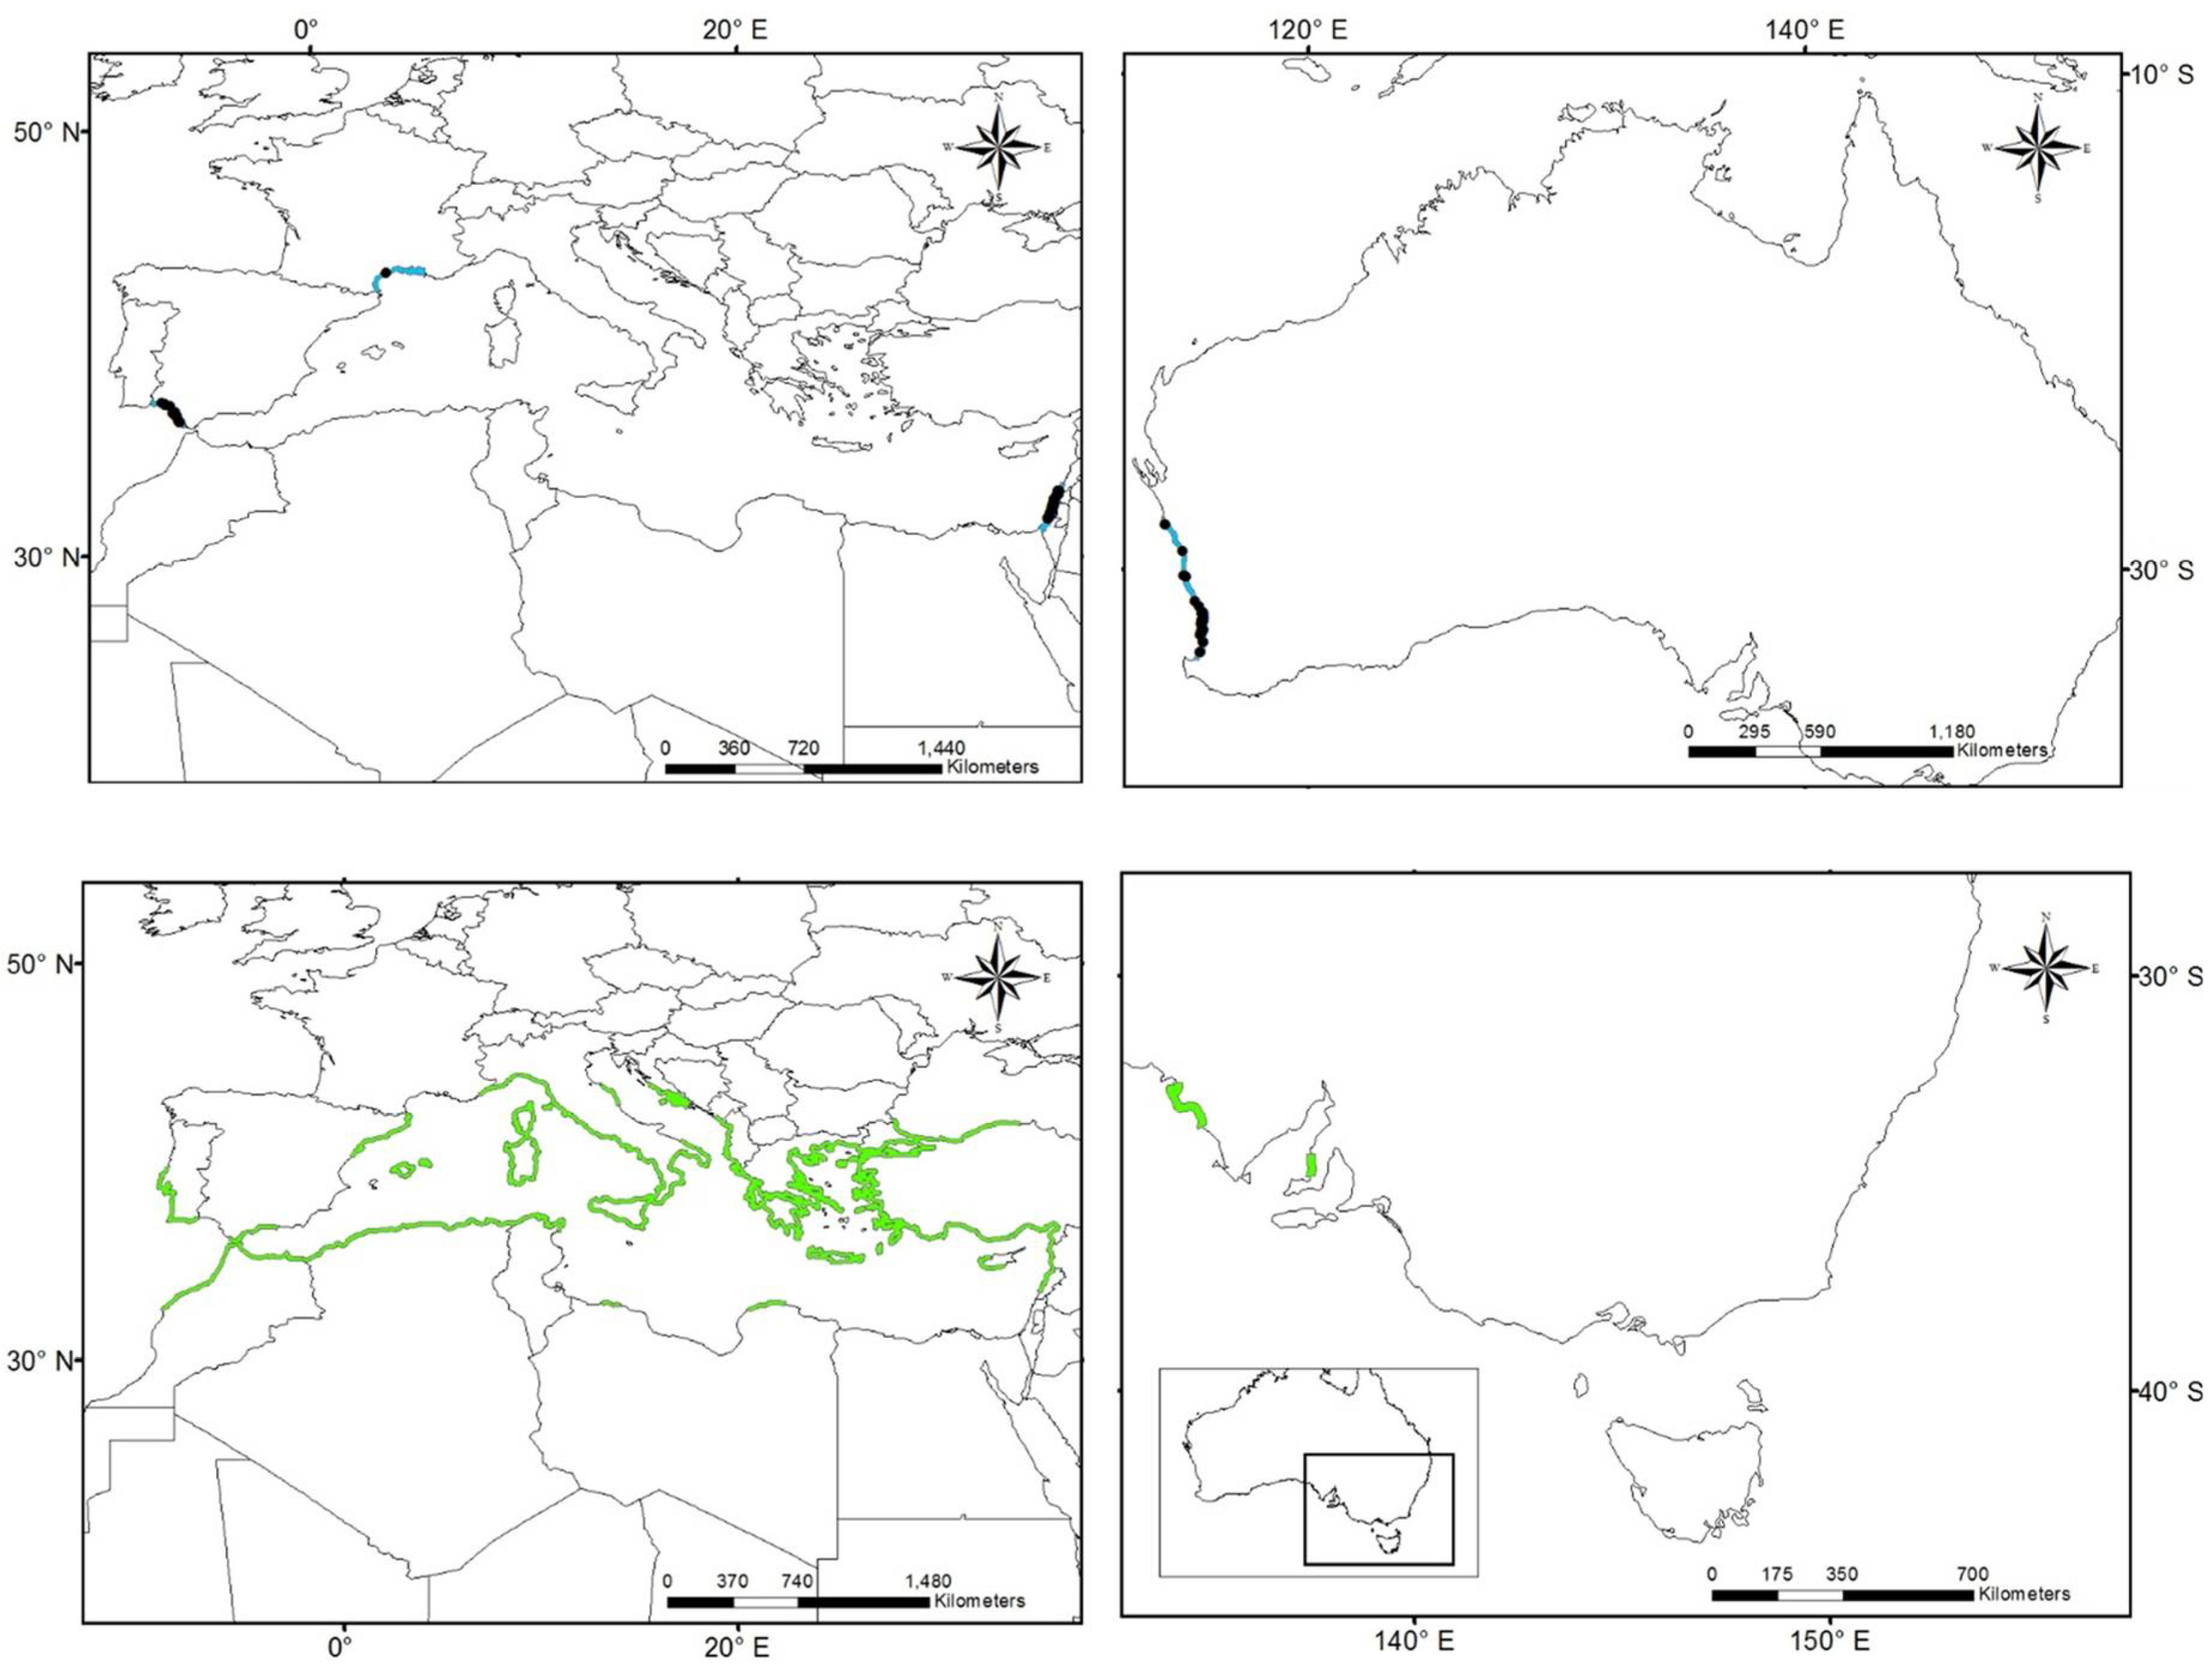
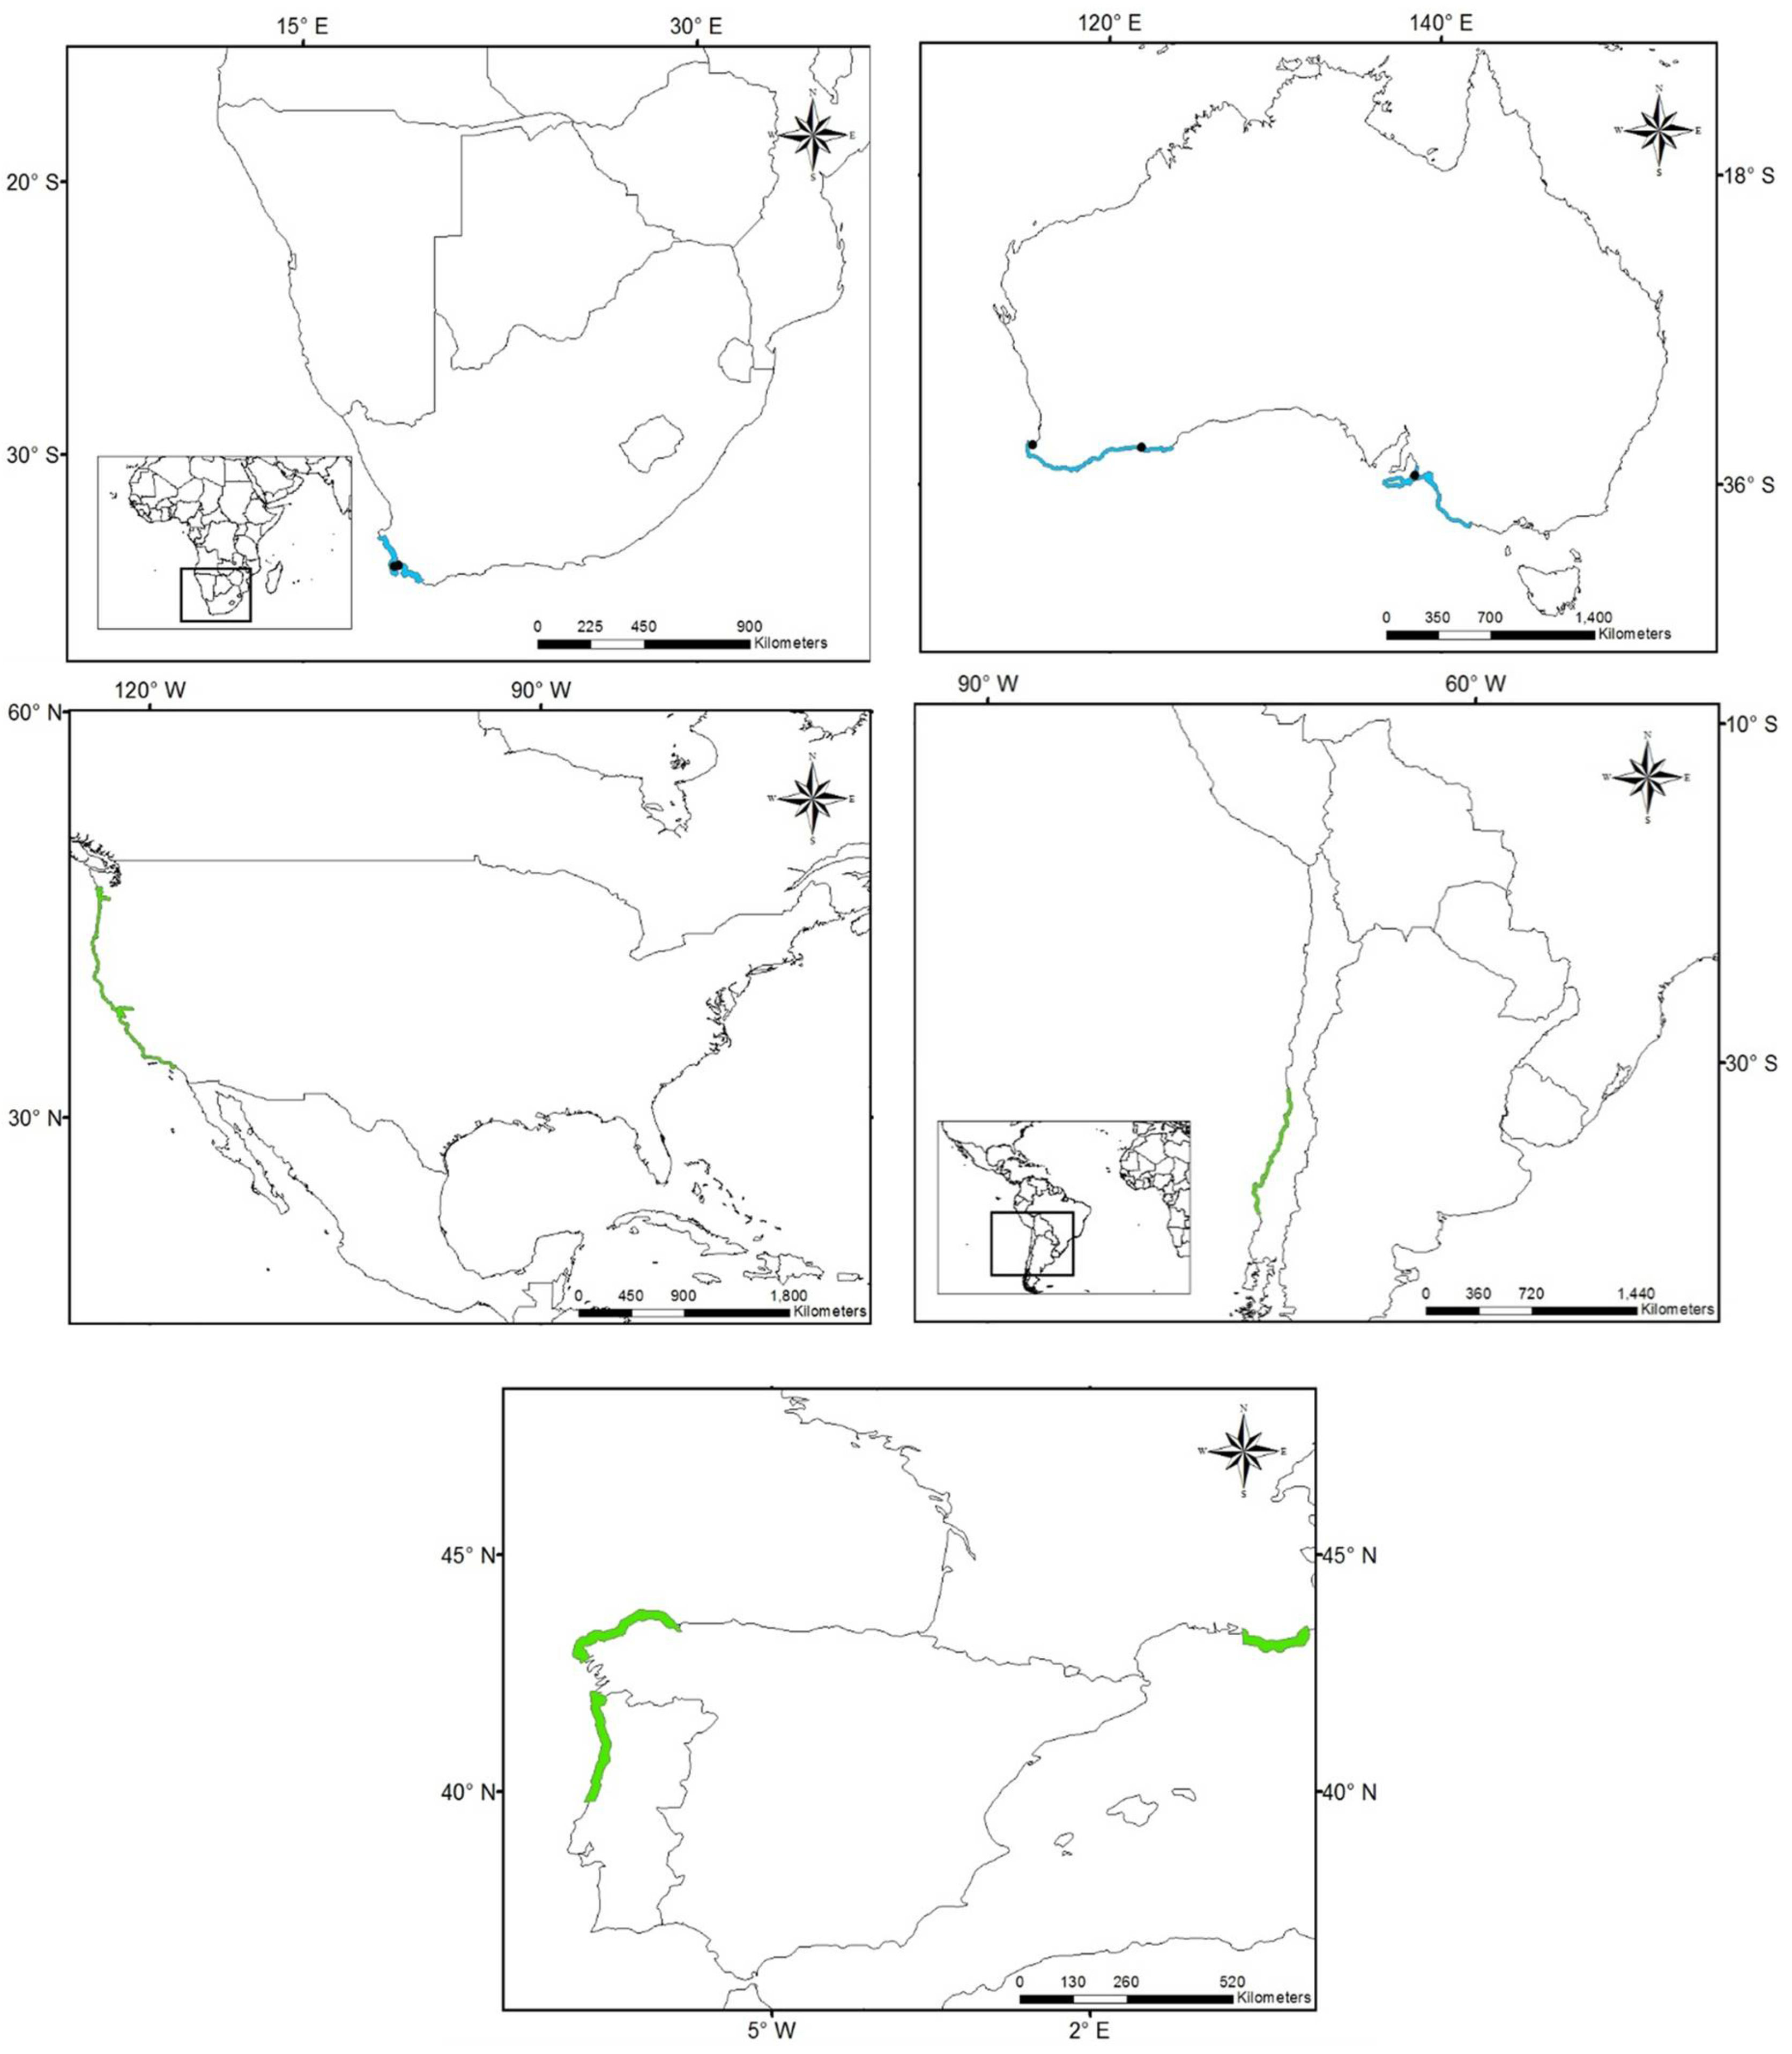
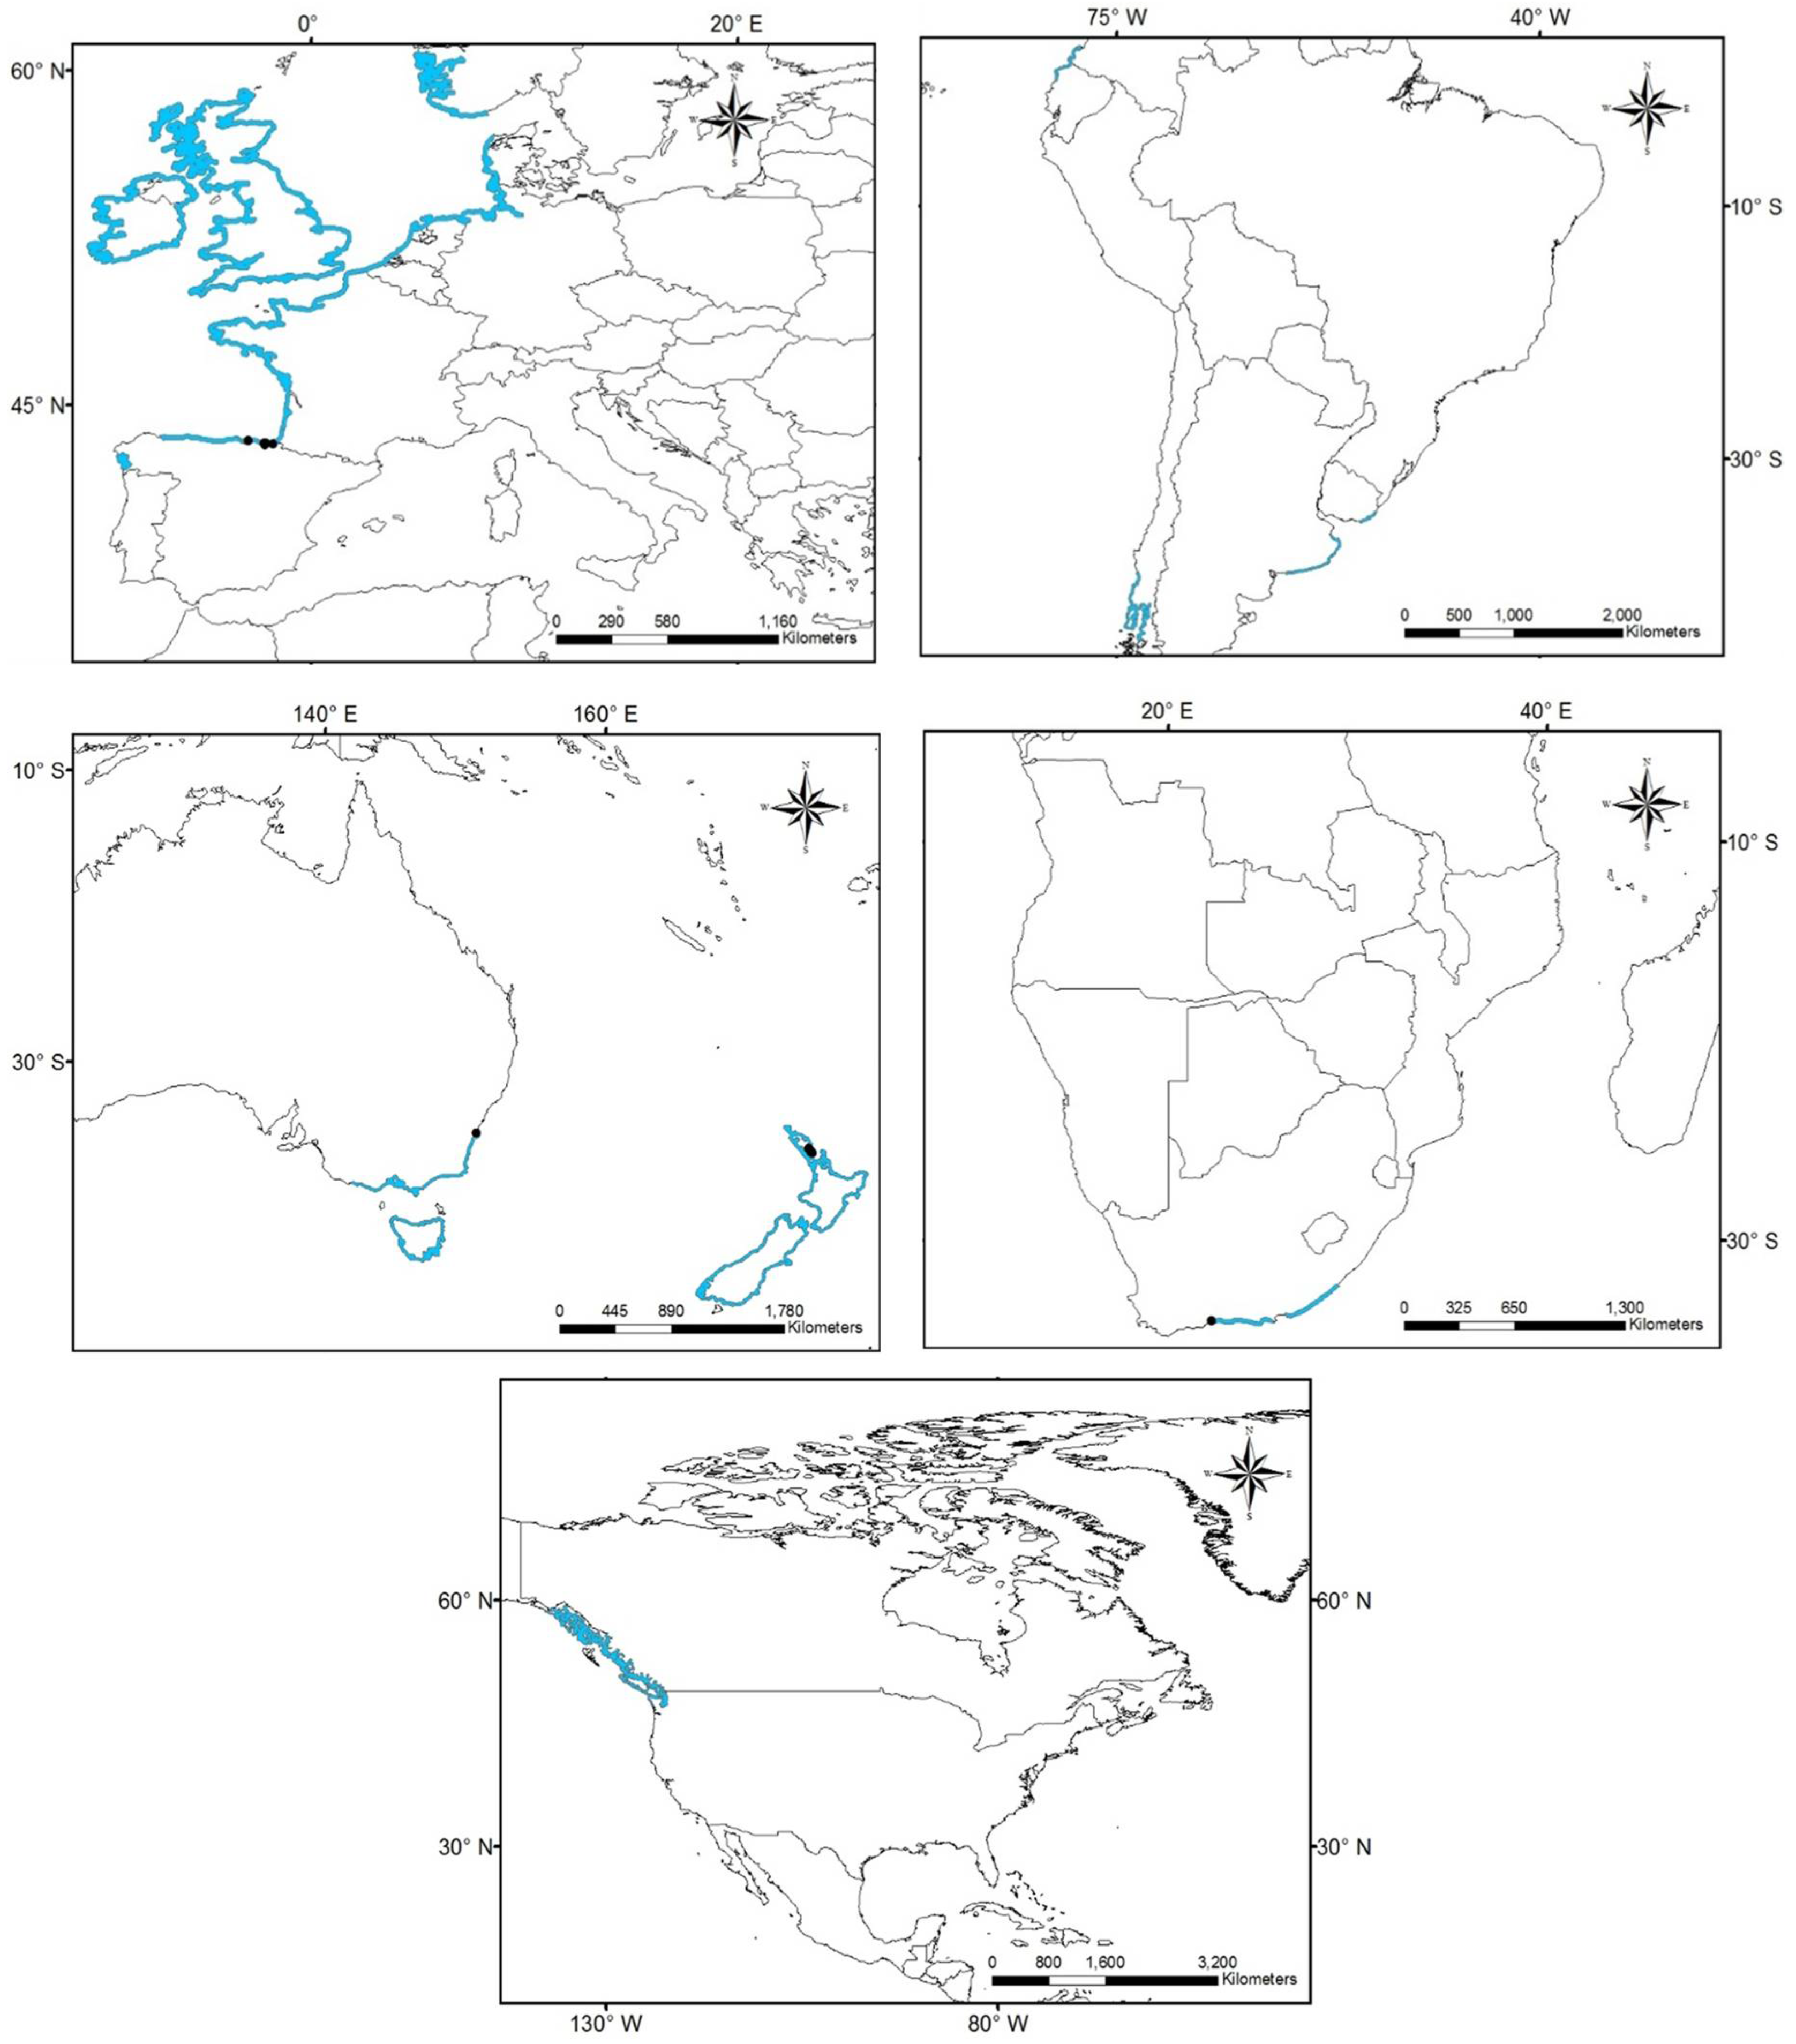
3.1. Worldwide Current Distribution

Based on the locations of O. drummondii records (n = 664) found in global databases, the occurrence record distribution found in this study is shown in Table 3. The presence records in the native-range distribution are relatively scarce and present small populations mainly located in Texas and Veracruz, followed by Louisiana, South Carolina, Florida, Tamaulipas, Tabasco and North Carolina consecutively. The native area of the species has the oldest records in the database, since the first record was documented in 1843. However, it was until 1869 that data collection was carried out continuously until 2016 (the time limit in which the records were analyzed). The earliest reported introduction occurred in 1871 in the Egypt coast, following Israel (1902), South Africa (1912), North Spain (1915), China (1924), Australia (1924 Queensland and 1947 SW Australia) and Peru (1938). The most recent records were in New Zealand (1997) and France (2014). Localities outside of the native area have been recorded on the coast of 21 regions in 10 countries (Egypt, Israel, South Africa, Spain, China, Morocco, Peru, Australia, New Zealand, and France) on the five continents. The localities of Peru and Morocco are not validated [75]. The largest number of records outside the native range is located in Australia (245) and Israel (150). All non-native records, except for Peru and NE Australia are found outside tropical areas (Figure 1), with the species reaching latitudes 44° N and 36° S.
Although information on the habitats where the species was collected is not always available, all localities were recorded in coastal areas. Of these, the vast majority corresponds to coastal dunes and frequently occurs on coastal roadsides. Oenothera drummondii is native to coastal dunes of the southeastern USA and eastern Mexico, distributed in areas with a humid subtropical climate (Cfa), hot semi-arid climate (Bsh), Tropical savanna climate with dry-winter (Aw) and Tropical monsoon climate (Am) (Table 3). We found 17 non-native regions/locations (in 10 countries) where the species is currently distributed. Of these, seven coincide with two types of climate of the native area (five with Cfa and two with Bsh). In none of the non-native region the Am or Aw climates were observed. The rest of the non-native regions are in dry-winter humid subtropical climate (one with Cwa), Mediterranean hot summer and warm/cool summer climates (five with Csa and three with Csb), Temperate oceanic climate (four with Cfb), and Hot desert climate (one with BWh). The largest number of records in non-native areas corresponds to humid subtropical climate zones (Cfa) of eastern Australia, and in the Mediterranean hot summer climate zones (Csa) of Israel and southern Spain.

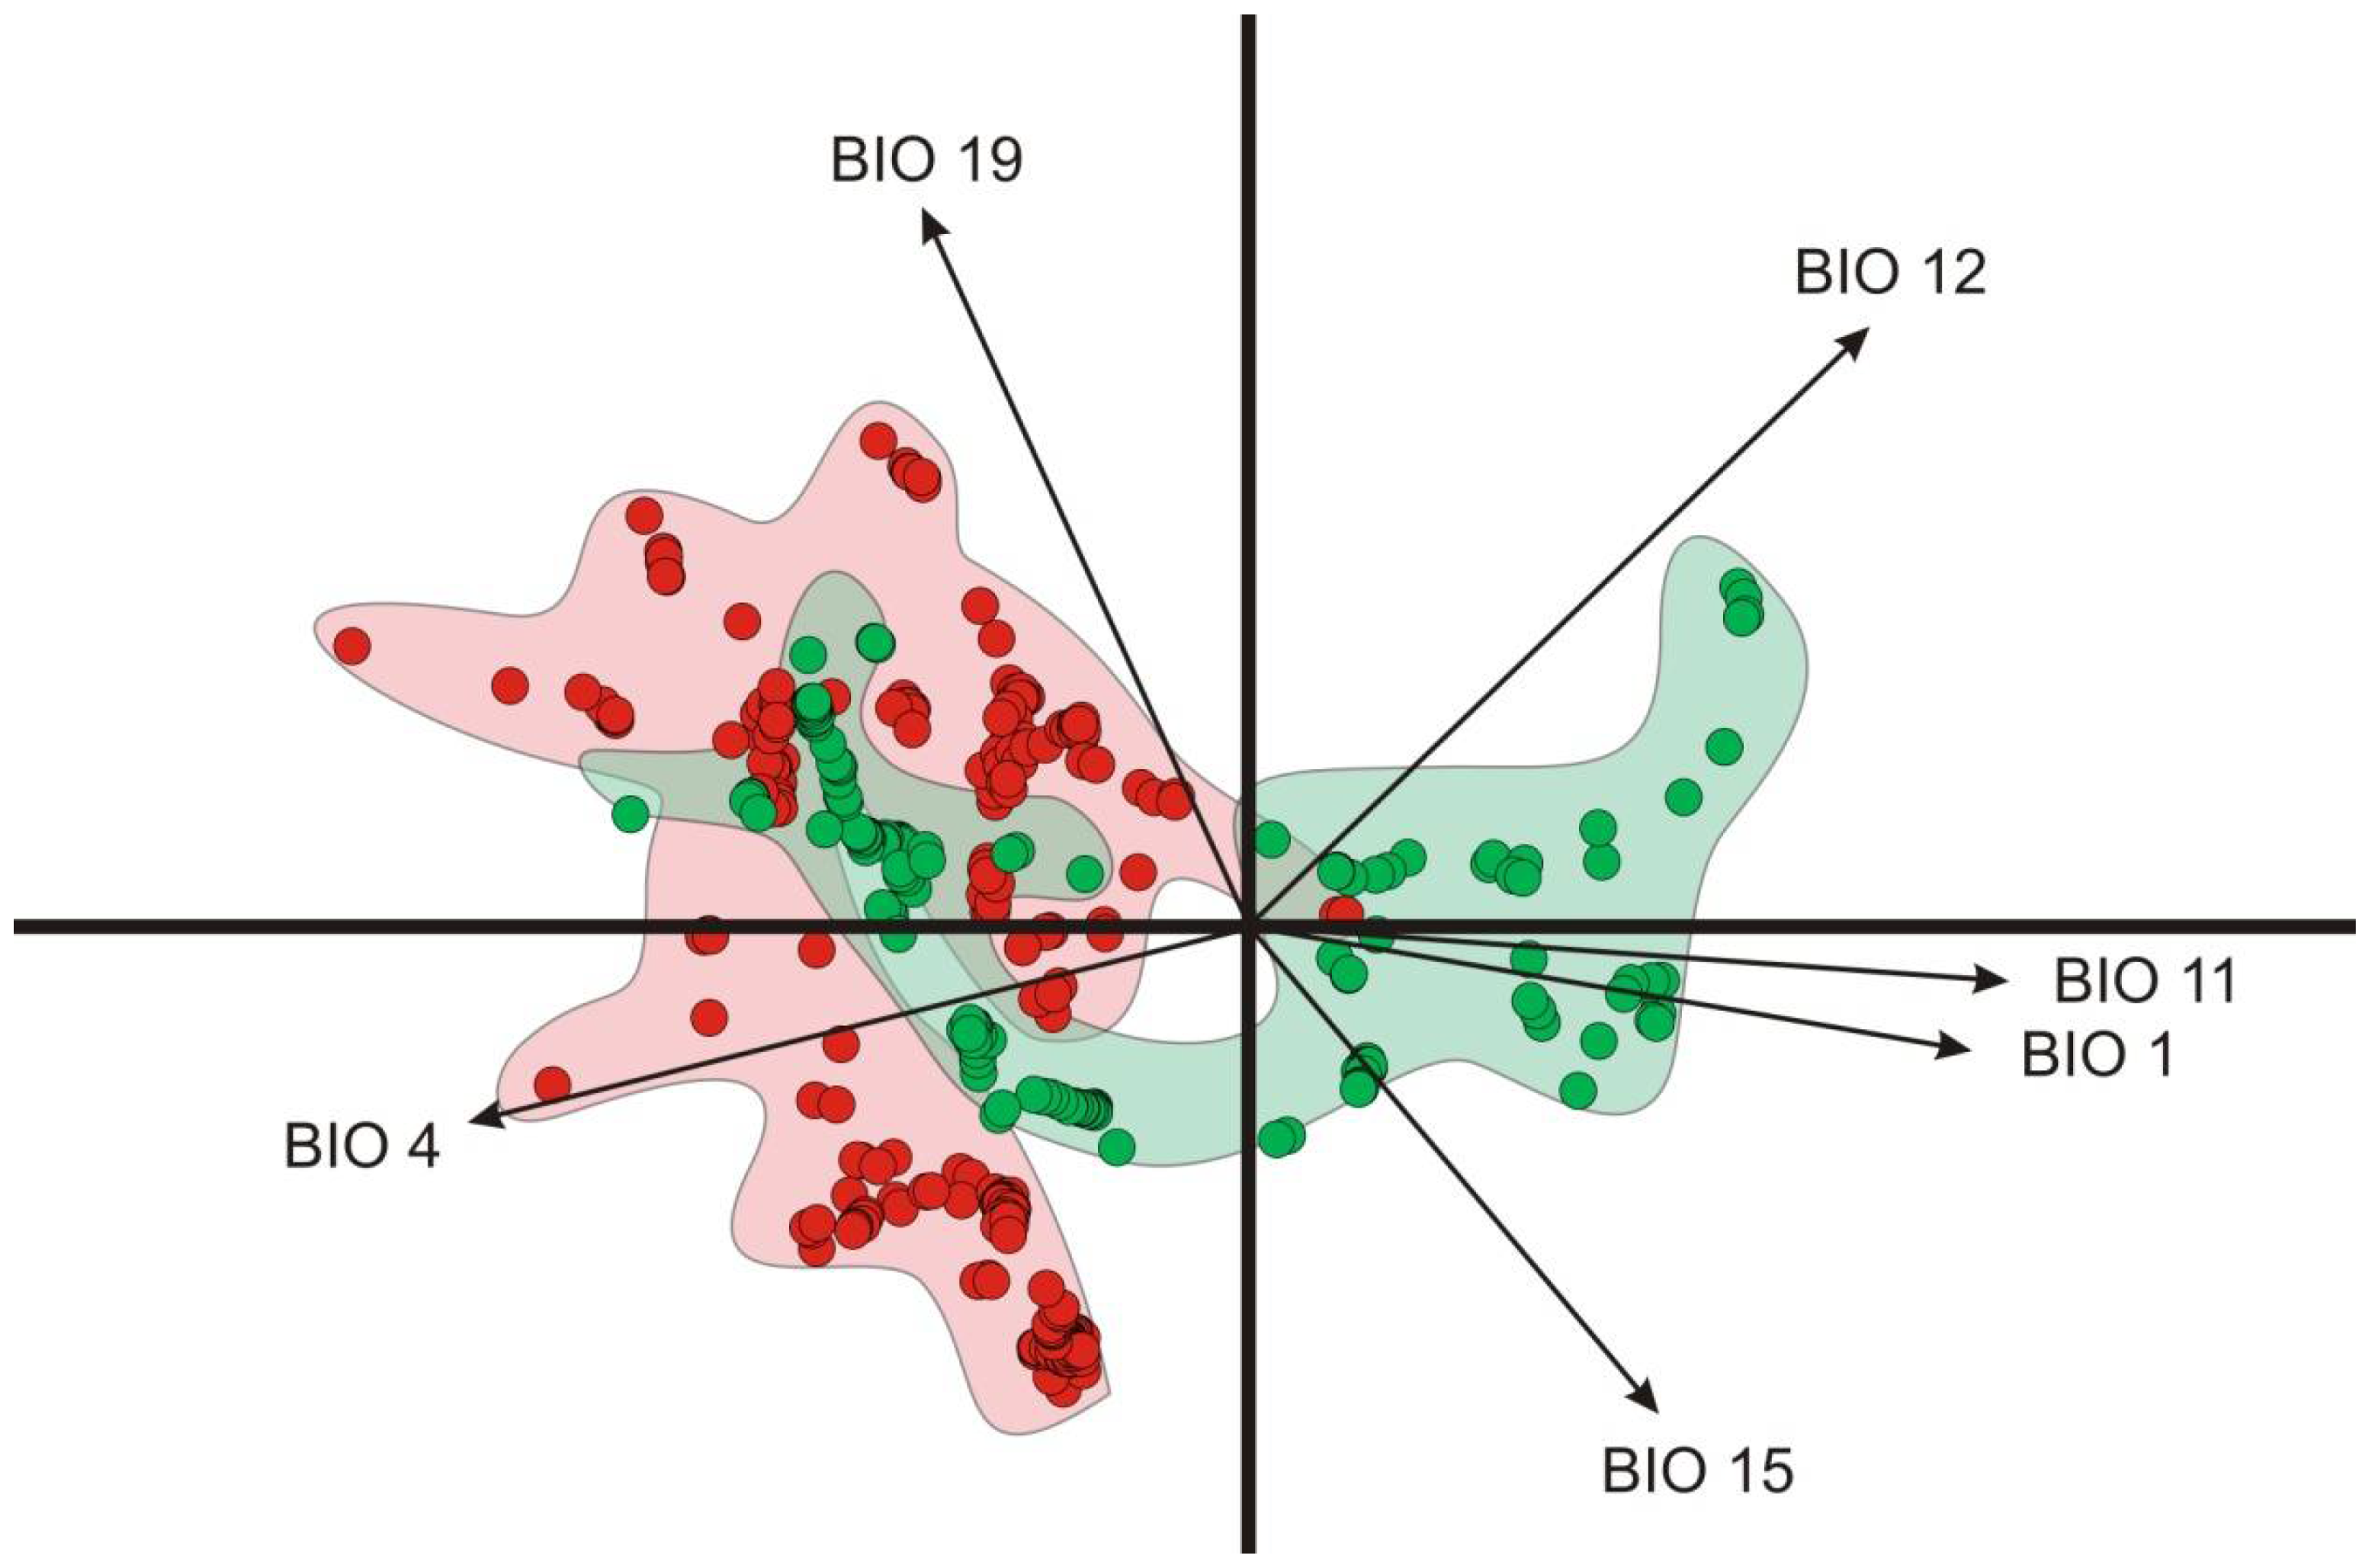
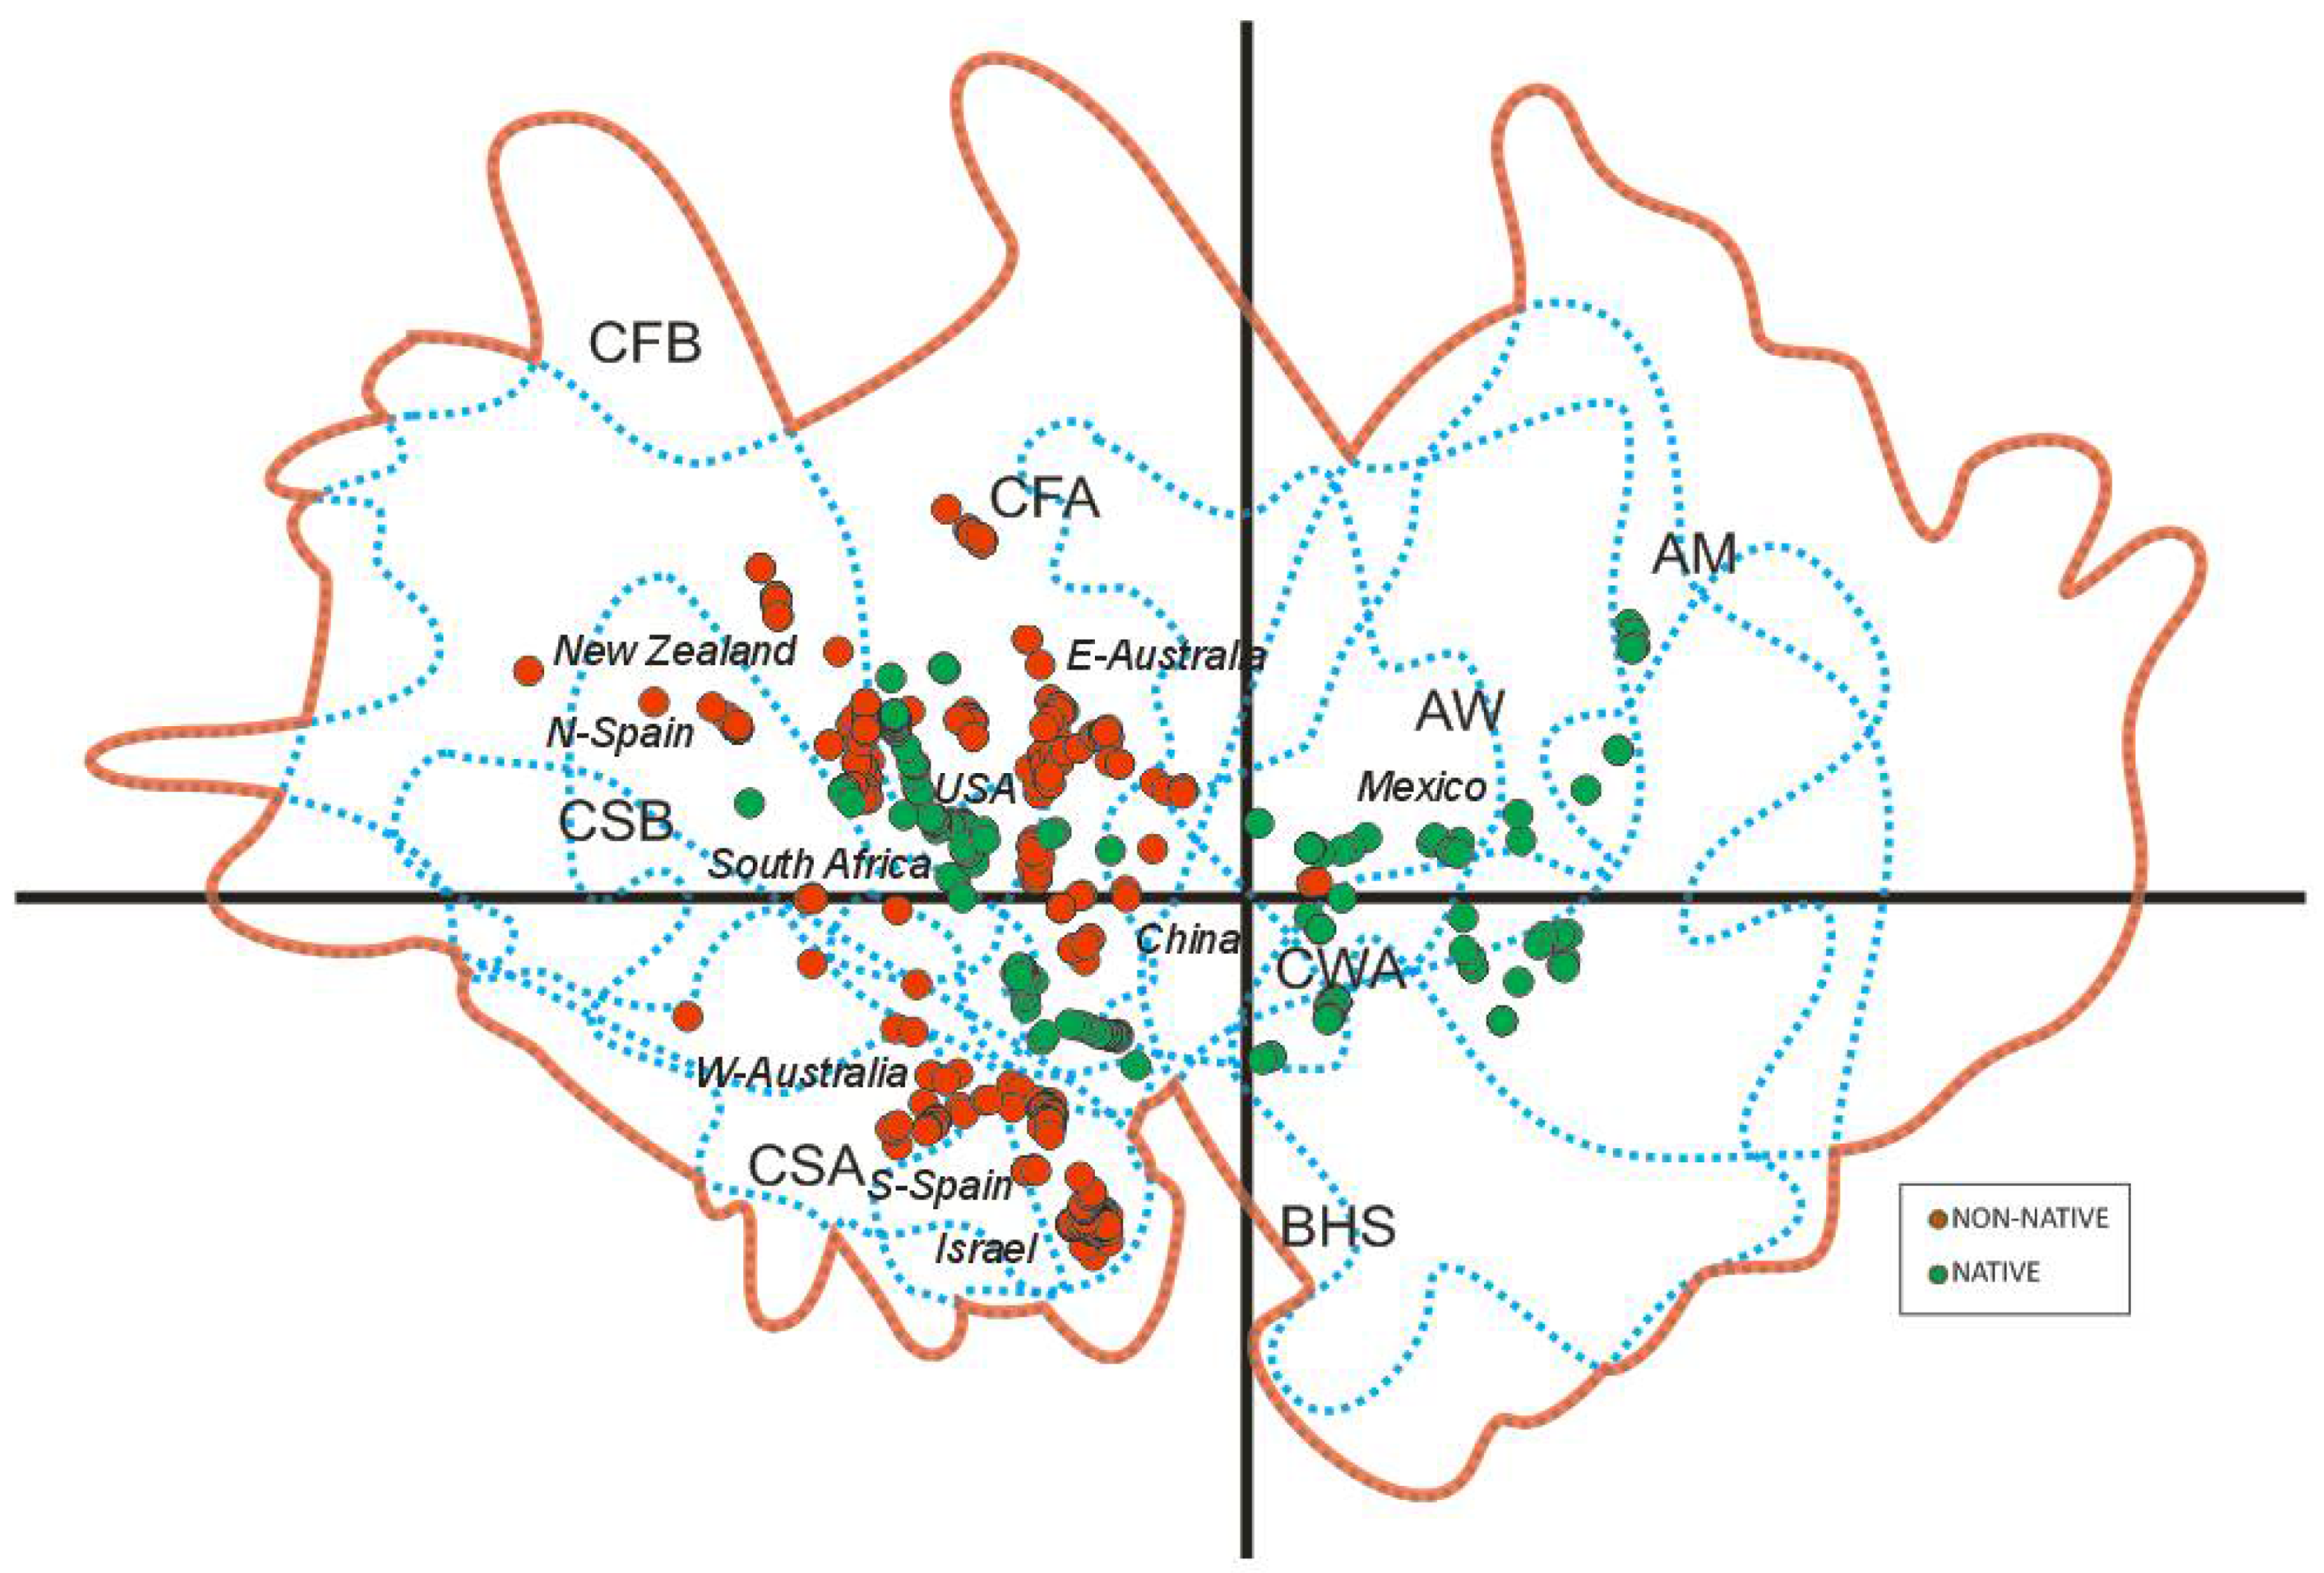
3.2. Environmental Analysis and Climatic Profile in Native and Non-Native Distribution

The climatic profile of the species using the occurrence records and the 19 bioclimatic variables was analyzed in the native and non-native environmental space. An overlapping between the two distributions can be observed (Figure 2). For the native area, the bioclimatic variables that represent the average values of this distribution are: annual precipitation (BIO12), Mean Temperature of Coldest Quarter (BIO11), Annual Mean Temperature (BIO1), and Precipitation Seasonality (BIO15) (Figure 3). For the non-native area and a fraction of the native area, the bioclimatic variables closer to the average values of these distributions are the Precipitation of Coldest Quarter (BIO19), and Temperature Seasonality (BIO4).
For the Köppen–Geiger climatic regions that occur in native and non-native distribution areas, the environmental space is very heterogeneous (Figure 4). An approximation of the fundamental niche shows a greater environmental space that O. drummondii might occupy in different regions of the world in different positions of the environmental space (Figure 4). For the eight climatic regions that occur in native (Figure 5: Aw, Am); native and non-native (Figure 5: Bhs and Cfa); and non-native distribution areas (Figure 5: Csa, Csb, Cfb and Cwa), the environmental space is distributed in very different projections on the PCA biplot (Figure 5). This is particularly observed between hot semi-arid climate (Bsh) and Humid subtropical climate (Cfa)—environments that are present in native and non-native distribution areas. The hot semi-arid climate (Bhs) divides into two clouds that separate the native areas (right quadrants) from the non-native ones (left quadrants) (Figure 5). The climates of invaded regions (Cbf, Csa and Csb climates) occupy the same quadrants of the analysis (Figure 5). However, the Dry-winter humid subtropical climate (Cwa) is closer to the environmental space of the native regions (Figure 5).
The bioclimatic variables that corresponded to the native zone in some cases are within the ranges of non-native zones. Nevertheless, all groups were significantly different (Figure 6). In general, the temperature values of the non-native areas presented lower values than the native areas and can be seen particularly in the maximum temperature of the warmest month (BIO5), in the mean temperature of the wettest quarter (BIO8) and in the mean temperature of the warmest quarter (BIO10) bioclimatic variables. However, the values of the mean temperature of coldest quarter (BIO11) in the invaded area are found within the lower limit of the native zone (Figure 6a). Regarding precipitation, the main differences between native and invaded areas are shown in the distribution of the data in each group, where the medians of the annual precipitation (BIO1), precipitation of the driest quarter (BIO17) and the precipitation of the warmest quarter (BIO18) are lower in invaded areas (Figure 6b).

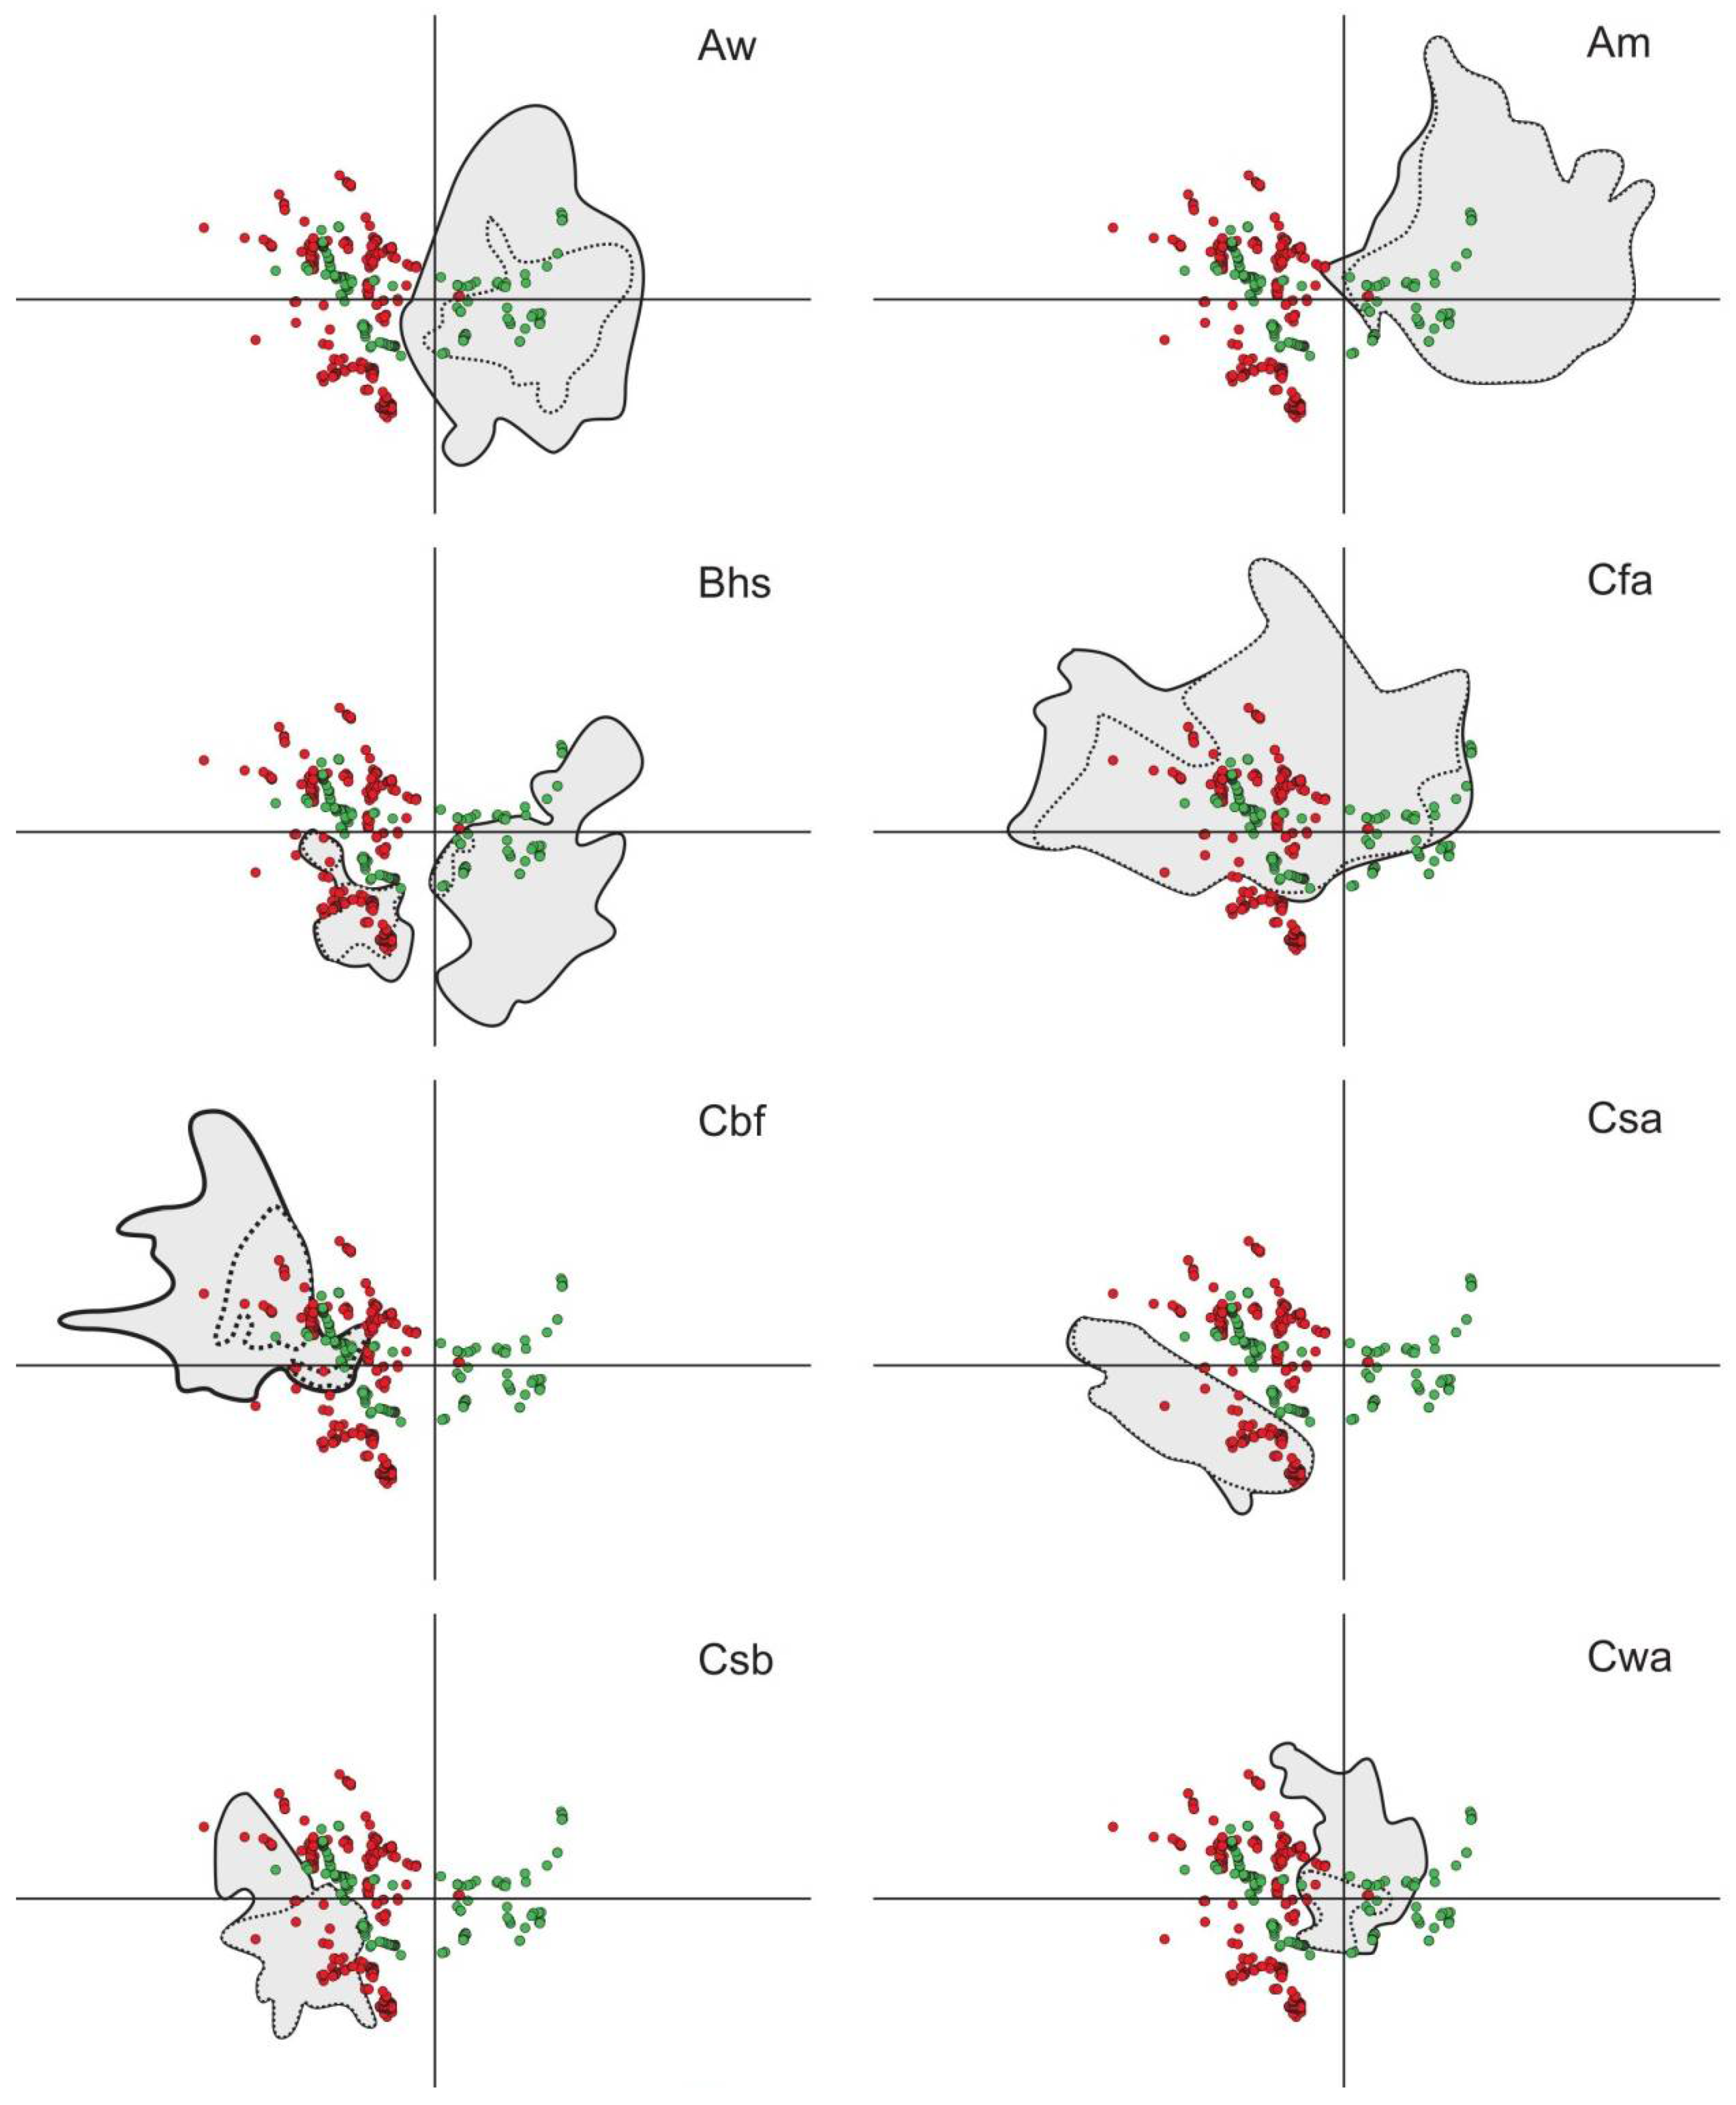
3.3. Potential of Invasion

Approximately 215,641 km2 were obtained as areas of potential distribution of O. drummondii on the coasts of the world (Table 4). Tropical monsoon climate (Am) is the climatic region with more potential distribution area for the species, which represents 37.2% of the total area of presence in the different regions. This is followed by Mediterranean hot summer climates (Csa) with 22.7% and Humid subtropical climate (Cfa) with 18.1%. In contrast, temperate oceanic climate (Cfb) and Tropical savanna climate with dry-winter characteristics (Aw) showed the higher percentages of absence between all climatic regions.
Within the American continent, in addition to the native zone, we obtained favorable climatic conditions on the west coast of the United States (Figure 7a). In Central America, several areas of potential invasion were identified along the coasts of Salvador, Honduras, Nicaragua, Costa Rica, and Panama (Figure 7b). In South America the areas of potential invasion correspond to a small fraction of Venezuela, Colombia; southwestern Peru and southeastern Brazil, Uruguay and the southern coasts of Chile (Figure 7c,d). In Europe, the areas of non-native presence include the coasts of the north and south of Spain, south and west of Portugal, France, Italy, Greece, Turkey and Bulgaria (Figure 7e,f). For Asia, non-native ranges are found on the coasts of Israel, western India, western Myanmar, Bangladesh, Thailand, Cambodia, southwest and northeast Vietnam, China, Taiwan, Philippine Islands, southern Japan and Indonesia (Figure 7g,h). Several areas were located in Australia and in northern New Zealand (Figure 7i,j). Finally, in Africa the coasts of Morocco, Algeria, Tunisia, Libya, Guinea, Sierra Leone, Ghana, Nigeria, Cameroon, Equatorial Guinea, South Africa, Mozambique, and Madagascar presented potential areas of invasion (Figure 7k,l).

3.4. Model Evaluation

According to the ROC and partial ROC curve values, evaluation indicated a good performance of the model (Table 5). The Tropical savanna climate with dry-winter characteristics (Aw), Humid subtropical climate (Cfa) and Temperate oceanic climate (Cfb) showed AUC values close to one in the ROC curve and AUC values close to two for the partial ROC (p < 0.001). In the Tropical monsoon climate (Am) and hot semi-arid climate (Bsh) we also obtained AUC values of the ROC curve close to one indicating a good performance of the model. Although, the models for Mediterranean hot summer climates (Csa) showed AUC values of the ROC curve close to one, in the partial ROC were not different from a random model. Dry-winter humid subtropical climate (Cwa) and Mediterranean warm/cool summer climates (Csb) did not present test points (due to the low representativeness of points in the area), therefore they could not be evaluated.

4. Discussion

A considerable expansion of the distribution of O. drummondii from its native range in a regional scale in the Gulf of Mexico to its non-native distribution on a global scale in the coastal areas of the five continents was identified. The species distributes in the same habitat type (sand dunes). However, it has colonized new areas with different climate from its native area of origin (without climate matching). The expansion process has occurred since the late 19th century to the present day unintentionally by man, establishing both naturalized and invasive populations. The species is native to areas of humid tropical and subtropical climates, and has spread to coasts of colder climates (Cfb) and colder and drier climates (Csa, Csb). The climate space of an invasive species is not static in space or time, frequently occupying climatic conditions that differ substantially from those present in the native range. This suggests that new conditions are not an obstacle for these species to spread to a new range. Our observations coincide with the findings of Gallagher et al. [83] who analyzed 26 exotic species, wherein 20 extended their exotic climate range into a new environmental niche different to native distributions. According to our results, the approximation of a fundamental niche is made of an environmental space of the native area, in addition to the environmental space of the invaded area and the partial overlap between realized native and non-native climate niches. Climate matching between the native and non-native ranges is not expected to occur in the Köppen–Geiger climatic regions, especially in the non-native distribution, where there are new climatic regions that don’t match with the native distributions. Although it is desirable to have more detailed climatic data to better understand the climatic tolerance of the species or fundamental niche by experimentation, the approach that was used herein allows us to approximate its fundamental niche.
Regarding climate conditions, temperature is a fundamental variable for the germination and survival of the species. For instance, higher temperatures from 25° to 30 °C and lower than 10° are very limiting for germination (personal observations). For this reason we selected temperature seasonality (BIO4), the annual mean temperature (BIO1), maximum temperature of the warmest month (BIO5) and mean temperature of the coldest quarter (BIO11). Seedling establishment is linked to precipitation in such a way that precipitation seasonality (Bio15), mean temperature of the driest quarter (Bio9), mean temperature of the wettest quarter (Bio8), precipitation of the wettest month (Bio13) and precipitation of driest month (Bio14) were selected among the relevant variables. Furthermore, the precipitation variables related to the temperatures that favor or limit the species during growth were selected as the precipitation of the hottest quarter (Bio18) and the precipitation of the coldest quarter (Bio19).
Studies carried out in southern Spain showed that O. drummondii is very well adapted to the Mediterranean climate (Csa), showing that the species has greater efficiency in the use of water, light and nutrients than the native Achillea maritime [84]. This validates that the projection of our models in this area coincides with the distribution found in the field. Also, in drought simulation greenhouse experiments with native and non-native populations, O. drummondii showed that individuals from both types of populations are capable of coping with high levels of water deficits (i.e., long warm and dry Mediterranean periods), and present a good recovery after rewatering [85].
A significant difference (p < 0.001) between bioclimatic variables was observed for all the groups. However, for some variables, the non-native distributions occurred within the variability of native distributions and vice versa. Regarding the environmental space in PCA biplots for Köppen–Geiger climatic regions, there is a greater discrepancy between the climatic space of the native and non-native distributions. For instance, four novel regions were found in invaded zones (Csa, Csb, Cfb, Cwa). Liu et al. [86] observed that the native and invaded niche of invasive species with wide distributions, such as O. drummondii, exhibited more similarity among them than the observed for species with narrower distributions. However, our results showed important differences between the native and non-native space. This might be related to habitat where the species distribute (coastal sand dunes), and where particular environmental conditions occur.
Oenothera drummondii is a species that presents wide dispersal mechanisms (polycoria) that have allowed it to colonize different coastal areas of the planet and establish both naturalized and invasive populations [39]. Studies performed in southern Spain indicate that the successful invasion of O. drummondii is mainly explained by some features that are considered advantages for the colonization of new habitats [87]. On a local scale, the reproductive characteristics of the species, a mixed-mating system, allows the flowers to interact with the local fauna (bees and sphinxes) [40]. It also has a high production of small seeds, and has established mutualistic seed dispersal relationships with native hares and rabbits [39]. Other characteristics such as a short juvenile period, high-flowering capacity during almost the entire year [87], a high competitive capacity against native species [84], and its tolerance to soil salinity and water stress [85,88] are also important. Under Mediterranean conditions, O. drummondii is well acclimated considering its ecophysiological performance related to the capture of resources such as CO2 assimilation, higher photosynthetic rate, and a higher efficiency to use light, water and nutrients than other native species [84]. Latitude also performs an important role in self-compatibility and germination (rate and final germination), which are reduced in lower latitudes, and increase in higher latitude for both native and non-native distributions. The Australian populations studied in Gallego and Franco [40], showed rates of self-compatibility similar to those of other non-native populations and native populations located at similar latitudes. Therefore, these reproductive characteristics may contribute to the successful invasion of O. drummondii in non-native areas [40]. At global scale, it is possible that the introduction of O. drummondii from its native areas has been as stowaways in the ground-ballast of merchant shipping. There are two documented examples of this type of transportation. Heyligers [47] proposed that the introduction of O. drummondii, and other non-native species, in Australia was related to long distance transport in the ground-ballast of ships coming from Texas ports for the coal trade during the beginning of the 1850s. The ships in the port of origin loaded the ground ballast, and if they were surrounded by coastal dunes, the ballast was composed of sand, but also included seeds, fruits, whole plants and even terrestrial animals. Arriving to the ports of Australia, ships discharged unwanted ballast on the shore (ballast heaps). Heyligers [47] also proposed that the subsequent expansion of the species along the east and west coasts of Australia was probably related to natural dispersal processes and transport by ship from Australian ports. Frean et al. [45] in a study on the expansion in South Africa of 13 species of the genus Oenothera, including O. drummondii, proposed that the seeds of the species reached Southern Africa in ballast ships. Campos and Herrera [78] in the case of Spain and Dufour-Dror [42] in Israel also proposed this mode of introduction, although they did not provide data.
The unintended transport of plant species, and of many living terrestrial organisms, into the ship ground or sand ballast has been a dispersal pathway of great qualitative and quantitative importance since the beginning of maritime trade, especially when it intensified in the fifteenth century [89]. Reports of the introduction of alien species from ground ballast in North America, Oceania and Europe were published mainly from the end of the 18th century to the beginning of the 20th [90]. However, since then, these types of studies have been scarce [47,89,91]. At present, it is very likely that the extreme long-distance dispersal pathway is not working for O. drummondii any more [41], because the pathway has disappeared due to the disuse of ground ballast in the middle of the 20th century. We consider that it is difficult, due to the great distance involved, and that the introduction has occurred naturally through seawater dispersal of seeds. Other options such as stowing away on a ship and even being transported directly as an ornamental species can also be considered.
The species may also have been transported by marine currents during ocean storms, as the seeds have been shown to survive in seawater for 15 to 30 days and still have a high germination capacity (67–90%) [39]. This would explain the success of the species in its non-native distribution, as the seeds could be transported from the areas where the species has been introduced to other areas near the coast. The same process could occur in the native zone although controlled by natural predators and competitors. However, the first records of non-native Oenothera drummondii populations suggest that its expansion was not due to a natural process of long-distance dispersion, but to unintended introductions made by man over decades [41].
In the actual globalized world, expansion of the species might have been sub estimated in this work. With considerable human movement to almost any part of the world, the chances that the species will reach new suitable conditions are increasing. For example, we could not validate some records of possible distribution not used in the analysis, such as findings in Peru, Argentina and Netherlands [92,93,94,95]. This has been confirmed by Gallego-Fernández et al. [41] who demonstrated that the seeds can float, but do not appear to be capable of transoceanic dispersal by themselves. However, it seems that the high capability of this species to tolerate climatic conditions is considerably different to those in its native range, providing for the high success of colonization in different environments. Therefore, the fundamental niche might be much greater than the approximation we know in the realized native and non-native niche.
Oenothera drummondii can have an impact in the native vegetation of the invaded sites. Gallego-Fernández et al. [41] showed that this species reduced species’ richness, biodiversity, and the abundance of keystone native species on sand dunes in the south west of Spain [13]. This is very important to consider in invasion areas in order to promote monitoring and mitigation actions. These strategies need to consider the heterogeneity of the beach-dune gradient, and the different climate types where the species can thrive. Few studies have looked into the eradication of O. drummondii in non-native areas. In Spain, efforts have been made to eradicate the species with successful results through manual grubbing [96,97]. However, this method is not viable in highly invaded areas or in areas with compact soils that make total removal difficult [11,98], and the use of herbicides is not recommended [11,99]. The identification of potential invasion areas allow researchers to propose control and eradication measures prior to a generalized invasion [11].

5. Conclusions

The current geographical distribution of Oenothera drummondii is very extensive as it is registered in the countries of USA, Mexico (as native distribution), and Egypt, Israel, South Africa, Spain, China, Australia, Morocco, Peru New Zealand, and France (as non-native distribution). Its expansion has been very wide due to the new non-native range, even greater than its native distribution. The native distribution areas present higher temperature and precipitation values compared to non-native ones, where low temperatures and the absence of humidity seem to limit the distribution of the species. The realized niche of Oenothera drummondii encompasses eight types of climates according to the Köppen–Geiger climatic regions, and the sum of these might represent an approximation to its fundamental niche. New areas and a partial overlap between native and non-native niches occurred in the environmental space, which indicate that climate matching is not occurring.
Ecological niche and geographic distribution models are very useful tools to identify potential areas for biological invasions. With the information obtained, preventive or correct measures can be designed, before and during invasion processes, and thus reduce the various negative ecological, economic and social impacts that invasive species represent.

Author Contributions

Conceptualization, G.M.-G., F.R.C.-I. and J.B.G.-F.; methodology, F.R.C.-I. and G.M.-G.; software, F.R.C.-I. and G.M.-G.; validation, F.R.C.-I., G.M.-G. and J.B.G.-F.; formal analysis, G.M.-G. and J.B.G.-F.; investigation, F.R.C.-I., G.M.-G., R.R.-N. and J.B.G.-F.; resources, G.M.-G., R.R.-N. and J.B.G.-F.; data curation, F.R.C.-I.; writing—original draft preparation, F.R.C.-I. and G.M.-G.; writing—review and editing, J.B.G.-F. and R.R.-N.; visualization, F.R.C.-I. and G.M.-G.; supervision, G.M.-G.; project administration, J.B.G.-F.; funding acquisition, J.B.G.-F. All authors have read and agreed to the published version of the manuscript.

Funding

The present research has been developed under the framework of CEMIE-Océano (Mexican Centre for Innovation in Ocean Energy), project FSE-2014-06-249795 financed by CONACYT SENER-Sustentabilidad Energética. The present research has been developed under the support of Ministerio de Economía y Competitividad (MINECO Project CGL2015-65058-R cofounded by FEDER).

Institutional Review Board Statement

Not applicable.

Data Availability Statement

This study used public databases.

Acknowledgments

We thank the SEP-UNAM-FUNAM and CEMIE scholarships of F.R.C.I. and the AUIP support for G.M.G. We thank the anonymous reviewers for their valuable suggestions that have contributed to improve this manuscript.

Conflicts of Interest

The authors declare no conflict of interest. The funders had no role in the design of the study; in the collection, analyses, or interpretation of data; in the writing of the manuscript, or in the decision to publish the results.

Appendix A

Training and projection areas for the construction of the models of O. drummondii corresponding to the different types of climate in the Köppen–Geiger classification.
Figure A1. Training (blue) and projection (green) areas for the construction of the models corresponding to Tropical monsoon climate (Am). Black dots represent occurrence records.
Diversity 13 00603 g0a1
Figure A2. Training (blue) and projection (green) areas for the construction of the models corresponding to Tropical savanna climate with dry-winter characteristics (Aw). Black dots represent occurrence records.
Diversity 13 00603 g0a2
Figure A3. Training (blue) areas for the construction of the models corresponding to hot semi-arid climate (Bsh). Black dots represent occurrence records.
Diversity 13 00603 g0a3
Figure A4. Training (blue) and projection (green) areas for the construction of the models corresponding to Humid subtropical climate (Cfa). Black dots represent occurrence records.
Diversity 13 00603 g0a4
Figure A5. Training (blue) and projection (green) areas for the construction of the models corresponding to Mediterranean hot summer climates (Csa). Black dots represent occurrence records.
Diversity 13 00603 g0a5
Figure A6. Training (blue) and projection (green) areas for the construction of the models corresponding to Mediterranean warm/cool summer climates (Csb). Black dots represent occurrence records.
Diversity 13 00603 g0a6
Figure A7. Training (blue) and projection (green) areas for the construction of the models corresponding to Temperate oceanic climate (Cfb). Black dots represent occurrence records.
Diversity 13 00603 g0a7
Figure A8. Training (blue) and projection (green) areas for the construction of the models corresponding to Dry-winter humid subtropical climate (Cwa). Black dots represent occurrence records.
Diversity 13 00603 g0a8

References

  1. Millennium Ecosystem Assessment. Ecosystems and Human Well-Being: Synthesis; Island Press: Washington, DC, USA, 2005; ISBN 978-1-59726-040-4. [Google Scholar]
  2. Mozdzer, T.J.; Zieman, J.C. Ecophysiological Differences between Genetic Lineages Facilitate the Invasion of Non-Native Phragmites Australis in North American Atlantic Coast Wetlands. J. Ecol. 2010, 98, 451–458. [Google Scholar] [CrossRef]
  3. Novoa, A.; González, L.; Moravcová, L.; Pyšek, P. Constraints to Native Plant Species Establishment in Coastal Dune Communities Invaded by Carpobrotus Edulis: Implications for Restoration. Biol. Conserv. 2013, 164, 1–9. [Google Scholar] [CrossRef]
  4. Paini, D.; Sheppard, A.; Cook, D.; Barro, P.; Worner, S.; Thomas, M. Global Threat to Agriculture from Invasive Species. Proc. Natl. Acad. Sci. USA 2016, 113, 7575–7579. [Google Scholar] [CrossRef] [Green Version]
  5. Castro-Díez, P.; Godoy, O.; Alonso, A.; Gallardo, A.; Saldaña, A. What Explains Variation in the Impacts of Exotic Plant Invasions on the Nitrogen Cycle? A Meta-Analysis. Ecol. Lett. 2014, 17, 1–12. [Google Scholar] [CrossRef] [PubMed] [Green Version]
  6. Ehrenfeld, J.G. Ecosystem Consequences of Biological Invasions. Annu. Rev. Ecol. Evol. Syst. 2010, 41, 59–80. [Google Scholar] [CrossRef] [Green Version]
  7. Liao, C.; Peng, R.; Luo, Y.; Zhou, X.; Wu, X.; Fang, C.; Chen, J.; Li, B. Altered Ecosystem Carbon and Nitrogen Cycles by Plant Invasion: A Meta-Analysis. New Phytol. 2008, 177, 706–714. [Google Scholar] [CrossRef]
  8. Pyšek, P.; Jarošík, V.; Hulme, P.E.; Pergl, J.; Hejda, M.; Schaffner, U.; Vilà, M. A Global Assessment of Invasive Plant Impacts on Resident Species, Communities and Ecosystems: The Interaction of Impact Measures, Invading Species’ Traits and Environment. Glob. Chang. Biol. 2012, 18, 1725–1737. [Google Scholar] [CrossRef]
  9. Pimentel, D.; McNair, S.; Janecka, J.; Wightman, J.; Simmonds, C.; O’Connell, C.; Wong, E.; Russel, L.; Zern, J.; Aquino, T.; et al. Economic and Environmental Threats of Alien Plant, Animal and Microbe Invasions. Agric. Ecosyst. 2001, 84, 1–20. [Google Scholar] [CrossRef]
  10. Elorza, M.; Sánchez, E.; Eduardo, S. Atlas de Las Plantas Alóctonas Invasoras En España; Gobierno de España: Madrid, Spain, 2004. [Google Scholar]
  11. Lomas, J.; Fernández-Carrillo, L.; Saavedra, M.; Mangas, L.; Rodríguez, C.; Gullón, E.; Martínez, E. Invasión de Oenothera drummondii Hook (Onagraceae) En El Paraje Natural Marismas Del Odiel (Huelva, S España). Bases Para La Gestión de Una Invasión Avanzada. Rev. Soc. Gaditana Hist. Nat. 2015, 9, 41–50. [Google Scholar]
  12. Hulme, P.E. Trade, Transport and Trouble: Managing Invasive Species Pathways in an Era of Globalization. J. Appl. Ecol. 2009, 46, 10–18. [Google Scholar] [CrossRef]
  13. Gallego-Fernández, J.; Martínez, M.; Garcia-Franco, J.G.; Zunzunegui, M. The Impact on Plant Communities of an Invasive Alien Herb, Oenothera Drummondii, Varies along the Beach-Coastal Dune Gradient. Flora 2019, 260, 151466. [Google Scholar] [CrossRef]
  14. Carboni, M.; Santoro, R.; Acosta, A.T.R. Are Some Communities of the Coastal Dune Zonation More Susceptible to Alien Plant Invasion? J. Plant Ecol. 2010, 3, 139–147. [Google Scholar] [CrossRef] [Green Version]
  15. Antunes, C.; Pereira, A.J.; Fernandes, P.; Ramos, M.; Ascensão, L.; Correia, O.; Máguas, C. Understanding Plant Drought Resistance in a Mediterranean Coastal Sand Dune Ecosystem: Differences between Native and Exotic Invasive Species. J. Plant Ecol. 2018, 11, 26–38. [Google Scholar] [CrossRef] [Green Version]
  16. Maun, M.A. The Biology of Coastal Sand Dunes; Oxford University Press: Oxford, UK, 2009; ISBN 978-0-19-857035-6. [Google Scholar]
  17. Nentwig, W. Biological Invasions; Ecological Studies; Springer: Berlin/Heidelberg, Germany, 2007; ISBN 978-3-540-36919-6. [Google Scholar]
  18. Lowry, E.; Rollinson, E.; Laybourn, A.; Scott, T.; Aiello-Lammens, M.; Gray, S.; Mickley, J.; Gurevitch, J. Biological Invasions: A Field Synopsis, Systematic Review, and Database of the Literature. Ecol. Evol. 2013, 3, 182–196. [Google Scholar] [CrossRef]
  19. Reyes, J.; Martínez, D. La Plasticidad de Las Plantas. Elem. Cienc. Cult. 2001, 8, 39–43. [Google Scholar]
  20. Villasenor, J.L.; Espinosa-García, F.J. The alien flowering plants of Mexico. Divers. Distrib. 2004, 10, 113–123. [Google Scholar] [CrossRef]
  21. Peterson, A.T. Predicting the Geography of Species’ Invasions via Ecological Niche Modeling. Q. Rev. Biol. 2003, 78, 419–433. [Google Scholar] [CrossRef] [Green Version]
  22. Peterson, A. Ecological Niches and Geographic Distributions; Princeton University Press: Princeton, NJ, USA, 2011; ISBN 978-0-691-13688-2. [Google Scholar]
  23. Peterson, A.; Papes, M.; Soberón, J. Rethinking Receiver Operating Characteristic Analysis Applications in Ecological Niche Modeling. Ecol. Model. 2008, 213, 63–72. [Google Scholar] [CrossRef]
  24. Richardson, D.M.; Thuiller, W. Home Away from Home—Objective Mapping of High-Risk Source Areas for Plant Introductions. Divers. Distrib. 2007, 13, 299–312. [Google Scholar] [CrossRef]
  25. Ibáñez, I.; Silander, J.A., Jr.; Wilson, A.M.; LaFleur, N.; Tanaka, N.; Tsuyama, I. Multivariate Forecasts of Potential Distributions of Invasive Plant Species. Ecol. Appl. 2009, 19, 359–375. [Google Scholar] [CrossRef] [PubMed]
  26. Zalba, S.M.; Sonaglioni, M.I.; Compagnoni, C.A.; Belenguer, C.J. Using a Habitat Model to Assess the Risk of Invasion by an Exotic Plant. Biol. Conserv. 2000, 93, 203–208. [Google Scholar] [CrossRef]
  27. Guisan, A.; Thuiller, W. Predicting Species Distribution: Offering More than Simple Habitat Models. Ecol. Lett. 2005, 9, 993–1005. [Google Scholar] [CrossRef] [PubMed]
  28. Broennimann, O.; Treier, U.; Müller-Schärer, H.; Thuiller, W.; Peterson, A.; Guisan, A. Evidence of Climatic Niche Shift during Biological Invasion. Ecol. Lett. 2007, 10, 701–709. [Google Scholar] [CrossRef] [Green Version]
  29. Gallien, L.; Münkemüller, T.; Albert, C.; Boulangeat, I.; Thuiller, W. Predicting Potential Distributions of Invasive Species: Where to Go from Here? Divers. Distrib. 2010, 16, 331–342. [Google Scholar] [CrossRef]
  30. Qiao, H.; Soberon, J.; Peterson, A.T. No silver bullets in correlative ecological niche modelling: Insights from testing among many potential algorithms for niche estimation. Methods Ecol. Evol. 2015, 6, 1126–1136. [Google Scholar] [CrossRef]
  31. Phillips, S.J. GUÍA DIDÁCTICA SOBRE MAXENT, AT&T RESEARCH, POR STEVEN PHILLIPS. Available online: https://www.calameo.com/books/006723252d12f9d7c4d17 (accessed on 27 September 2021).
  32. Phillips, S.J.; Anderson, R.P.; Schapire, R.E. Maximum Entropy Modeling of Species Geographic Distributions. Ecol. Model. 2006, 190, 231–259. [Google Scholar] [CrossRef] [Green Version]
  33. Hutchinson, E. Concluding Remarks. Biology 1957, 22, 415–427. [Google Scholar] [CrossRef]
  34. Soberón, J. Grinnellian and Eltonian Niches and Geographic Distributions of Species. Ecol. Lett. 2008, 10, 1115–1123. [Google Scholar] [CrossRef]
  35. Soberón, J.; Peterson, A. Interpretation of Models of Fundamental Ecological Niches and Species’ Distributional Areas. Biodivers. Inform. 2005, 2, 1–10. [Google Scholar] [CrossRef] [Green Version]
  36. Dietrich, W.; Wagner, W.L. Systematics of Oenothera Section Oenothera Subsection Raimannia and Subsection Nutantigemma (Onagraceae). Syst. Bot. Monogr. 1988, 24, 1–91. [Google Scholar] [CrossRef]
  37. Peel, M.C.; Finlayson, B.L.; McMahon, T.A. Updated world map of the Köppen-Geiger climate classification. Hydrol. Earth Syst. Sci. 2007, 11, 1633–1644. [Google Scholar] [CrossRef] [Green Version]
  38. Kottek, M.; Grieser, J.; Beck, C.; Rudolf, B.; Rubel, F. World Map of the Köppen-Geiger Climate Classification Updated. Meteorol. Z. 2006, 15, 259–263. [Google Scholar] [CrossRef]
  39. Gallego-Fernández, J.B.; García-Franco, J.G. Floral traits variation in Oenothera drummondii subsp. drummondii across a wide latitudinal range of native and non-native populations. Flora 2021, 280, 151851. [Google Scholar] [CrossRef]
  40. Gallego-Fernández, J.B.; García-Franco, J.G. Self-Compatibility and Reproductive Success of Oenothera drummondii Subsp. drummondii: Is It Similar between Native and Non-Native Populations? Diversity 2021, 13, 431. [Google Scholar] [CrossRef]
  41. Gallego-Fernández, J.B.; Martínez, M.L.; García-Franco, J.G.; Zunzunegui, M. Multiple seed dispersal modes of an invasive plant species on coastal dunes. Biol. Invasions 2020, 23, 111–127. [Google Scholar] [CrossRef]
  42. Dufour-Dror, J.-M. Alien Invasive Plants in Israel; The Middle East Nature Conservation Promotion Association: Jerusalem, Israel, 2012. [Google Scholar]
  43. Xu, H.; Qiang, S.; Genovesi, P.; Ding, H.; Wu, J.; Meng, L.; Han, Z.; Miao, J.; Hu, B.; Guo, J.; et al. An Inventory of Invasive Alien Species in China. NeoBiota 2012, 15, 1–26. [Google Scholar] [CrossRef]
  44. Shaltout, K.; Hosni, H.A.; El-Kady, H.F.; El-Beheiry, M.A.; Shaltout, S.K. Composition and pattern of alien species in the Egyptian flora. Flora 2016, 222, 104–110. [Google Scholar] [CrossRef]
  45. Frean, M.; Balkwill, K.; Anderson, C.G.; Burt, S. The Expanding Distributions and Invasiveness of Oenothera in Southern Africa. S. Afr. J. Bot. 1997, 63, 449–458. [Google Scholar] [CrossRef] [Green Version]
  46. Heenan, P.B.; De Lange, P.J.; Cameron, E.K.; Champion, P.D. Checklist of dicotyledons, gymnosperms, and pteridophytes naturalised or casual in New Zealand: Additional records 1999–2000. N. Z. J. Bot. 2002, 40, 155–174. [Google Scholar] [CrossRef]
  47. Heyligers, P.C. Flora of the Stockton and Port Hunter Sandy Foreshores with Comments on Fifteen Notable Introduced Species. Cunninghamia 2009, 10, 493–511. [Google Scholar]
  48. Qu, J.; Han, Q.; Dong, G.; Zhang, K.; Zu, R. A study of the characteristics of aeolian sand activity and the effects of a comprehensive protective system in a coastal dune area in southern China. Coast. Eng. 2013, 77, 28–39. [Google Scholar] [CrossRef]
  49. GBIF. Available online: https://www.gbif.org/ (accessed on 27 September 2021).
  50. Anthos. Sistema de Información Sobre Las Plantas de España. Available online: http://www.anthos.es/ (accessed on 27 September 2021).
  51. BioGIS—Israel Biodiversity Web Site. Available online: https://biogis.huji.ac.il/ (accessed on 27 September 2021).
  52. Australasian Virtual Herbarium. Available online: https://avh.chah.org.au/https//avh.chah.org.au/ (accessed on 27 September 2021).
  53. Tropicos. Available online: https://www.tropicos.org/home (accessed on 27 September 2021).
  54. Dietrich, W.; Wagner, W.L. New Taxa of Oenothera L. Sect. Oenothera (Onagraceae). Ann. Mo. Bot. Gard. 1987, 74, 144. [Google Scholar] [CrossRef]
  55. Webber, B.L.; Yates, C.J.; Le Maitre, D.C.; Scott, J.K.; Kriticos, D.J.; Ota, N.; McNeill, A.; Le Roux, J.J.; Midgley, G.F. Modelling horses for novel climate courses: Insights from projecting potential distributions of native and alien Australian acacias with correlative and mechanistic models. Divers. Distrib. 2011, 17, 978–1000. [Google Scholar] [CrossRef]
  56. WorldClim. Available online: https://www.worldclim.org/ (accessed on 27 September 2021).
  57. Hijmans, R.; Cameron, S.; Parra, J.; Jones, P.; Jarvis, A. Very High Resolution Interpolated Climate Surfaces of Global Land Areas. Int. J. Climatol. 2005, 25, 1965–1978. [Google Scholar] [CrossRef]
  58. Mackey, B.; Lindenmayer, D. Towards a Hierarchical Framework for Modeling the Spatial Distribution of Animals. J. Biogeogr. 2001, 28, 1147–1166. [Google Scholar] [CrossRef]
  59. Synes, N.; Osborne, P.E. Choice of predictor variables as a source of uncertainty in continental-scale species distribution modelling under climate change. Glob. Ecol. Biogeogr. 2011, 20, 904–914. [Google Scholar] [CrossRef]
  60. Low, B.W.; Zeng, Y.; Tan, H.H.; Yeo, D.C. Predictor complexity and feature selection affect Maxent model transferability: Evidence from global freshwater invasive species. Divers. Distrib. 2020, 27, 497–511. [Google Scholar] [CrossRef]
  61. Groom, D. Dale Groom’s Texas Gardening Guide; Springer: Nashville, TN, USA, 2002; ISBN 978-1-930604-39-1. [Google Scholar]
  62. Ajilvsgi, G. Wildflowers of Texas; Shearer Publishing: Fredericksburg, TX, USA, 2003; ISBN 978-0-940672-73-4. [Google Scholar]
  63. SPSS Statistics 24.0. Available online: https://www.ibm.com/support/pages/downloading-ibm-spss-statistics-24 (accessed on 6 October 2021).
  64. Peterson, A.; Papes, M.; Eaton, M. Transferability and Model Evaluation in Ecological Niche Modeling: A Comparison of GARP and Maxent. Ecography 2007, 30, 550–560. [Google Scholar] [CrossRef]
  65. Elith, J.; Leathwick, J.R. Species Distribution Models: Ecological Explanation and Prediction Across Space and Time. Annu. Rev. Ecol. Evol. Syst. 2009, 40, 677–697. [Google Scholar] [CrossRef]
  66. Jarnevich, C.S.; Young, N. Using the MAXENT program for species distribution modelling to assess invasion risk. In Pest Risk Modelling and Mapping for Invasive Alien Species; CAB International: Wallingford, UK, 2015; pp. 65–81. [Google Scholar] [CrossRef]
  67. West, A.M.; Kumar, S.; Brown, C.S.; Stohlgren, T.J.; Bromberg, J. Field validation of an invasive species Maxent model. Ecol. Informatics 2016, 36, 126–134. [Google Scholar] [CrossRef] [Green Version]
  68. Papeş, M.; Havel, J.E.; Zanden, J.V. Using maximum entropy to predict the potential distribution of an invasive freshwater snail. Freshw. Biol. 2016, 61, 457–471. [Google Scholar] [CrossRef]
  69. Zhang, H.; Song, J.; Zhao, H.; Li, M.; Han, W. Predicting the Distribution of the Invasive Species Leptocybe invasa: Combining MaxEnt and Geodetector Models. Insects 2021, 12, 92. [Google Scholar] [CrossRef] [PubMed]
  70. Elith, J.; Graham, C.H.; Anderson, R.P.; Dudík, M.; Ferrier, S.; Guisan, A.; Hijmans, R.J.; Huettmann, F.; Leathwick, J.R.; Lehmann, A.; et al. Novel methods improve prediction of species’ distributions from occurrence data. Ecography 2006, 29, 129–151. [Google Scholar] [CrossRef] [Green Version]
  71. Kumar, S.; Spaulding, S.; Stohlgren, T.; Hermann, K.; Schmidt, T.; Bahls, L. Potential habitat distribution for the freshwater diatom Didymosphenia geminata in the continental US. Front. Ecol. Environ. 2009, 7, 415–420. [Google Scholar] [CrossRef]
  72. Merow, C.; Smith, M.J.; Silander, J.A. A practical guide to MaxEnt for modeling species’ distributions: What it does, and why inputs and settings matter. Ecography 2013, 36, 1058–1069. [Google Scholar] [CrossRef]
  73. Mendoza-González, G.; Martínez, M.; Rojas-Soto, O.; Téllez-Valdés, O.; Arias-Del Razo, I. Priority Areas for Conservation of Beach and Dune Vegetation of the Mexican Atlantic Coast. J. Nat. Conserv. 2016, 33, 25–34. [Google Scholar] [CrossRef]
  74. Tool for Partial-ROC, Ver. 1.0. Available online: https://0-scholar-google-com.brum.beds.ac.uk/citations?view_op=view_citation&hl=es&user=10Ojgh0AAAAJ&citation_for_view=10Ojgh0AAAAJ:-f6ydRqryjwC (accessed on 27 September 2021).
  75. Hammada, S.; Linares, L.; Cortes, J. Biodiversité floristique des dunes littorales de l’Oued El Maleh (Martil) et du bas Tahaddart: Résultats préliminaires. Trav. Instit. Scient. Rabat 2009, 6, 45–50. [Google Scholar]
  76. Atlas of Living Australia. Available online: https://www.ala.org.au (accessed on 28 September 2021).
  77. Tela Botanica. Available online: https://www.tela-botanica.org/ (accessed on 28 September 2021).
  78. Campos, J.A.; Herrera, M. Diagnosis de La Flora Alóctona Invasora de La CAPV; Departamento de Medio Ambiente y Ordenación del territorio: Bilbao, Spain, 2009. [Google Scholar]
  79. Silvestre, S. Notas Breves. 15. Oenothera drummondii. Lagascalia 1980, 9, 244–245. [Google Scholar]
  80. Dietrich, W.; Wagner, W.L.; Raven, P.H. Systematics of Oenothera Section Oenothera Subsection Oenothera (Onagraceae). Syst. Bot. Monogr. 1997, 50, 1–234. [Google Scholar] [CrossRef]
  81. Moreno-Casasola, P. Patterns of Plant Species Distribution on Coastal Dunes Along the Gulf of Mexico. J. Biogeogr. 1988, 15, 787–806. [Google Scholar] [CrossRef]
  82. Gallego-Fernández, J.B.; Martínez, M.L. Environmental Filtering and Plant Functional Types on Mexican Foredunes along the Gulf of Mexico. Écoscience 2011, 18, 52–62. [Google Scholar] [CrossRef]
  83. Gallagher, R.V.; Beaumont, L.J.; Hughes, L.; Leishman, M.R. Evidence for Climatic Niche and Biome Shifts between Native and Novel Ranges in Plant Species Introduced to Australia. J. Ecol. 2010, 98, 790–799. [Google Scholar] [CrossRef]
  84. Zunzunegui, M.; Ruíz-Valdepeñas, E.; Sert, M.; Díaz, M.; Gallego-Fernández, J. Field Comparison of Ecophysiological Traits between an Invader and a Native Species in a Mediterranean Coastal Dune. Plant Physiol. Biochem. 2019, 146, 278–286. [Google Scholar] [CrossRef]
  85. Díaz-Barradas, M.C.; Gallego-Fernández, J.B.; Zunzunegui, M. Plant Response to Water Stress of Native and Non-Native Oenothera drummondii Populations. Plant Physiol. Biochem. 2020, 154, 219–228. [Google Scholar] [CrossRef]
  86. Liu, C.; Wolter, C.; Xian, W.; Jeschke, J.M. Most invasive species largely conserve their climatic niche. Proc. Natl. Acad. Sci. USA 2020, 117, 23643–23651. [Google Scholar] [CrossRef]
  87. Hernández-Espinosa, R.; González-Astorga, J.; Espinosa de los Monteros, A.; Cabrera-Toledo, D.; Gallego-Fernández, J.B. Transferability of Microsatellite Markers Developed in Oenothera Spp. to the Invasive Species Oenothera drummondii Hook. (Onagraceae). Diversity 2020, 12, 387. [Google Scholar] [CrossRef]
  88. Zunzunegui, M.; Morales Sánchez, J.Á.; Díaz Barradas, M.C.; Gallego-Fernández, J.B. Different Tolerance to Salinity of Two Populations of Oenothera drummondii with Contrasted Biogeographical Origin. Plant Physiol. Biochem. 2021, 162, 336–348. [Google Scholar] [CrossRef] [PubMed]
  89. Jutila, H. Seed Bank and Emergent Vascular Flora of Ballast Areas in Reposaari, Finland. Ann. Bot. Fenn. 1996, 33, 165–182. [Google Scholar]
  90. Ridley, H.N. The Dispersal of Plants throughout the World; L. Reeve & Co., Ltd.: Ashford, UK, 1930. [Google Scholar]
  91. Ouren, T. The Impact of the Old Shipyards on the Invasion of Alien Plants to Norway. Nor. Geogr. Tidsskr. Nor. J. Geogr. 1980, 34, 145–152. [Google Scholar] [CrossRef]
  92. Castroviejo, S. Flora Iberica. Vol. 8. Haloragaceae-Euphorbiaceae. Available online: https://www.biodiversitylibrary.org/bibliography/71304 (accessed on 28 September 2021).
  93. NaturaLista. Available online: https://www.naturalista.mx/ (accessed on 6 October 2021).
  94. The Catalogue of Life. Available online: https://www.catalogueoflife.org/ (accessed on 6 October 2021).
  95. Integrated Taxonomic Information System. Available online: https://www.itis.gov/ (accessed on 6 October 2021).
  96. Consejería de Medio Ambiente y Ordenación del Territorio. Memoria de Actividades y Resultados 2012. Espacio Natural Doñana; Portal Ambiental de Andalucía: Seville, Spain, 2013. [Google Scholar]
  97. Consejería de Medio Ambiente y Ordenación del Territorio. Memoria de Actividades y Resultados 2015. Espacio Natural Doñana; Portal Ambiental de Andalucía: Seville, Spain, 2016. [Google Scholar]
  98. Lomas, J.; Fernández-Carrillo, L.; Saavedra, C.; Dana, E.; Rodríguez, C.; Martínez, E. Feasibility of Using Glyphosate to Control Beach Evening Primrose Oenothera drummondii in Heavily Invaded Coastal Dunes, Odiel Marshes, Spain. Conserv. Evid. 2016, 13, 72–78. [Google Scholar]
  99. Ministerio de Medio Ambiente y Medio Rural y Marino; Dirección General de Sostenibilidad de la Costa y del Mar. Plan de Control y Eliminación de Especies Vegetales Invasoras de Sistemas Dunares; Instituto de Ecología Litoral: Campello, Spain, 2011. [Google Scholar]
Figure 1. Geographic distribution of O. drummondii subsp. drummondii. Green dots show occurrence records of native distribution, blue dots show records of non-native distribution. The solid black line represents the Line of the Ecuator and the dashed lines represent the intertropical region.
Diversity 13 00603 g001
Figure 2. Köppen–Geiger climatic region where O. drummondii subsp. drummondii Hook is distributed. Red dots show native and non-native geographic distribution of the species. Köppen–Geiger climatic native regions: Tropical monsoon climate (Am), Tropical savanna climate with dry-winter characteristics (Aw) hot semi-arid climate (Bsh), and Humid subtropical climate (Cfa). Köppen–Geiger climatic non-native regions: Mediterranean hot summer climates (Csa), Mediterranean warm/cool summer climates (Csb), Temperate oceanic climate (Cfb), Dry-winter humid subtropical climate (Cwa). Solid black line represents the Line of Ecuador and dashed lines represent the intertropical region.
Diversity 13 00603 g002
Figure 3. PCA biplot that represents the environmental space in the global realized niche of the species O. drummondii using the 19 bioclimatic variables of WorldClim. The dots show the occurrence records that were used to calibrate the models. Red and green color shaded areas correspond to the non-native and native areas. Vectors represent bioclimatic variables that are closer to the average values of occurrence records in each axis. Annual Mean Temperature (BIO1), Temperature Seasonality (BIO4), Temperature of Coldest Quarter (BIO11), annual precipitation (BIO12), Mean and Precipitation Seasonality (BIO15), and Precipitation of Coldest Quarter (BIO19).
Diversity 13 00603 g003
Figure 4. PCA biplot that represents the environmental space in the global realized niche of the species O. drummondii using the 19 bioclimatic variables of WorldClim. The dots show the occurrence records that were used to calibrate the models. Red color dots shows non-native records and green color dots shows native records. Blue dotted lines represent a fraction of the fundamental niche from each Köppen–Geiger climatic region. Orange line represents an approximation of the fundamental niche.
Diversity 13 00603 g004
Figure 5. PCA biplots that represent the partial environmental space that indicates the climatic profile of the species O. drummondii in each Köppen–Geiger climatic region. Dots represent the presence records of: (i) all native populations (green) and (ii) all non-native populations (red). Clouds represent the environmental space for each climatic region; in these, the solid line represents the fraction of the fundamental niche and the dotted line the fraction of the realized niche within each Köppen–Geiger climatic region.
Diversity 13 00603 g005
Figure 6. Boxplot indicating bioclimatic variability between native (NAT) and non-native (INV) distribution of O. drummondii. (Mann–Whitney U test: *** p < 0.0001, ** p < 0.001). (a) Variables related to temperature. BIO1: Annual Mean Temperature, BIO5: Max Temperature of Warmest Month, BIO8: Mean Temperature of Wettest Quarter, BIO9: Mean Temperature of Driest Quarter, BIO10: Mean Temperature of Warmest Quarter, BIO11: Mean Temperature of Coldest Quarter, (b) Variables related to precipitation. BIO12: Annual Precipitation, BIO13: Precipitation of Wettest Month, BIO14: Precipitation of Driest Month, Bio16: Precipitation of Wettest Quarter, Bio17: Precipitation of Driest Quarter, Bio18: Precipitation of Warmest Quarter, Bio19: Precipitation of Coldest Quarter.
Diversity 13 00603 g006
Figure 7. Species distribution modeling in the Köppen–Geiger climatic regions selected. Geographic areas of presence (red) and absence (blue) in native and non-native distribution. (a) North America, (b) Central America, (c), North of South America, (d) South of South America, (e) Eastern Europe, (f) Western Europe, (g) Asia, (h) Southeast Asian, (i) Autralia, (j) New Zealand, (k) North Africa, (l) South Africa.
Diversity 13 00603 g007
Table 1. Bioclimatic variables selected for each of the corresponding Köppen–Geiger climatic regions of the species distribution areas. Bio1: Annual Mean Temperature, Bio3: Isothermality (BIO2/BIO7) (×100), Bio4: Temperature Seasonality (standard deviation ×100), Bio8: Mean Temperature of Wettest Quarter, Bio9: Mean Temperature of Driest Quarter, Bio10: Mean Temperature of Warmest Quarter, Bio11: Mean Temperature of Coldest Quarter, Bio12: Annual Precipitation, Bio13: Precipitation of Wettest Month, Bio14: Precipitation of Driest Month, Bio15: Precipitation Seasonality (Coefficient of Variation), Bio16: Precipitation of Wettest Quarter, Bio17: Precipitation of Driest Quarter, Bio18: Precipitation of Warmest Quarter, Bio19: Precipitation of Coldest Quarter. The native distribution of O. drummondii includes four of the eight Köppen–Geiger climatic regions: Tropical monsoon climate (Am), Tropical savanna climate with dry-winter characteristics (Aw) hot semi-arid climate (Bsh), and Humid subtropical climate (Cfa). Therefore, the variables selected for these climatic regions correspond to the native distribution. The invasion zones are the four remaining climates: Mediterranean hot summer climates (Csa), Mediterranean warm/cool summer climates (Csb), Temperate oceanic climate (Cfb), Dry-winter humid subtropical climate (Cwa).
DistributionNativeNon-NativeNon-NativeNon-NativeNon-Native
Köppen–Geiger Climatic RegionsAm, Aw, Bsh, CfaCsaCsbCfbCwa
BIO1XXX X
BIO 2
BIO3 X
BIO4XXXXX
BIO5 X
BIO6
BIO7
BIO8 XXX
BIO9XXXXX
BIO10X X
BIO11XXX X
BIO12 X
BIO13XXXXX
BIO14XXX X
BIO15XXXXX
BIO16 X
BIO17 X
BIO18XXXXX
BIO19XXX X
Table 2. Number of records of presence of O. drummondii for the different climatic regions (# Occurrence records); percentage of random test (% Validation), and number of bioclimatic variables used (# Bioclimatic variables) for the construction of the models. N = native distribution, NonN = non-native distribution. Köppen–Geiger climatic native regions: Tropical monsoon climate (Am), Tropical savanna climate with dry-winter characteristics (Aw) hot semi-arid climate (Bsh), and Humid subtropical climate (Cfa). Köppen–Geiger climatic non-native regions: Mediterranean hot summer climates (Csa), Mediterranean warm/cool summer climates (Csb), Temperate oceanic climate (Cfb), Dry-winter humid subtropical climate (Cwa).
Köppen–Geiger Climatic RegionDistribution# Ocurrences Records%Validation# Bioclimatic VariablesFigure in Appendix A
AmN1915%10A1
AwN2315%10A2
BshN815%10A3
CfaN32415%10A4
CsaNonN22915%10A5
CsbNonN50%10A6
CfbNonN4015%10A7
CwaNonN30%11A8
Table 3. Worldwide distribution of Oenothera drummondii subsp. drummondii. White rows indicate non-native distributions where N: naturalized, I: invasive. Gray rows indicate native distribution (NAT: native). Köppen–Geiger climatic native regions: Tropical monsoon climate (Am), Tropical savanna climate with dry-winter characteristics (Aw) hot semi-arid climate (Bsh), and Humid subtropical climate (Cfa). Köppen–Geiger climatic non-native regions: Mediterranean hot summer climates (Csa), Mediterranean warm/cool summer climates (Csb), Temperate oceanic climate (Cfb), Dry-winter humid subtropical climate (Cwa) and Hot desert climate (BWh).
CountryRegion/LocationKöppen–Geiger Climatic RegionsNumber of RecordsFirst RecordCurrent StatusReferences
AustraliaQueenslandCwa2221924N[76]
Cfa1924N
South New WalesCfa, Cfb1929N
Southwestern AustraliaBsh, Csa, Csb, 1947N
Lord Howe IslandCfa1962N
AdelaidaCsb1989N
ChinaFujianCfa101923I[43]
EgyptMediterranean coastBWh-1871N[44]
FranceMarseillanCsa12014N[77]
IsraelTel Aviv district Central district Meridional districtCsa1501902I[42]
MoroccoTetouanCsa-1930I[75]
Spain (North)Basque Country—ZarautzCfb221915N[13,39,11,78]
New ZealandAucklandCfb121997N[46]
PeruSupeBsh31938N[11]
Spain (South)Gulf of CadizCsa211957I[13,39,11,79]
South AfricaWestern CapeCsb81912N[45]
Eastern CapeCfb1912
Kawa Zulu-NatalCfa1912
MexicoTamaulipasAw, Bsh, Cfa761898NAT[36,80,81,82]
VeracruzAw, Am1903NAT
TabascoAm1983NAT
USASouth Carolina, Georgia, East FloridaCfa1261880NAT[36,80,81,82]
Gulf of Mexico statesCfa1843NAT
Table 4. Potential area of presence/absence (km2) and percentage of presence/absence relative to the global potential species distribution area for all Köppen–Geiger climatic regions. In green, native area; in orange, native and non-native area; in red, non-native area.
AwAmBShCfaCfbCsaCsbCwaTOTAL
Presence15,23080,268211839,21214,57149,16110,3954686215,641
Absence203,18520,76221,83866,884228,32926,56016,77016,668600,996
TOTAL (km)218,415101,03023,956106,096242,90075,72127,16521,354816,637
% presence737.20.918.16.722.74.82.1100
% absence33.83.43.611.1237.94.42.72.7100
Table 5. AUC values for the ROC curve, average of the proportion values (ratio) for the partial ROC curve and their significance values (p-value) in each of the models. Köppen–Geiger climatic native regions: Tropical monsoon climate (Am), Tropical savanna climate with dry-winter characteristics (Aw) hot semi-arid climate (Bsh), and Humid subtropical climate (Cfa). Köppen–Geiger climatic non-native regions: Mediterranean hot summer climates (Csa), Mediterranean warm/cool summer climates (Csb), Temperate oceanic climate (Cfb), Dry-winter humid subtropical climate (Cwa).
Köppen–Geiger Climatic RegionDistributionROCPartial ROC p-Value
AmTropical monsoon climateNative0.967NANA
AwTropical savanna climate with dry-winter characteristicsNative0.9331.836<0.001
BshHot semi-arid climateNative0.923NANA
CfaHumid subtropical climateNative0.9391.717<0.001
CsaMediterranean hot summer climatesNon-native0.8190.989>0.05
CsbMediterranean warm/cool summer climatesNon-nativeNA NANA
CfbTemperate oceanic climateNon-native0.9981.994<0.001
CwaDry-winter humid subtropical climateNon-nativeNA NANA
Publisher’s Note: MDPI stays neutral with regard to jurisdictional claims in published maps and institutional affiliations.

