
Water Quality Analysis in a Subtropical River with an Adapted Biomonitoring Working Party (BMWP) Index

 ,
,  , ,
, ,
Abstract
:
1. Introduction
2. Materials and Methods
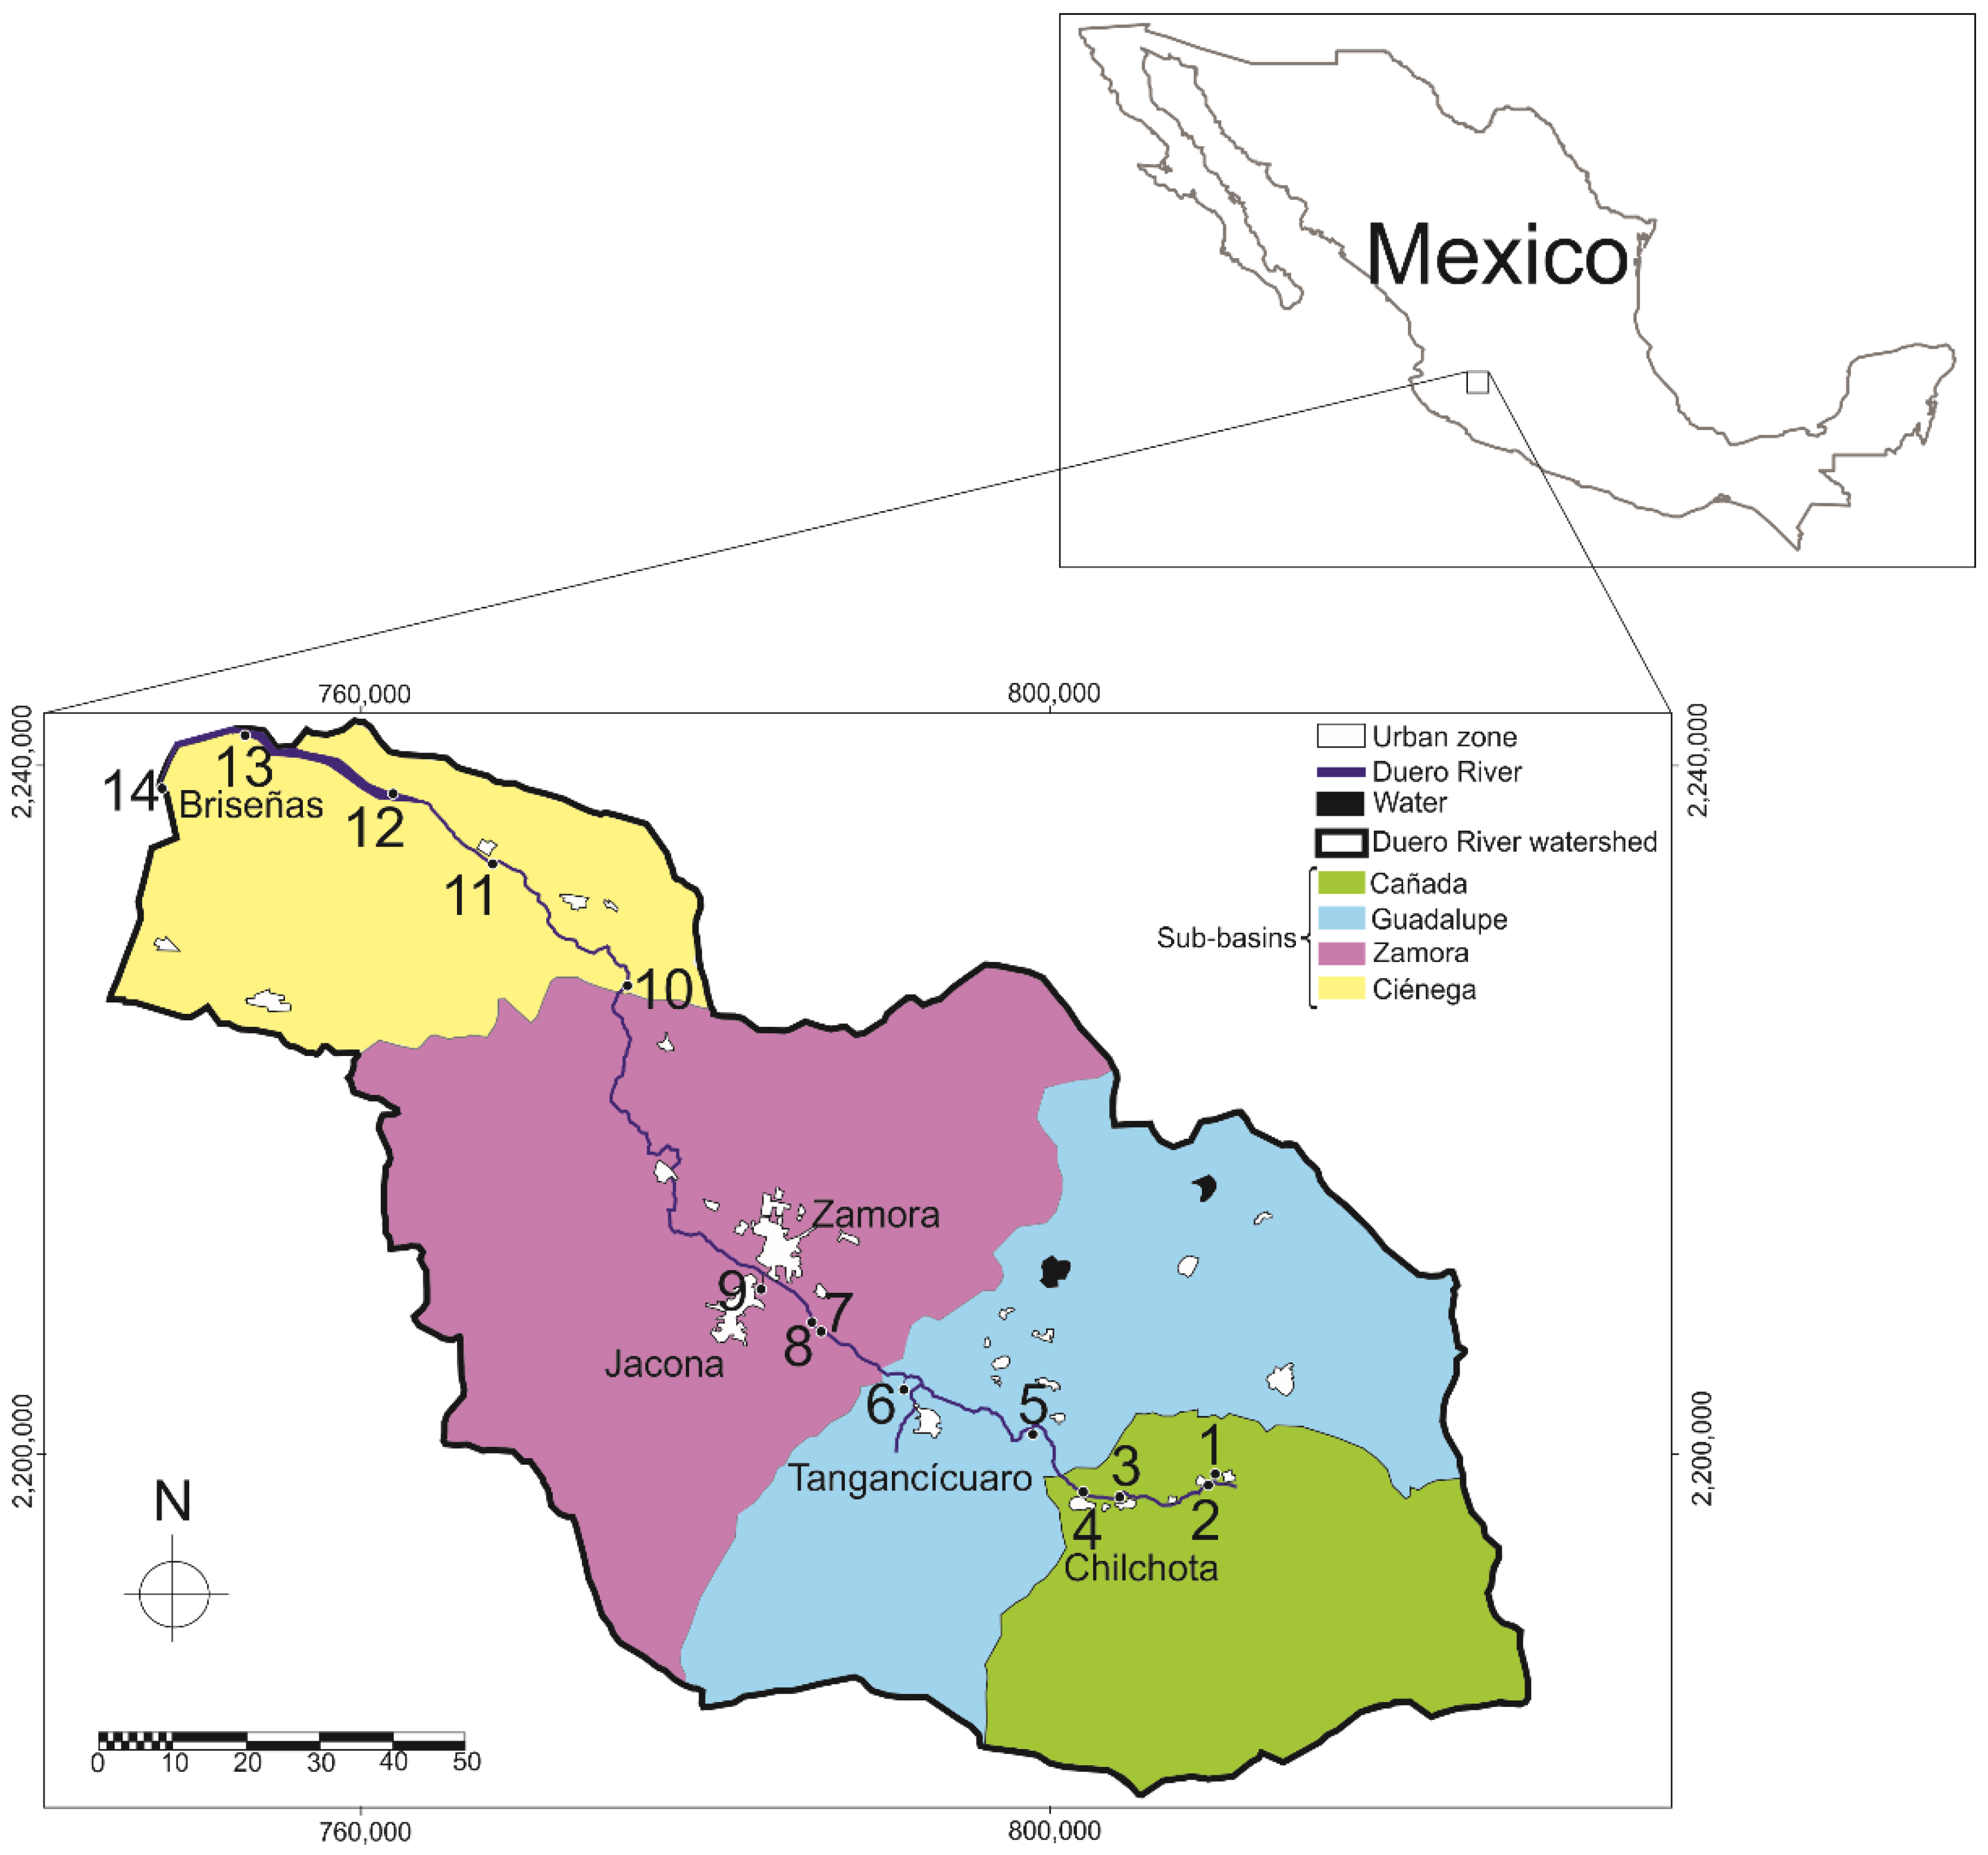
2.1. Study Area
2.2. Sampling and Data Analysis
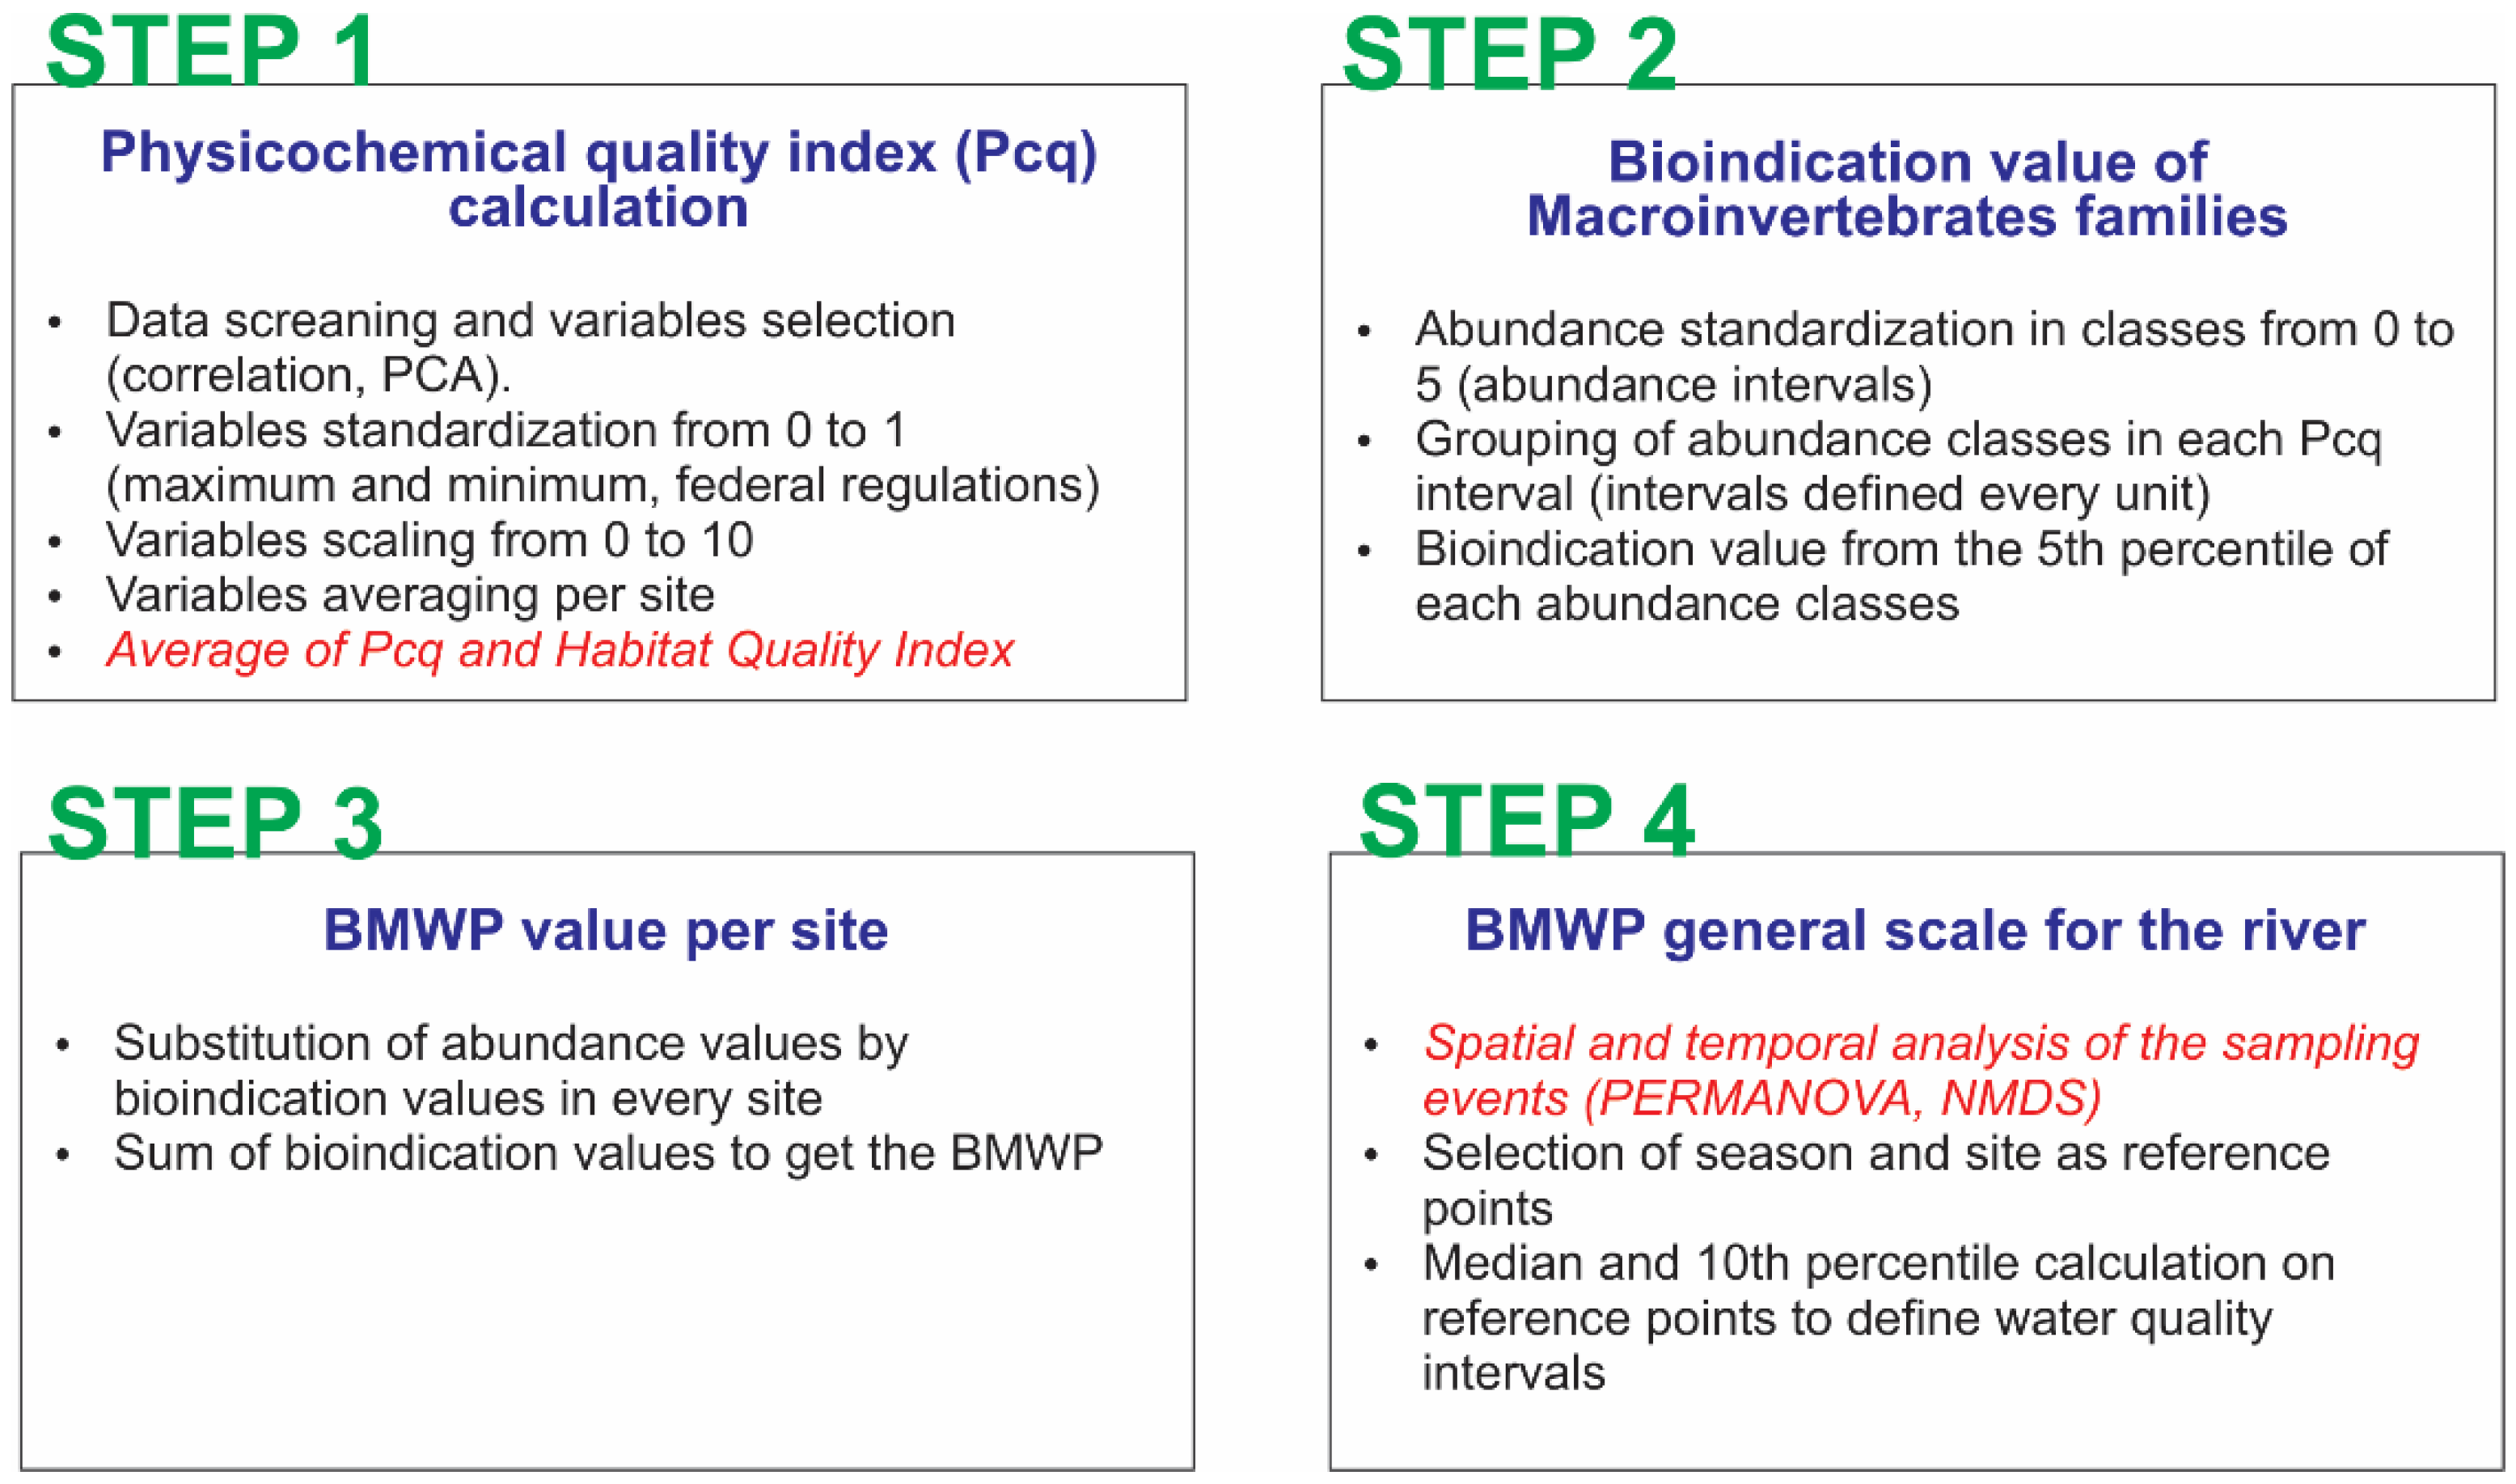
2.3. Index Calibration and Comparison
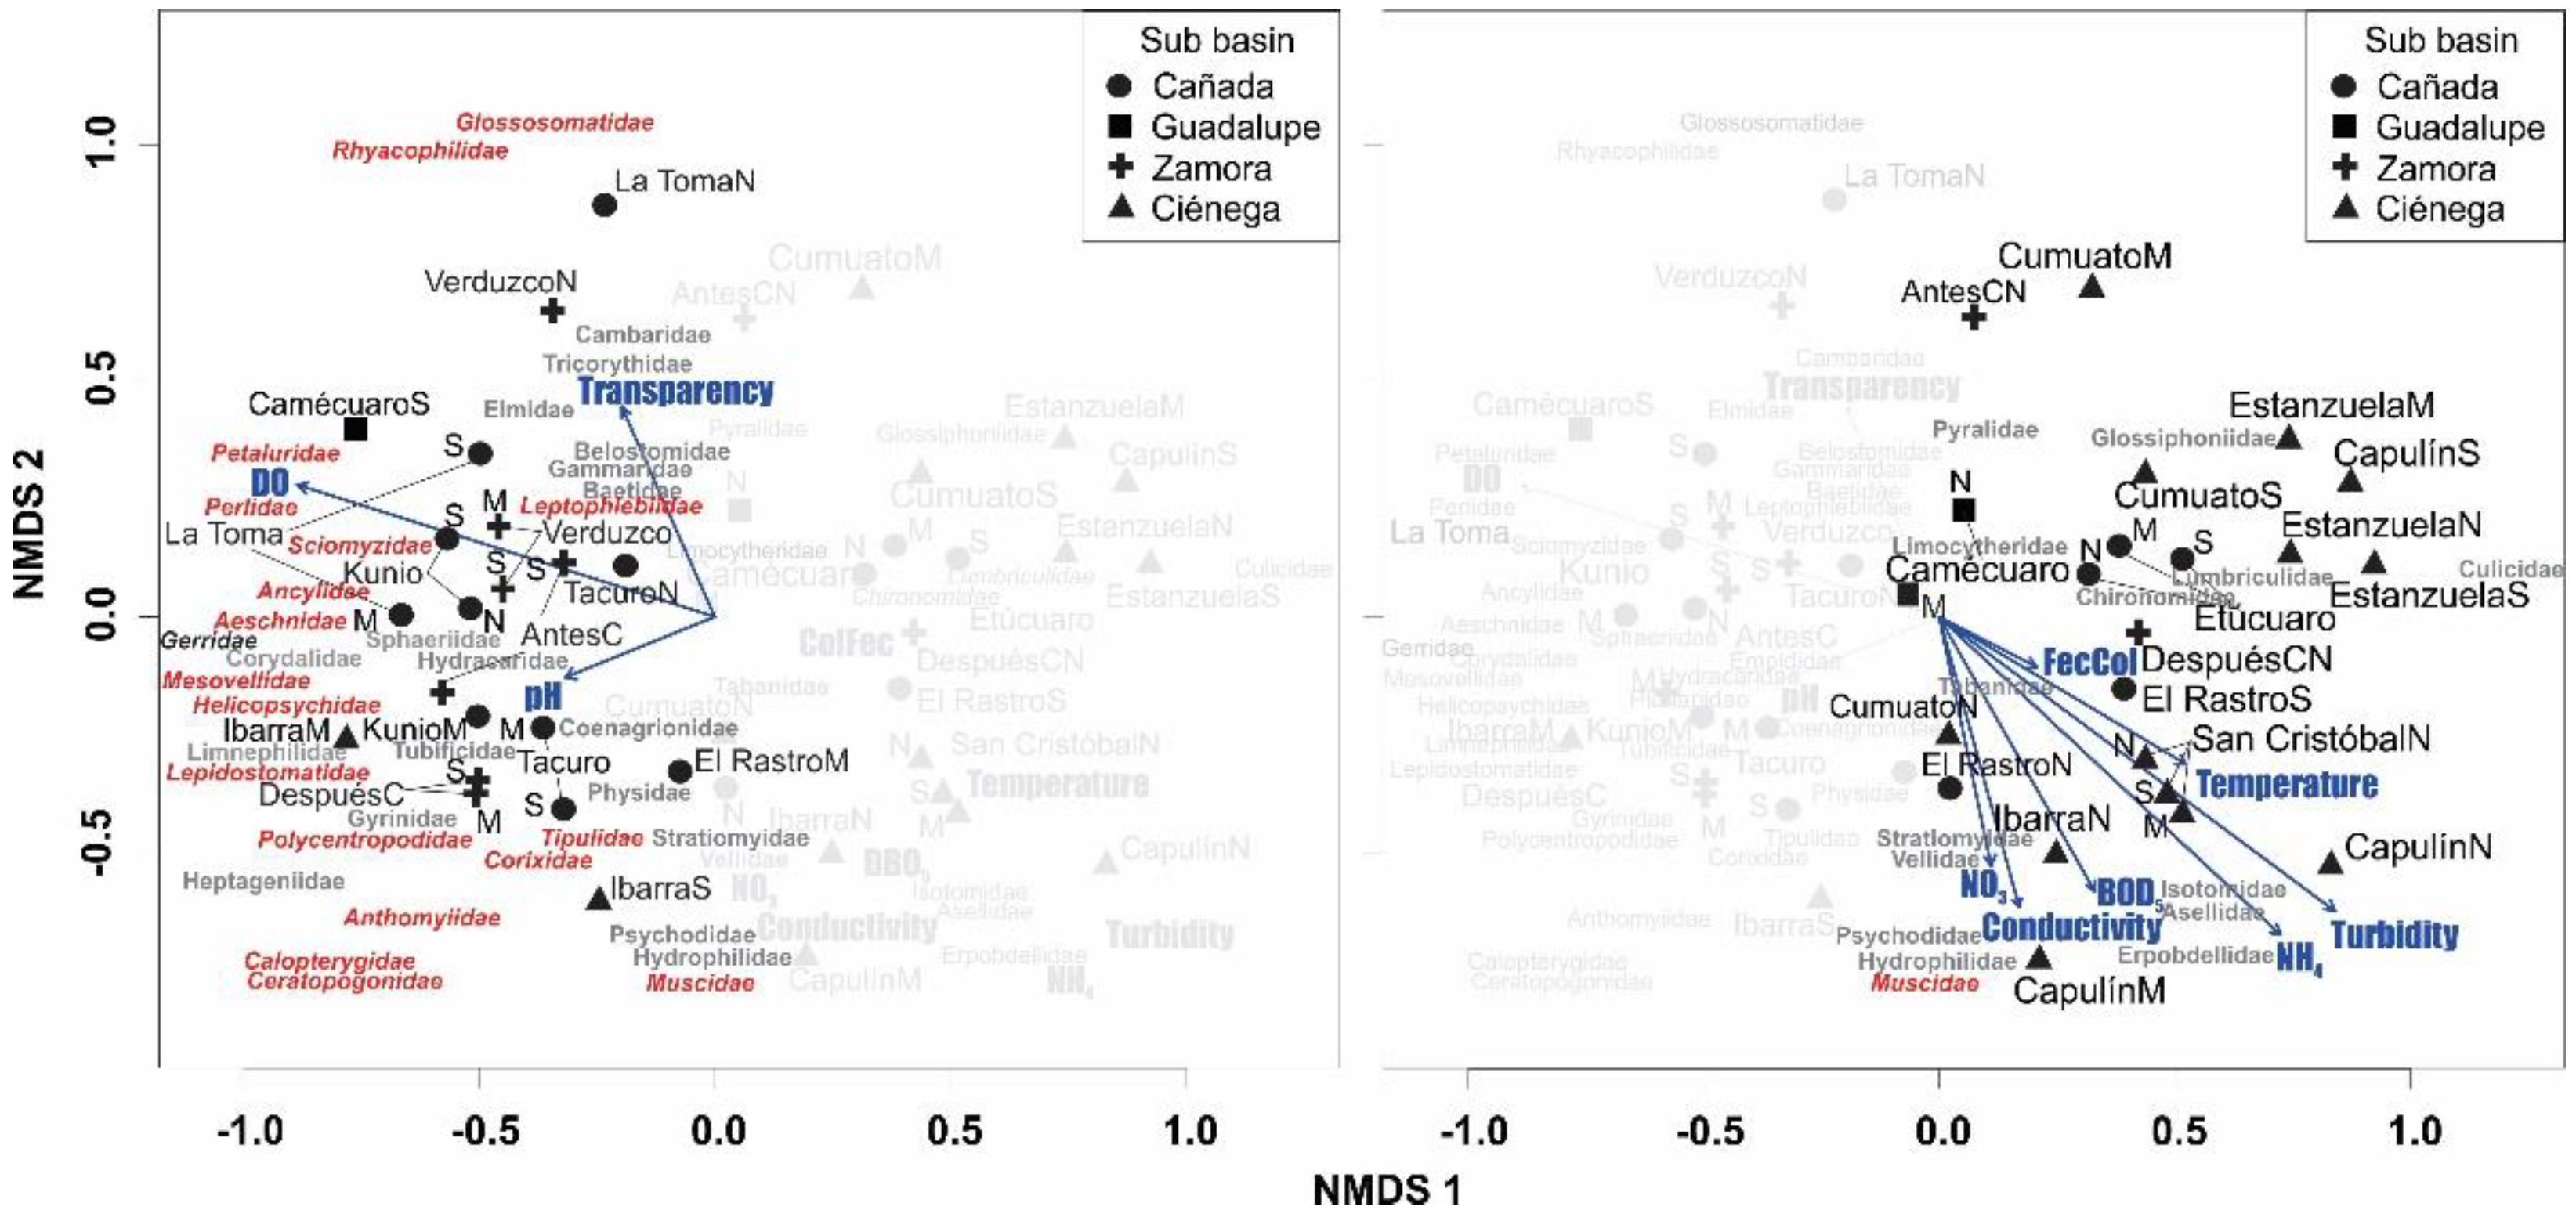
2.4. Statistical Analyses
3. Results
4. Discussion
Supplementary Materials
Author Contributions
Funding
Institutional Review Board Statement
Data Availability Statement
Acknowledgments
Conflicts of Interest
Appendix A

| Class | Order | Family | Genera |
|---|---|---|---|
| Turbellaria | Tricladida | Planariidae | Dugesia |
| Gastropoda | Basommatophora | Planorbidae | Helisoma |
| Ancylidae | Ferrisia | ||
| Hebetancylus | |||
| Physidae | Physa | ||
| Pelecypoda | Eulamellibranchia | Margaritiferidae | Margaritifera |
| Heterodonta | Sphaeriidae | Eupera | |
| Pisidium | |||
| Sphaerium | |||
| Oligochaeta | Lumbriculida | Lumbriculidae | Lumbriculus |
| Haplotaxida | Tubificidae | Branchiura | |
| Tubifex | |||
| Hirudinea | Pharyngobdellida | Erpobdellidae | Moreobdella |
| Rhynchobdellida | Glossiphoniidae | Hellobdella | |
| Crustacea | Podocopa | Limocytheridae | Limnocythere |
| Isopoda | Asellidae | Asellus | |
| Amphipoda | Gammaridae | Gammarus | |
| Decapoda | Cambaridae | Cambarellus | |
| Procambarus | |||
| Pseudothelphusidae | Pseudothelphusa | ||
| Insecta | Collembola | Isotomidae | Isotomorus |
| Ephemeroptera | Baetidae | Baetis | |
| Baetodes | |||
| Callibaetis | |||
| Dactylobaetis | |||
| Heptageniidae | Epeorus | ||
| Heptagenia | |||
| Leptophlebiidae | Leptophlebia | ||
| Paraleptophlebia | |||
| Traulodes | |||
| Tricorythidae | Leptohyphes | ||
| Tricorhythodes | |||
| Caenidae * | Caenis | ||
| Odonata | Coenagrionidae | Argia | |
| Coenagrion | |||
| Enallagma | |||
| Lestidae * | Archilestes | ||
| Agriidae | Agrion | ||
| Calopterygidae | Hetaerina | ||
| Petaluridae | Tanypteryx | ||
| Cordulegastridae * | Cordulegaster | ||
| Gomphidae | Erpetogomphus | ||
| Aeschnidae | Aeschna | ||
| Libellulidae * | Libellula | ||
| Plecoptera | Perlidae | Acroneuria | |
| Hemiptera | Naucoridae * | Ambrysus | |
| Belostomatidae | Belostoma | ||
| Corixidae | Graptocorixa | ||
| Trichocorixa | |||
| Notonectidae | Buenoa | ||
| Mesovellidae | Mesovelia | ||
| Macrovellidae | Macrovelia | ||
| Gerridae | Gerris | ||
| Vellidae | Microvelia | ||
| Rhagovelia | |||
| Nepidae * | Ranatra | ||
| Megaloptera | Corydalidae | Corydalus | |
| Trichoptera | Polycentropodidae | Polycentropus | |
| Hydropsychidae | Hydropsyche | ||
| Leptonema | |||
| Rhyacophilidae | Atopsyche | ||
| Rhyacophila | |||
| Glossosomatidae | Protoptila | ||
| Hydroptilidae | Hydroptila | ||
| Leucotrichia | |||
| Limnephilidae | Limnephilus | ||
| Lepidostomatidae | Lepidostoma | ||
| Helicopsychidae | Helicopsyche | ||
| Calamoceratidae * | Phylloicus | ||
| Leptoceridae * | Oecetis | ||
| Lepidoptera | Pyralidae | Paragyractis | |
| Coleoptera | Dytiscidae | Dytiscus | |
| Laccophilus | |||
| Gyrinidae | Dineutus | ||
| Gyrinus | |||
| Hydroptilidae | Hydrobius | ||
| Hydrophilus | |||
| Dryopidae | Helichus | ||
| Elmidae | Cylloepus | ||
| Heterelmis | |||
| Microcylloepus | |||
| Phanocerus | |||
| Diptera | Tipulidae | Tipula | |
| Culicidae | Culex | ||
| Ceratopogonidae | Dasyhelea | ||
| Chironomidae | Chironomus | ||
| Pentaneura | |||
| Simullidae | Simulium | ||
| Stratiomyidae | Odontomyia | ||
| Tabanidae | Tabanus | ||
| Rhagionidae * | Atheris | ||
| Empididae | Hemerodromia | ||
| Syrphidae * | Eristalis | ||
| Muscidae | Limnophora | ||
| Anthomyiidae | |||
| Psychodidae | |||
| Sciomyzidae | |||
| Arachnida | Acarina | Hydracaridae |
References
- Mustow, S.E. Biological monitoring of rivers in Thailand: Use and adaptation of the BMWP score. Hydrobiologia 2002, 479, 191–229. [Google Scholar] [CrossRef]
- Roche, K.F.; Queiroz, E.P.; Righi, K.O.; De Souza, G.M. Use of the BMWP and ASPT indexes for monitoring environmental quality in a neotropical stream. Acta Limnol. Bras. 2010, 22, 105–108. [Google Scholar] [CrossRef]
- Wyżga, B.; Oglęki, P.; Hajdukiewicz, H.; Zawiejska, J.; Radecki-Pawlik, A.; Skalski, T.; Mikuś, P. Interpretation of the invertebrate-based BMWP-PL index in a gravel-bed river: Insight from the Polish Carpathians. Hydrobiologia 2013, 712, 71–88. [Google Scholar] [CrossRef]
- Paisley, M.F.; Trigg, D.J.; Walley, W.J. Revision of the Biological Monitoring Working Party (BMWP) score system: Derivation of present-only and abundance-related scores from field data. River Res. Appl. 2014, 30, 887–904. [Google Scholar] [CrossRef] [Green Version]
- Mao, F.; Zhao, X.; Ma, P.; Chi, S.; Richards, K.; Hannah, D.M.; Krause, S. Revision of biological indices for aquatic systems: A ridge-regression solution. Ecol. Ind. 2019, 106, 105478. [Google Scholar] [CrossRef]
- Armitage, P.D.; Moss, D.; Wright, J.F.; Furse, M.T. The performance of a new biological water quality score system based on macroinvertebrates over a wide range of unpolluted running-water sites. Water Res. 1983, 17, 333–347. [Google Scholar] [CrossRef]
- Hilty, J.; Merenlender, A. Faunal indicator taxa selection for monitoring ecosystem health. Biol. Conserv. 2000, 92, 185–197. [Google Scholar] [CrossRef]
- Akyildiz, G.K.; Duran, M. Evaluation of the impact of heterogeneous environmental pollutants on benthic macroinvertebrates and water quality by long-term monitoring of the buyuk menderes river basin. Environ. Monit. Assess. 2021, 193, 280. [Google Scholar] [CrossRef]
- Hawkes, H.A. Origin and development of the biological monitoring working party score system. Water Res. 1997, 32, 964–968. [Google Scholar] [CrossRef]
- Alba-Tercedor, J.; Sánchez-Ortega, A. Un método rápido y simple para evaluar la calidad biológica de las aguas corrientes basado en el de Hellawell (1978). Limnética 1988, 4, 51–56. [Google Scholar]
- Roldán-Pérez, G. Bioindicación de la Calidad del Agua en Colombia: Uso del Método BMWP/Col, 1st ed.; Editorial Universidad de Antioquia: Medellín, Colombia, 2003; pp. 1–170. [Google Scholar]
- Junqueira, V.M.; Campos, S.C.M. Adaptation of the “BMWP” method for wáter quality evaluation to Rio Das Velhas watershed (Minas Gerais, Brazil. Acta Limnol. Bras. 1998, 10, 125–135. [Google Scholar]
- Ruiz-Picos, R.A.; Sedeño-Díaz, J.E.; López-López, E. Calibrating and validating the Biomonitoring Working Party (BMWP) index for the Bioassessment of water quality in neotropical streams. In Water Quality, 1st ed.; Tutu, H., Ed.; IntechOpen: London, UK, 2017; pp. 39–58. [Google Scholar]
- Monaghan, K.A. Four reasons to question the accuracy of a biotic index; the risk of metric bias and the scope to improve accuracy. PLoS ONE 2016, 11, e0158383. [Google Scholar] [CrossRef] [Green Version]
- Walley, W.J.; Hawkes, H.A. A computer-based reappraisal of the Biological Monitoring Working Party scores using data from the 1990 river quality survey of England and Wales. Water Res. 1996, 30, 2086–2094. [Google Scholar] [CrossRef]
- Cornejo, A.; López-López, E.; Sedeño-Díaz, J.E.; Ruiz-Picos, R.A.; Macchi, P.; Kohlmann, B.; Correa-Araneda, F.; Boyero, L.; Bernal-Vega, J.; Ríos, T.; et al. Protocolo de Biomonitoreo Para la Vigilancia de la Calidad del Agua en Afluentes Superficiales de Panamá, 1st ed.; Instituto Conmemorativo Gorgas de Estudios de la Salud: Panamá, Panama, 2019; pp. 1–81. [Google Scholar]
- Ruiz-Picos, R.A.; Kohlmann, B.; Sedeño-Díaz, J.E.; López-López, E. Assessing ecological impairments in Neotropical rivers of Mexico: Calibration and validation of the Biomonitoring Working Party Index. Int. J. Environ. Sci. Technol. 2017, 14, 1835–1852. [Google Scholar] [CrossRef]
- Lee, S.; Hwang, S.; Lee, J.; Jung, D.; Park, Y.; Kim, J. Overview and application of the National Aquatic Ecological Monitoring Program (NAEMP) in Korea. Ann Limnol. Int. J. Lim. 2011, 47, S3–S14. [Google Scholar] [CrossRef]
- Water: Monitoring & Assessment. Chapter 4 Macroinvertebrates and Habitat. United States Environmental Protection Agency. Available online: https://archive.epa.gov/water/archive/web/html/vms40.html (accessed on 20 August 2021).
- Surface Water Quality Monitoring. 4.2 Biological Assessment of River Quality. European Environment Agency. Available online: https://www.eea.europa.eu/publications/92-9167-001-4/page021.html (accessed on 20 August 2021).
- Framework for Assessment of River and Wetland Health (FARWH), WetlandInfo Website. Department of Environment and Science, Australia. Available online: https://wetlandinfo.des.qld.gov.au/wetlands/resources/tools/assessment-search-tool/framework-for-assessment-of-river-and-wetland-health-farwh/ (accessed on 20 August 2021).
- MINAE-S (Ministerio del Ambiente y Energía—Ministerio de Salud). Reglamento Para la Evaluación y la Clasificación de la Calidad de Cuerpos de Agua Superficiales. Decreto Ejecutivo 33903, 1st ed.; Diario Oficial La Gaceta 178: San José, Costa Rica, 2007; pp. 1–16. [Google Scholar]
- River Eco-Status Monitoring Programme. Department of Water and Sanitation Republic of South Africa. Available online: https://www.dws.gov.za/iwqs/rhp/default.aspx (accessed on 20 August 2021).
- Eriksen, T.E.; Brittain, J.E.; Søli, G.; Jacobsen, D.; Goethals, P.; Friberg, N. A global perspective on the application of riverine macroinvertebrates as biological indicators in Africa, South-Central America, Mexico and Southern Asia. Ecol. Indic. 2021, 126, 107609. [Google Scholar] [CrossRef]
- Pineda, L.R.; Pérez, M.R.M.; Mathuriau, C.; Villalobos, H.J.L.; Barba, A.R. Protocolo de Muestreo de Macroinvertebrados en Aguas Continentales Para la Aplicación de la Norma de Caudal Ecológico (NMX-AA-159-SCFI-2012), 1st ed.; Programa Nacional de Reservas de Agua: Mexico City, Mexico, 2014; pp. 1–47. [Google Scholar]
- Rosas-Acevedo, J.L.; Ávila-Pérez, H.; Sánchez-Infante, A.; Rosas-Acevedo, A.Y.; García-Ibañez, S.; Sampedro-Rosas, L.; Granados-Ramírez, J.G.; Juárez-López, A.L. Índice BMWP, FBI y EPT para determinar la calidad del agua en la laguna de Coyuca de Benítez, Guerrero, México. Rev. Iberoam. Cienc. 2014, 1, 81–88. [Google Scholar]
- Rosas-Acevedo, J.L.; Rosas-Acevedo, A.Y.; Sánchez-Infante, A.; Sampedro-Rosas, L.; Juárez-López, A.L. Evaluación del medio físico y calidad del agua por medio de insectos bioindicadores, en el brazo derecho del cauce Aguas Blancas, Acapulco, Gro., México. Entomol. Mex. 2015, 2, 689–694. [Google Scholar]
- Morrone, J.J. Regionalización biogeográfica y evolución biótica de México: Encrucijada de la biodiversidad del Nuevo Mundo. Rev. Mex. Biod. 2019, 90, e902980. [Google Scholar] [CrossRef]
- López-Hernández, M. Caracterización Limnológica del Río Duero. Ph.D. Thesis, Universidad Nacional Autónoma de México, Mexico City, Mexico, 1997. [Google Scholar]
- Rivera-Rivas, M.V. Relación de Parámetros Fisicoquímicos y Presencia de Macroinvertebrados Para Determinar la Calidad del Agua del río Duero, Michoacán. Master’s Thesis, Instituto Politécnico Nacional, Mexico City, Mexico, 2016. [Google Scholar]
- Moncayo-Estrada, R.; Zarazúa, J.A. Saneamiento Integral de una Cuenca Hidrográfica. Entorno Ambiental y Socioeconómico, Problemática y Soluciones, 1st ed.; Instituto Politécnico Nacional: Mexico City, Mexico, 2016; pp. 1–446. [Google Scholar]
- Silva, J.T.; Moncayo, R.; Ochoa, S.; Cruz-Cárdenas, G.; Escalera, C.; Villalpando, F.; Nava, J.; Ramos, A.; López, M. Calidad química del agua subterránea y superficial en la cuenca del río Duero, Michoacán. Tecnol. Cienc. Agua 2013, 4, 127–146. [Google Scholar]
- Moncayo-Estrada, R.; Lyons, J.; Ramírez-Herrejón, J.P.; Escalera-Gallardo, C.; Campos-Campos, O. Status and trends in biotic integrity in a sub-tropical river drainage: Analysis of the fish assemblage over a three decade period. River Res. Appl. 2015, 31, 808–824. [Google Scholar] [CrossRef]
- Silva, J.T.; Ochoa, S.; Cruz-Cárdenas, G.; Nava, J.; Villalpando, F. Manantiales de la cuenca del río Duero Michoacán: Operación, calidad y cantidad. Rev. Int. Contam. Ambient. 2016, 32, 55–68. [Google Scholar]
- Méndez-Toribio, M.; Zermeño-Hernández, I.; Ibarra-Manríquez, G. Effect of land use on the structure and diversity of riparian vegetation in the Duero river watershed in Michoacán, Mexico. Plant Ecol. 2014, 215, 285–296. [Google Scholar] [CrossRef]
- APHA. Standard Methods for the Examination of Water and Wastewater, 23rd ed.; American Public Health Association/American Water Works Association/Water Environment Federation: Washington, DC, USA, 2017; p. 9260. [Google Scholar] [CrossRef]
- Pennak, R.W. Fresh-Water Invertebrates of the United States, 2nd ed.; John Wiley & Sons: Hoboken, NJ, USA, 1978; pp. 1–803. [Google Scholar]
- Merritt, R.W.; Cummins, K.W.; Berg, M.B. An Introduction to the Aquatic Insects of North America, 4th ed.; America Kendall Publishing: Dubuque, IA, USA, 2008; pp. 1–1158. [Google Scholar]
- Thorp, J.; Covich, A. Ecology and Classification of North American Freshwater Invertebrates, 3rd ed.; Academic Press: Cambridge, MA, USA, 2009; pp. 1–1021. [Google Scholar]
- Brown, R.M.; McClelland, N.I.; Deininger, R.A.; Landwehr, J.M. Validating the WQI. In National Meeting of American Society of Civil Engineers on Water Resources Engineering; American Society of Civil Engineers: Washington, DC, USA, 1973. [Google Scholar]
- Barbour, M.T.; Gerritsen, J.; Snyder, B.D.; Stribling, J.B. Rapid Bioassessment Protocols for Use in Streams and Wadeable Rivers: Periphyton, Benthic Macroinvertebrates and Fish, 2nd ed.; EPA 841-B-99-002; U.S. Environmental Protection Agency, Office of Water: Washington, DC, USA, 1999; pp. 1–337. [Google Scholar]
- Masese, F.O.; Raburu, P.O. Improving the performance of the EPT Index to accommodate multiple stressors in Afrotropical streams. Afr. J. Aquat. Sci. 2017, 42, 219–233. [Google Scholar] [CrossRef]
- Chao, A.; Gotelli, N.J.; Hsieh, T.C.; Sander, E.L.; Ma, K.H.; Colwell, R.K.; Ellison, A.M. Rarefaction and extrapolation with Hill numbers: A framework for sampling and estimation in species diversity studies. Ecol. Monogr. 2014, 22, 45–67. [Google Scholar] [CrossRef] [Green Version]
- Zamora-Muñoz, C.; Sáinz-Cantero, C.E.; Sánchez-Ortega, A.; Alba-Tercedor, J. Are biological indices BMWP’ and ASPT’ and their significance regarding water quality seasonally dependent? Factors explaining their variations. Water Res. 1995, 29, 285–290. [Google Scholar] [CrossRef]
- Kennen, J.G.; Sullivan, D.J.; May, J.T.; Bell, A.H.; Beaulieu, K.M.; Rice, D.E. Temporal changes in aquatic-invertebrate and fish assemblages in streams of the north-central and northeastern US. Ecol. Indic. 2012, 18, 312–329. [Google Scholar] [CrossRef]
- Anderson, M.J. A new method for non-parametric multivariate analysis of variance. Austral. Ecol. 2001, 26, 32–46. [Google Scholar] [CrossRef]
- McCune, B.; Grace, J.B.; Urban, D.L. Analysis of Ecological Communities, 1st ed.; MjM Software Design, Wild Blueberry Media LLC: Corvallis, OR, USA, 2000; pp. 1–284. [Google Scholar]
- Anderson, M.J. Permutational Multivariate Analysis of Variance (PERMANOVA). In Wiley StatsRef: Statistics Reference Online, 1st ed.; Balakrishnan, N., Colton, T., Everitt, B., Piegorsch, W., Ruggeri, F., Teugels, J.L., Eds.; John Wiley & Sons, Ltd.: Hoboken, NJ, USA, 2017; pp. 1–15. [Google Scholar]
- Oksanen, J.; Blanchet, F.G.; Kindt, R.; Legendre, P.; O’Hara, R.B.; Simpson, G.L.; Solymos, P.; Stevens, M.H.H.; Wagner, H. Vegan: Community Ecology Package. R Package Version 2.5-7, 2020. Available online: https://cran.r-project.org/web/packages/vegan/index.html (accessed on 15 October 2020).
- Harrell, F.E., Jr. Hmisc: Harrell Miscellaneous. R Package Version 4.5-0, 2021. Available online: https://cran.r-project.org/web/packages/Hmisc/Hmisc.pdf (accessed on 15 October 2020).
- R Core Team. R: A Language and Environment for Statistical Computing; R Foundation for Statistical Computing: Vienna, Austria, 2021; Available online: https://www.R-project.or.rg/ (accessed on 16 August 2021).
- Pond, G.J.; McMurray, S.E. A Macroinvertebrate Bioassesment Index for Headwater Streams of the Eastern Coalfield Region, Kentucky, 1st ed.; Kentucky Department for Environmental Protection: Frankfort, KY, USA, 2002; pp. 1–48. [Google Scholar]
- Torrisi, M.; Scuri, S.; Dell’Uomo, A.; Cocchioni, M. Comparative monitoring by means of diatoms, macroinvertebrates and chemical parameters of an Apennine watercourse of central Italy: The river Tenna. Ecol. Indic. 2010, 10, 910–913. [Google Scholar] [CrossRef]
- Pardo, I.; Costas, N.; Méndez-Fernández, L.; Martínez-Madrid, M.; Rodríguez, P. Changes in invertebrate community composition allow for consistent interpretation of biodiversity loss in ecological status assessment. Sci. Total Environ. 2020, 715, 136995. [Google Scholar] [CrossRef] [PubMed]
- Von der Ohe, P.C.; Prüß, A.; Schäfer, R.B.; Liess, M.; de Deckere, E.; Bracka, W. Water quality indices across Europe—A comparison of the good ecological status of five river basins. J. Environ. Monit. 2007, 9, 970–978. [Google Scholar] [CrossRef]
- Roldán-Pérez, G. Los macroinvertebrados como bioindicadores de la calidad del agua: Cuatro décadas de desarrollo en Colombia y Latinoamerica. Rev. Acad. Colomb. Cienc. Exactas Físicas Nat. 2016, 40, 254–274. [Google Scholar] [CrossRef] [Green Version]
- Andrade, I.C.P.; Krolow, T.K.; Boldrini, R. Diversity of EPT (Ephemeroptera, Plecoptera, Trichoptera) along streams fragmented by waterfalls in the Brazilian Savanna. Neotrop. Entomol. 2020, 49, 203–212. [Google Scholar] [CrossRef]
- Ochien, H.; Odong, R.; Okot-Okumu, J. Comparison of temperate and tropical versions of Biological Monitoring Working Party (BMWP) index for assessing water quality of River Aturukuku in Eastern Uganda. Glob. Ecol. Conserv. 2020, 23, e01183. [Google Scholar] [CrossRef]
- Lyons, J.; Piller, K.R.; Artigas-Azas, J.M.; Dominguez-Dominguez, O.; Gesundheit, P.; Köck, M.; Medina-Nava, M.; Mercado-Silva, N.; García, A.R.; Findley, K.M. Distribution and current conservation status of the Mexican Goodeidae (Actinopterygii, Cyprinodontiformes). ZooKeys 2019, 885, 115–158. [Google Scholar] [CrossRef] [PubMed]
- Poi, A.S.G.; Neiff, J.J.; Casco, S.L.; Gallardo, L.I. Macroinvertebrates of Eichhornia crassipes (Pontederiaceae) roots in the alluvial floodplain of large tropical rivers (Argentina). Int. J. Trop. Biol. 2020, 68, 104–115. [Google Scholar] [CrossRef]


| Sites | Temperature °C | Conductivity µS cm−1 20 °C | pH | Dissolved Oxygen mg L−1 O2 | NH+4-N mg L−1 | NO3-N mg L−1 | Turbidity UTM | Transparency Proportion | BOD5 mg L−1 O2 | Discharge m s−1 | ColFec MPN 100 mL−1 |
|---|---|---|---|---|---|---|---|---|---|---|---|
| Kuinio | 16.8 | 180.4 | 6.6 | 9.3 | 1.2 | 1.4 | 0.2 | 1 | 0.4 | 5.4 | 277,817.0 |
| Tacuro | 17.3 | 184.6 | 7.3 | 9.4 | 1.0 | 2.0 | 5.9 | 1 | 1.6 | 5.8 | 700,851.1 |
| Toma | 17.7 | 163.9 | 6.7 | 9.0 | 2.2 | 1.0 | 2.5 | 1 | 0.6 | 1.1 | 11,122.6 |
| Rastro | 18.4 | 197.9 | 6.9 | 8.4 | 3.1 | 5.8 | 23.0 | 1 | 25.6 | 3.3 | 57,037.2 |
| Etúcuaro | 19.0 | 199.4 | 6.9 | 8.3 | 1.8 | 1.9 | 19.8 | 1 | 15.4 | 4.2 | 80,601.1 |
| Camécuaro | 20.8 | 196.0 | 7.1 | 8.0 | 1.6 | 0.8 | 5.0 | 1 | 1.2 | 9.9 | 2,061,888.9 |
| AntesC | 20.6 | 149.9 | 7.4 | 8.3 | 1.8 | 1.2 | 29.2 | 0.9 | 17.2 | 2.3 | 9488.9 |
| DespuesC | 20.5 | 250.7 | 7.5 | 8.9 | 2.4 | 2.4 | 68.3 | 0.7 | 27.1 | 2.3 | 220,144.4 |
| Verduzco | 21.4 | 175.9 | 7.7 | 9.7 | 1.4 | 1.2 | 14.7 | 1 | 1.4 | 6.6 | 57,466.7 |
| Estanzuela | 21.9 | 330.5 | 6.8 | 1.3 | 6.1 | 1.6 | 63.2 | 0.2 | 20.8 | 22.1 | 7,334,062.2 |
| San Cristóbal | 23.0 | 353.7 | 6.9 | 2.7 | 7.3 | 1.8 | 1033.9 | 0.2 | 18.1 | 29.4 | 264,494.4 |
| Capulín | 23.5 | 371.1 | 6.9 | 1.2 | 13.0 | 1.3 | 2003.7 | 0.3 | 20.2 | 0 | 17,533.3 |
| Cumuato | 25.6 | 376.5 | 7.4 | 2.5 | 4.4 | 0.8 | 44.4 | 0.3 | 22.6 | 0 | 107,555.6 |
| Ibarra | 26.5 | 599.5 | 7.8 | 4.7 | 10.0 | 1.5 | 55.2 | 0.1 | 27.5 | 0 | 100,866.7 |
| Families | Score |
|---|---|
| Calamoceratidae, Corydalidae, Leptoceridae, Naucoridae, Nepidae, and Petaluridae | 9 |
| Anthomyiidae, Leptophlebidae, Perlidae, Polycentropodidae, Rhyacophilidae, and Sciomyzidae | 8 |
| Aeschnidae, Caenidae, Gerridae, Glossosomatidae, Lepidostomatidae, Mesoveliidae, and Syrphidae | 7 |
| Ancylidae, Athericidae, Calopterygidae, Corixidae, Helicopsychidae, Muscidae, and Tipulidae | 6 |
| Hydropsychidae, Tabanidae, and Tricorythidae | 5 |
| Agriidae, Baetidae, Cordulegastridae, Culicidae, Elmidae, Empididae, Glossiphoniidae, Pyralidae, Simuliidae, and Stratiomyidae | 4 |
| Asellidae, Belostomidae, Cambaridae, Ceratopogonidae, Chironomidae, Coenagrionidae, Dryopidae, Dytiscidae, Erpobdellidae, Gammaridae, Gomphidae, Gyrinidae, Heleidae, Heptageniidae, Herpobdellidae, Hygrobatidae, Hydrophilidae, Hydroptilidae, Isotomidae, Lestidae, Libellulidae, Limnephilidae, Limnocytheridae, Lumbriculidae, Macroveliidae, Margaritiferidae, Nematodos, Notonectidae, Physidae, Planariidae, Planorbidae, Pseudothelphusidae, Psychodidae, Sphaeriidae, Tubificidae, and Veliidae | 3 |
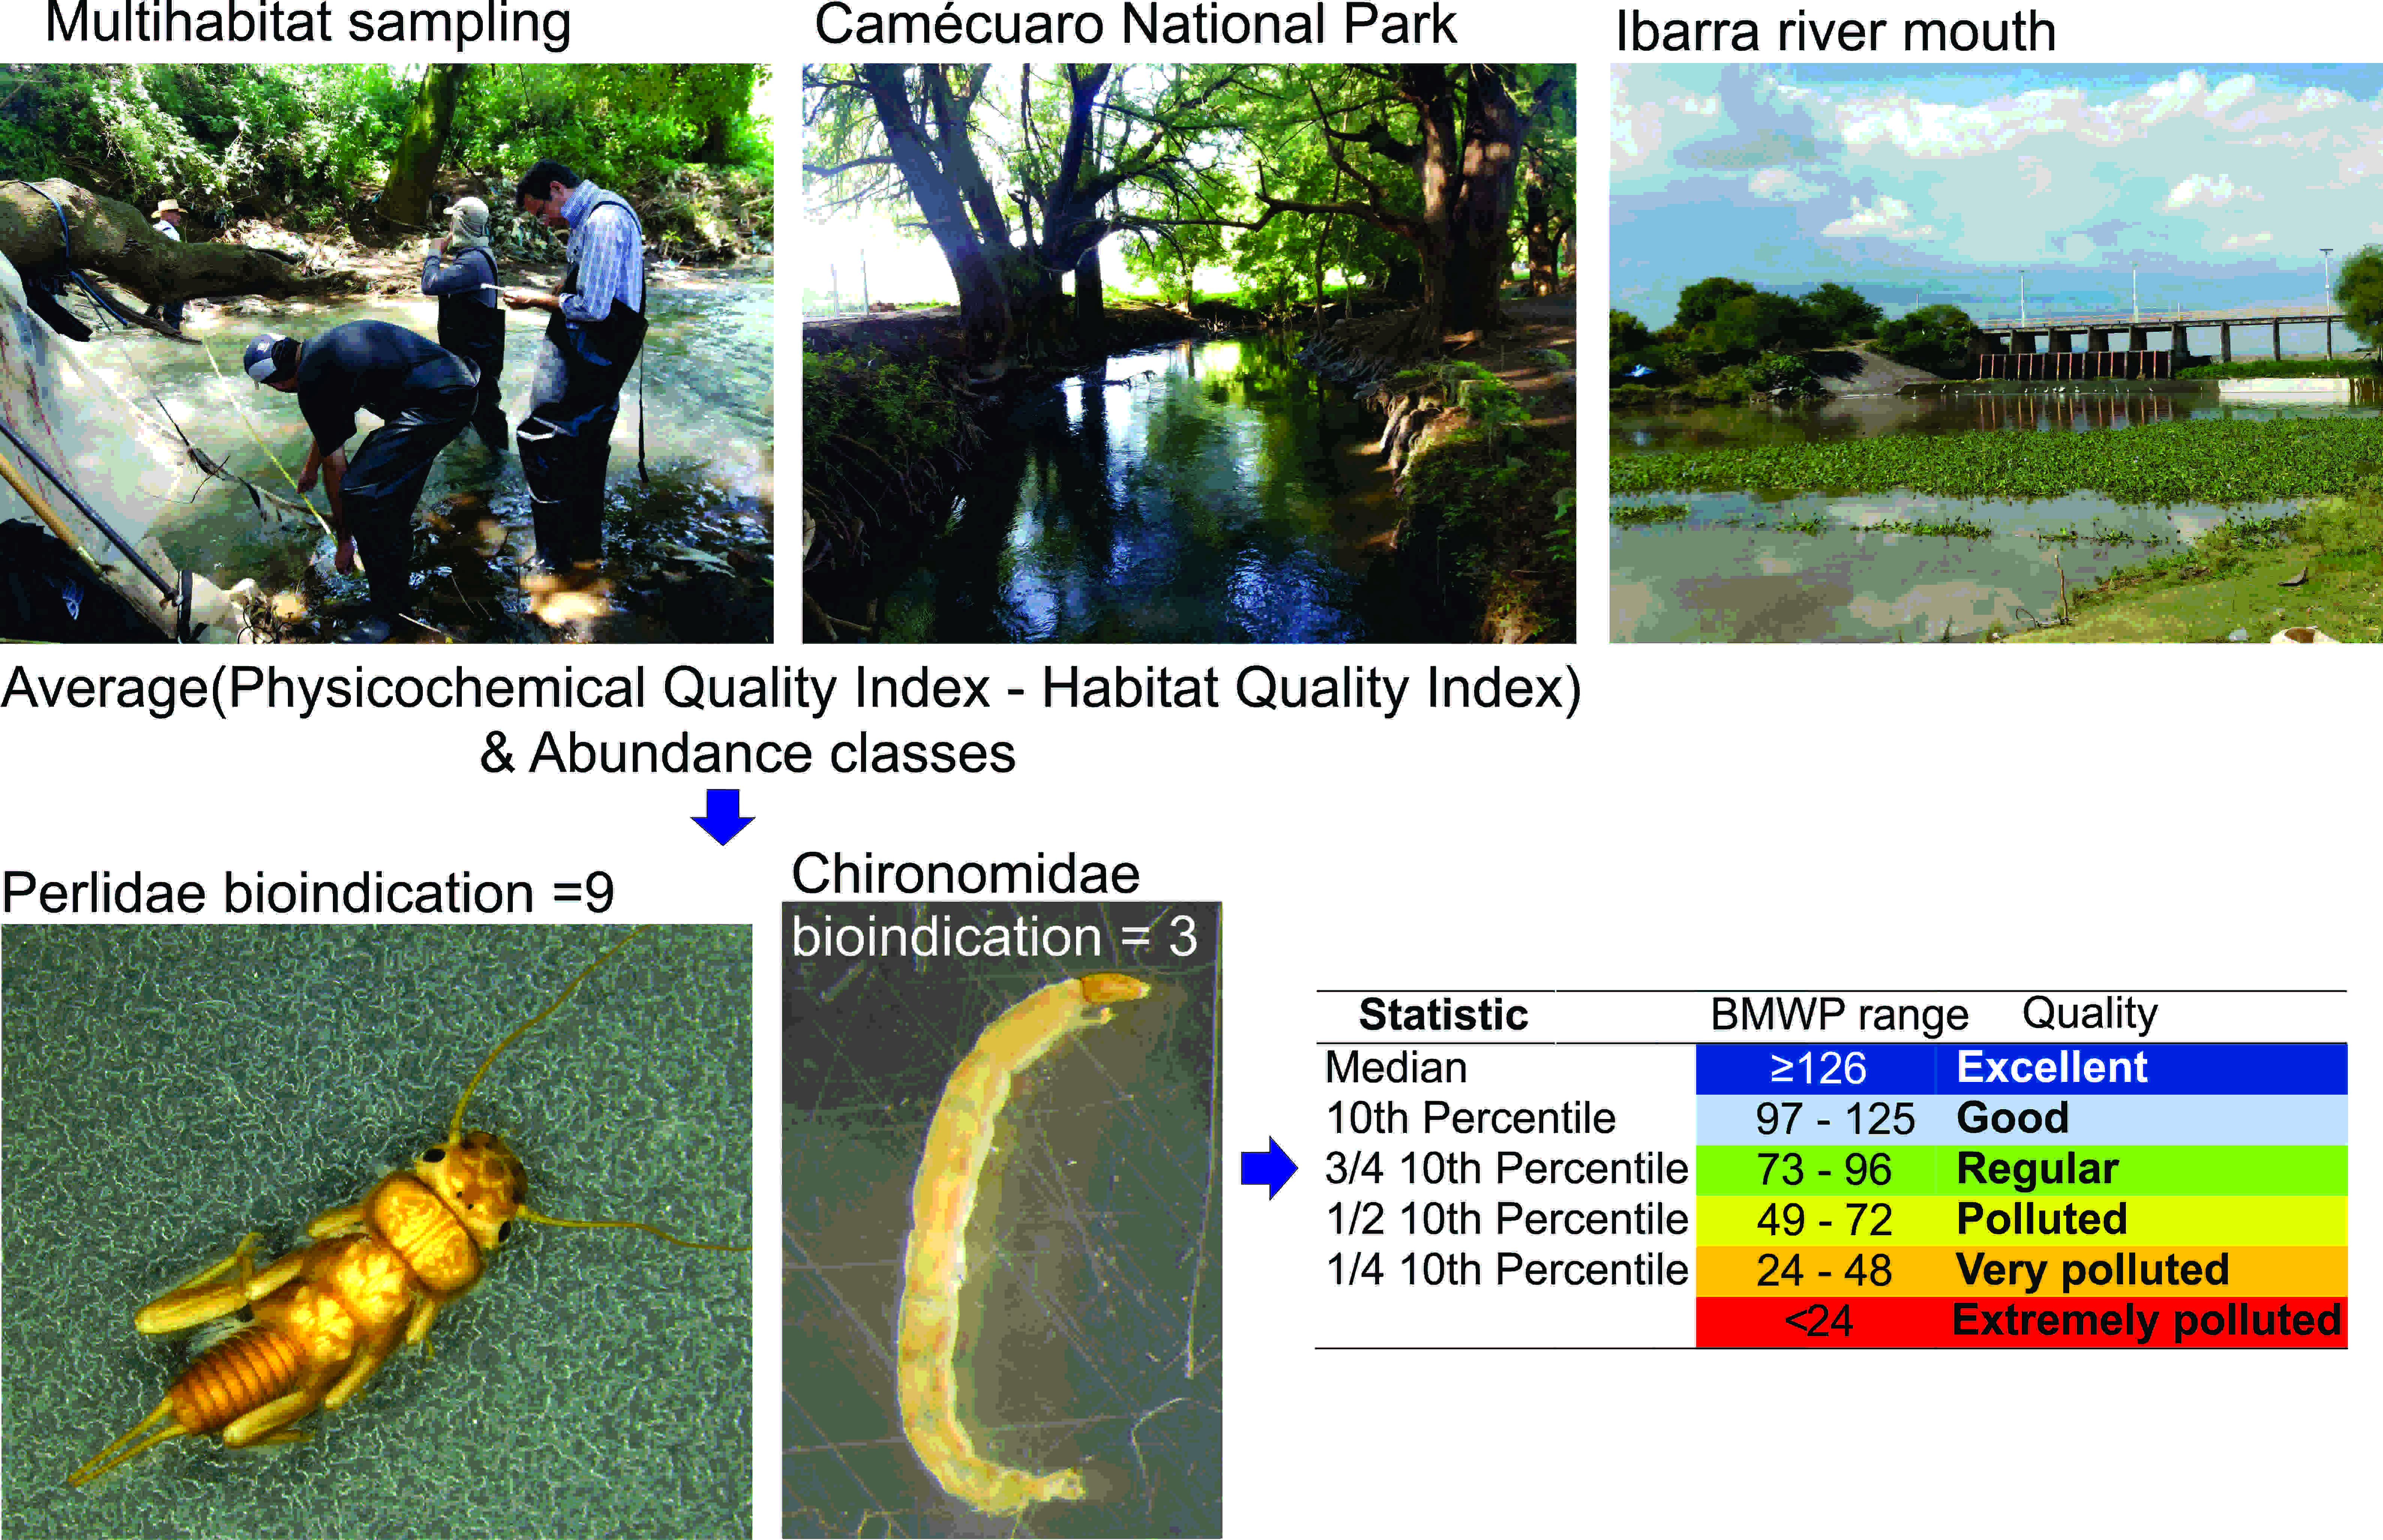
| Statistic | Range | Quality |
|---|---|---|
| Median | ≥126 | Excellent |
| 10th Percentile | 97–125 | Good |
| 3/4 10th Percentile | 73–96 | Regular |
| 1/2 10th Percentile | 49–72 | Polluted |
| 1/4 10th Percentile | 24–48 | Very polluted |
| <24 | Extremely polluted |
| Sites | HQI | Significance | NSFWQI | Significance | EPT-B | BMWP | Significance |
|---|---|---|---|---|---|---|---|
| Kuinio | 16 | Optimal | 84 | Good | 7 | 91 | Regular |
| Tacuro | 15 | Suboptimal | 77 | Good | 3 | 76 | Regular |
| La Toma | 17 | Optimal | 82 | Good | 4 | 68 | Polluted |
| El Rastro | 11 | Suboptimal | 63 | Medium | 0.1 | 63 | Polluted |
| Etúcuaro | 8 | Marginal | 64 | Medium | 2 | 33 | Very polluted |
| Camécuaro | 17 | Optimal | 73 | Good | 1 | 37 | Very polluted |
| AntesC | 12 | Suboptimal | 68 | Medium | 14 | 73 | Regular |
| DespuésC | 12 | Suboptimal | 62 | Medium | 2 | 93 | Regular |
| Verduzco | 16 | Optimal | 74 | Good | 35 | 74 | Regular |
| Estanzuela | 7 | Marginal | 44 | Bad | 0.1 | 19 | Extremely polluted |
| San Cristóbal | 6 | Marginal | 49 | Bad | 0.2 | 31 | Very polluted |
| Capulín | 5 | Poor | 41 | Bad | 1 | 18 | Extremely polluted |
| Cumuato | 5 | Poor | 43 | Bad | 1 | 41 | Very polluted |
| Ibarra | 4 | Poor | 48 | Bad | 6 | 58 | Polluted |
Publisher’s Note: MDPI stays neutral with regard to jurisdictional claims in published maps and institutional affiliations. |
© 2021 by the authors. Licensee MDPI, Basel, Switzerland. This article is an open access article distributed under the terms and conditions of the Creative Commons Attribution (CC BY) license (https://creativecommons.org/licenses/by/4.0/).
Share and Cite
Magallón Ortega, G.; Escalera Gallardo, C.; López-López, E.; Sedeño-Díaz, J.E.; López Hernández, M.; Arroyo-Damián, M.; Moncayo-Estrada, R. Water Quality Analysis in a Subtropical River with an Adapted Biomonitoring Working Party (BMWP) Index. Diversity 2021, 13, 606. https://0-doi-org.brum.beds.ac.uk/10.3390/d13110606
Magallón Ortega G, Escalera Gallardo C, López-López E, Sedeño-Díaz JE, López Hernández M, Arroyo-Damián M, Moncayo-Estrada R. Water Quality Analysis in a Subtropical River with an Adapted Biomonitoring Working Party (BMWP) Index. Diversity. 2021; 13(11):606. https://0-doi-org.brum.beds.ac.uk/10.3390/d13110606
Chicago/Turabian StyleMagallón Ortega, Guillermo, Carlos Escalera Gallardo, Eugenia López-López, Jacinto Elías Sedeño-Díaz, Martín López Hernández, Miriam Arroyo-Damián, and Rodrigo Moncayo-Estrada. 2021. "Water Quality Analysis in a Subtropical River with an Adapted Biomonitoring Working Party (BMWP) Index" Diversity 13, no. 11: 606. https://0-doi-org.brum.beds.ac.uk/10.3390/d13110606