Article

Habitat Selection by Brown Bears with Varying Levels of Predation Rates on Ungulate Neonates

1
School of Animal, Rural and Environmental Sciences, Nottingham Trent University, Brackenhurst, Southwell NG25 0FQ, Nottinghamshire, UK
2
Departamento de Biodiversidad y Gestión Ambiental, Área de Zoología, Facultad de Biología y Ciencias Ambientales, Campus de Vegazana, Universidad de León, 24071 León, Spain
3
Faculty of Environmental Sciences and Natural Resource Management, Norwegian University of Life Sciences, 5003, NO-1432 Ås, Norway
4
Norwegian Institute for Nature Research (NINA), NO-7484 Trondheim, Norway
5
Department of Wildlife, Fish and Environmental Studies, Swedish University of Agricultural Sciences, SE-901 83 Umeå, Sweden
6
Grimsö Wildlife Research Station, Department of Ecology, Swedish University of Agricultural Sciences, SE-730 91 Riddarhyttan, Sweden
*
Author to whom correspondence should be addressed.
Submission received: 5 October 2021 / Revised: 25 November 2021 / Accepted: 14 December 2021 / Published: 17 December 2021
(This article belongs to the Special Issue Wildlife in Natural and Altered Environments)

Abstract

:
In northern Eurasia, large carnivores overlap with semi-domestic reindeer (Rangifer tarandus) and moose (Alces alces). In Scandinavia, previous studies have quantified brown bear (Ursus arctos) spring predation on neonates of reindeer (mostly in May) and moose (mostly in June). We explored if habitat selection by brown bears changed following resource pulses and whether these changes are more pronounced on those individuals characterised by higher predatory behaviour. Fifteen brown bears in northern Sweden (2010–2012) were fitted with GPS proximity collars, and 2585 female reindeers were collared with UHF transmitters. Clusters of bear positions were visited to investigate moose and reindeer predation. Bear kill rates and home ranges were calculated to examine bear movements and predatory behaviour. Bear habitat selection was modelled using resource selection functions over four periods (pre-calving, reindeer calving, moose calving, and post-calving). Coefficients of selection for areas closer to different land cover classes across periods were compared, examining the interactions between different degrees of predatory behaviour (i.e., high and low). Bear habitat selection differed throughout the periods and between low and high predatory bears. Differences among individuals’ predatory behaviour are reflected in the selection of habitat types, providing empirical evidence that different levels of specialization in foraging behaviour helps to explain individual variation in bear habitat selection.

1. Introduction

Large carnivores are partially recovering former ranges across multiple continents [1,2]. The return of large carnivores can provide ecological benefits for many ecosystems, including strengthening ecological functionality [3]. Nevertheless, large carnivore recovery also brings along a range of management implications and undesired effects, e.g., depredation of livestock is a major source of human–wildlife conflict [4].
In northern Europe, natural range expansion is ongoing for the grey wolf (Canis lupus), the brown bear (Ursus arctos), the wolverine (Gulo gulo), and the Eurasian lynx (Lynx lynx) [5]. Across a vast area that includes Fennoscandia and the northern latitudes of Russia, large carnivores overlap with the domesticated reindeer (Rangifer tarandus). In Sweden and Norway, reindeer herding is a major activity and part of the culture of the indigenous Samí people [6]. Around 50% of land in Sweden and Norway, the northern half of each country is utilised for reindeer husbandry [7,8]. The reindeer used within husbandry practices within Sweden and Norway are semi-domesticated, where movement is monitored and managed across a wider spatial scale and individuals may be subject to husbandry activities at certain times (e.g., health checks and transportation); however, individuals have the same access as wild species the majority of the time [9]. Brown bear, lynx, and wolverine largely overlap with the wide distribution of reindeer in Sweden and Norway [10], while the wolf breeding range is limited by management to south-central Sweden and Norway, precisely to avoid conflict with the reindeer husbandry industry [11].
Reindeer are particularly susceptible to predation by large carnivores during calving in spring, when up to 30% of calves are killed [12]. The loss of calves, especially female calves can have a great demographic impact upon populations by reducing potential future mating adults [8]. This demographic impact results in economic losses for herders [10]. Currently, management both in Sweden and Norway uses compensation systems to mitigate issues associated with carnivore predation upon livestock [13].
During the moose (Alces alces) calving period, moose neonates make up 36–44% of the seasonal dietary intake of brown bears in south central Sweden [14]. Yearling moose and neonates tend to be more vulnerable to predation by brown bears than adults [15]. Studies have highlighted that brown bears are ineffective predators of adult moose [16], instead focusing hunting efforts during the calving periods upon vulnerable individuals. This is indicated by the loss of around 26% of moose neonates to predation [17]. Although kill rates upon moose neonates are high, they vary between individuals with reported rates ranging from 2% to 52% [18]. Moose predation by brown bears adds to the predation by wolves, where they overlap [19,20,21], and other large carnivores [22], as well as human induced mortality from roads and infrastructure.
Depredation of reindeer and moose generates, besides economic damage, a level of conflict that results in a high rate of poaching of large carnivores [23]. For instance, poaching accounts for 46% of mortality for the Eurasian lynx [24] and 60% of mortality for wolverines in northern Scandinavia [25]. Altogether, large carnivore depredation is a major cause of conflict in Sweden and Norway, which illustrates the link (and challenge) between socioeconomic damage and the goal of preserving large carnivores in human-dominated landscapes.
High kill rates of bears on calves of large herbivores of economic interest and the associated human–wildlife conflicts highlight a need for research into the predation of domesticated or semi-domesticated species. Sivertsen et al. [9] examined this topic within northern Sweden, focusing on spatial overlap between semi-domesticated reindeer and brown bears. The study concluded that there was a significant increase in spatial overlap between habitats utilised by reindeer and brown bears during high predation periods compared to low predation periods. Furthermore, Sivertsen et al. [9] highlighted that brown bears selected land cover types utilised by reindeer during predation periods. This was indicated by noticeably greater selection of open areas, deciduous forest, and lichen forests during the predation period for brown bears.
Large individual variation has been shown in bear habitat selection [26] and bear kill rates [14,21]. The latter parameter implies different levels of specialization reflecting individual differences in foraging behaviour [27], which may help explain the large individual variation in bear habitat selection [28]. In this study, we have explored if brown bear habitat selection changes following pulses of resources. We analysed whether brown bears changed their selection of habitat during the spring to take advantage of vulnerable neonate calves of reindeer and moose. Such a process would illustrate an active hunting strategy of brown bears in spring, when their diet is more dependent on animal protein than during the rest of the year [29]. We also investigated if habitat selection changes are more pronounced on those individuals characterised by higher predation behaviours.
Based on previous studies [9], we predict a change in land cover types selected by brown bears in an area of northern Sweden between pre-calving, reindeer-calving, moose-calving, and post-calving periods. We also predict that land cover types selected during reindeer and moose calving periods, in particular those of high predatory bears, will mirror the land cover types selected by reindeer and moose, respectively.
Improving our knowledge on the ecology of a large omnivore, the brown bear, that is also a very efficient predator of neonate ungulates, can inform managers and livestock owners how to reduce depredation. In turn, this is essential to reduce conflict and thus promote long-term conservation and human–wildlife coexistence. Furthermore, our study illustrates the importance of accounting for individual variation when studying habitat selection and predatory behaviour of a large carnivore.

2. Materials and Methods
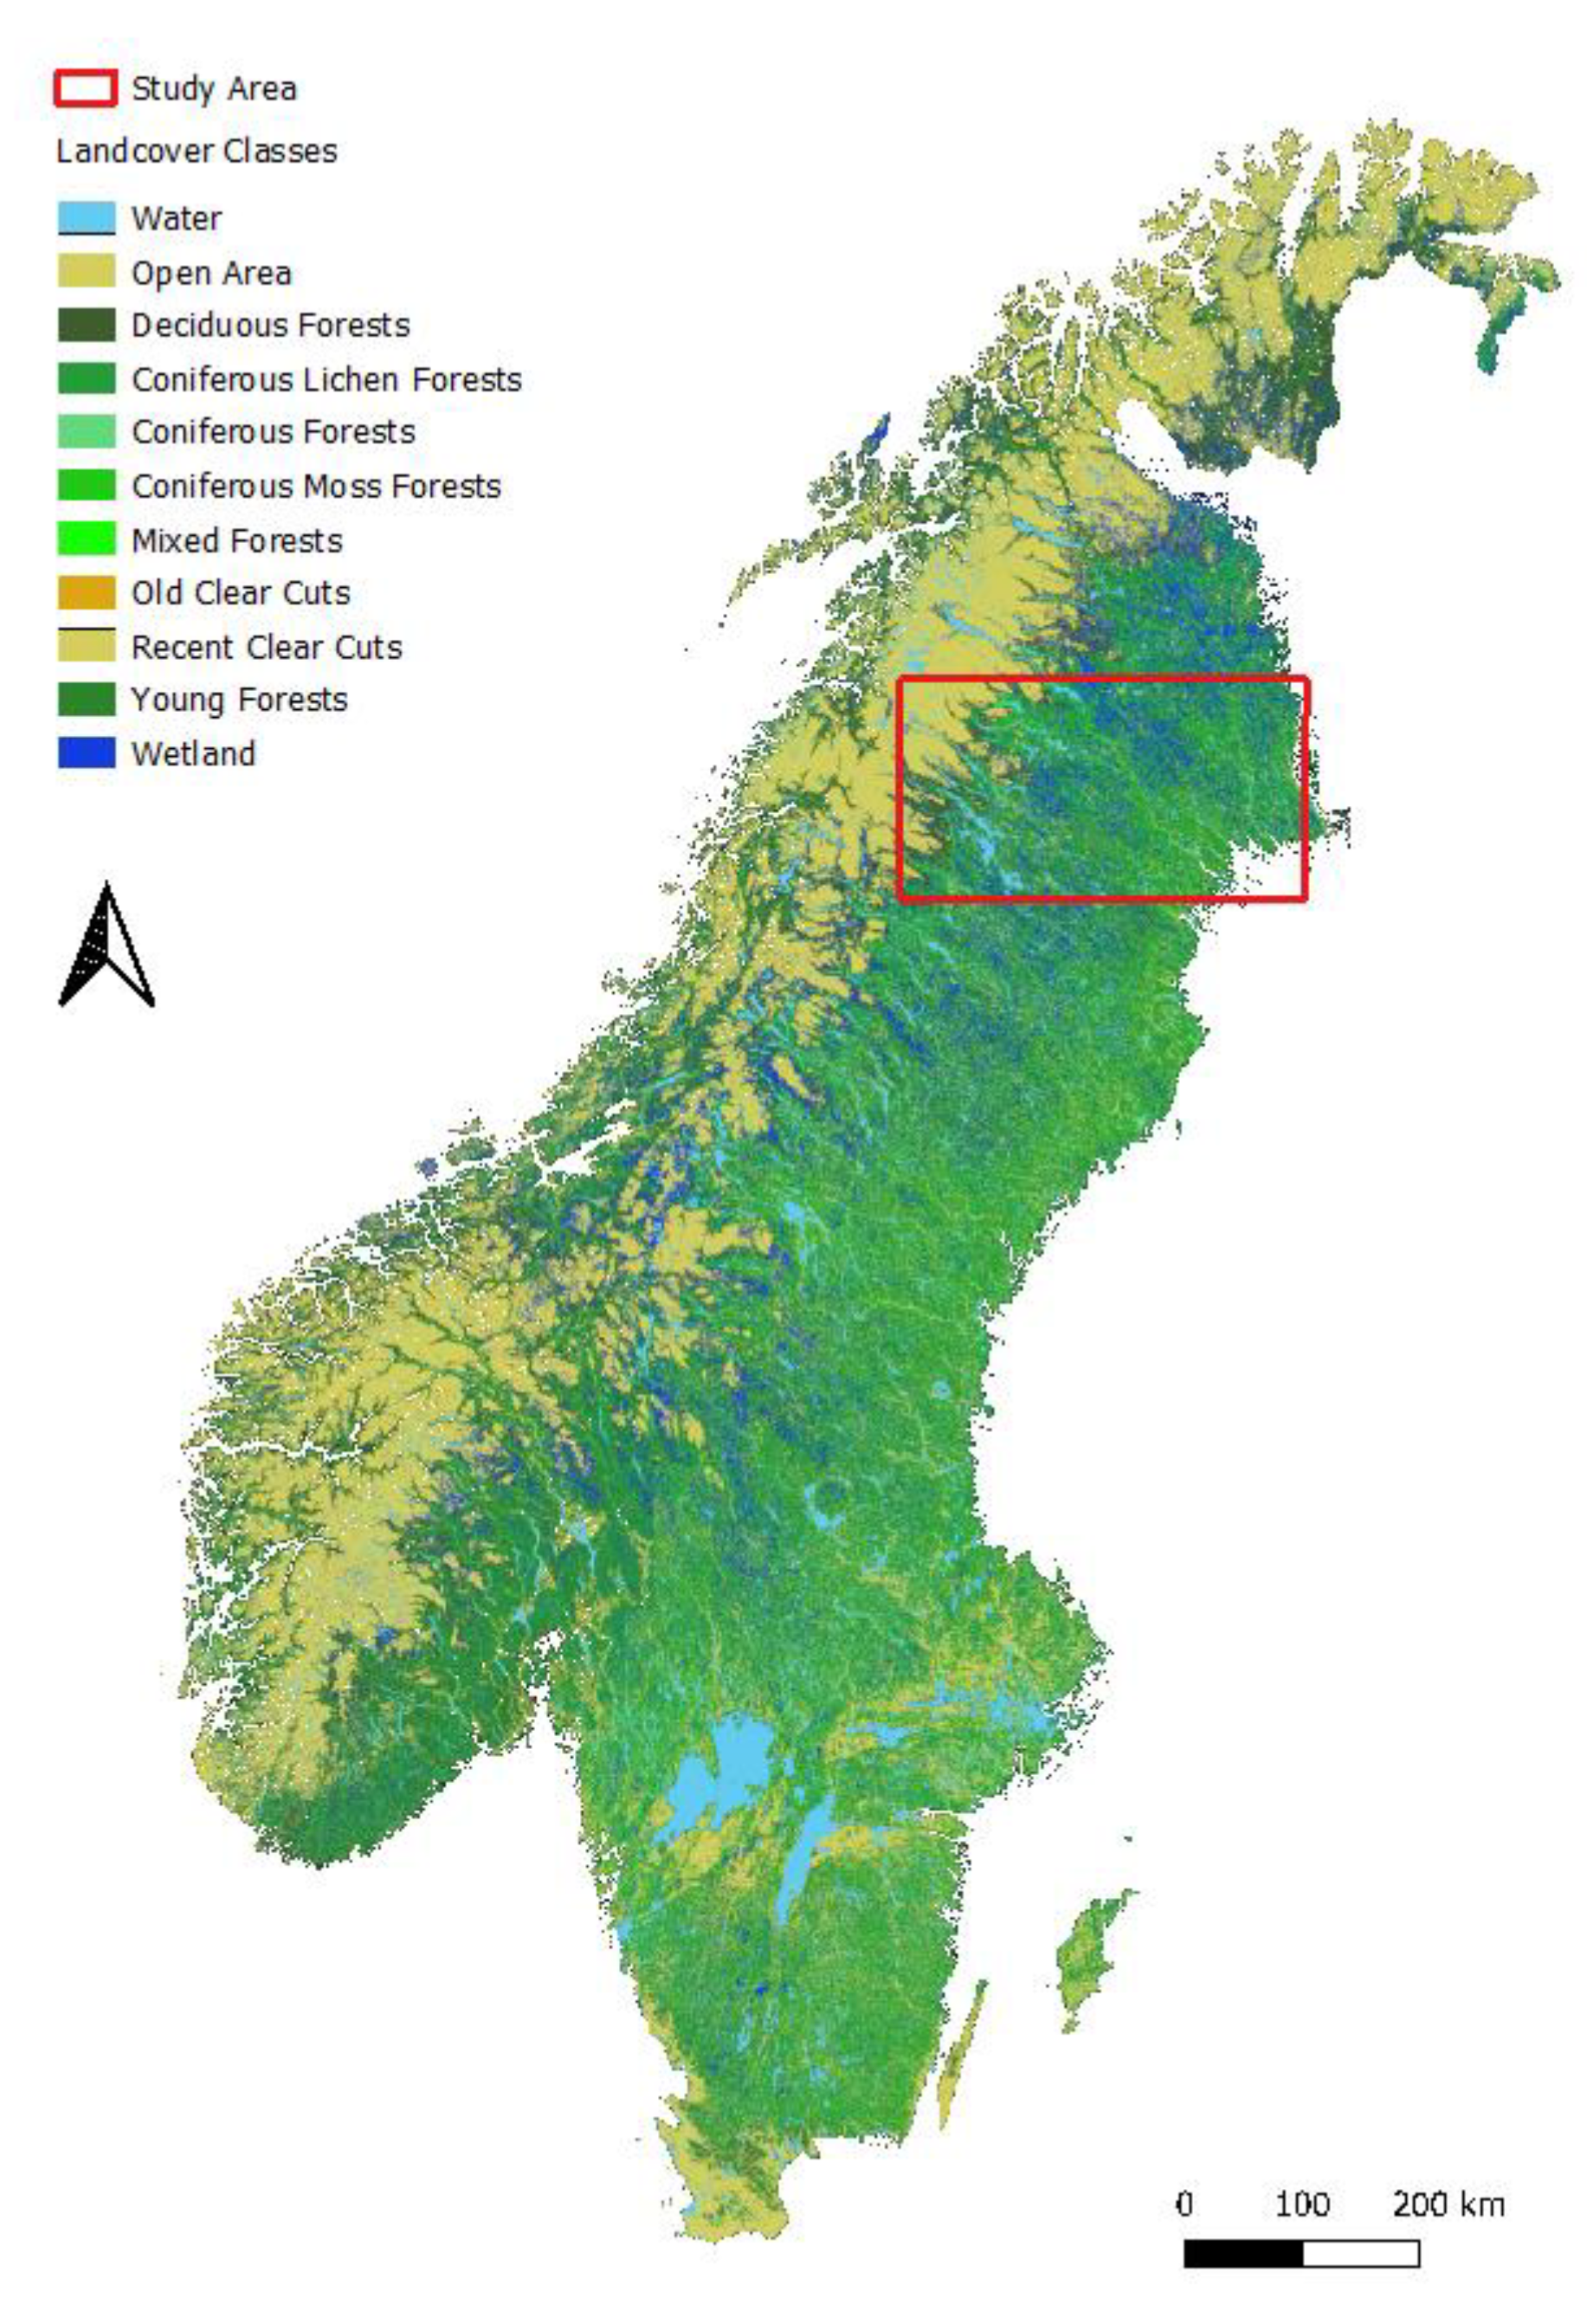
2.1. Study Area

Our study was conducted at two reindeer herding communities within Norrbotten, northern Sweden (67°00′00″ N, 17°30′00″ E) (Figure 1), from 2010 to 2012. The landscape is dominated by Norwegian Spruce (Picea abies) and Scots Pine (Pinus sylvestris) but hosts a mosaic of habitats, including lichen and moss forests, wetlands, lakes, human settlements, and infrastructures. Human density is low, 0.3–1.2 habitants/km2, but logging activities are widespread within the two herding communities [9], and the density of gravel roads is high (1 ± 0.5 km/km2—mean and SD−; [30]).
As of 2008, the brown bear population in Norrbotten was estimated at 1.2 individuals per 100 km2 [31]. Bears prey on reindeer and moose neonates, which are seasonally abundant in the study area. Within herding communities in Norrbotten, reindeer densities have been estimated at 110 per 100 km2 [9], and moose densities in Northern Sweden range between 40 and 90 individuals per 100 km² in winter, before calving [32].

2.2. Study Period—The ‘Bear Year’

On average, brown bears in Scandinavia hibernate for about six months, from October until April–May [33]. After den emergence, bear mating season occurs until early July [34]. During this period, bears predate on reindeer and moose, coinciding with their respective calving periods [12,14]. Around July, when the ungulate calving periods have ended, the so-called “hyperphagia” period begins, and Scandinavian bears rely on berries for the rest of their active season until the new hibernation period [35,36]. During the hyperphagia period, the annual hunting seasons for bears and moose begin, at the end of August and early September, respectively.
Based on this seasonality in bear behaviour, we analysed the potential variation in bear habitat selection during early spring (pre-calving period), May (main reindeer calving period; [37]), June (main moose calving period; [14]), and the summer months from July to September (hyperphagia period; [9,36,38]).

2.3. GPS Locations of Bears

To assess the habitat selection and predatory behaviour of brown bears, 24 bears were captured and fitted with GPS proximity collars between 2010 and 2012 after leaving their dens in April/May [37]. Collars recorded positions of the bears regularly (every 30 min), and also every minute if the bears were within 100 m of one of the 2585 adult female reindeers that were collared with UHF transmitters. All pregnant adult reindeer females were equipped with a neck collar with UHF transmitters. To collar the bears, captures were conducted from a helicopter using a remote drug delivery system (Dan-Inject™) [39]. Protocols for capture and handling of bears were approved by the Swedish Board of Agriculture, Uppsala Ethical Committee on Animal Experiments, and the Swedish Environmental Protection Agency [40]. A copy of the protocol is provided by Arnemo and Evans [39]. Of the 24 bears collared by Frank et al. [37], 15 were included in this study because they overlapped the area with monitored reindeer herds.

2.4. Predation Data and Clusters of GPS Positions

The tracking regime (changing from 30 to 1 min depending on the proximity to reindeer) helped us to identify predatory events in the field. Clusters of consecutive positions within a very small area occurred when one of the collared bears came within approximately 100 m of a reindeer with a UHF transmitter [37]. We identified the location of these clusters on GIS and visited them in the field, accompanied by one of the reindeer herders. This allowed us to determine whether a predation event had actually occurred, and provided fine-scale information on the habitat characteristics of kill site, time of day and date when the predation event occurred, sex and age of the prey species killed and identification of the predatory bear.
Regarding bear predation on moose calves, whose mothers were not equipped with collars, we searched for carcasses at clusters of bear GPS locations [14,19]. The different methodology used for studying brown bear predation upon reindeer calves and moose calves may limit the comparison of kill rates among these two prey species; however, it still reflects the predatory behaviour of the bears studied.
Kill data was used to create two classes of bears: high predatory bears and low predatory bears. The threshold for low/high predatory bears was determined as 0.4 kills per day, i.e., the average kill rate by bears within this area [37]. An average was obtained between 2011 and 2012 to improve the sample size of the data, by accounting for bears that were monitored for a one year period only. Splitting the bears into low predatory and high predatory groups enabled us to determine if predatory behaviour influences the changes in habitat selection throughout the calving periods. Males and females were grouped together to have a viable sample for comparison between predatory behaviour, which holds higher importance to this study. Males utilised a larger area than females and sometimes hunted outside of the research area, but we accounted for this by classifying high and low predatory behaviour based on daily kill rates within the study area. An average of kill rates across the years recorded was used to account for other factors that may influence the level of predatory behaviour exhibited by each individual (i.e., if an individual had cubs one year but none the previous or next year). Using an average over the years has allowed the study to look at baseline predatory behaviour for each individual and thus examine the influence of predatory behaviour upon habitat selection.

2.5. Bear Habitat Selection

First, we estimated the monthly home ranges of each bear (Figure 2). We defined availability by creating a 95% kernel home range, using the “href” method [41]. The 95% kernel home range was chosen for mapping availability, as this reduced the effect of extreme outliers, but did not compromise the home range estimation significantly. We then sampled random locations (10 times the number of locations used by the bears) to define habitat availability randomly within the 95% kernel home range for each studied bear, to create a presence/absence dataset for use in later generalised linear mixed modelling.
We extracted the habitat characteristics of used and available locations using habitat variables that have been documented to influence bear, reindeer, and moose habitat selection ([42,43,44,45]; Table 1). The environmental data consisted of land cover types, a digital elevation model (DEM) and a road map of Sweden, as described by Sivertsen et al. [9] (Vägkartan, Geographical Data Sweden, National Land Survey of Sweden). Habitats were reclassified into 11 land cover types (Table 1). Road data were obtained from a 1:100,000 road map in vector format (Vägkartan, Geographical Data Sweden, National Land Survey of Sweden). We classified roads into smaller roads (mainly gravel roads) and major roads (public roads with regular traffic). We calculated the Euclidean distance from each location (i.e., real and random) to the nearest patch of each land cover type and roads. The minimum distance to both road types throughout all periods was 0 km. Maximum distances to roads throughout the periods was 24.12 km for public roads with regular traffic and 14.95 km for gravel roads (Supplementary materials; Table S1). The digital elevation model was used to obtain a terrain ruggedness index (TRI) using a moving window of 5 × 5 size, with a cell resolution of 25 m2, which resulted in a window of 1.56 ha around each location. TRI index values are low in flatter areas but high in both steep areas and in steep, rugged areas [46]. All GIS analyses were carried out using ArcMap 10.3.1 software [47].

2.6. Statistical Analyses

We used resource selection functions (RSFs) based on logistic regression (estimated using ML and Nelder–Mead optimiser) with the response variable being the used locations (1: GPS locations (Supplementary materials; Table S2)) and available locations (0: random location within individual home range) and the predictor variables described above. We used a generalised linear mixed model (GLMM) with random intercept to account for individual differences among bears in terms of amount of GPS locations and potential individual variation in habitat selection. GLMMs allow for non-normal responses, unbalanced experimental designs and complex grouping structures [48]. Within the GLMM, we described the individual bear as a random effect, whilst environmental variables were considered as fixed effects. During exploration of the fixed effects, the variable ‘recent clear cuts’ was dropped from the model due to collinearity. Removal of this variable reduced correlation between variables and decreased the variance inflation factors (VIF; [48]) to values below 3 for all other variables. In order to investigate the differences between high and low predatory bears in their selection or avoidance of habitat variables that have been documented to influence reindeer and moose habitat selection [9,49], we ran the same models with an interaction between these variables (forests, old clear cuts, open areas, and wetlands) and type of predatory behaviour.
Kill rates were compared between periods (pre-calving, reindeer calving; moose calving; post-calving) and among sex using Kruskal–Wallis and Dunn tests. We conducted all analyses with R 3.3.3 [50] and the packages ‘adehabitat’ [51] and ‘lme4’ [52].

3. Results

3.1. Bear Kill Rates

As expected, bear kills peaked during the reindeer calving period, when kills focused upon reindeer calves and a smaller number of neonate moose (Table 2). Predation continued throughout the moose calving period with similar average kill rates on both moose and reindeer, but larger bear individual variation for predation upon moose. Average reindeer kills were different among the periods (H = 15.4, df = 3, p < 0.01), whilst average moose kills were not different among the calving periods (H = 3.23, df = 3, p > 0.05).
Assessing the predatory behaviour of the 15 bears surveyed, 8 showed high predatory behaviour (>0.4 kills per day during the calving periods) and 7 showed lower predatory behaviour (Table 2).

3.2. Bear Habitat Selection (Resource Selection Function)

When considering all bears (i.e., without differentiating between those with high or low predation rates), wetlands and coniferous forests were consistently selected during the four periods, whilst coniferous lichen forests, coniferous moss forests and mixed forests were consistently avoided (Table 3). During the pre-calving period, bears selected areas close to public roads with regular traffic and open areas, whilst avoided areas close to water and gravel roads, rugged terrain, and old clear cuts. During the reindeer calving period bears continued selecting for habitats closer to open areas and avoiding areas close to water and old clear cuts, however, they changed to select habitats close to rugged areas and gravel roads avoiding habitats close to public roads with regular traffic, deciduous and young forests. The moose calving period was characterised by a significant number of changes in bear habitat selection: areas close to deciduous forests, old clear cuts, and public roads with regular traffic, previously avoided, were selected, whilst habitats closer to open areas, previously selected, were avoided. Areas close to gravel roads continued to be selected during the moose calving period, whilst habitats close to water and young forests were avoided during this second pulse of calving. The post-calving period of hyperphagia was characterised by a return to avoidance areas close to of gravel roads and rugged terrain, as during the pre-calving period, and a selection for habitats closer to deciduous and young forests, old clear cuts, and a novel selection for areas close to water, whilst habitats close to open areas were avoided.

3.3. Differences in Habitat Selection between Low and High Predatory Bears

There was variation in habitat selection by high and low predatory bears throughout the study periods (Table 4). During pre-calving, both high and low predatory bears selected habitats closer to open areas and coniferous forests. Low and high predatory bears avoided habitats closer to coniferous lichen forests and old clear cuts. High predatory bears selected habitats closer to wetlands, deciduous forests, and young forests during this period, whilst low predatory bears selected habitats closer to coniferous moss forests and mixed forests. The interactions between landcover type and predatory behaviour highlighted low predatory bears showed stronger selection for habitats closer to open areas, whereas high predatory bears showed stronger selection for habitats closer to coniferous forests and stronger avoidance of habitats closer to coniferous lichen forests.
Throughout the first calving period (reindeer calving), only one habitat type was selected by both high and low predatory bears, habitats closer to wetlands, of which bears with low predatory behaviour showed stronger selection. Multiple habitat types were avoided by both groups of bears, including habitats closer to coniferous lichen forests, coniferous moss forests, mixed forests and young forests. There was no significant difference in avoidance of habitats closer to coniferous lichen and moss forests by the low and high predatory bears; however, low predatory bears exhibited stronger avoidance of habitats closer to mixed forests and young forests compared to high predatory bears. High predatory bears selected habitats closer to deciduous forests and coniferous forests. Low predatory bears selected habitats closer to open areas and old clear cuts during reindeer calving.
Both predation groups selected habitats closer to wetlands, deciduous forests, coniferous forests and old clear cuts during the moose calving period and avoided habitats close to open areas and mixed forests. No significant difference in selection of areas close to wetlands and deciduous forests was found between the two predatory groups; however, low predatory bears showed stronger selection for habitats closer to coniferous forests and old clear cuts. In addition, low predatory bears exhibited stronger avoidance of habitats close to open areas during the moose calving period. High predatory bears selected habitats closer to coniferous lichen forests. Conversely, low predatory bears selected habitats closer to coniferous moss forests and young forests during the moose calving period.
During the post-calving (hyperphagia) period both high and low predatory bears selected habitats close to deciduous forests, coniferous forests, and old clear cuts while avoiding habitats close to open areas, coniferous moss forests and young forests. The section of habitats close to deciduous forests and coniferous forests was not significantly different between the two predatory groups, yet the selection of habitats closer to old clear cuts was stronger for high predatory bears. Avoidance of habitats close to open areas and young forests was stronger for low predatory bears, whereas avoidance of habitats close to coniferous moss forests was stronger by high predatory bears. High predatory bears selected areas closer to wetlands throughout this period, where low predatory bears selected habitats close to coniferous lichen forests and mixed forests.

4. Discussion

Bear habitat selection varied throughout the different periods of their annual active season and between low and high predatory bears (Supplementary materials; Figure S1). Differentiating habitat selection by high and low predatory bears pointed out subtle, seasonal differences. These findings highlight those differences among individuals’ predatory behaviour and are reflected on the selection of different habitat types by high and low predatory bears. Therefore, our results show with empirical data that different levels of specialisation in foraging behaviour helps to explain individual variation in bear habitat selection, as suggested in earlier studies [28].

4.1. Changes in Habitat Selection during Predatory Periods

When the reindeer calving season started, brown bears changed their early spring preference for habitats closer to wetlands, open areas far from human disturbance, and coniferous forests, and selected habitats closer to more rugged terrain and areas further from gravel roads, but closer to public roads with regular traffic. This change corresponds with the selection of habitats closer to higher elevations and more rugged terrain by reindeer with young [44], i.e., bears adapted their habitat selection to overlap with their seasonally available prey.
After the reindeer calving period, the moose calving season started and further changes in bear habitat selection occurred, with an avoidance of habitats closer to open areas, selection for areas closer to deciduous forests, old clear cuts, and areas further from public roads with regular traffic. In contrast to reindeer, moose are not domesticated and therefore have fewer barriers to dispersal, although they will actively avoid areas of human disturbance [53]. In this season, bears also avoided areas close to human disturbance and selected habitats closer to deciduous forests, which are also preferred by moose [45], despite deciduous forests only representing 3.92% of the study area. In the post-calving period, habitat selection of bears further from gravel roads likely reflects human avoidance, as documented in several earlier studies for the Scandinavian bear population (e.g., Ordiz et al. [30,54]), in a season when bears rely on berries and several recreational human activities are more common than in spring.

4.2. Differences in Habitat Selection between Low and High Predatory Bears

Interestingly, high and low predatory bears selected habitats differently in all study periods with few habitats selected or avoided by both groups. Reindeer prefer habitats associated to higher elevations, open forest stands and recent clear cuts [9,44,55]. During the reindeer calving period, bears generally selected higher terrain ruggedness, with high predatory bears selecting more for forested areas, as reindeer, than low predatory bears, who selected more open areas. During this period, low and high predatory bears showed differing selection for four landcover types, additionally low predatory bears showed stronger selection and avoidance for three of the landcover types of which selection and avoidance was the same between the two groups.
Female moose select for coniferous and peatland forest stands that provide both food and cover and avoid open terrain during the calving season [45,56,57]. Both high and low predatory bears also selected habitats closer to wetlands, deciduous forests, coniferous forests, and old clear cuts during the moose calving period and avoided habitats closer to open areas, therefore mirroring to a large extent the habitat types selected by moose. Furthermore, the selection of habitats closer to wetlands and deciduous forest was not significantly different for high and low predatory bears, highlighting that the selection of habitats closer to these landcover types during the moose calving period is not determined by level of predatory behaviour. Similar to the reindeer calving period, low predatory bears highlighted stronger selection and avoidance compared to high predatory bears for habitats close to open areas (stronger avoidance), coniferous forests (stronger selection), and old clear cuts (stronger selection).
Throughout the two calving periods (reindeer calving and moose calving) high predatory bears did not show stronger selection or avoidance of habitats close to the land cover types examined, however stronger selection and avoidance was exhibited by high predatory bears during the pre- and post-calving periods. Low predatory bears showed stronger selection during both calving periods (three land cover types) and during the pre-calving (one land cover type) and post-calving periods (two land cover types).
Individual variation in reindeer habitat selection has been highlighted by previous studies, whereby reindeer have selected those habitats in which they perceive a smaller risk to depredation [12] and where foraging opportunities are optimised [58,59]. It is possible that the high predatory bears within this study showed less pronounced selection of specific habitat types in order to become generalists, selecting habitats favoured by a wider range of reindeer. On the other hand, low predatory bears have highlighted stronger selection and avoidance, actively choosing specific habitat types during the calving periods, thereby highlighting specialist behaviour.

4.3. Consequences for Conservation and Management of Large Carnivores

Female reindeer show risk-reducing behaviour and a high fidelity to calving sites in consecutive years [12], a predictable behaviour that may be learnt by predatory bears. The same strategy is likely useful for bears to track and eventually prey upon moose calves. Altogether, it seems clear that individual differences in bear predatory behaviour drive observed differences in their habitat selection. In addition to prey availability, other factors have been noted to influence the habitat selection of large carnivores, including human disturbance [5] and intra-species interactions [34], of which have not been examined within this study.
From a management perspective, reduction of bear density in calving areas was considered the most efficient way to reduce depredation rates on reindeer [60]. Besides, it was also suggested that a zoning system prioritising carnivore conservation and reindeer herding in different areas might also help reduce conflict [61]. Furthermore, a varying number of bears are annually culled in response to depredation on reindeer and their calves. The present study reveals the habitat types that are seasonally favoured by both prey and predators. This knowledge may help in developing forecasts of potential hotspots of conflict and thus establish preventive actions (i.e., avoidance of specific landcover types and increased vigilance of the herder during calving seasons) to reduce depredation on reindeer.

Supplementary Materials

The following are available online at https://0-www-mdpi-com.brum.beds.ac.uk/article/10.3390/d13120678/s1: Table S1. Maximum distance (km) to public roads with regular traffic and gravel roads during each calving period; Table S2. Number of GPS location points per bear for each month between April and July during 2010, 2011, and 2012; Table S3. Coefficients of selection for the distance to land cover classes obtained from GLMM modelling of brown bears locations in northern Sweden during pre-calving, reindeer calving, moose calving, and post-calving periods; Table S4. Coefficients of selection for the distance to land cover classes obtained from GLMM modelling of brown bears locations in northern Sweden in relation to their predatory behaviour during pre-calving, reindeer calving, moose calving, and post-calving periods; Figure S1. Predictive models for the habitat selection of brown bears in northern Sweden in relation to their predatory behaviour during (a) pre-calving, (b) reindeer calving, (c) moose calving, and (d) hyperphagia (post-calving) periods.

Author Contributions

Conceptualization, A.O., A.U., K.T. and O.-G.S.; methodology, A.O., A.U., K.T. and O.-G.S.; data collection, O.-G.S., P.S., G.-R.R., J.F. and A.O.; formal analysis, A.U. and K.T.; writing—original draft preparation, K.T., A.U. and A.O.; writing—review and editing, K.T., A.U., A.O., O.-G.S. and J.K.; supervision, A.U. and A.O.; project administration, O.-G.S., J.K. and K.T.; funding acquisition, O.-G.S., J.K. and J.F. All authors have read and agreed to the published version of the manuscript.

Funding

This research received no external funding. The data used in this study were collected as part of former research projects funded by the Swedish Ministry of Rural affairs, including the governmental assignments Jo2007/813, L2011/1478 and L2012/2817.

Institutional Review Board Statement

The study was approved by the Swedish Board of Agriculture, Uppsala Ethical Committee on Animal Experiments, and the Swedish Environmental Protection Agency. All use of animals in this study was approved by the Swedish Ethical Committee on Animal Research with project identification codes C7/12 approved 30 March 2012 and C47/9 approved 27 March 2009.

Informed Consent Statement

Not applicable.

Data Availability Statement

Data included in this paper is potentially available upon request to the authors.

Acknowledgments

We acknowledge the involvement of the reindeer herding communities (the Purnu Siida in Gällivare skogs herding community and the Udtja Siida in the Udtja herding community) that participated in our study and several field workers in the Scandinavian brown bear research project. We also acknowledge and thank the anonymous reviewers for their help in aiding us to improve the article.

Conflicts of Interest

The authors declare no conflict of interest.

References

  1. Bruskotter, J.T.; Shelby, L.B. Human dimensions of large carnivore conservation and management: Introduction to the special issue. Hum. Dimens. Wildl. 2010, 15, 311–314. [Google Scholar] [CrossRef]
  2. Chapron, G.; Kaczensky, P.; Linnell, J.D.; Von Arx, M.; Huber, D.; Andren, H.; Boitani, L. Recovery of large carnivores in Europe’s modern human-dominated landscapes. Science 2014, 346, 1517–1519. [Google Scholar] [CrossRef] [PubMed] [Green Version]
  3. Ripple, W.J.; Estes, J.A.; Beschta, R.L.; Wilmers, C.C.; Ritchie, E.G.; Hebblewhite, M.; Wirsing, A.J. Status and ecological effects of the world’s largest carnivores. Science 2014, 343, 1241484. [Google Scholar] [CrossRef] [PubMed] [Green Version]
  4. Distefano, E. Human-Wildlife Conflict Worldwide: Collection of Case Studies, Analysis of Management Strategies and Good Practices; FAO Corporate Document Repository; Food and Agricultural Organization of the United Nations (FAO), Sustainable Agriculture and Rural Development Initiative (SARDI): Rome, Italy, 2005; Available online: https://www.fao.org/publications/card/en/c/e21b6162-b3ad-4661-8c52-710f95ebeaf7 (accessed on 14 December 2021).
  5. May, R.; Van Dijk, J.; Wabakken, P.; Swenson, J.E.; Linnell, J.D.; Zimmermann, B.; Landa, A. Habitat differentiation within the large-carnivore community of Norway’s multiple-use landscapes. J. Appl. Ecol. 2008, 45, 1382–1391. [Google Scholar] [CrossRef] [Green Version]
  6. Inga, B. Reindeer (Rangifer tarandus tarandus) feeding on lichens and mushrooms: Traditional ecological knowledge among reindeer-herding Sami in northern Sweden. Rangifer 2009, 27, 93–106. [Google Scholar] [CrossRef] [Green Version]
  7. Furberg, M.; Evengård, B.; Nilsson, M. Facing the limit of resilience: Perceptions of climate change among reindeer herding Sami in Sweden. Glob. Health Action 2011, 4, 8417. [Google Scholar] [CrossRef] [Green Version]
  8. Tveraa, T.; Stien, A.; Brøseth, H.; Yoccoz, N.G. The role of predation and food limitation on claims for compensation, reindeer demography and population dynamics. J. Appl. Ecol. 2014, 51, 1264–1272. [Google Scholar] [CrossRef] [Green Version]
  9. Sivertsen, T.R.; Åhman, B.; Steyaert, S.M.; Rönnegård, L.; Frank, J.; Segerström, P.; Skarin, A. Reindeer habitat selection under the risk of brown bear predation during calving season. Ecosphere 2016, 7, e01583. [Google Scholar] [CrossRef]
  10. Hobbs, N.T.; Andren, H.; Persson, J.; Aronsson, M.; Chapron, G. Native predators reduce harvest of reindeer by Sami pastoralists. Ecol. Appl. 2012, 22, 1640–1654. [Google Scholar] [CrossRef] [Green Version]
  11. Ordiz, A.; Milleret, C.; Kindberg, J.; Månsson, J.; Wabakken, P.; Swenson, J.E.; Sand, H. Wolves, people, and brown bears influence the expansion of the recolonizing wolf population in Scandinavia. Ecosphere 2015, 6, 1–14. [Google Scholar] [CrossRef] [Green Version]
  12. Rivrud, I.M.; Sivertsen, T.R.; Mysterud, A.; Åhman, B.; Støen, O.; Skarin, A. Reindeer green-wave surfing constrained by predators. Ecosphere 2018, 9, e02210. [Google Scholar] [CrossRef]
  13. Schwerdtner, K.; Gruber, B. A conceptual framework for damage compensation schemes. Biol. Conserv. 2007, 134, 354–360. [Google Scholar] [CrossRef]
  14. Rauset, G.R.; Kindberg, J.; Swenson, J.E. Modeling female brown bear kill rates on moose calves using global positioning satellite data. J. Wildl. Manag. 2012, 76, 1597–1606. [Google Scholar] [CrossRef]
  15. Dahle, B.; Wallin, K.; Cederlund, G.; Persson, I.; Selvaag, L.S.; Swenson, J.E. Predation on adult moose Alces alces by European brown bears Ursus arctos. Wildl. Biol. 2013, 19, 165–169. [Google Scholar] [CrossRef]
  16. Swenson, J.E.; Sandegren, F.; So-Derberg, A. Geographic expansion of an increasing brown bear population: Evidence for presaturation dispersal. J. Anim. Ecol. 1998, 67, 819–826. [Google Scholar] [CrossRef]
  17. Singh, N.J.; Börger, L.; Dettki, H.; Bunnefeld, N.; Ericsson, G. From migration to nomadism: Movement variability in a northern ungulate across its latitudinal range. Ecol. Appl. 2012, 22, 2007–2020. [Google Scholar] [CrossRef] [PubMed]
  18. Swenson, J.E.; Dahle, B.; Busk, H.; Opseth, O.; Johansen, T.; Söderberg, A.; Cederlund, G. Predation on moose calves by European brown bears. J. Wildl. Manag. 2007, 71, 1993–1997. [Google Scholar] [CrossRef]
  19. Tallian, A.; Ordiz, A.; Metz, M.C.; Milleret, C.; Wikenros, C.; Smith, D.W.; Stahler, D.R.; Kindberg, J.; Macnulty, D.R.; Wabakken, P.; et al. Competition between apex predators? Brown bears decrease wolf kill rate on two continents. Proc. R. Soc. B Biol. Sci. 2017, 284, 20162368. [Google Scholar] [CrossRef] [PubMed]
  20. Tallian, A.; Ordiz, A.; Zimmermann, B.; Sand, H.; Wikenros, C.; Wabakken, P.; Bergqvist, G.; Kindberg, J. The return of large carnivores: Using hunter observation data to understand the role of predators on ungulate populations. Glob. Ecol. Conserv. 2021, 27, e01587. [Google Scholar] [CrossRef]
  21. Ordiz, A.; Milleret, C.; Uzal, A.; Zimmermann, B.; Wabakken, P.; Wikenros, C.; Sand, H.; Swenson, J.E.; Kindberg, J. Individual Variation in Predatory Behavior, Scavenging and Seasonal Prey Availability as Potential Drivers of Coexistence between Wolves and Bears. Diversity 2020, 12, 356. [Google Scholar] [CrossRef]
  22. Gervasi, V.; Nilsen, E.B.; Sand, H.; Panzacchi, M.; Rauset, G.R.; Pedersen, H.C.; Linnell, J.D. Predicting the potential demographic impact of predators on their prey: A comparative analysis of two carnivore–ungulate systems in Scandinavia. J. Anim. Ecol. 2012, 81, 443–454. [Google Scholar] [CrossRef] [PubMed] [Green Version]
  23. Rauset, G.R.; Andrén, H.; Swenson, J.E.; Samelius, G.; Segerström, P.; Zedrosser, A.; Persson, J. National parks in northern Sweden as refuges for illegal killing of large carnivores. Conserv. Lett. 2016, 9, 334–341. [Google Scholar] [CrossRef] [Green Version]
  24. Andrén, H.; Linnell, J.D.; Liberg, O.; Andersen, R.; Danell, A.; Karlsson, J.; Segerström, P. Survival rates and causes of mortality in Eurasian lynx (Lynx lynx) in multi-use landscapes. Biol. Conserv. 2006, 131, 23–32. [Google Scholar] [CrossRef]
  25. Persson, J.; Ericsson, G.; Segerström, P. Human caused mortality in the endangered Scandinavian wolverine population. Biol. Conserv. 2009, 142, 325–331. [Google Scholar] [CrossRef]
  26. Leclerc, M.; Vander, E.; Zedrosser, A.; Swenson, J.E.; Kindberg, J.; Pelletier, F. Quantifying consistent individual differences in habitat selection. Oecologia 2016, 180, 697–705. [Google Scholar] [CrossRef] [Green Version]
  27. Toscano, B.J.; Gownaris, N.J.; Heerhartz, S.M. Personality, foraging behavior and specialization: Integrating behavioral and food web ecology at the individual level. Oecologia 2016, 182, 55–69. [Google Scholar] [CrossRef] [PubMed]
  28. Milleret, C.; Ordiz, A.; Chapron, G.; Andreassen, H.P.; Kindberg, J.; Månsson, J.; Tallian, A.; Wabakken, P.; Wikenros, C.; Zimmermann, B.; et al. Habitat segregation between brown bears and gray wolves in a human-dominated landscape. Ecol. Evol. 2018, 8, 11450–11466. [Google Scholar] [CrossRef] [PubMed]
  29. Stenset, N.E.; Lutnæs, P.N.; Bjarnadóttir, V.; Dahle, B.; Fossum, K.H.; Jigsved, P.; Swenson, J.E. Seasonal and annual variation in the diet of brown bears Ursus arctos in the boreal forest of southcentral Sweden. Wildl. Biol. 2016, 22, 107–117. [Google Scholar] [CrossRef] [Green Version]
  30. Ordiz, A.; Kindberg, J.; Sæbø, S.; Swenson, J.E.; Støen, O.G. Brown bear circadian behavior reveals human environmental encroachment. Biol. Conserv. 2014, 173, 1–9. [Google Scholar] [CrossRef]
  31. Kindberg, J.; Swenson, J.E.; Ericsson, G.; Bellemain, E.; Miquel, C.; Taberlet, P. Estimating population size and trends of the Swedish brown bear Ursus arctos population. Wildl. Biol. 2011, 17, 114–123. [Google Scholar] [CrossRef] [Green Version]
  32. Lavsund, S.; Nygrén, T.; Solberg, E.J. Status of moose populations and challenges to moose management in Fennoscandia. Alces 2003, 39, 109–130. [Google Scholar]
  33. Evans, A.L.; Sahlén, V.; Støen, O.; Fahlman, Å.; Brunberg, S.; Madslien, K.; Fröbert, O.; Swenson, J.E.; Arnemo, J.M. Capture, anesthesia, and disturbance of free-ranging brown bears (Ursus arctos) during hibernation. PLoS ONE 2012, 7, e40520. [Google Scholar] [CrossRef] [PubMed] [Green Version]
  34. Dahle, B.; Swenson, J.E. Home ranges in adult Scandinavian brown bears (Ursus arctos): Effect of mass, sex, reproductive category, population density and habitat type. J. Zool. 2003, 260, 329–335. [Google Scholar] [CrossRef]
  35. Ordiz, A.; Støen, O.; Sæbø, S.; Sahlén, V.; Pedersen, B.E.; Kindberg, J.; Swenson, J.E. Lasting behavioural responses of brown bears to experimental encounters with humans. J. Appl. Ecol. 2013, 50, 306–314. [Google Scholar] [CrossRef]
  36. Hertel, A.G.; Steyaert, S.M.; Zedrosser, A.; Mysterud, A.; Lodberg-Holm, H.K.; Swenson, J.E. Bears and berries: Species-specific selective foraging on a patchily distributed food resource in a human-altered landscape. Behav. Ecol. Sociobiol. 2016, 70, 831–842. [Google Scholar] [CrossRef] [Green Version]
  37. Frank, J.; Støen, O.G.; Segerström, P.; Stokke, R.; Persson, L.T.; Stokke, L.H.; Persson, S.; Stokke, N.; Persson, A.; Segerström, E.; et al. Björnpredation på ren och potentiella effekter av tre förebyggande åtgärder. 2012, 6. [In Swedish]. Available online: https://pub.epsilon.slu.se/13047/ (accessed on 14 December 2021).
  38. Friebe, A.; Swenson, J.E.; Sandegren, F. Denning chronology of female brown bears in central Sweden. Ursus 2001, 12, 37–45. [Google Scholar]
  39. Arnemo, J.M.; Evans, A. Biomedical Protocols for Free-Ranging Brown Bears, Wolves, Wolverines and Lynx; Hedmark University College Evenstad: Koppang, Norway, 2017. [Google Scholar]
  40. Frank, S.C.; Leclerc, M.; Pelletier, F.; Rosell, F.; Swenson, J.; Bischof, R.; Zedrosser, A. Sociodemographic factors modulate the spatial response of brown bears to vacancies created by hunting. J. Anim. Ecol. 2018, 87, 247–258. [Google Scholar] [CrossRef] [Green Version]
  41. Worton, B.J. Kernel methods for estimating the utilization distribution in home-range studies. Ecology 1989, 70, 164–168. [Google Scholar] [CrossRef]
  42. Martin, J. Habitat selection and movement by brown bears in multiple-use landscapes. Ph.D. Thesis, Norwegian University of Life Sciences, Department of Ecology and Natural Resource Management, Ås, Norway, 2009. [Google Scholar]
  43. Moe, T.; Kindberg, J.; Jansson, I.; Swenson, J. Importance of diel behaviour when studying habitat selection: Examples from female Scandinavian brown bears (Ursus arctos). Can. J. Zool. 2007, 85, 518–525. [Google Scholar] [CrossRef] [Green Version]
  44. Pape, R.; Löffler, J. Ecological dynamics in habitat selection of reindeer: An interplay of spatial scale, time, and individual animal’s choice. Polar Biol. 2015, 38, 1891–1903. [Google Scholar] [CrossRef]
  45. Bjørneraas, K.; Solberg, E.J.; Herfindal, I.; Moorter, B.V.; Rolandsen, C.M.; Tremblay, J.; Astrup, R. Moose Alces alces habitat use at multiple temporal scales in a human-altered landscape. Wildl. Biol. 2011, 17, 44–54. [Google Scholar] [CrossRef] [Green Version]
  46. Sappington, J.M.; Longshore, K.M.; Thompson, D.B. Quantifying landscape ruggedness for animal habitat analysis: A case study using bighorn sheep in the Mojave Desert. J. Wildl. Manag. 2007, 71, 1419–1426. [Google Scholar] [CrossRef]
  47. Environmental Systems Resource Institute. ArcMap 10.3.1; Environmental Systems Research Institute: Redlands, CA, USA, 2015. [Google Scholar]
  48. Zuur, A.F.; Hilbe, J.M.; Ieno, E.N. A Beginner’s Guide to GLM and GLMM with R: A Frequentist and Bayesian Perspective for Ecologists; Highland Statistics Limited: Newburgh, UK, 2013. [Google Scholar]
  49. Milleret, C. Is moose (Alces alces) habitat selection affected by wolf (Canis lupus) re-establishment in south-central Sweden. Ph.D. Thesis, Université Claude Bernard, Villeurbanne, France, 2012. [Google Scholar]
  50. R Core Team. R: A Language and Environment for Statistical Computing; R Foundation for Statistical Computing: Vienna, Austria, 2018. [Google Scholar]
  51. Calenge, C. The package “adehabitat” for the R software: A tool for the analysis of space and habitat use by animals. Ecol. Model. 2006, 197, 516–519. [Google Scholar] [CrossRef]
  52. Bates, D.; Maechler, M.; Bolker, B.; Walker, S. Fitting Linear Mixed-Effects Models Using lme4. J. Stat. Softw. 2015, 67, 1–48. [Google Scholar] [CrossRef]
  53. Herfindal, I.; Tremblay, J.P.; Hansen, B.B.; Solberg, E.J.; Heim, M.; Sæther, B.E. Scale dependency and functional response in moose habitat selection. Ecography 2009, 32, 849–859. [Google Scholar] [CrossRef]
  54. Ordiz, A.; Støen, O.G.; Delibes, M.; Swenson, J.E. Staying cool or staying safe in a human-dominated landscape: Which is more relevant for brown bears? Oecologia 2017, 185, 191–194. [Google Scholar] [CrossRef] [Green Version]
  55. Sahlén, E.S. Indirect Effects of Predation in Human-Modified Landscapes. Ph.D. Thesis, Swedish University of Agricultural Sciences, Faculty of Forest Sciences, Department of Wildlife, Fish and Environmental Studies, Umeå, Sweden, 2016. [Google Scholar]
  56. Dussault, C.; Ouellet, J.; Courtois, R.; Huot, J.; Breton, L.; Jolicoeur, H. Linking moose habitat selection to limiting factors. Ecography 2005, 28, 619–628. [Google Scholar] [CrossRef]
  57. Melin, M.; Matala, J.; Pusenius, J.; Packalen, T. Calving and post-calving habitat use of female moose in two contrasting landscapes. Wildl. Biol. 2019, 2019, 1–12. [Google Scholar] [CrossRef] [Green Version]
  58. Iversen, M.; Fauchald, P.; Langeland, K.; Ims, R.A.; Yoccoz, N.G.; Bråthen, K.A. Phenology and cover of plant growth forms predict herbivore habitat selection in a high latitude ecosystem. PLoS ONE 2014, 9, e100780. [Google Scholar]
  59. Mårell, A.; Edenius, L. Spatial heterogeneity and hierarchical feeding habitat selection by reindeer. Arct. Antarct. Alp. Res. 2006, 38, 413–420. [Google Scholar] [CrossRef]
  60. Frank, J.; Eklund, A. Poor construction, not time, takes its toll on subsidised fences designed to deter large carnivores. PLoS ONE 2017, 12, e0175211. [Google Scholar] [CrossRef] [PubMed]
  61. Ordiz, A.; Sæbø, S.; Kindberg, J.; Swenson, J.E.; Støen, O.-G. Seasonality and human disturbance alter brown bear activity patterns; implications for circumpolar carnivore conservation? Anim. Conserv. 2017, 20, 51–60. [Google Scholar] [CrossRef]
Figure 1. Land cover classes map of Norway and Sweden, with the study area highlighted.
Diversity 13 00678 g001
Figure 2. Bear home ranges during: (a) pre-calving, (b) reindeer calving, (c) moose calving, and (d) post calving. The bears were captured annually after leaving their dens in April/May, which accounts for the increase in number of bears studied after the pre-calving period.
Diversity 13 00678 g002
Table 1. Variables explored during the modelling process of brown bear habitat selection in Northern Sweden.
VariableDescriptionArea (and Percentage Area) of Variable within ‘Study Area’Source
Coniferous ForestMinimum Euclidian distance to conifer forests (m) (mixed ground flora and understory)12,258 km2 (30.49%)Geographical Data Sweden [9]
Coniferous Lichen ForestMinimum Euclidian distance to conifer lichen forests (m) (ground flora dominated by lichens)4470 km2 (11.12%)Geographical Data Sweden [9]
Coniferous Moss ForestMinimum Euclidian distance to conifer moss forests (m) (ground flora dominated by mosses, includes coniferous forests on bog)850 km2 (2.11%)Geographical Data Sweden [9]
Deciduous ForestMinimum Euclidian distance to deciduous forests (m)1574 km2 (3.92%)Geographical Data Sweden [9]
Mixed ForestMinimum Euclidian distance to mixed forests (m)2871 km2 (7.14%)Geographical Data Sweden [9]
Open AreaMinimum Euclidian distance to open areas, including mountainous areas, bare ground, grasslands, etc. (m)1389 km2 (3.45%)Geographical Data Sweden [9]
WaterMinimum Euclidian distance to water bodies, including lakes and rivers (m)3197 km2 (7.95%)Geographical Data Sweden [9]
WetlandMinimum Euclidian distance to wetlands, including peatlands and bogs (m)7177 km2 (17.85%)Geographical Data Sweden [9]
Terrain Ruggedness Index Score (TRI)A variable calculated as the total length (m) of the linear development of level curves within a 1.56 ha.N/AGeographical Data Sweden [9]
Old Clear CutsMinimum Euclidian distance to clear cuts that are between 6–12 years old or <2 m in the year 2000 (m) (derived from 1:10,000 satellite images, taken from 2000 to 2012)41 km2 (0.10%)Utförd avverkning, Swedish Forest Agency 2015 [9]
Recent Clear CutsMinimum Euclidian distance to clear cuts that are between 0 and 5 years old in the year 2015.2610 km2 (6.49%)Utförd avverkning, Swedish Forest Agency 2015 [9]
Young ForestMinimum Euclidian distance to previous clear cuts that are 2–5 m in the year 2000 (m)3767 km2 (9.37%)Utförd avverkning, Swedish Forest Agency 2015 [9]
Public Roads with Regular TrafficMinimum Euclidian distance to public roads with regular traffic (m)N/A1:100,000 Vägkartan, Geographical Data Sweden, National Land Survey Sweden, [9]
Gravel RoadsMinimum Euclidian distance to gravel roads (m)N/A1:100,000 Vägkartan, Geographical Data Sweden, National Land Survey Sweden, [9]
Table 2. Level of predatory behaviour exhibited by each bear surveyed during the active period, combined for reindeer (R) (880 clusters visited) and moose calves (M) (267 clusters visited). Individuals in grey showed high predatory behaviour.
Bear IDSexAgeTotal Kills per Period 2011Total Kills per Period 2012Average Kills per Day, during Calving
Pre-Calving
(Early Spring)
Reindeer Calving
(May)
Moose Calving
(June)
Post-Calving
(July–September)
Pre-Calving
(Early Spring)
Reindeer Calving
(May)
Moose Calving
(June)
Post-Calving
(July–September)
1Maleunknown 13
(10R/3M)
4
(4M)
0.48
2Male71
(1M)
11
(7R/4M)
8
(8M)
1
(1M)
0.30
3Female31
(1M)
26
(23R/3M)
6
(1R/5M)
1
(1R)
5
(4R/1M)
2
(2R)
0.35
4Female132
(2R)
38
(35R/3M)
18
(1R/17M)
2
(2M)
5
(2R/3M)
0.62
5Female11 37
(37R)
2
(2M)
1.39
6Femaleunknown 2
(1R/1M)
11
(11M)
0.31
7Male3 29
(26R/3M)
6
(6M)
1
(1M)
24
(24R)
2
(2R)
0.87
8Male10 14
(14R)
1
(1M)
0.54
9Female5 1
(1R)
0
10Female3 15
(15R)
8
(5R/3M)
14
(14R)
3
(3M)
0.44
11Male10 3
(3R)
0.21
12Male6 7
(6R/1M)
1
(1M)
0.38
13Male14 4
(3R/1M)
1
(1M)
1
(1M)
0.21
14Female8 4
(2R/2M)
6
(6M)
1
(1R)
38
(36R/2M)
3
(3M)
0.52
15Female8 13
(11R/2M)
5
(4R/1M)
0.43
Table 3. Habitat selection of all bears during pre-calving, reindeer calving, moose calving and post-calving (hyperphagia). Red indicates avoidance, blue indicates selection, and grey indicates no significant selection or avoidance (Full details of coefficient values are provided in Supplementary materials; Table S3).
Period
Pre-Calving
(Early Spring)
Reindeer Calving
(May)
Moose Calving
(June)
Post-Calving (Hyperphagia)
(July to September)
Water
Wetlands
Open Areas
Deciduous Forest
Coniferous Forest
Coniferous Lichen Forests
Coniferous Moss Forests
Mixed Forests
Old Clear Cuts
Young Forests
Public Roads with Regular Traffic
Gravel Roads
Terrain Ruggedness Index
Table 4. Habitat Selection of high and low predatory bears during pre-calving, reindeer predation, moose predation and hyperphagia. Red and (+) indicates selection, blue and (-) indicates avoidance, (++) indicates that bears with this predatory behaviour show significantly stronger selection, (--) indicates that bears with this predatory behaviour show significantly stronger avoidance, ns(−) or ns(+) indicates that there is no significant difference in the level of selection or avoidance by bears with different predatory behaviour, with an overall selection (+) or avoidance (-) and ns indicates lack of significant selection or avoidance (Full details of coefficient values are provided in Supplementary materials; Table S4).
Period
Pre-Calving
(Early Spring)
Reindeer Calving
(May)
Moose Calving
(June)
Post-Calving
(July to September)
InteractionHigh PredatoryLow PredatoryHigh PredatoryLow PredatoryHigh PredatoryLow PredatoryHigh PredatoryLow Predatory
Wetlands × behaviour+-+++ns(+)+-
Open Areas × behaviour+++-+------
Deciduous Forest × behaviour+-+-ns(+)ns(+)
Coniferous Forest × behaviour++++-+++ns(+)
Coniferous Lichen Forests × behaviour---ns(−)+--+
Coniferous Moss Forests × behaviour-+ns(−)-+---
Mixed Forests × behaviour-+------+
Old Clear Cuts × behaviour----+++++++
Young Forests × behaviour+-----+---
Publisher’s Note: MDPI stays neutral with regard to jurisdictional claims in published maps and institutional affiliations.

